D Daniel Tier One Universities Report - Texas
33
1 Thoughts on Creating More Tier One Universities in Texas David E. Daniel May 28, 2008 Introduction There has long been discussion about how Texas might create more top-quality, world- class academic research universities to complement the three existing ones – Rice, Texas A&M, and UT Austin. Texas needs to strengthen its two existing flagship public universities to make them more competitive with the nation’s best institutions. It also needs to improve the quality and excellence of all its institutions of higher education, which have unique missions that are very important to the state. And it needs more top-tier universities. Currently, Texas loses more than 10,000 high school graduates per year who leave the state to attend doctoral granting universities in other states, while attracting only about 4,000 students from other states to attend doctoral granting universities in Texas. This brain drain represents a significant loss of critical young talent for Texas. For perspective, one may note that 10,000 students per year is 40% larger than the size of the freshman class at UT Austin that exits the state each year to go to college in other states – and the net loss is increasing about 10% each year. Texas also receives $3.7 billion per year less than its fair share (based on population proportion to the U.S.) of Federal R&D dollars and venture capital investment. Limited investment in Texas’ flagship universities, and lack of more Tier One universities, among other factors, is costing Texas every day in terms of human capital as well as real investment capital. One reason that progress has been slow in creating more Tier One universities is the difficulty of selecting which universities to advance. The approach suggested herein for advancing institutions to top-tier status involves incentive funding, which would partner the state with local communities, private donors, and university leaders to reward: (1) community support and private gifts that are essential to producing a Tier One institution, and (2) institutional success in producing a “Tier One profile” for research. The suggested approach gives all the potential Tier One schools the opportunity to succeed and rewards those that achieve the highest degree of success. The approach would require that the universities and their host communities earn the state support needed to become Tier One, without a divisive process in determining who becomes a Tier One university . What Are Tier One Universities? There is no universally accepted definition for a Tier One university, but three definitions might be considered: 1. Membership in the Association of American Universities (AAU ), which is “the club” of the nation’s 60 best research universities. Texas has 3 AAU institutions – Rice, Texas A&M, and UT Austin. California has nine – Caltech, Stanford, UC Berkeley, UC Davis, UC Irvine, UCLA, UC San Diego, UC Santa Barbara, and USC. New York has seven.
Transcript of D Daniel Tier One Universities Report - Texas

1
Thoughts on Creating More Tier One Universities in Texas
David E. Daniel May 28, 2008
Introduction There has long been discussion about how Texas might create more top-quality, world-class academic research universities to complement the three existing ones – Rice, Texas A&M, and UT Austin. Texas needs to strengthen its two existing flagship public universities to make them more competitive with the nation’s best institutions. It also needs to improve the quality and excellence of all its institutions of higher education, which have unique missions that are very important to the state. And it needs more top-tier universities.
Currently, Texas loses more than 10,000 high school graduates per year who leave the state to attend doctoral granting universities in other states, while attracting only about 4,000 students from other states to attend doctoral granting universities in Texas. This brain drain represents a significant loss of critical young talent for Texas. For perspective, one may note that 10,000 students per year is 40% larger than the size of the freshman class at UT Austin that exits the state each year to go to college in other states – and the net loss is increasing about 10% each year. Texas also receives $3.7 billion per year less than its fair share (based on population proportion to the U.S.) of Federal R&D dollars and venture capital investment. Limited investment in Texas’ flagship universities, and lack of more Tier One universities, among other factors, is costing Texas every day in terms of human capital as well as real investment capital.
One reason that progress has been slow in creating more Tier One universities is the difficulty of selecting which universities to advance. The approach suggested herein for advancing institutions to top-tier status involves incentive funding, which would partner the state with local communities, private donors, and university leaders to reward: (1) community support and private gifts that are essential to producing a Tier One institution, and (2) institutional success in producing a “Tier One profile” for research. The suggested approach gives all the potential Tier One schools the opportunity to succeed and rewards those that achieve the highest degree of success. The approach would require that the universities and their host communities earn the state support needed to become Tier One, without a divisive process in determining who becomes a Tier One university. What Are Tier One Universities? There is no universally accepted definition for a Tier One university, but three definitions might be considered:
1. Membership in the Association of American Universities (AAU), which is “the club” of the nation’s 60 best research universities. Texas has 3 AAU institutions – Rice, Texas A&M, and UT Austin. California has nine – Caltech, Stanford, UC Berkeley, UC Davis, UC Irvine, UCLA, UC San Diego, UC Santa Barbara, and USC. New York has seven.
2
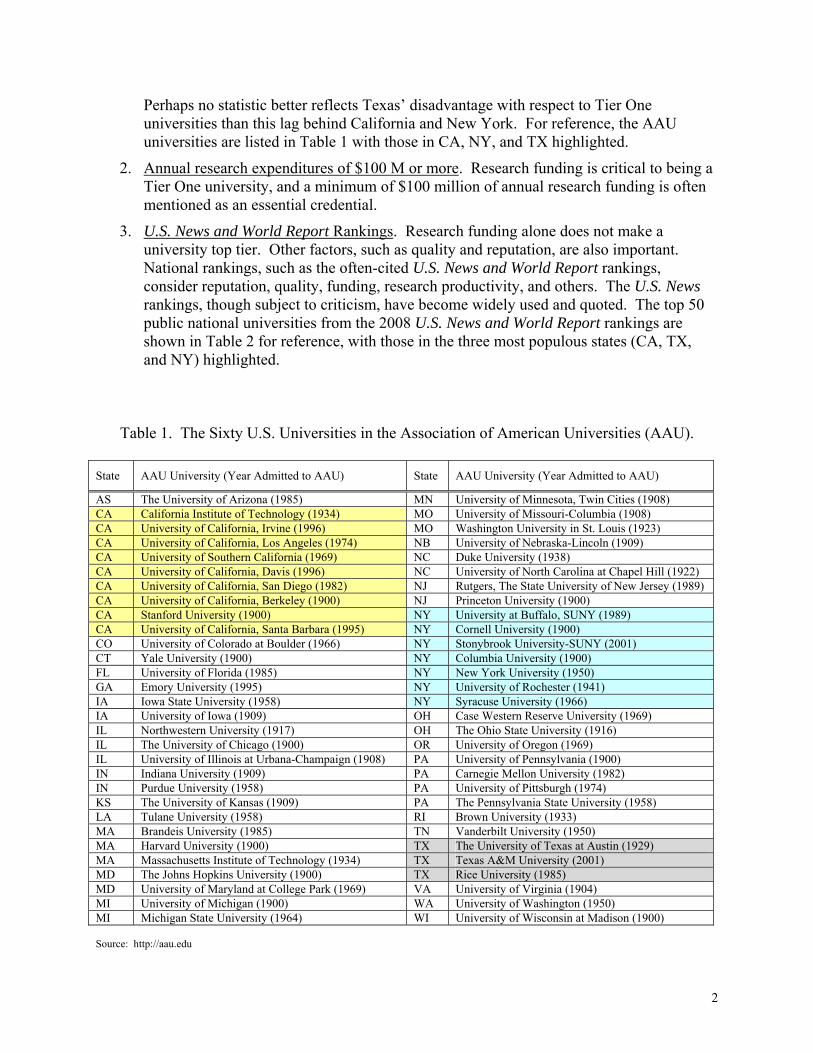
Perhaps no statistic better reflects Texas’ disadvantage with respect to Tier One universities than this lag behind California and New York. For reference, the AAU universities are listed in Table 1 with those in CA, NY, and TX highlighted.
2. Annual research expenditures of $100 M or more. Research funding is critical to being a Tier One university, and a minimum of $100 million of annual research funding is often mentioned as an essential credential.
3. U.S. News and World Report Rankings. Research funding alone does not make a university top tier. Other factors, such as quality and reputation, are also important. National rankings, such as the often-cited U.S. News and World Report rankings, consider reputation, quality, funding, research productivity, and others. The U.S. News rankings, though subject to criticism, have become widely used and quoted. The top 50 public national universities from the 2008 U.S. News and World Report rankings are shown in Table 2 for reference, with those in the three most populous states (CA, TX, and NY) highlighted.
Table 1. The Sixty U.S. Universities in the Association of American Universities (AAU). State AAU University (Year Admitted to AAU) State AAU University (Year Admitted to AAU)
AS The University of Arizona (1985) MN University of Minnesota, Twin Cities (1908) CA California Institute of Technology (1934) MO University of Missouri-Columbia (1908) CA University of California, Irvine (1996) MO Washington University in St. Louis (1923) CA University of California, Los Angeles (1974) NB University of Nebraska-Lincoln (1909) CA University of Southern California (1969) NC Duke University (1938) CA University of California, Davis (1996) NC University of North Carolina at Chapel Hill (1922) CA University of California, San Diego (1982) NJ Rutgers, The State University of New Jersey (1989) CA University of California, Berkeley (1900) NJ Princeton University (1900) CA Stanford University (1900) NY University at Buffalo, SUNY (1989) CA University of California, Santa Barbara (1995) NY Cornell University (1900) CO University of Colorado at Boulder (1966) NY Stonybrook University-SUNY (2001) CT Yale University (1900) NY Columbia University (1900) FL University of Florida (1985) NY New York University (1950) GA Emory University (1995) NY University of Rochester (1941) IA Iowa State University (1958) NY Syracuse University (1966) IA University of Iowa (1909) OH Case Western Reserve University (1969) IL Northwestern University (1917) OH The Ohio State University (1916) IL The University of Chicago (1900) OR University of Oregon (1969) IL University of Illinois at Urbana-Champaign (1908) PA University of Pennsylvania (1900) IN Indiana University (1909) PA Carnegie Mellon University (1982) IN Purdue University (1958) PA University of Pittsburgh (1974) KS The University of Kansas (1909) PA The Pennsylvania State University (1958) LA Tulane University (1958) RI Brown University (1933) MA Brandeis University (1985) TN Vanderbilt University (1950) MA Harvard University (1900) TX The University of Texas at Austin (1929) MA Massachusetts Institute of Technology (1934) TX Texas A&M University (2001) MD The Johns Hopkins University (1900) TX Rice University (1985) MD University of Maryland at College Park (1969) VA University of Virginia (1904) MI University of Michigan (1900) WA University of Washington (1950) MI Michigan State University (1964) WI University of Wisconsin at Madison (1900) Source: http://aau.edu

3
Table 2. The Top 50 Public National Universities, U.S. News and World Report, 2008.
1. UC – Berkeley 18. U. of Maryland – College Park 35. UC – Santa Cruz 2. U. of Virginia 19. Ohio State U. 35. U. of Colorado – Boulder 3. UC – Los Angeles 20. Rutgers U. 38. SUNY – Binghamton 3. U. of Michigan 20. U. of Georgia 38. NC State U. 5. UNC – Chapel Hill 20. U. of Pittsburgh 38. SUNY Col. Envir. Sci. & For. 6. College of William and Mary 23. Texas A&M U. 38. U. of Kansas 7. Georgia Institute of Technology 24. Purdue U. 42. U. of Alabama 8. UC – San Diego 24. U. of Connecticut 42. U. of Missouri – Columbia 8. U. of Illinois – Urbana-Champaign 24. U. of Iowa 42. U. of Nebraska – Lincoln 8. U of Wisconsin – Madison 27. Clemson U. 45. Auburn U. 11. UC – Davis 27. Miami U. (Ohio) 45. SUNY – Stony Brook 11. U. of Washington 29. Michigan State U. 45. U. of Arizona 13. UC – Irvine 29. U. of Delaware 45. UC – Riverside 13. UC – Santa Barbara 29. U. of Minnesota 45. U. of Massachusetts – Amherst 13. U of Texas - Austin 29. Virginia Tech 45. U. of Tennessee 16. Penn. State U. 33. Colorado School of Mines 45. U. of Vermont 17. U. of Florida 33. Indiana U. Source: U.S. News and World Report, America’s Best Colleges, 2008 rankings, p. 85. Why Are Tier One Universities Important To Texas? Texas is engaged in national and global competition for knowledge, innovation, and competitive advantage. Tier One universities bring together a critical mass of talent that creates special value, such as Stanford has done for Silicon Valley, UT Austin has achieved for Austin, Georgia Tech has accomplished for Atlanta, Harvard and MIT have done for Boston, and Caltech, UCLA, USC, and other institutions have done for Los Angeles. It is no surprise that emerging global cities, such as Seoul, Singapore, and Beijing, place the establishment of world-class research universities near the top of their list of priorities. Other nations seek to repeat the successful formula of research and business innovation demonstrated in the U.S. through its great universities. An example of what a single university can mean to an economy is provided by MIT (Source: “MIT: The Impact of Innovation,” BankBoston, March 1997, available from http://web.mit.edu/newsoffice/founders/). In 1994, Bank Boston estimated that MIT alumni founded more than 4,000 companies that employed 1.1 million people and that had annual gross revenues of $232 B. To put this in perspective, in 2005 the entire DFW Metroplex (which produces one-third of the state’s economic output) had a gross domestic product of $285 B (source: “U.S. Metro Economies,” United States Conference of Mayors, 2006, available online at http://mayors.org/ metroeconomies/0107/GMPreport.pdf), which is approximately equal to the annual revenue from companies started by MIT alumni. In other words, one great, world-class university can have an economic impact approximately equal to one of America’s largest cities.
More than ever, economic progress and social advancement are linked inextricably to education and research. Success in the past does not guarantee success in the future, as can be confirmed in cities like Detroit, which was arguably one of the two or three mightiest cities in the

4
world nearly a century ago. Increasingly, venture capital, creative people, innovation, and new companies are drawn to where the brains are – to cities, regions, and states with great universities. Top-tier universities are engines of incubation, creation, and attraction of talent.
How Is Lack of More Tier One Universities Hurting Texas? Tier One universities attract federal research funds and top talent. By population, Texas, with 23.5 million people, constitutes 8% of the U.S. population and is second only to California, with 36 million people (12% of the U.S. population). (Source: “2007 U.S. Population Data Sheet,” Population Reference Bureau, Washington, DC, www.prb.org.) Texas’ “fair share” of the nation’s resources, based on population proportion, is thus 8%. Federal Research and Development (R&D) Funds
In 2004, the U.S. spent $99.1 B of Federal R&D funds, including $5.0 B (5% of the total) in Texas (source: National Science Foundation,www.nsf.gov/statistics/nsf07323/, Table 82, page 193). If Texas had received just its proportional share based on population (8%), it would have received an additional $2.8 B per year. Texas lost out on $2.8 B in one year alone in attracting its fair share of Federal R&D funding. By contrast, California, with 12% of the U.S. population, 9 AAU universities, and 2 of the top 3 ranked public universities in the U.S. (Table 2), garnered 18.2% of the Federal R&D budget. California attracted $6 B per year of Federal R&D funding above its proportional population share, and $13 B more than Texas. Lack of major R&D infrastructure, which is impacted negatively by lack of more Tier One universities, is costing Texas billions of dollars each year in missed opportunities to attract R&D funding.
Venture Capital Funds
Venture capital investment funds are the seed corn of the future. According to the National Venture Capital Association (source: http:// Source: http://www.nvca.org/pdf/ 35AnniversaryRelease1.pdf):
• One U.S. job was created for every $25,000 of venture capital invested in the U.S.
between 1970 and 2006
• Every $1 of venture capital investment between 1970 and 2006 created $5.60 of U.S. revenues in 2006
• Venture capital accounts for 0.2% of gross domestic product but is responsible for 10% of all U.S. jobs and 18% of all U.S. revenues
• One out of every three Americans has been positively impacted by a venture-backed medical invention
• Examples of venture-backed U.S. companies include: Apple, AOL, eBay, FedEx, Google, Microsoft, Starbucks, and YouTube
In 2007, $30.5 B of venture capital was invested in the U.S. (source: http://www. Pwcmoneytree.com/MTPublic/ns/nav.jsp?page=notice&iden=B). The Texas share of the investment was 5.0%, or $5.53 B. If Texas were to get 8% of U.S. venture capital (its U.S.

5
population proportion), it would receive $0.9 B more venture capital per year, which by these statistics would:
• Add 36,000 jobs (presumably mostly in Texas) • Add to annual revenue by a multiplier up to 5.6 for the $0.9 B investment
In both 2006 and 2007, Austin had more venture capital investment than Dallas-Fort
Worth, Houston, and San Antonio, combined (sources: http://dallasfed.org/research/swe/2007/ swe0701d.cfm for 2006, and analysis of Dow Jones VentureSource data for 2007). One world-class university does make a difference. The largest metropolitan areas of Texas (DFW, Houston, and San Antonio) are missing the opportunity to garner hundreds of millions, if not billions, of dollars each year because they lack more world-class academic research universities.
Human Capital – Top Students Perhaps the most important human resource for Texas’ future is its college-going youth. Unfortunately, Texas is a net exporter of talent to other states. Table 3 summarizes data on intake and loss of college-going students to and from Texas. In Fall 2006, more than 10,000 Texas high school graduates left Texas to attend college in other states, while only 4,348 students were drawn to Texas to attend college at doctoral-granting universities in Texas. This represents a brain drain to other states of 5,815 students per year. And the problem is getting worse. In 2000, Texas suffered a net loss of 3,782 students per year. The loss increased from 2000 to 2006 by 54%, or about 10% increase in the loss rate per year.
Table 3. Data on Inflow and Outflow of College-Going Students to/from Texas in Fall 2006. Cohort of Students
Public
Universities
Private
Universities
Total
Texas high-school graduates who left Texas to attend doctoral-granting universities in other states
5,792
4,371
10,161
Out-of-state high-school graduates who were drawn to Texas to attend doctoral-granting universities in Texas
2,017
2,331
4,348
NET LOSS TO OTHER STATES 3,775 2,040 5,815 Source: U.S. Dept. of Education, IPEDS Educational Report, 2006, first time in college students.
Where did students go? Mainly to neighboring states. The three states with the greatest net loss in 2006 were: Oklahoma (net loss of -1,163 students), Arkansas (-482 students),

6
Louisiana (-462 students). However, two states with large net losses were not neighboring states; Texas lost a net of -397 and -362 students to New York and Massachusetts, respectively. No statistics are available on how many of these students eventually return to Texas, but presumably many do not.
An example of what a university can mean in terms of talent attraction is provided by
Rice University. Rice University reportedly draws about 15% of its freshmen class from Harris County, but 33% of its alumni live in Harris County (source: speech in Dallas by Richard Fisher, Chairman of Dallas Federal Reserve Bank, on Sept. 24, 2007, based on information provided by Malcolm Gillis, former President of Rice). Although Rice University is relatively small, it has had a very large impact on business and leadership in Houston, in part because of the talent that Rice draws to the Houston area.
The causes for the net loss of Texas high school graduates to other states are not known.
Texas’ two flagship public universities (Texas A&M and UT Austin) are at or near capacity, so the solution does not lie there. The best way to address this brain drain would appear to be to strengthen Texas’ doctoral granting universities. Raising some to Tier One status might well be the most effective measure, creating more highly desirable, world-class institutions in Texas to provide attractive alternatives to students who are leaving the state.
The World’s Top Scientists and Engineers In part because of other states’ investment in multiple, high-quality universities, Texas does not have nearly as many top scientists and engineers as some other states. Table 4, produced by Texas Higher Education Coordinating Board Commissioner Dr. Raymund A. Paredes, summarizes membership in the National Academies, which include the National Academy of Sciences (NAS), National Academy of Engineering (NAE), and Institute of Medicine (IOM). Membership in the National Academies, which is by election only, is regarded by many as the nation’s highest honor and distinction in these fields. National Academy membership is widely used in national rankings as a key measure of faculty quality. Table 4 demonstrates that not only does Texas trail California, but one California university, Cal-Berkeley, which is the nation’s top-ranked public university (Table 2), has more National Academy members than all of Texas.
Table 4 summarizes information for academic institutions. However, members of the
National Academies are not just found in academic institutions: many work for industry or hospitals. According to directory information on the NAE, NAS, and IOM websites, there are approximately 5,600 members of the National Academies, 241 of whom live in Texas. Texas has 4.3% of the nation’s National Academy members, or about half its proportional population (8%) share. Texas is underachieving its population share of the U.S. in attracting, growing, and retaining the nation’s very top talent in science, engineering, and medicine. California, on the other hand, is overachieving – it has 1,472 members of the National Academies, or six times more than Texas and 26% of the total in the U.S.

7
Table 4. Membership in the National Academies (Source: Raymund Paredes, Commissioner, Texas Higher Education Coordinating Board)
University
Science
Engineering
Medicine
Total
UT at Austin 10 48 1 59 TAMU/TAMUSHSC 5 18 1 24 Rice U 2 12 1 15 UT Med Cntr-Dallas 17 0 21 38 U of Houston 3 5 0 8 Baylor CO Medicine 4 0 12 16 UTHSC-San Antonio 0 0 3 3 UTHSC Houston 2 0 5 7 UT Med Br-Galveston 0 0 4 4 UT at Dallas 1 3 0 4 Other (SMU, MDA, UNT, UTSA, TTU)
2 3 2 7
State of Texas Total 46 89 50 185
UC-Berkeley 126 71 7 209
Many factors attract the nation’s top minds in science, engineering, and medicine to
different states (top universities, cutting-edge technology companies, well funded research infrastructure, and quality of life issues). However, one may note from Table 2 that California is home to 6 of the nation’s top 15 public universities, while Texas has only one among this elite group. California, it may be postulated, is out-performing other states in attracting top talent in large part because it has created more Tier One universities, and more universities at the very top end of the Tier One group, than any other state.
The situation is not getting better. The results of the 2008 elections for the National
Academy of Engineering (NAE) and the National Academy of Sciences (NAS) were announced earlier this year. Some of the results are summarized in Table 5. Of the 137 people elected to the NAE or NAE, 47 people (or 34% of the total) were from California while just 6 people (4% of the total) were from Texas. Of the 6 Texans elected, all were from academia – one from Rice, three from UT Austin, and one each from UT Dallas and UT Southwestern Medical Center. Clearly, Texas is not competitive with the leading states in attracting and incubating the nation’s very best scientific and engineering talent. Lack of more Tier One research universities in Texas is a major contributor to the problem.

8
Table 5. Summary of 2008 Election Results for National Academy of Engineering (NAE) and National Academy of Sciences (NAS).
State
New NAE Members
New NAS Members
Total
Percent of
Total
California 25 22 47 34 % Massachusetts 11 15 26 19 % New York 3 6 9 7% Texas 2 4 6 4%
TOTAL 65 72 137 100%
Source: Press releases for 2008 election results, from the websites of NAE and NAS.
How Is Lack of More Tier One Universities Hurting Texas Largest Cities? Co-location of world-class universities with leading cities has a multiplying economic impact. The top-ten most economically productive cities in the U.S., and the number of AAU universities in the metropolitan area, are summarized in Table 6, along with information about the amount of research done in the area and the number of college degrees (bachelors and higher) awarded by universities located within the area. Table 6. Selected Statistics for the Ten Most Economically Productive Metropolitan Statistical
Areas in the U.S.
Productivity Rank
City
Number of AAU Univ. in
Area
AAU Universities
Research Expenditures
($B)
College Degrees Awarded (National
Rank) 1 New York City 4 Columbia, NYU, Rutgers, Stony
Brook $1.42 1
2 Los Angeles 4 Caltech, UCLA, UC Irvine, USC $1.09 2 3 Chicago 2 Northwestern, U. Chicago $0.94 3 4 Washington DC 2 Johns Hopkins, U. Maryland $0.64 5 5 Dallas-Fort Worth 0 $0.35 11 6 Philadelphia 1 U. Pennsylvania $0.87 6 7 Houston 1 Rice $1.00 30 8 San Francisco 2 Stanford, UC Berkeley $0.55 28 9 Boston 3 Brandeis, Harvard, MIT $2.02 4
10 Atlanta 1 Emory $1.01 7 Sources: Productivity data: Bureau of economic analysis, www.bea.gov, regional metropolitan statistics for 2005; AAU universities: www.aau.edu;
Research expenditures and college degrees awarded: Atlanta Regional Council for Higher Education, “Higher Education in America’s Metropolitan Areas, a Statistical Profile,” www.atlantahighered.org

9
Texas has two cities that are among the ten most economically productive metropolitan areas in the U.S. In terms of research expenditures, Houston fairs reasonably well with $1.0B in research expenditures (rank: No. 6 among U.S. cities) but Dallas-Fort Worth does not fare well with only $0.35 B in research expenditures (rank: No. 22 among U.S. cities). Houston is probably strong because of health-related research performed within the Texas Medical Center. Dallas-Fort Worth is particularly disadvantaged in terms of research expenditures. The average annual research expenditures for the 8 non-Texas cities listed in Table 8 is $1.07 B. Dallas-Fort Worth, with $0.35 B in research expenditures, falls $0.7 B per year in research expenditures (most of which is federally funded) below the average of the 10 most economically productive cities. Lack of more (any) Tier One academic universities is costing the DFW Metroplex hundreds of millions of dollars per year, or more, in lost opportunity to attract research funds. Texas’ two most economically productive cities are also lagging far behind the leading cities in awarding college degrees from within the metropolitan statistical areas. The three most economically productive cities (New York, Los Angeles, and Chicago) are also the three cities that award the most college degrees. Neither Dallas-Fort Worth nor Houston rank within the Top 10, with Houston faring particularly badly with its rank of No. 30 among the 50 metropolitan areas included in the analysis. Which Texas Universities Aspire to Become Tier One? The Texas Higher Education Coordinating Board (THECB) categorizes Texas four-year public universities in five categories, summarized in Table 7. The THECB recognizes two research universities, which are the “flagship” institutions of the state: Texas A&M and UT Austin.
The THECB recognizes seven emerging research universities:
• Texas Tech • University of Houston • University of North Texas • UT Arlington • UT Dallas • UT El Paso • UT San Antonio
If there is to be another Tier One university in Texas, it almost certainly would be institution that emerges from this list of seven emerging research universities.
Some characteristics of the emerging research universities are summarized in Table 8.
Data for Texas A&M and UT Austin are included at the bottom of Table 8 for comparison purposes.

10
Table 7. Texas Higher Education Coordinating Classification of Four-Year Public Universities in Texas.
Category Institutions Criteria
Research University
Texas A&M – College Station UT Austin
- ≥ 100 doctoral degrees/year in ≥ 15 programs
- ≥ $150 M in annual research expenditures Emerging Research University
Texas Tech Univ. of Houston Univ. of North Texas UT Arlington UT Dallas UT El Paso UT San Antonio
- ≥ 20 doctoral degrees/year in ≥ 10 programs, and/or enroll at least 150 doctoral students
Doctoral Universities
Sam Houston State Texas A& M – Commerce Texas A&M – Kingsville Texas Southern Univ. Texas State Univ. – San Marcos Texas Woman’s Univ.
- ≥ 10 doctoral degrees/year in ≥ 5 programs, and/or enroll at least 150 doctoral students
- ≥ $2 M in annual research expenditures
Comprehensive Universities
Lamar University – Beaumont Prairie View A&M Stephen F. Austin Univ. Tarleton State Univ. Texas A&M International Univ. Texas A&M – Corpus Christi UT Pan American West Texas A&M
- May offer doctoral degrees in targeted areas to meet regional needs (usually one or two areas, but as many as five)
Masters Universities
Angelo State Univ. Midwestern State Univ. Sul Ross State Univ. Sul Ross State – Rio Grande Texas A&M – Galveston Texas A&M – Texarkana UT Brownsville UT Tyler UT Permian Basin Univ. of Houston – Clear Lake Univ. of Houston – Downtown Univ. of Houston – Victoria
- Committed to graduate education through the Masters level
Source: http://www.thecb.state.tx.us/ClosingtheGaps/UNIV_Forming.pdf

11
Table 8. Selected Characteristics of Texas’ Seven Emerging Research Universities, Plus Texas A&M and UT Austin for Comparison. University
FTE Students1
FTE Tenured
and Tenure-Track
Faculty1
Annual Research
Expenditures2
Annual Research Per FTE Faculty Member
U.S. News & World Report
Ranking3
Percent Freshmen
in Top 10% of
H.S. Class3
SAT Score (25th – 75th percentile)4
National Merit
Scholars5
Endowment1
Endowment
per FTE Faculty
National Academy of Engineering
and Sciences
Members6
Texas Tech 27,179 889 $59 M $66,000 Tier 3 22 1020 - 1210 11 $327 M $368,000 1
Houston 30,854 842 $76 M $90,000 Tier 4 22 950 – 1190 8 $258 M $306,000 8
North Texas 27,789 694 $15 M $21,000 Tier 4 20 1010 – 1230 9 $69 M $99,000 0
UT Arlington 20,474 535 $29 M $55,000 Tier 4 22 960 – 1190 0 $51 M $95,000 0
UT Dallas 12,181 341 $44 M $130,000 Tier 3 41 1140 – 1360 30 $236 M $692,000 4
UT El Paso 15,146 479 $32 M $67,000 Tier 4 17 907 – 907 0 $142 M $296,000 0
UT San Antonio 21,962 516 $30 M $58,000 -- -- 910 – 1130 0 $44 M $85,000 0
AVERAGE 22,226 614 $41 M $70,000 -- 24 965 – 1174 8 $161 M $262,000 2
Texas A&M 42,566 1,596 $493 M $309,000 62 46 1080 – 1290 173 $370 M $231,000 23
UT Austin 46,135 1,830 $431 M $236,000 44 70 1120 - 1370 283 $2,474 M $1,352,000 58 1U.S. Department of Education/ IPEDS Enrollment Report and Finance Report for FY2005-06 2Academic year 2005-06, National Science Foundation, all research expenditures 3U.S. News and World Report, 2008 rankings for best national universities (UT San Antonio not included among this group); universities in the top two tiers are listed in order of
numerical ranking while universities in the third and fourth tiers are listed without numerical ranking within the tier. 4U.S. News and World Report, 2008 rankings, average of 25th and 75th percentile figures; UTEP figure averaged from ACT score. 5National Merit Scholarship Corporation, 2006-07 Annual Report. 6National Academy of Engineering Web Directory; National Academy of Sciences Web Directory, April, 2008.

12
What Separates the Seven Emerging Research Universities from Tier One?
As suggested by Table 8, aside from the obvious differences in size, key differences between the seven emerging research universities and Texas’ two top-tier public universities are:
• The emerging universities have a less-well-developed research culture as evidenced by
differences in research expenditures per faculty member, which average $70,000 for the emerging universities compared to $236,000 and $309,000 for UT and Texas A&M.
• The emerging research universities are less attractive to the best undergraduate students,
as evidenced by:
o Differences in top 10 percent students (average is 24% of freshmen graduating from the top 10% of their high school class among emerging research universities, compared to 46% and 70% for Texas A&M and UT Austin, respectively),
o Differences in SAT score – the emerging research universities average about 150
points below the average of Texas A&M and UT Austin
o Differences in numbers of National Merit Scholars, often used as a measure of the most academically talented group of students entering college – the average number of National Merit Scholars at emerging research universities is more than 20 times smaller that Texas A&M and UT Austin.
• The emerging research universities are less successful in attracting the very best science and engineering professors, as measured by members of the National Academy of Engineering or Sciences (average of 2 faculty members at the emerging research universities, compared to 23 and 58 at Texas A&M and UT Austin, respectfully).
• The emerging research universities have much smaller endowments compared to the state’s top-ranked research university, UT Austin. It is helpful to consider a group of “aspirant universities,” which are universities that have
the characteristics that the emerging research universities seek to achieve. A group of aspirational universities has been identified as universities that are listed among the top 50 ranked public universities according to the 2008 U.S. News and World Report rankings and that: (1) have 10,000 to 30,000 FTE students (this is the range of the seven emerging research universities – this restriction eliminates very large universities like UT Austin and Ohio State that are not comparable to the seven emerging research universities), and (2) generate at least $100 million in annual research funding. There are 21 such universities, 10 of which are AAU universities. Table 9 summarizes key characteristics of this group of 21 universities. (The University of Colorado was omitted from the table because of lack of consistently reported data for this institution in the national data bases.)

13
Table 9. Information on Top-Tier Aspirant Universities in Other States. University
AAU?
Medical School?
FTE Students1
FTE Faculty1
Annual Research
Expenditures2
Annual Research per FTE Faculty
Freshmen
in Top 10% of H.S. Class3
SAT Score (25th – 75th percentile)4
National Merit
Scholars5
NAE and NAS
Members6
Auburn No No 23,537 1,055 $127 M $119,000 36% 1030 – 1210 28 0 Clemson No No 16,589 841 $180 M $214,000 47% 1120 – 1310 50 0 Georgia Tech No No 19,688 796 $441 M $554,000 66% 1230 – 1400 100 26 Iowa State Yes No 23,540 1,102 $222 M $201,000 27% 1030 – 1210 40 6 NC State No No 26,285 1,349 $331 M $245,000 37% 1080 – 1280 3 14 Stony Brook Yes Yes 20,017 846 $235 M $277,000 34% 108- - 1280 3 7 UC Irvine Yes Yes 25,781 977 $300 M $307,000 96% 1080 – 1290 5 28 UC Riverside No No 16,443 583 $125 M $214,000 94% 1910 – 1170 0 3 UC San Diego Yes Yes 26,291 891 $755 M $847,000 99% 1140 – 1360 14 79 UC Santa Barbara Yes No 21,938 793 $174 M $220,000 96% 1090 – 1310 1 48 UC Santa Cruz No No 15,265 490 $114 M $233,000 96% 1020 – 1270 1 8 U Connecticut No Yes 20,672 997 $215 M $216,000 38% 1090 – 1290 2 3 U Delaware No No 19,280 831 $115 M $138,000 39% 1100 – 1300 16 8 U Kansas Yes Yes 23,575 1,006 $196 M $195,000 28% 1030 – 1240 35 3 U Massachusetts No No 22,601 960 $136 M $142,000 23% 1040 – 1260 1 4 U Missouri Yes Yes 24,392 1,150 $215 M $187,000 27% 1060 – 1240 20 4 U Nebraska Yes No 19,099 995 $333 M $335,000 25% 1030 – 1240 66 1 U North Carolina Yes Yes 25,757 1,620 $444 M $274,000 76% 1200 – 1390 166 13 U Tennessee No Yes 27,045 1,702 $249 M $146,000 41% 1060 – 1240 18 5 U Virginia Yes No 22,977 1,356 $239 M $176,000 88% 1220 – 1430 38 15 Virginia Tech No Yes 27,840 1,252 $322 M $257,000 38% 1100 - 1290 18 9
AVERAGE 22,300 1,028 $260 M $262,000 55% 1083 - 1286 30 14
1U.S. Department of Education/ IPEDS Enrollment Report and Finance Report for FY2005-06 2Academic year 2005-06, National Science Foundation, all research expenditures 3U.S. News and World Report, 2008 rankings for best national universities. 4U.S. News and World Report, 2008 rankings, average of 25th and 75th percentile figures. 5National Merit Scholarship Corporation, 2006-07 Annual Report. 5National Academy of Engineering Website, April, 2008, Active (Non-Retired) Members; National Academy of Sciences Web Site, April, 2008.

14
Table 10. Summary of Some Comparative Data from Tables 8 and 9.
Characteristic
Emerging Research
University (Average)
Texas A&M
and UT Austin (Average)
Aspirant Tier
One Universities (Average of 21
Schools)
Full Time Equivalent (FTE) Enrollment 22,226 44,351 22,300
FTE Tenured and Tenure Track Faculty 614 1,713 1,026
Annual Research Expenditures per FTE Faculty Member
$70,000 $266,000 $262,000
Percent of Freshmen Graduating in Top 10% of their High School Class
24% 58% 55%
Freshman SAT Score (25th and 75th Percentiles)
985 – 1172 1100 – 1330 1083 – 1286
New National Merit Scholars per Year 8 228 30
Endowment per FTE Faculty Member $262,000 $792,000 Not Available
Members of National Academy of Engineering or Sciences
2 40 14
The following observations can be made from a comparison of the group of aspirant Tier One universities with the seven emerging research universities:
1. Student body size is not an issue. The average student enrollment among the seven
emerging research universities in Texas is almost identical to the average of the 21 aspirant Tier One universities – a little over 22,000 students.
2. Texas schools have too few faculty members. Although the average student enrollment of the two groups of universities is nearly identical, the top-tier schools average significantly more faculty members (1,030) compared to the Texas schools (average faculty size is 614). The result is a serious handicap for Texas universities in terms of time available for professors to secure research contracts, supervise graduate students, publish scholarly papers, etc. The root cause for the Texas schools having 40% fewer faculty members is that they are funded at a 40% lower level, as will be seen later.
15
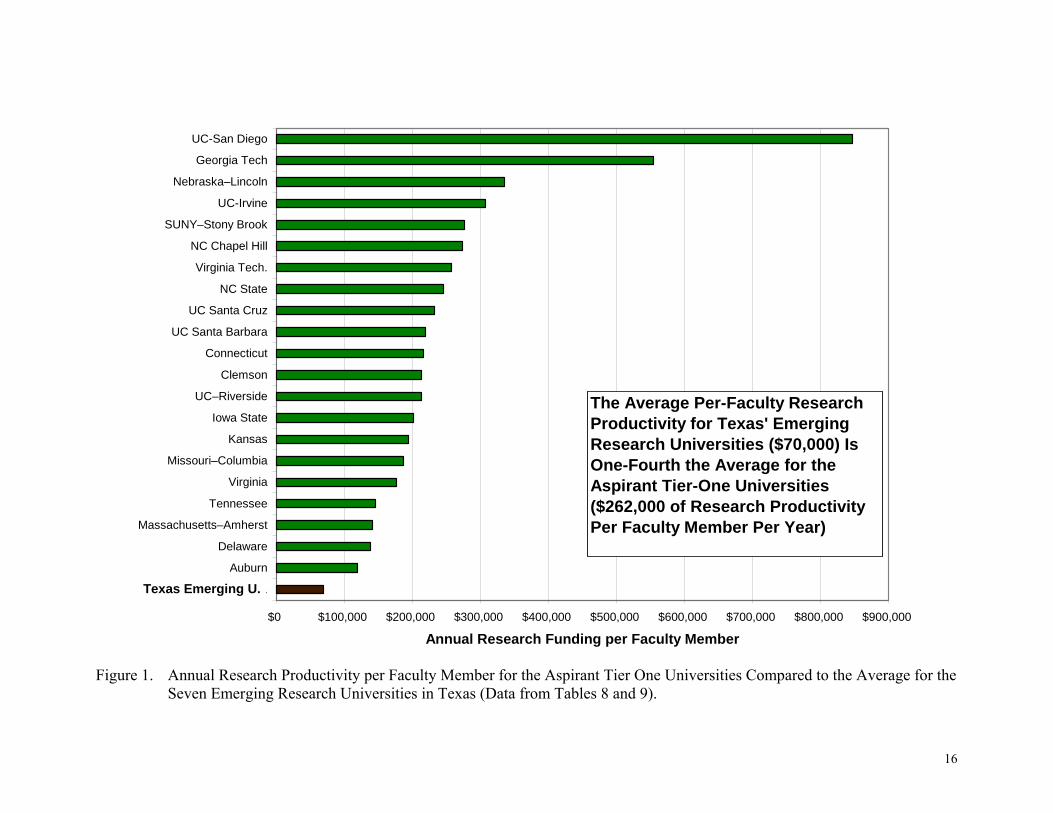
3. Texas schools do not produce research at a comparable rate. The aspirant institutions produce an average of $262,000 of research expenditures per faculty member per year, compared to only $70,000 for the emerging research universities. The data are presented graphically in Figure 1. This is a major cultural difference – the top-tier universities have focused on research-intensive disciplines, infrastructure, and faculty members, whereas the emerging research universities in Texas generally have not to the same extent.
4. The Texas institutions are not as effective in recruiting top undergraduate students. An average of 55% of freshmen entering the aspirant institutions graduated in the top 10% of their high school class, compared to only 24% among the Texas emerging research universities. In addition, freshmen at aspirant Tier One universities score an average of more than 100 points higher on SAT tests than freshmen at the seven emerging research universities in Texas. And the number of the nation’s very best high school graduates that are entering the seven emerging research universities, as measured by National Merit Scholars, is far lower that the aspirant Tier One group. The reasons why the average quality of the freshmen classes at the emerging research universities is not as strong as the aspirant Tier One universities are probably lack of a strong national reputation and lack of funds (such as endowment) for merit-based scholarships that could be used attract top students.
5. The Texas emerging research universities lag dramatically in attracting the very best faculty. The aspirant Tier One universities average 14 members of the National Academy of Engineering and National Academy of Sciences on their faculty, compared with an average of only 2 per institution among the emerging research universities. The emerging research universities in Texas simply are not competitive as a group in attracting the nation’s top scientists and engineers to their faculties. The causes are probably lack of strong national reputation, an uncompetitive student-to-faculty ratio (see No. 2 above), in some cases lack of a competitive faculty salary structure, lack of research infrastructure, lack of a large pool of highly qualified graduate students to work with the best researchers, and lack of endowment for the professorships and chairs that are essential to successful recruitment and retention at this level.
National statistics on endowment size are not available and are complicated by the fact that endowments for some institutions are held primarily in private foundations. Although data are not available, it is obvious that the level of private support and endowment is far less for the emerging research universities than the aspirant group. An example involving the University of Kansas will be given later in this report.
The comparisons discussed above do not change much when one separates out the aspirant universities that have medical schools from those that do not. The average enrollment is about the same, and the number of National Academy members for the institutions without medical schools is only one fewer (13) compared to the overall average (14). The presence of a major medical school helps a quality university attract more research and private support, but the top universities without medical schools have essentially the same characteristics as those that do have medical schools. None of the Texas emerging research universities have medical schools on their campus, but all have them within their university’s systems or in their city or region.
16
$0 $100,000 $200,000 $300,000 $400,000 $500,000 $600,000 $700,000 $800,000 $900,000
Texas Emerging U.
Auburn
Delaware
Massachusetts–Amherst
Tennessee
Virginia
Missouri–Columbia
Kansas
Iowa State
UC–Riverside
Clemson
Connecticut
UC Santa Barbara
UC Santa Cruz
NC State
Virginia Tech.
NC Chapel Hill
SUNY–Stony Brook
UC-Irvine
Nebraska–Lincoln
Georgia Tech
UC-San Diego
Annual Research Funding per Faculty Member
Texas Emerging U.
The Average Per-Faculty Research Productivity for Texas' EmergingResearch Universities ($70,000) IsOne-Fourth the Average for theAspirant Tier-One Universities ($262,000 of Research Productivity Per Faculty Member Per Year)
Figure 1. Annual Research Productivity per Faculty Member for the Aspirant Tier One Universities Compared to the Average for the
Seven Emerging Research Universities in Texas (Data from Tables 8 and 9).

17
How Many Tier One Universities Does Texas Need?
There are many different ways to view this question. For instance, Texas has 3 AAU Universities while California has 9 AAU universities. Since Texas has two-thirds of California’s population, one might say that Texas should have two-thirds as many AAU universities, or a total of 6 AAU universities in Texas (3 more than today). Table 11 lists the 8 most populous states in the U.S., and the far right column shows how many AAU universities Texas should have by population proportion to each state. For instance, Ohio has 2 AAU universities, but Texas is twice as big, so by population proportion, Texas should have 4 AAU universities by this comparison with Ohio. As shown at the bottom of Table 11, based on comparison with 7 other states, Texas should have 5 or 6 AAU universities, or 2 to 3 more than today, using the average of the population proportion for the states shown in the table.
Table 11. AAU Universities in the Eight Most Populous States, and Texas’ Proportional Population Share of AAU Universities for Each State.
State
Population (M)
Texas
Population Proportion
AAU Universities
Texas’ Proportional Population Share of AAU Universities
California 36.4 0.66 9 6 Texas 23.5 1.00 3 - New York 19.3 1.22 7 9 Florida 18.1 1.30 1 1 Illinois 12.8 1.83 3 5 Pennsylvania 12.4 1.89 4 8 Ohio 11.5 2.05 2 4 Michigan 10.1 2.33 2 4 Average: 5 AAU Univ.
(6 excluding Florida)
Another way to look at the question is based on national population percentage. For example, one might say that Texas, which has 8% of the U.S. population, should have at least 8% of the top-50-ranked public universities in the U.S., or 4 public universities (2 more than today).
Because major population centers are critical to the economies of most states, one might also view the question from the perspective of major cities. Table 12 lists the nation’s 10 most economically productive metropolitan statistical areas and the AAU universities in each region. The average is 2.4 AAU universities per city, but Dallas-Fort Worth has zero and Houston only has one. By this criterion, at 2.4 AAU universities per city, Texas should have a total of 5 AAU universities in Houston and Dallas-Fort Worth, or 4 more than today.

18
Table 12. The Top Ten Most Economically Productive Cities in the U.S., and AAU Universities in each Region.
Rank
City
Number of AAU
Universities
AAU Universities
1 New York City 4 Columbia, NYU, Rutgers, SUNY Stony Brook 2 Los Angeles 4 Caltech, UCLA, UC Irvine, USC 3 Chicago 2 Northwestern, Univ. of Chicago 4 Washington, DC 2 Johns Hopkins, Univ. of Maryland 5 Dallas-Fort Worth 0 6 Philadelphia 1 Univ. of Pennsylvania 7 Boston 3 Brandeis, Harvard, MIT 8 Houston 1 Rice 9 San Francisco 2 Stanford, UC Berkeley 10 Atlanta 1 Emory Average: 2.4
(Excluding Texas)
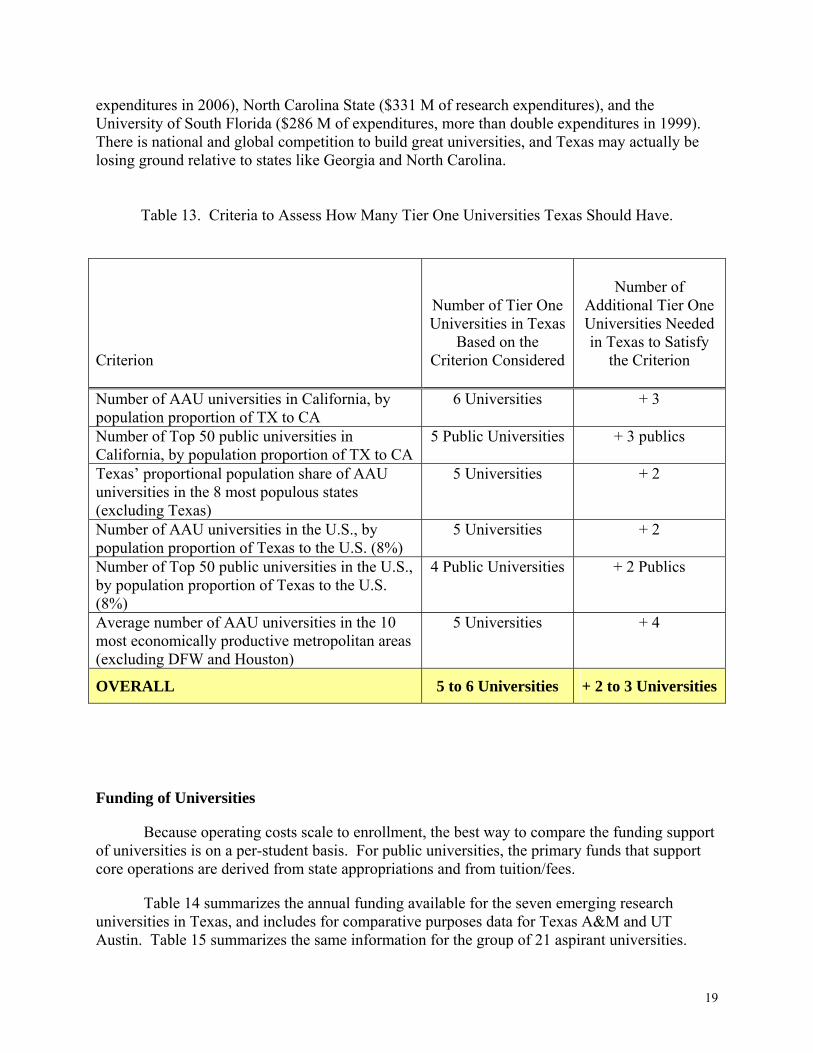
Table 13 summarizes some of the criteria that might be used, and the result of the application of the criterion in addressing the question of how many Tier One universities Texas should have. Based on these criteria, Texas should have 5 to 6 Tier One universities, or 2 to 3 more than today.
Unfortunately, no university in Texas is on the cusp of attaining AAU status. As indicated by the data in Table 8 and 10, none of the emerging research universities has a Tier One profile, though some universities are close based on some of the factors that are important. Texas has some very good private universities, but none has emphasized research in a manner similar to Rice University, and as a result none is competitive for AAU status at this time.
Unfortunately for Texas, many other states have universities that are excellent candidates for AAU status. Perhaps at the top of this list is Georgia Tech in Atlanta, which with $440 M of annual research expenditures is an institution that has evolved over the past two decades from a good regional engineering school into one of the world’s best and most important universities. In 2006, Georgia Tech’s research expenditures were $4 M more than those of UT Austin (source: National Science Foundation, http://www.nsf.gov/stastistics/). Atlanta has benefited enormously from Georgia Tech’s emergence. The University of Illinois at Chicago, with $332 M of annual research expenditures (much of it associated with the university’s medical school) is expanding and improving rapidly. Other ascending universities of note include LSU ($344 M of research
19
expenditures in 2006), North Carolina State ($331 M of research expenditures), and the University of South Florida ($286 M of expenditures, more than double expenditures in 1999). There is national and global competition to build great universities, and Texas may actually be losing ground relative to states like Georgia and North Carolina.
Table 13. Criteria to Assess How Many Tier One Universities Texas Should Have.
Criterion
Number of Tier One Universities in Texas
Based on the Criterion Considered
Number of
Additional Tier One Universities Needed in Texas to Satisfy
the Criterion
Number of AAU universities in California, by population proportion of TX to CA
6 Universities + 3
Number of Top 50 public universities in California, by population proportion of TX to CA
5 Public Universities + 3 publics
Texas’ proportional population share of AAU universities in the 8 most populous states (excluding Texas)
5 Universities + 2
Number of AAU universities in the U.S., by population proportion of Texas to the U.S. (8%)
5 Universities + 2
Number of Top 50 public universities in the U.S., by population proportion of Texas to the U.S. (8%)
4 Public Universities + 2 Publics
Average number of AAU universities in the 10 most economically productive metropolitan areas (excluding DFW and Houston)
5 Universities + 4
OVERALL 5 to 6 Universities + 2 to 3 Universities
Funding of Universities
Because operating costs scale to enrollment, the best way to compare the funding support of universities is on a per-student basis. For public universities, the primary funds that support core operations are derived from state appropriations and from tuition/fees.
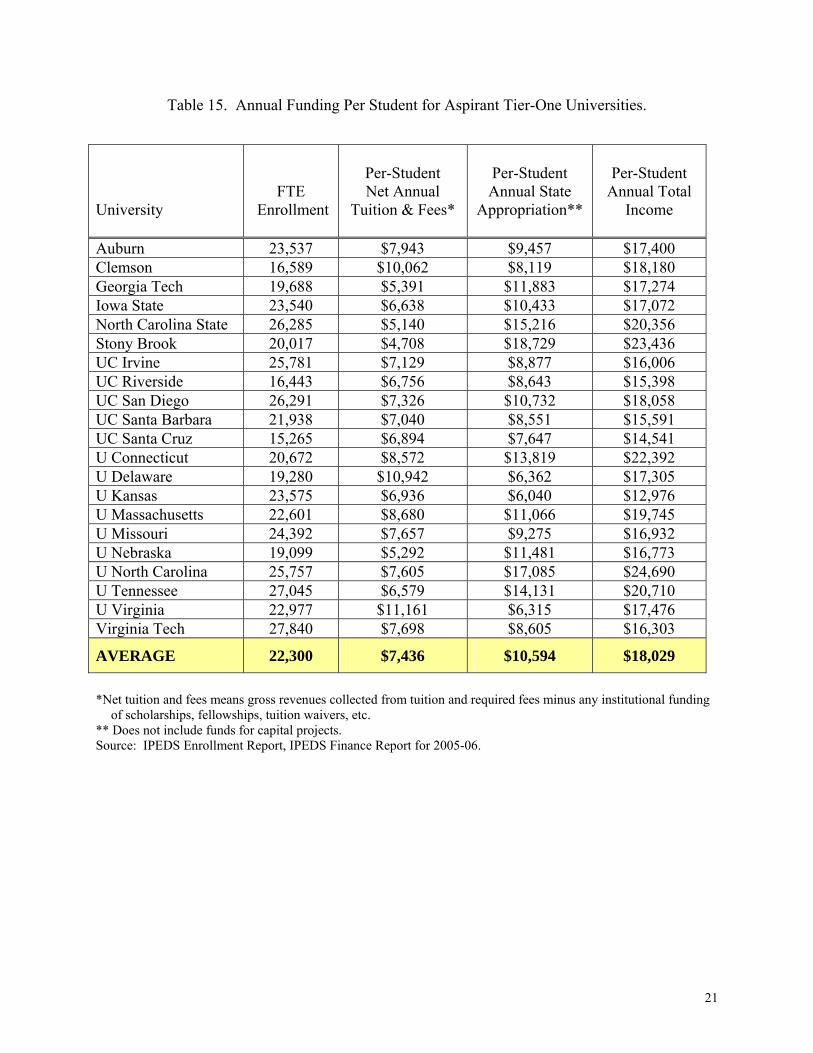
Table 14 summarizes the annual funding available for the seven emerging research universities in Texas, and includes for comparative purposes data for Texas A&M and UT Austin. Table 15 summarizes the same information for the group of 21 aspirant universities.

20
The income from tuition and fees reported in these tables, obtained from national data bases, is the net income, meaning gross income minus any institutionally funded programs such as scholarships or tuition waivers. Also, the national data base from which these tables were compiled does not include capital expenditures, which states separate from operating funds.
Figures 2, 3, and 4 compare the annual funding levels for the average of the Texas emerging research universities with that of the aspirant institutions. Figure 1 shows the net annual income per student per year from tuition and fees. Figure 2 shows the annual state appropriation per student. And Figure 4 shows the total funding levels per student per year.
Table 14. Annual Funding Per Student for Emerging Research Universities, with Comparative Information for Texas A&M and UT Austin Included.
Institution
FTE Enrollment
Per-Student Net Annual
Tuition & Fees*
Per-Student Annual State
Appropriation**
Per Student Total Annual Income
Texas Tech 27,179 $6,504 $5,454 $11,958 Univ. Houston 30,854 $6,118 $5,521 $11,639 Univ. North Texas 27,789 $5,712 $4,240 $9,951 UT Arlington 20,474 $5,631 $5,016 $10,647 UT Dallas 12,181 $5,756 $5,941 $11,698 UT El Paso 15,146 $4,203 $5,210 $9,413 UT San Antonio 21,962 $5,401 $4,423 $9,824
AVERAGE 22,226 $5,618 $5,115 $10,733
Texas A&M 42,566 $6,062 $9,880 $15,941 UT Austin 46,135 $7,283 $6,517 $13,801
*Net tuition and fees means gross revenues collected from tuition and required fees minus any institutional funding of scholarships, fellowships, tuition waivers, etc.
** Does not include funds for capital projects. Source: IPEDS Enrollment Report, IPEDS Finance Report for 2005-06. Data for Texas A&M and UT Austin
include operating funds allocated from Available University Fund.
21
Table 15. Annual Funding Per Student for Aspirant Tier-One Universities.
*Net tuition and fees means gross revenues collected from tuition and required fees minus any institutional funding
of scholarships, fellowships, tuition waivers, etc. ** Does not include funds for capital projects. Source: IPEDS Enrollment Report, IPEDS Finance Report for 2005-06.
University
FTE Enrollment
Per-Student Net Annual
Tuition & Fees*
Per-Student Annual State
Appropriation**
Per-Student
Annual Total Income
Auburn 23,537 $7,943 $9,457 $17,400 Clemson 16,589 $10,062 $8,119 $18,180 Georgia Tech 19,688 $5,391 $11,883 $17,274 Iowa State 23,540 $6,638 $10,433 $17,072 North Carolina State 26,285 $5,140 $15,216 $20,356 Stony Brook 20,017 $4,708 $18,729 $23,436 UC Irvine 25,781 $7,129 $8,877 $16,006 UC Riverside 16,443 $6,756 $8,643 $15,398 UC San Diego 26,291 $7,326 $10,732 $18,058 UC Santa Barbara 21,938 $7,040 $8,551 $15,591 UC Santa Cruz 15,265 $6,894 $7,647 $14,541 U Connecticut 20,672 $8,572 $13,819 $22,392 U Delaware 19,280 $10,942 $6,362 $17,305 U Kansas 23,575 $6,936 $6,040 $12,976 U Massachusetts 22,601 $8,680 $11,066 $19,745 U Missouri 24,392 $7,657 $9,275 $16,932 U Nebraska 19,099 $5,292 $11,481 $16,773 U North Carolina 25,757 $7,605 $17,085 $24,690 U Tennessee 27,045 $6,579 $14,131 $20,710 U Virginia 22,977 $11,161 $6,315 $17,476 Virginia Tech 27,840 $7,698 $8,605 $16,303
AVERAGE 22,300 $7,436 $10,594 $18,029

22
$4,708
$5,140
$5,292
$5,391
$5,733
$6,579
$6,638
$6,756
$6,894
$6,936
$7,040
$7,129
$7,326
$7,605
$7,657
$7,698
$7,943
$8,572
$8,680
$10,062
$10,942
$11,161
$0 $2,000 $4,000 $6,000 $8,000 $10,000 $12,000
SUNY–Stony Brook
NC State
Nebraska–Lincoln
Georgia Tech
Emerging Univ
Tennessee
Iowa State
UC–Riverside
UC Santa Cruz
Kansas
UC Santa Barbara
UC-Irvine
UC-San Diego
NC Chapel Hill
Missouri–Columbia
Virginia Tech.
Auburn
Connecticut
Massachusetts–Amherst
Clemson
Delaware
Virginia
Texas Emerging U.
Figure 2. Annual Per-Student Net Tuition and Fee Income from Top-Tier Aspirant Universities and the Average of the Texas Emerging Research Universities (Data from Tables 14 and 15).
23
$5,062
$6,040
$6,315
$6,362
$7,647
$8,119
$8,551
$8,605
$8,643
$8,877
$9,275
$9,457
$10,433
$10,732
$11,066
$11,481
$11,883
$13,819
$14,131
$15,216
$17,085
$18,729
$0 $2,000 $4,000 $6,000 $8,000 $10,000 $12,000 $14,000 $16,000 $18,000 $20,000
Texas Emerging Univ.
Kansas
Virginia
Delaware
UC Santa Cruz
Clemson
UC Santa Barbara
Virginia Tech.
UC–Riverside
UC-Irvine
Missouri–Columbia
Auburn
Iowa State
UC-San Diego
Massachusetts–Amherst
Nebraska–Lincoln
Georgia Tech
Connecticut
Tennessee
NC State
NC Chapel Hill
SUNY–Stony Brook
Texas Emerging U.
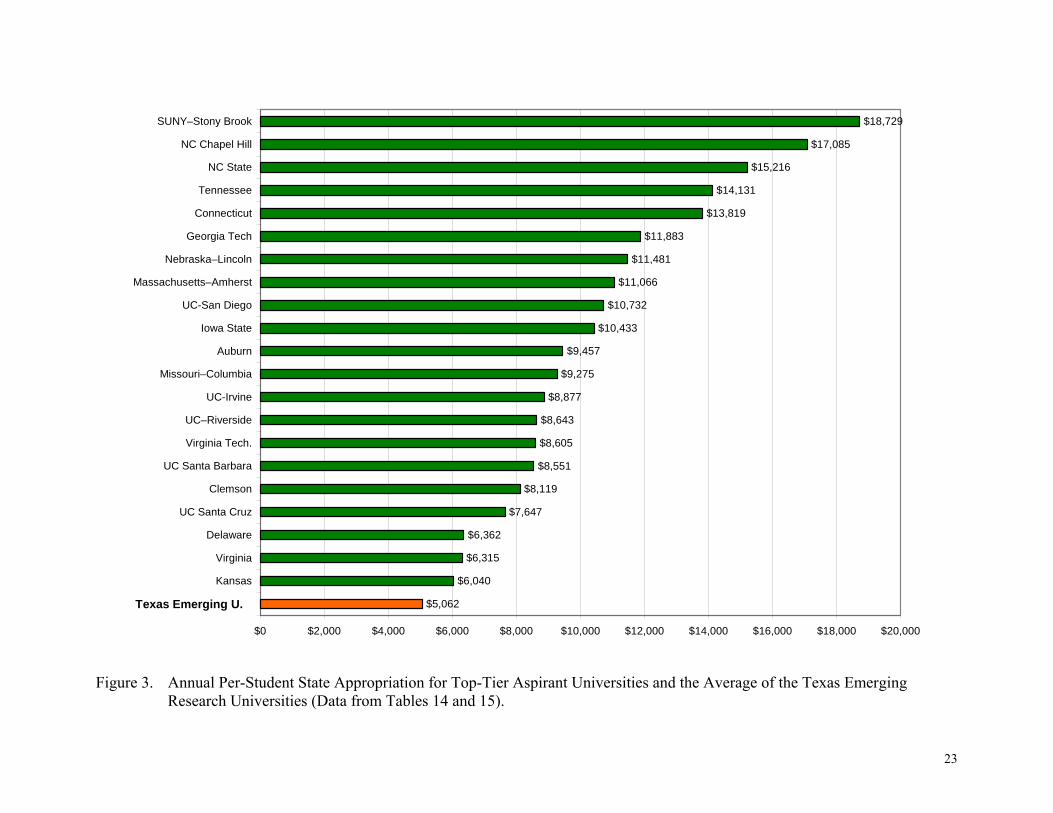
Figure 3. Annual Per-Student State Appropriation for Top-Tier Aspirant Universities and the Average of the Texas Emerging
Research Universities (Data from Tables 14 and 15).
24
$10,794
$12,976
$14,541
$15,398
$15,591
$16,006
$16,303
$16,773
$16,932
$17,072
$17,274
$17,305
$17,400
$17,476
$18,058
$18,180
$19,745
$20,356
$20,710
$22,392
$23,436
$24,690
$0 $5,000 $10,000 $15,000 $20,000 $25,000 $30,000
Emerging Univ
Kansas
UC Santa Cruz
UC–Riverside
UC Santa Barbara
UC-Irvine
Virginia Tech.
Nebraska–Lincoln
Missouri–Columbia
Iowa State
Georgia Tech
Delaware
Auburn
Virginia
UC-San Diego
Clemson
Massachusetts–Amherst
NC State
Tennessee
Connecticut
SUNY–Stony Brook
NC Chapel Hill
Texas Emerging U.
+ $3,000 Per Student Year
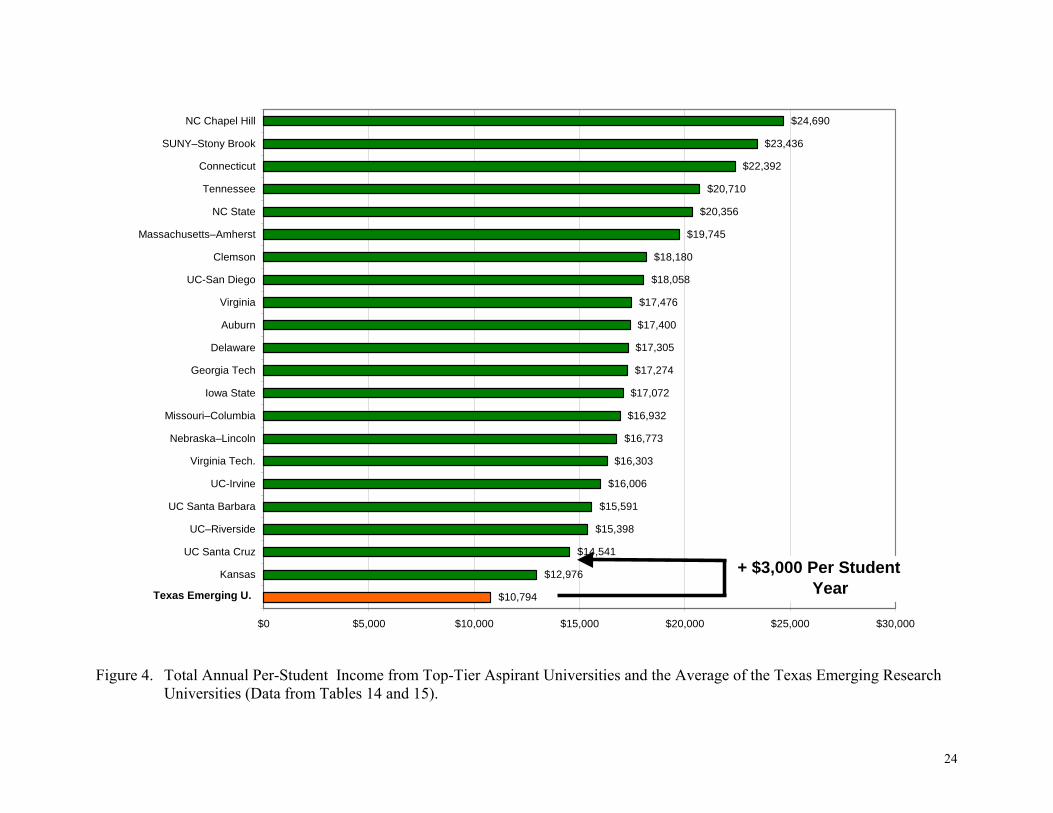
Figure 4. Total Annual Per-Student Income from Top-Tier Aspirant Universities and the Average of the Texas Emerging Research Universities (Data from Tables 14 and 15).
25
The information in these tables and figures point to several important comparisons:
1. The average annual state appropriation for the seven emerging research universities is $1,000 lower than the lowest of the aspirant institutions, and is $5,500 per year less than the average of the aspirant Tier One group.
2. The average total annual funding (net tuition, fees, and state support) for the seven emerging research universities is $2,182 lower than the lowest of the aspirant institutions, and is $7,296 per student per year less than the average of the aspirant group.
The average total annual funding of the emerging research universities ($10,794) is 60% of the average annual funding ($18,029) of the aspirant group. This 60% ratio is identical to the ratio of average faculty sizes (Table 9: 614 average faculty members at the Texas emerging research universities versus 1,028 for the aspirant university group), despite the fact that the average student enrollments (22,000+) are the same. Texas universities are teaching the same number of students but with only 60% of the faculty and only 60% of the funding, leaving little time for the faculty to write research proposals, conduct research, supervise graduate students individually, publish scholarly works, etc. This is the most fundamental factor explaining why Texas’ emerging universities have so few National Academy members – the environment is not as attractive to the very top scholars at these universities as it is at within the aspirant Tier One group.
The numbers cited above do not change much when only universities with no medical school are considered. Hence, the conclusions listed above are equally as valid for the top-tier universities with no medical school as they are for the entire group.
How Much Will It Cost to Get to Tier One Status?
It is impossible for the seven emerging research universities to compete with and join the group of aspirant Tier One universities when they are funded at a level that is thousands of dollars per student per year below the aspirant group. Exacerbating the problem is the fact that many of the aspirant universities have large endowments and annual income streams from gifts – much larger than any of the seven emerging research universities in Texas.
One can reasonably assume that an emerging research university in Texas must be funded at a level at least as high as the lowest funded university among the aspirant Tier One group of institutions. That university (see Figure 4) is the University of Kansas (KU), which is funded at $12,976 per student per year (net tuition and fees, plus state appropriation). This is $2,182 per student per year more than the average funding per student per year for the seven emerging research universities in Texas. However, according to KU’s website, the University of Kansas has an endowment of $1.047 billion. The average endowment of the seven emerging research universities (Table 8) is $161 million, which is $886 million less than KU. The annual income at a rate of return of 5% from an $886 million endowment difference is $44 million, or $1,879 per student per year based on the FTE student enrollment of 23,575 for KU. So, in reality, the lowest funded of the aspirant Tier One group of universities (KU) receives $2,182 + $1,879, or $4,061 per student per year more funding than the average Texas emerging research university.

26
As a point of calibration, it may be noted that the University of Texas at Austin receives about $3,000 per student per year in operating funds from the Available University Fund (AUF), which is the income portion from the Permanent University Fund (PUF). Texas A&M and UT Austin are themselves significantly under-funded compared to the very best universities in the nation, i.e., the top end of the Tier One public research universities.
It is recommended that the minimum cost to raise a Texas emerging research university to Tier One status be assessed as $3,000 per student per year. This would be sufficient to propel the average emerging research university to a position above the lowest funded aspirant Tier One university (KU, see Figure 4). The emerging research university would, however, need dramatically increased private funding and endowment over time to be able to compete on an equal basis, in addition to the $3,000 per student per year for operations. Increased state appropriation is the only feasible way to make up for the $3,000 per student per year funding shortfall. Tuition could be increased, but there is already so much resistance in Texas to current tuition levels that major tuition increases are not imaginable. Private giving could help, but as noted above, the funding shortfalls shown in the tables and figures do not take into account the already large gap between endowments at the emerging research universities compared to the aspirant Tier One institutions. The Texas universities need to raise large amounts of private dollars just to catch up with the aspirant Tier One institutions. What is the Total Investment Needed? The minimum additional state funding needed to propel a single emerging research university into position to compete with top-tier universities is $3,000 per student per year. The average FTE student enrollment of the emerging research universities is 22,226 students. If $3,000 of additional annual funding were applied to this average enrollment figure, the total cost would be about $70 million per year to raise one university to Tier One status. Because Texas needs two to three additional Tier One universities, a more appropriate target for investment would be $140 million per year to advance two universities to Tier One status, or $210 million per year to advance three institutions. How Should the Additional Funding Be Used? Based on characteristics of Tier One institutions and issues discussed earlier, the funding should be used to:
• Hire additional faculty, focusing on top-quality faculty members in research-intensive areas; and
• Expand research infrastructure, purchase research equipment, and hire the necessary personnel to support an expanded research mission consistent with Tier One status.

27
Recommended Approach for Funding The most direct way to provide the necessary funding would be to identify institutions to be elevated to Tier One, and then to appropriate additional funding of $3,000 per student per year for those institutions. This approach, however, has two problems. First, it would be politically divisive and challenging to select which of the seven emerging institutions to elevate, and more problematically, which not to elevate. Second, additional state funding alone cannot transform an institution to top-tier status. It will take community support, private funding for talent acquisition, and a demonstrated commitment to creating a top-tier research culture, which not all institutions can or should attempt.
As an alternative, it is suggested that Texas consider incentives to elevate emerging research universities to Tier One status. The incentives would constitute open, positive competition between universities and their supporters, and would make the institutions earn Tier One status. Two incentive-based criteria are recommended:
1. Provide matching state funds for gifts or community funding that support the following
critical elements of a Tier One university:
• Merit-based undergraduate student scholarships. Rationale: A characteristic of Tier One universities is top-quality undergraduate students. Scholarships make the institution more attractive to outstanding students and help the institution to recruit the type of student profile consistent with a Tier One university. Scholarships also address financial need and accessibility for qualified students, and they help to keep Texas’ top talent in Texas.
• Graduate student fellowships. Rationale: Top-quality graduate students are an essential element at all top-tier research universities, and fellowships are critical to recruit the very best talent.
• Faculty professorships or chairs. Rationale: Tier One universities attract a disproportionate share of the very best faculty talent – professorships and chairs are vital elements if universities are to succeed in recruiting and retaining top-tier faculty talent.
• Research equipment, research programs, and research infrastructure, including buildings. Rationale: Top-tier universities attract substantial private and industrial support of research, which would be encouraged through this program. The program would stimulate more research at the university, support students conducting research, and foster partnerships with the private sector. The program would also fuel technology transfer, venture investment, and economic progress through public-private collaborations.
• Pipeline programs for at-risk students and critical fields. Rationale: Top-tier universities, through summer programs and other outreach mechanisms, aggressively recruit at-risk students and the students needed for critical fields.
28
2. Provide incentives for universities that create a top-tier university culture, namely:
• Incentive funding tied to annual research funding per faculty member. Rationale: Incentive funding for research provides an objective, fair, transparent productivity index. Texas already rewards externally funded research through the Research Development Fund and the Texas Competitive Knowledge Fund, based on the previous three years of funding. These are very valuable programs. However, a particularly useful measure of top-tier status is research productivity per faculty member (Figure 1), which separates the “pretty good” institutions from truly top tier. The research incentive recommended here would distribute additional funds based on annual external research expenditures per FTE faculty member. This would incentivize externally funded research, augment existing programs, and motivate an institutional profile that is consistent with Tier One.
• Incentive funding tied to faculty members who have been elected to the National Academies (IOM, NAE, or NAS). Rationale: This is a critical measure used to assess the quality of the faculty at leading research universities. There is a large difference in the number of National Academy members at the seven emerging research universities and the typical Tier One university nationwide. This incentive would provide strong motivation and the funds necessary to catch up with the top institutions in terms of this key benchmark of faculty quality.
• Incentive funding to support a demonstrable commitment to undergraduate research education. Rationale: The world’s top research universities engage undergraduate students in research and focus on quality undergraduate education through a variety of programs. It is recommended that institutions receive extra funding for undergraduates who have registered for a course with a documented faculty-supervised research experience for participating students during the previous biennium. This incentive would encourage and reward a truly top-tier research culture in the undergraduate educational program of an institution.
The parameters recommended are meant to be reasonably steady parameters that would
not produce large fluctuations. Averaging the numbers over a two-year period (i.e., the preceding biennium) is desirable to encourage steady funding. At Tier One institutions gift funds for scholarships, fellowships, and research tend to be reasonably steady from year to year.
The recommended funding ($140 M to $210 M per year) would be available to all seven
emerging research universities. It is assumed that two or three institutions (and their communities and supporters) would be highly motivated and disproportionally successful in attracting most of the private support and community investments, and in creating a Tier One profile. Annual funding of $140 M to $210 M would provide sufficient funding for 2 to 3 universities to rise to Tier One status. If all seven universities perform equally, then all seven would improve but none would differentiate themselves enough to attract the resources needed to ascend to Tier One status in the near term. It is believed that some institutions would rise to the occasion with the help of their communities and supporters, and differentiate themselves from the others.

29
How the Program Might Work
If reasonably funded, creation of the proposed program would send a powerful message throughout the nation that Texas is building more great universities. The program would likely prove to be a hugely successful incentive for private funding of scholarships, fellowships, and research. It is recommended that Texas implement the program in a highly visible way that attracts attention – it will help the universities attract private funding and garner support for mission focus.
An example of how the program might work is as follows:
• 50% of the state funds would be distributed to match community funding and private gifts that support merit-based scholarships, graduate student fellowships, faculty professorships or chairs, research infrastructure, research programs, and pipeline initiatives. “Community gifts” and “private funds” are both included because in some communities philanthropists may be able to provide the needed support, but in others the communities themselves may choose to provide the needed funding, e.g., by funding merit-based scholarships for local residents. This language provides maximum flexibility. The funds would be distributed on a proportional basis to the dollars collected during the previous biennium that meet the criteria. The universities would report the funding to the Texas Higher Education Coordinating Boar (THECB), which would verify the numbers and certify the distribution formula.
• 30% of the state funds would be distributed on the basis of research expenditures per FTE faculty member per year. This is designed to provide a very strong incentive for universities not only to increase their total research funding, but also to evolve into an institution with a profile that is consistent with the nation’s Tier One institutions. The average research expenditure per FTE faculty member per year would be averaged for the previous biennium or 3 years, with each of the seven emerging research universities receiving its proportional share based on its measure of research expenditures per FTE faculty member. This information is already collected by the THECB, which would certify the distribution formula.
• 10% of the state funds would be distributed based on the number of faculty members who have been elected to one of the National Academies (IOM, NAE, or NAS). The number of faculty members on the tenured faculty of an institution for at least one semester during the previous biennium would form the basis for the distribution. Institutions would report their numbers to the THECB, which would certify the distribution formula.
• 10% of the states funds distributed on the basis of semester credit hours of undergraduate student research, supervised by faculty, completed at an institution in the previous biennium. The THECB would establish the rules for qualification, e.g., requirement of a senior thesis or research report deposited in the university’s permanent library archives. Course credit hours for qualifying semester credit

30
hours undertaken or completed would be totaled, and funds distributed on a proportional basis.
The proposal is designed to provide reasonably stable funding, with no huge spikes up or down. The number of faculty members in the National Academies is very small at most of the emerging research universities, so there is potential for instability in this category. However, it is so critical that universities recruit and retain faculty members at this level that the incentive is recommended despite the potential for fluctuations.
The THECB currently collects data on research expenditures and number of FTE faculty, so the research incentive would require no new data collection. The other pieces of information (gifts and community support, members of the National Academies, and undergraduate research education) represent new categories. The cost to collect this information is small compared to the recommended funding of $140 to $210 million per year. And the criteria recommended are the critical ones that differentiate Texas’ emerging research universities from Tier One institutions.
Expected Results
The results expected from this program are the following:
1. All seven of Texas’ emerging research universities would benefit immediately.
2. At least two or three Tier One universities would emerge (the ones with the strongest community and private support, investment in external research support, and internal decisions that drive the institution toward a Tier One research university profile).
3. The program would attract local and national attention and support because it provides:
• A very compelling incentive to increase gifts and endowments (matching funds);
• A very compelling incentive for private investment in research (matching funds);
• A mechanism to stop the brain drain of Texas high school students leaving Texas to attend colleges in other states by creating more Tier One universities;
• A mechanism to bring more of the nation’s elite scientists and engineers to Texas (matching funds for members of the National Academies);
• A strategy to bring more Federal R&D funds to Texas, which currently receives $2.8B per year below its proportional share of U.S. Federal R&D funds;
• A strategy to bring more venture capital investment to Texas, which currently receives $0.9B per year below is proportional share of U.S. venture investment;
• A mechanism to expand research capacity in Texas and thereby to develop the medical discoveries, technology advances, and other innovations that will improve the lives of Texans;
31
• A plan to benefit communities and regions in Texas with emerging research universities; and
• A unique and powerful model of leveraging state support with private and community support to advance higher education and achieve a very high return on investment.
Frequently Asked Questions
Some frequently asked questions include the following:
1. How does the program benefit the two flagship universities, Texas A&M and UT Austin? The program does not directly impact the two institutions because it is designed to advance some of the emerging research universities into Tier One status. However, there is no other practical way to address the problem of so many Texans leaving Texas to go to college to other states than to develop more Tier One institutions since the two flagships are near or at capacity. Further, there is no way to address the lack of Tier One universities in key parts of the state via the existing flagships. The two flagships urgently need stronger support if they are to compete with the very best public research universities in the state. And the state needs more Tier One institutions.
2. Doesn’t the program favor some universities over others? No. All are fully empowered to compete in attracting the matching and incentive funds. Each of the existing universities has some advantage over the others in one or more aspects. For example, Texas Tech and the University of Houston are relatively mature research universities with the largest existing base of research support (Table 8). Institutions such as the University of North Texas, UT Arlington, and UT El Paso are large, mature institutions with strong supporters and a solid base of existing research and programs upon which to build. The Univ. of Texas at Dallas has a strong profile of quality and excellent location in a populous, technology intensive area. And UT San Antonio is one of the fastest growing universities in Texas with very large potential for continued evolution and impact.
3. Doesn’t the program favor rich communities? Only in the sense that their capacity for community support may be greater. But each of the seven emerging research universities has a strong foundation to succeed. Older universities in smaller communities, such as Texas Tech and UT El Paso, have large alumni bases. And while their communities are smaller than DFW, Houston, or San Antonio, their communities should be avid supporters of their institutions. The suggested criteria were specifically written to qualify “community support” or “gifts” for scholarships, fellowships, etc., to empower communities to step forward and support their university. In any case, it is unrealistic to think that the state of Texas by itself can make a university Tier One – the communities and supporters must step forward, too, and the suggested approach allows flexibility in how that might be accomplished.
4. Gifts can fluctuate – wouldn’t the funding be too uneven for the program to work? No. Gifts for scholarships, fellowships, and research tend to be fairly steady at universities.

32
Research expenditures are slow to increase or decrease dramatically since most research contracts are for multiple years of work. And the support is averaged over at least a two year period to further steady the results. The main areas for potential unevenness are large gifts for research buildings and membership in the National Academies. However, while these may be uneven, they are a small part of the total program. Further, private funding of research buildings at our public universities is exactly the type of investment that the state should be encouraging. And membership in the National Academies is a key indicator of faculty quality and, while it may fluctuate because of the current small numbers, the incentive is a powerful one that would have immediate impact in correcting this major problem for Texas’ emerging research universities.
5. Do states match gifts of this nature? Yes. Texas has apparently matched gifts in the past. Mr. T. Boone Pickens recently gave $100 M to Oklahoma State University for endowed chairs and faculty professorships, which will be matched dollar-for-dollar through the state’s Endowed Chair Program, doubling the value of the gift to $200 M. Oklahoma State is one of the leading universities for attracting Texas high school graduates, and the ability of Oklahoma to draw talented Texans’ to their state is being enhanced in a major way by this gift and matching state funds.
6. Wouldn’t this require more data collection and reporting by the Texas Higher Education Coordinating Board? Yes. The Board currently collects information on research expenditures and faculty size, but not on gifts, number of National Academy members, or undergraduate students taking courses with significant research content. The data collection is not onerous, but it would require some additional resources by the Coordinating Board.
7. Many universities are focusing on excellence and improvement rather than Tier One status – how does this program affect them? This recommended program is not trying to be all things to all people. It attempts to address one issue: creating more Tier One universities in Texas. This is not the only important issue for higher education in Texas, but it should not be confused with other issues that must be addressed. The program recommended would benefit all seven emerging research universities, even those that may not have aspirations for immediate ascendancy to Tier One status and, in that sense, would help all seven in their quest for improvement and achievement of excellence.
8. How much money is required? The recommended funding is $140 million to $210 million per year. This is enough to propel two or three institutions to Tier One status.
9. What if no particular university is more successful than the others in advancing toward Tier One status? All seven universities would qualify for the funding, and if all seven perform about equally, none will quickly “break out of the pack.” However, there is much talk at several, if not all, of the emerging research universities about becoming top-tier research universities. This proposal assumes that some of the seven will be so highly motivated and successful in engaging their communities and supporters that they will break out of the pack. Even if this does not happen, the funding will improve the quality, excellence, and research capacity of the institutions significantly.

33
10. Which universities would be the ones that would succeed in attaining Tier One status? There is no way to know. The suggested program gives all seven emerging research universities an equal opportunity.
11. How does this program address the Closing the Gaps program of the Texas Higher Education Coordinating Board? One goal is to close the gaps in Federal R&D spending, and raise Texas’ percentage of the Federal R&D pie to 6.5%. The plan described here, to build excellence and research capacity at the seven emerging research universities, would address this key issue.
12. Can an emerging research university really make it to Tier One status? Yes. There are several examples of institutions that have ascended to the ranks of Tier One in recent years, though it has typically taken a decade or more of steady funding and commitment. Georgia Tech may be the best example – it was a good regional engineering school in the 1980’s, and through a variety of major new investments and commitments by Georgia, and the strong support of Atlanta, it is now a powerful, globally preeminent, comprehensive institution. Several California institutions, such as UC San Diego and UC Santa Barbara, have likewise ascended rapidly. There are also numerous institutions that make unrealistic claims of desire to ascend to Tier One, with no realistic chance to make it because of lack of resources, lack of critical research infrastructure (such as a major medical school in the region), and other reasons. Each of the Texas emerging research universities has critical pieces in place, but without some type of major program such as recommended here, the emergence process will be very slow, if it occurs at all. Meanwhile, other states continue to invest.
Concluding Remarks
The suggestion presented here is that the Texas Legislature consider providing supplemental funding to the seven Texas emerging research universities and that funds be distributed as: (1) matching funds for gifts that drive a university toward Tier One status, and (2) incentive funds for parameters that are essential to achieving Tier One status. The suggestion is made on the premise that state funding alone cannot make a university Tier One – private and community support is essential. The proposal avoids the need to pick which universities will be funded to achieve Tier-One status. The proposal motivates and empowers communities to rise to the occasion and to back their local university in a sustained manner if they truly see the benefit of being host to a Tier One university. The state, in partnership with communities and their universities, collectively have the power to advance Texas institutions to Tier One status. The proposed program also presents an opportunity to send a strong message to the nation that Texas is determined to have more Tier One universities, which will help the institutions to attract more talent and more private support.