
D. B. Townsend B. Rosser
25
GNS Science Consultancy Report 2012/15 September 2012 FINAL Canterbury Earthquakes 2010/2011 Port Hills slope stability: Geomorphology mapping for rockfall risk assessment D. B. Townsend B. Rosser GNS Science Consultancy Report 2012/15 September 2012 FINAL Canterbury Earthquakes 2010/2011 Port Hills slope stability: Geomorphology mapping for rockfall risk assessment D. B. Townsend B. Rosser
Transcript of D. B. Townsend B. Rosser
GNS Science Consultancy Report 2012/15September 2012 FINAL
Canterbury Earthquakes 2010/2011Port Hills slope stability: Geomorphologymapping for rockfall risk assessment
D. B. Townsend B. Rosser
GNS Science Consultancy Report 2012/15September 2012 FINAL
Canterbury Earthquakes 2010/2011 Port Hills slope stability: Geomorphology mapping for rockfall risk assessment
D. B. Townsend B. Rosser

DISCLAIMER
This report has been prepared by the Institute of Geological and Nuclear
Sciences Limited (GNS Science) exclusively for and under contract to
Christchurch City Council. The report considers the risk associated with
geological hazards. As there is always uncertainty inherent within the
nature of natural events GNS Science gives no warranties of any kind
concerning its assessment and estimates, including accuracy,
completeness, timelines or fitness for purpose and accepts no
responsibility for any actions taken based on, or reliance placed on them
by any person or organisation other than Christchurch City Council. GNS
Science excludes to the full extent permitted by law any liability to any
person or organisation other than Christchurch City Council for any loss,
damage or expense, direct or indirect, and however caused, whether
through negligence or otherwise, resulting from any person or
organisation's use of, or reliance on this report.
The data presented in this Report are available to GNS Science for
other use after public release of this document.
BIBLIOGRAPHIC REFERENCE
Townsend, D. B.; Rosser, B. 2012. Canterbury Earthquakes
2010/2011 Port Hills slope stability: Geomorphology mapping for
rockfall risk assessment, GNS Science Consultancy Report 2012/15.
21 p + maps (91 p).

GNS Science Consultancy Report 2012/15 i
CONTENTS
EXECUTIVE SUMMARY ....................................................................................................... III
1.0 INTRODUCTION ........................................................................................................ 1
2.0 MAPPING METHODOLOGY ...................................................................................... 2
2.1 Geomorphic maps ......................................................................................................... 4
2.2 Morphology GIS layer .................................................................................................... 6
2.3 Interpreted materials GIS layer ..................................................................................... 6
2.3.1 Rock at/near surface (r) .................................................................................... 7
2.3.2 Talus (t) ............................................................................................................ 8
2.3.3 Colluvium (c) ..................................................................................................... 9
2.3.4 Loess (e) ......................................................................................................... 10
2.3.5 Alluvium .......................................................................................................... 11
2.3.6 Sand and gravel ............................................................................................. 11
2.3.7 Boulders ......................................................................................................... 11
2.3.8 Fill ................................................................................................................... 11
2.3.9 Unknown ......................................................................................................... 11
2.4 Genesis GIS layer ....................................................................................................... 11
2.4.1 Rockfall ........................................................................................................... 11
2.4.2 Dune ............................................................................................................... 12
2.4.3 Beach ............................................................................................................. 12
2.4.4 Rills ................................................................................................................. 12
2.4.5 Terracettes ..................................................................................................... 12
2.4.6 Fan ................................................................................................................. 12
2.4.7 Landslide scar ................................................................................................ 13
2.4.8 Swamp/wetland .............................................................................................. 15
3.0 ACKNOWLEDGEMENTS......................................................................................... 16
4.0 REFERENCES ......................................................................................................... 17

GNS Science Consultancy Report 2012/15 ii
FIGURES
Figure 1 GPS track log of ground verification route. Background map from Land
Information New Zealand Topo50 series. ....................................................................... 3
Figure 2 Locations of outcropping materials noted during April 2-4 ground verification. .............. 3
Figure 3 Confidence of interpreted materials mapped in the Port Hills. ....................................... 4
Figure 4 Example of geomorphic maps presented in Appendix D. The symbols in the
legend are the same for the diagrams in sections 2.2.1 to 2.3.6. The area
shown is just to the east of Lyttelton. .............................................................................. 5
Figure 5 Rock at/near surface appears as blocky, high-contrast areas on the images and
usually forms steep cliffs, typically with a talus apron at the base. These bluffs
are near Wakefield Street (Grid Reference 1579700/5174400). .................................... 7
Figure 6 Talus slopes below rock cliffs about 350 m southwest of Mt Pleasant. These
fresh rockfalls occurred during the February 22nd
2011 Christchurch
Earthquake, but the underlying apron has been built up from many such events
(Grid Reference 1577900/5173400). .............................................................................. 8
Figure 7 Colluvium and scattered boulders in a gully southeast of the main hill (405 m
high) at Rapaki (Grid Reference 1573600/5171900)...................................................... 9
Figure 8 Loess deposits commonly have a distinctive geomorphic expression and erode
to form bad-lands topography, as at Wakefield Street (left) (Grid Reference
1580400/5175300), or more commonly rills and terracettes, such as at Rapaki
(right) (Grid Reference 1573900/5172000). Note also the large boulders lying
on the surface and the break in slope to the debris fan on the right. ...........................10
Figure 9 Colluvial fans forming gently dipping surfaces below steep rock cliffs in the
Heathcote Valley (Grid Reference 1577100/5175000).................................................13
Figure 10 A landslide of shallow earthflow type in the Horotane Valley fills the small gully
in the centre left. The rounded ridges on either side consist of loess. Note also
the large boulders on the valley floor, many of which have fallen from Castle
Rock (to the left, out of the picture) (Grid Reference 1575000/5174300). ...................14
APPENDICES
Appendix 1: Morphology Layer Description ......................................................................................18
Appendix 2: Interpreted Materials Layer Description ........................................................................19
Appendix 3: Genesis Layer Description ............................................................................................20
Appendix 4: Geomorphology Maps ..................................................................................................21
GNS Science Consultancy Report 2012/15 iii
EXECUTIVE SUMMARY
Christchurch City Council requested GNS Science to carry out geomorphic mapping of the
near-surface materials and processes present in the Port Hills of Christchurch. The purpose
of this work is to provide information relating to near-surface geological materials and the
geomorphic processes that formed them. These data are needed as inputs to the rockfall
hazard and risk assessments currently being carried out by GNS Science for Christchurch
City Council. This document and the accompanying maps provide the results of the
geomorphic mapping of rockfall hazard zones for the Port Hills identified by GNS Science
(Massey et al. 2012a,b). The area has been mapped in detail (at a scale of about 1:500)
using aerial photograph mosaics and satellite images, with limited field verification. Three
attributed Geographic Information System (GIS) layers contained within a geodatabase have
been produced: two polygon layers [interpreted materials and genesis] and a polyline layer
[morphology], digitised directly from aerial photograph mosaics and satellite images. This
report contains explanatory descriptions and photographs of the mapping units in the GIS
layers, and copies of the maps produced.

GNS Science Consultancy Report 2012/15 1
1.0 INTRODUCTION
Christchurch City Council requested GNS Science to carry out geomorphic mapping of the
materials and processes present in the Port Hills of Christchurch. The purpose of this work is
to provide information relating to near-surface geological materials and the geomorphic
processes that formed them.
These data are needed as inputs to the hazard and risk assessments carried out by GNS
Science for Christchurch City Council (Massey et al. 2012a,b). The purpose of this report is
to provide the results of the geomorphological mapping. The objectives of this work are to
provide maps:
1. to facilitate the two- and three- dimensional numerical rockfall modelling commissioned
by Christchurch City Council and the Canterbury Earthquake Recovery Authority
(CERA);
2. showing the locations of past (pre 4th September 2010) rockfalls, cliff collapses and
landslides in the Port Hills;
3. for use in the ground truthing of the rockfall and cliff collapse hazard zones contained in
Massey et al. (2012a,b).
The methodology adopted is similar to those used internationally (e.g. Griffiths, 2002;
McMillan and Powell, 1999).
The mapping has been carried out at a scale of about 1:500, using aerial photograph
mosaics, satellite images and digital terrain models, with limited field verification.
The report contains explanatory descriptions and photographs of the mapping units in the
interpreted materials and genesis Geographic Information System (GIS) layers, and the
methodology used to produce them. Descriptions of the units and the criteria used to map
them are presented in Appendices A-C, and the maps are presented in Appendix D.

GNS Science Consultancy Report 2012/15 2
2.0 MAPPING METHODOLOGY
Analysis was performed by assessing landforms (geomorphology), interpreting their origin or
genesis and making assumptions as to the underlying material, as outlined below. Three
attributed GIS layers have been produced: two polygon layers [interpreted materials,
genesis] and a polyline layer [morphology]. These layers were produced by analysis and
digitising directly from aerial photograph mosaics and satellite images, with limited field
verification.
The digitising has been registered most rigorously to the New Zealand Aerial Mapping
(NZAM) aerial photograph mosaic [NZAM_mosaic_03_03_2011], flown about 10 days after
the February 22nd 2011 Christchurch Earthquake, and which has a 10 cm pixel (ground)
resolution. Other useful images include the post-Darfield Earthquake (4th September 2010)
GeoEye image [Christchurch_GeoEye_4-9-10-All_data_Ortho] and the post February 22nd
2011 image [geoeye_27feb11.ecw].
In many areas where there has been extensive modification of the landscape through
building/construction, older stereo pairs of aerial photographs (1940’s – 1980’s) were also
used. These were interpreted using a stereoscope, were rectified onto the base maps using
ArcMap GIS software, and then digitised and attributed. Digital terrain models constructed
from Light Detecting and Ranging (LiDAR) data (2011a, 2011c) were also used to interpret
geomorphic features.
Geomorphological mapping of the Port Hills using the aerial photographs and LiDAR digital
terrain model was completed in April 2012. This included all of the sectors defined by the
Port Hills Geotechnical Group, excluding Diamond Harbour.
Ground verification of mapped units in the pilot study areas was undertaken in December
2011 and January 1012. The remainder of the Port Hills area, as outlined above, was
concluded on 2-4 May 2012. Ground verification consisted of driving the roads in the Port
Hills (Figure 1), especially in areas where extensive modification of the ground surface has
taken place through residential construction. Outcropping materials were noted on 1:5000
scale printed maps (see Figure 2 for locations). The results of the field verification required
some editing of the initially mapped polygons, typically the addition of small regions of
materials not obvious from the aerial photography. These tended mainly to be small outcrops
of rock and/or loess exposed in road cuttings. Also, the extent of loess along the Summit
Road had been overestimated; even though the surface expression of these high elevation
areas was essentially featureless on the photographs, we found that most road cuts were
into rock, commonly with a thin cover of colluvium. Changes to the polygons in the
interpreted materials and genesis layers have been made to reflect the data collected in the
field. Figure 3 shows the overall confidence in the mapping of the interpreted materials.

GNS Science Consultancy Report 2012/15 3
Figure 1 GPS track log of ground verification route. Background map from Land Information New Zealand Topo50 series.
Figure 2 Locations of outcropping materials noted during April 2-4 ground verification.

GNS Science Consultancy Report 2012/15 4
Figure 3 Confidence of interpreted materials mapped in the Port Hills.
2.1 GEOMORPHIC MAPS
A representative result of the geomorphology mapping, as provided in Appendix D, is shown
on Figure 4. The map index and page numbering (inset map) is the same as the rockfall risk
zone maps produced by Massey et al (2012b).

GNS Science Consultancy Report 2012/15 5
Figure 4 Example of geomorphic maps presented in Appendix D. The symbols in the legend are the same for the diagrams in sections 2.2.1 to 2.3.6. The area shown is just to the east of Lyttelton.

GNS Science Consultancy Report 2012/15 6
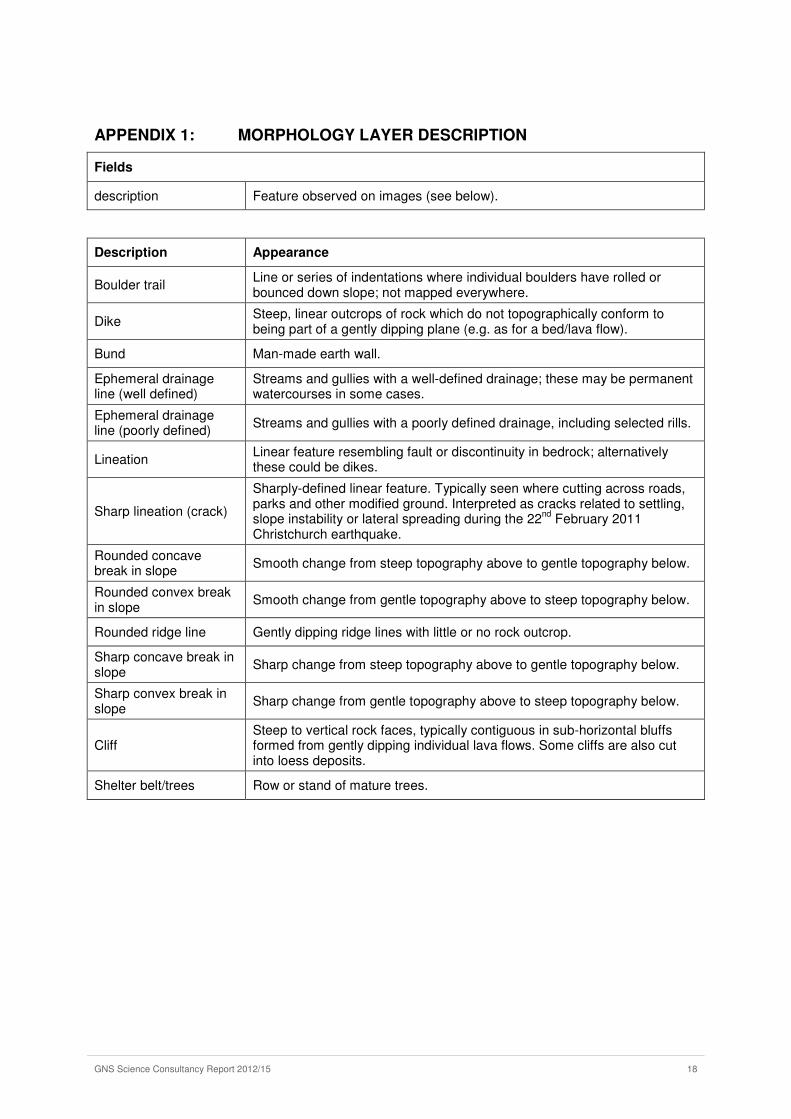
2.2 MORPHOLOGY GIS LAYER
The morphology layer is a polyline shapefile containing linear features such as drainage
lines, recent landslide scarps, cliffs and significant breaks in slope, which are directly
observable from the images. Categories are described in Appendix A.
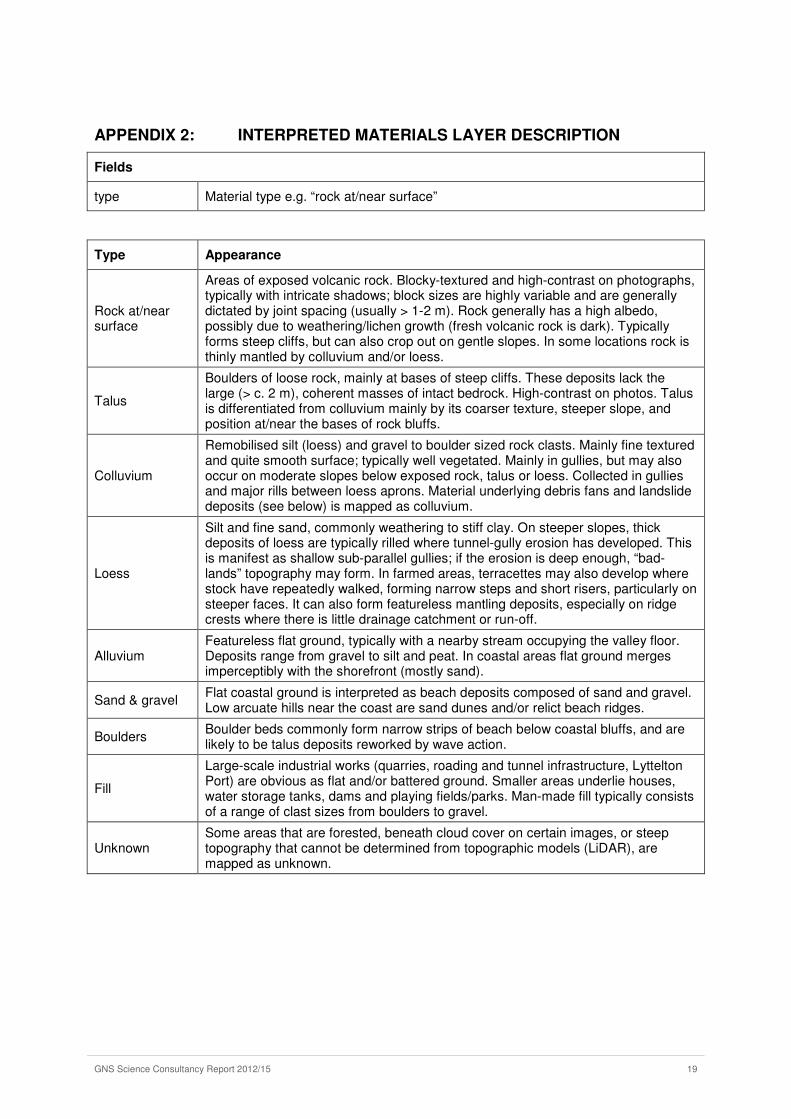
2.3 INTERPRETED MATERIALS GIS LAYER
The interpreted materials GIS layer contains geological information about the substrate or
regolith. The layer has been categorised into several mapping units, using aerial
photographs and LiDAR datasets. The mapping units are based on geomorphic criteria and
were chosen to provide the data needed for rockfall hazard risk assessment of the Port Hills
(Massey et al. 2012b). They are characterised as follows:
• bare ground with high-contrast and interlocking rock blocks of varying sizes is rock
at/near surface (r). The bare ground may in part be thinly mantled e.g. by talus,
colluvium, or loess;
• high-contrast areas composed of smaller interlocking blocks, boulders and cobbles is
talus (t);
• actively accumulating gullies and gentler hill slopes are underlain by colluvium (c).
• rills and terracettes are formed in loess (e);
• flat ground in valley bottoms is underlain by alluvium (al)
• flat coastal ground (commonly built upon) is underlain by sand and gravel or
boulders;
• built-up areas are typically underlain by fill (n);
• areas unable to be determined from images and which have not been field verified are
mapped as unknown.
These units are described, with representative illustrations for the four most extensive map
units, in sections 2.3.1 to 2.3.9. Details of the mapping criteria for each unit are given in
Appendix B.
Illustrations for each key unit (Figure 5 - Figure 10) comprise an un-annotated aerial
photograph (top left), an aerial photograph overlain by the GIS interpreted materials,
morphology and, where appropriate, the genesis layers (top right; see Figure 4 for legend),
and a ground-based photograph (bottom). Arrows on the un-annotated photograph are
approximately the view direction of the ground photo. The scale bar on all aerial photographs
is 50 m and they are oriented with north towards the top. Topographic contours, where
shown, are at 5 m intervals. Approximate grid references for locations are given in New
Zealand Transverse Mercator 2000 projection.

GNS Science Consultancy Report 2012/15 7
2.3.1 Rock at/near surface (r)
Layered flows of volcanic rock form prominent, steep to vertical cliffs in the Port Hills and the
wider Banks Peninsula area (e.g. Figure 5). Rocks also crop out on rounded spur/ridge tops,
sometimes with a thin covering of loess and/or colluvium. The “slope greater than 35
degrees” terrain analysis layer agrees well with the distribution of cliffs and bluffs, but rock
can also occur at the surface on gentler terrain. Thus, while most areas of slope >35° will be
rock at the surface (apart from a few cliffs cut into loess), it will not include all areas of
exposed rock.
Figure 5 Rock at/near surface appears as blocky, high-contrast areas on the images and usually forms steep cliffs, typically with a talus apron at the base. These bluffs are near Wakefield Street (Grid Reference 1579700/5174400).

GNS Science Consultancy Report 2012/15 8
2.3.2 Talus (t)
Scree and talus consisting of loose blocks of remobilised rock commonly form aprons at the
bases of steep cliffs and other rock exposures (e.g. Figure 6). This unit includes some of the
more extensive recent rockfall deposits (see below). Areas of talus merge with colluvium and
therefore boundaries are only approximate. Talus commonly forms steeper slopes than
colluvium, and there is usually a concave break in slope at the boundary between the two.
Figure 6 Talus slopes below rock cliffs about 350 m southwest of Mt Pleasant. These fresh rockfalls occurred during the February 22
nd 2011 Christchurch Earthquake, but the underlying apron has been built up from
many such events (Grid Reference 1577900/5173400).

GNS Science Consultancy Report 2012/15 9
2.3.3 Colluvium (c)
Colluvium and shallow landslide (debris flow) debris has collected in many gullies and on
steeper faces below cliffs (e.g. Figure 7). It includes undifferentiated shallow landslide debris
in chutes (trails) and on steep faces, and the run-out area of shallow loess slides and/or
debris flows. Colluvium is composed mainly of remobilised soil, silt (loess) and gravel to
boulder sized rock clasts. It is generally the source for materials building the areas mapped
as debris fans (see below).
Figure 7 Colluvium and scattered boulders in a gully southeast of the main hill (405 m high) at Rapaki (Grid Reference 1573600/5171900).

GNS Science Consultancy Report 2012/15 10
2.3.4 Loess (e)
Loess is present as a mantling deposit of silt to fine sand on many of the mid-lower elevation
slopes (e.g. Figure 5, Figure 7, Figure 8, Figure 9, Figure 10), and on the flat plateaus at the
tops of ridges. Loess deposits on the Port Hills may be several metres thick; it typically
becomes rilled by erosion on steeper slopes.
Figure 8 Loess deposits commonly have a distinctive geomorphic expression and erode to form bad-lands topography, as at Wakefield Street (left) (Grid Reference 1580400/5175300), or more commonly rills and terracettes, such as at Rapaki (right) (Grid Reference 1573900/5172000). Note also the large boulders lying on the surface and the break in slope to the debris fan on the right.

GNS Science Consultancy Report 2012/15 11
2.3.5 Alluvium
Alluvium is interpreted to underlie flat valley floors and coastal areas adjacent to headlands.
Deposits include boulders, gravel, sand, silt and peat. In reality, much of this mapping unit
has been modified to some extent by fill and/or drainage works.
2.3.6 Sand and gravel
Flat ground adjacent to the coast in sheltered areas is interpreted as having formed by
marine and marginal marine processes, and therefore underlain by sand and gravel. The
majority of this mapping unit has been built upon as it provides ideal land for urban
development.
2.3.7 Boulders
Exposed coastal land especially below rock cliffs is commonly comprised of boulders. The
boulders are typically about 1-5 m in diameter and are likely to be talus deposits that have
been sorted by wave action.
2.3.8 Fill
Land modified by human impact where it is not possible to accurately assess the underlying
material is mapped as fill. In many areas an attempt has been made to determine the nature
of the substrate, which is attributed accordingly. This unit includes both man-made fill
(boulders to gravel) and in some cases excavated ground, where the distinction cannot be
made.
2.3.9 Unknown
Some areas have not been classifiable into material type. This is due mainly to cloud or tree
cover obscuring the ground surface, and/or the contour and LiDAR models not providing
enough resolution to interpret the landscape-forming material.
2.4 GENESIS GIS LAYER
The genesis layer was digitised to map the surface geomorphological processes, many of
which are directly observable from the images. These are described in sections 2.3.1 to 2.3.6
and are summarised in Appendix C. Mapped processes are not mutually exclusive – they
may overlap spatially (e.g. scattered boulders may overlap an area of loess rilling).
2.4.1 Rockfall
There are many areas of rockfall in the Port Hills, ranging from recent to older deposits.
These have been subdivided into:

GNS Science Consultancy Report 2012/15 12
Rockfall (recent)
Recent rockfalls are interpreted as having occurred as a result of the Canterbury
earthquakes. They are denoted by: 1) concentrated areas of boulders (including some
retaining wall collapses) which are demonstrably absent on pre- 22nd February 2011 images;
and/or 2) concentrated area of boulders intermixed with soil; and/or 3) concentrated area of
boulders with fresh/unweathered appearance that may be traced up-slope to
unweathered/freshly-exposed rock face; or 4) areas of boulder trails and flattened
vegetation/grass. Source area is almost always in rock.
Rockfall (many scattered boulders)
Area occupied by “many” boulders, typically close to a rock source. The boulder
concentration is generally 1 every 2-10 m.
Rockfall (few scattered boulders)
Area occupied by a “few” boulders, typically close to a rock source. The boulder
concentration is generally 1 every 10-50 m.
2.4.2 Dune
Sand dunes are preserved across some of the low topography at valley mouths (e.g.
Sumner, Monck’s Bay, Taylor’s Mistake) adjacent to the coast. The dunes are composed
primarily of well sorted sand.
2.4.3 Beach
Beach deposits include areas of sand and gravel, and boulders. These typically form flat
ground adjacent to the coast, and sand or boulder beaches on headlands exposed at low
tide.
2.4.4 Rills
Tunnel-gully erosion and rilling forms multiple, sub-parallel channels typically 1-5 m deep,
and deeper erosion forms bad-lands canyons. These erosion features are indicative of loess
deposits. Rilling commonly occurs on mid-gradient slopes formed in loess and is usually
absent on ridge crests.
2.4.5 Terracettes
Terracing by stock commonly forms in steeper topography underlain by loess. These
terracettes are manifest as narrow terraces (2-5 m apart in map view) with low risers
(between about 1 and 2 every vertical metre).
2.4.6 Fan
Fans, consisting of multiple debris flows of remobilised loess, colluvium and minor alluvial
gravel (i.e. colluvium), commonly develop below the steeper valleys (e.g. Figure 9). These
fans are distinguished from areas of undifferentiated colluvium mainly by their conical or
lobate shape and are interpreted as areas of deposition. The fan “apex” points towards the
source area, which is typically a side valley formed in steeper terrain where colluvium, talus
and loess have previously accumulated.

GNS Science Consultancy Report 2012/15 13
Figure 9 Colluvial fans forming gently dipping surfaces below steep rock cliffs in the Heathcote Valley (Grid Reference 1577100/5175000).
2.4.7 Landslide scar
The term “scar” relates to the landslide source area and associated deposits. These are
indicative of mass-movement processes. Deep-seated landslides are relatively uncommon
on the Port Hills; only a few minor rotational slides and slumps have been noted. Adopting
the classification of Cruden and Varnes (1996), the vast majority of “landslides” in the Port
Hills are debris flow or earthflow type (e.g. Figure 10), involving relatively shallow slides
(several metres deep) and slumps initiated in loess and/or colluvium. The landslide deposits
therefore, are typically broken up mixtures of the materials in which they originated.
Landslide scars are classified in the genesis layer as “recent” or “relict”.

GNS Science Consultancy Report 2012/15 14
Landslide scar (recent)
For recent landslides, where the headscarp and debris areas can be differentiated, deposits
are mapped as colluvium and the scarp area is mapped as the source material in the
interpreted materials layer.
Landslide scar (relict)
Relict landslide scars include potentially older deposits where there is reason to suspect a
landslide (e.g. hummocky topography), but which cannot always be attributed directly to a
source area and the scarp may have been degraded.
Figure 10 A landslide of shallow earthflow type in the Horotane Valley fills the small gully in the centre left. The rounded ridges on either side consist of loess. Note also the large boulders on the valley floor, many of which have fallen from Castle Rock (to the left, out of the picture) (Grid Reference 1575000/5174300).

GNS Science Consultancy Report 2012/15 15
2.4.8 Swamp/wetland
Few areas of swamp remain; some were noted on older aerial photographs, but most have
been drained and filled in. Deposits include peat and to a lesser extent gravel, sand and silt.

GNS Science Consultancy Report 2012/15 16
3.0 ACKNOWLEDGEMENTS
This work was funded by Christchurch City Council. Thanks to Fred Baynes, Chris Massey
and Nicola Litchfield for their reviews, which greatly improved this report. Thanks also to
Russ Van Dissen for assistance with fieldwork, and review of the updated report.

GNS Science Consultancy Report 2012/15 17
4.0 REFERENCES
Cruden, D. M. & Varnes, D. J. 1996. Landslide types and processes. In: Landslide:
investigation and mitigation. Turner, K. A. & Schuster, R. L. editors. Special report,
Transportation Research Board, National Research Council, 247. Chapter 3, 36-75.
Griffiths, J.S. (compiler). 2002. Mapping in Engineering Geology. Geological Society of
London – Key Issues in Earth Sciences. Published by the Geological Society of
London 17th July 2002. Pp. 294.
McMillan, A.A., Powell, J.H. 1999. BGS Rock Classification Scheme Volume 4 Classification
of artificial (man-made) ground and natural superficial deposits –– applications to
geological maps and datasets in the UK British Geological Survey Research Report,
RR 99–04.
Massey, C.I., McSaveney, M.J., Heron, D., Lukovic, B. 2012a. Canterbury Earthquakes
2010/11 Port Hills Slope Stability: Pilot study for assessing life-safety risk from
rockfalls (boulder rolls). GNS Science Consultancy Report 2011/311.
Massey, C.I., McSaveney, M.J., Lukovic, B., Heron, D., Moore, A., Dellow, G., Carey, J.
2012b. Canterbury Earthquakes 2010/11 Port Hills Slope Stability: Assessing life-
safety risk from rockfalls (boulder rolls) in the Port Hills. GNS Science Consultancy
Report 2012/123.
GNS Science Consultancy Report 2012/15 18
APPENDIX 1: MORPHOLOGY LAYER DESCRIPTION
Fields
description Feature observed on images (see below).
Description Appearance
Boulder trail Line or series of indentations where individual boulders have rolled or bounced down slope; not mapped everywhere.
Dike Steep, linear outcrops of rock which do not topographically conform to being part of a gently dipping plane (e.g. as for a bed/lava flow).
Bund Man-made earth wall.
Ephemeral drainage line (well defined)
Streams and gullies with a well-defined drainage; these may be permanent watercourses in some cases.
Ephemeral drainage line (poorly defined)
Streams and gullies with a poorly defined drainage, including selected rills.
Lineation Linear feature resembling fault or discontinuity in bedrock; alternatively these could be dikes.
Sharp lineation (crack)
Sharply-defined linear feature. Typically seen where cutting across roads, parks and other modified ground. Interpreted as cracks related to settling, slope instability or lateral spreading during the 22
nd February 2011
Christchurch earthquake.
Rounded concave break in slope
Smooth change from steep topography above to gentle topography below.
Rounded convex break in slope
Smooth change from gentle topography above to steep topography below.
Rounded ridge line Gently dipping ridge lines with little or no rock outcrop.
Sharp concave break in slope
Sharp change from steep topography above to gentle topography below.
Sharp convex break in slope
Sharp change from gentle topography above to steep topography below.
Cliff Steep to vertical rock faces, typically contiguous in sub-horizontal bluffs formed from gently dipping individual lava flows. Some cliffs are also cut into loess deposits.
Shelter belt/trees Row or stand of mature trees.
GNS Science Consultancy Report 2012/15 19
APPENDIX 2: INTERPRETED MATERIALS LAYER DESCRIPTION
Fields
type Material type e.g. “rock at/near surface”
Type Appearance
Rock at/near surface
Areas of exposed volcanic rock. Blocky-textured and high-contrast on photographs, typically with intricate shadows; block sizes are highly variable and are generally dictated by joint spacing (usually > 1-2 m). Rock generally has a high albedo, possibly due to weathering/lichen growth (fresh volcanic rock is dark). Typically forms steep cliffs, but can also crop out on gentle slopes. In some locations rock is thinly mantled by colluvium and/or loess.
Talus
Boulders of loose rock, mainly at bases of steep cliffs. These deposits lack the large (> c. 2 m), coherent masses of intact bedrock. High-contrast on photos. Talus is differentiated from colluvium mainly by its coarser texture, steeper slope, and position at/near the bases of rock bluffs.
Colluvium
Remobilised silt (loess) and gravel to boulder sized rock clasts. Mainly fine textured and quite smooth surface; typically well vegetated. Mainly in gullies, but may also occur on moderate slopes below exposed rock, talus or loess. Collected in gullies and major rills between loess aprons. Material underlying debris fans and landslide deposits (see below) is mapped as colluvium.
Loess
Silt and fine sand, commonly weathering to stiff clay. On steeper slopes, thick deposits of loess are typically rilled where tunnel-gully erosion has developed. This is manifest as shallow sub-parallel gullies; if the erosion is deep enough, “bad-lands” topography may form. In farmed areas, terracettes may also develop where stock have repeatedly walked, forming narrow steps and short risers, particularly on steeper faces. It can also form featureless mantling deposits, especially on ridge crests where there is little drainage catchment or run-off.
Alluvium Featureless flat ground, typically with a nearby stream occupying the valley floor. Deposits range from gravel to silt and peat. In coastal areas flat ground merges imperceptibly with the shorefront (mostly sand).
Sand & gravel Flat coastal ground is interpreted as beach deposits composed of sand and gravel. Low arcuate hills near the coast are sand dunes and/or relict beach ridges.
Boulders Boulder beds commonly form narrow strips of beach below coastal bluffs, and are likely to be talus deposits reworked by wave action.
Fill
Large-scale industrial works (quarries, roading and tunnel infrastructure, Lyttelton Port) are obvious as flat and/or battered ground. Smaller areas underlie houses, water storage tanks, dams and playing fields/parks. Man-made fill typically consists of a range of clast sizes from boulders to gravel.
Unknown Some areas that are forested, beneath cloud cover on certain images, or steep topography that cannot be determined from topographic models (LiDAR), are mapped as unknown.

GNS Science Consultancy Report 2012/15 20
APPENDIX 3: GENESIS LAYER DESCRIPTION
Fields
type Genesis or process type, e.g. “Rockfall (recent)”
Type Appearance
Rockfall (recent)
Generally high concentration of boulders in run-out zone; fresh (unweathered) rock scar evident in source area; typically appears brown-orange due to intermixed soil; some boulder trails visible as flattened vegetation or pock-marks; most recent rockfalls in the Port Hills were from the 22
nd February 2011 aftershock and are not
present on 4th September 2010 GeoEye satellite image.
Rockfall (many scattered boulders)
Local piles of talus and high concentrations (1 every 2-10 m) of boulders; primarily below rock cliffs.
Rockfall (few scattered boulders)
Low concentration (1 every 10-50 m) of scattered boulders.
Dune Dunes composed of sand form a low-amplitude (1-2 m high), 100-150 m wide subdued, curved strip across the valley, generally sub-parallel to the modern coast. There is usually a gap where the local stream has cut through.
Beach Narrow strip of sand and gravel (in sheltered areas) to boulders (usually below coastal cliffs). May include some estuarine and alluvial deposits. Some beach ridges apparent as low arcuate hills similar to dunes.
Rills / terracettes
Multiple shallow gullies (rills) and small steps/stock tracks (terracettes). Deeper rilling forms bad-lands erosion canyons.
Fans
Typically rounded or conical lobes at the bases of narrow (side) valleys composed of remobilised silt (loess) and rock (colluvium and debris flow deposits); source usually obvious with colluvium in catchment. Surface texture can be hummocky, but more often smooth; gentler slope than colluvium or loess-covered slopes.
Landslide scar
Includes landslide source area and debris. Steep, hummocky ground, commonly with ponds and localised areas of poor drainage. Run-out area (debris train) may merge with colluvium/debris fan (possibly from secondary debris flows off the toe). Deposits typically consist of shattered mixtures of cobbles and boulders to clay and silt sized clasts. Usually initiated in loess or colluvium, occasionally rock. Categorised into:
Recent: head scarp usually distinguishable from debris. Scarp area mapped as underlying material, debris mapped as colluvium.
Relict: hummocky ground, but may be blanketed with loess (older) and head scarp degraded/eroded; mapped as colluvium.
Swamp/wetland Flat, waterlogged ground, usually underlain by peat, with minor alluvial gravels and silt. Swamps commonly have a lower albedo than surrounding areas, and typically richer vegetation.


![Intermarriage & Other Familiestownsend/tree/intermarriage.pdfAnne Knolles m. 1706 Philip Townsend [500] b. 1700 d. 1786 Elizabeth Hungerford m. 1733 Richard Townsend [201] b. 1684](https://static.fdocuments.in/doc/165x107/61240dd8596b44056d0822a4/intermarriage-other-townsendtreeintermarriagepdf-anne-knolles-m-1706-philip.jpg)


![Richard Townsend [315] - UW Madison Astronomy …townsend/tree/scrapbooks/315.pdf* Hungerford connections with Barbara Townsend [210] and Richard Townsend [315]. ** Catherine daughter](https://static.fdocuments.in/doc/165x107/5fe02ca86168ca636365ffc9/richard-townsend-315-uw-madison-astronomy-townsendtreescrapbooks315pdf-.jpg)
