Code of Conduct2010 GTP Englisch - GTP | Global Tungsten ...

CZECH TECHNICAL UNIVERSITY IN PRAGUE
FACULTY OF TRANSPORTATION SCIENCES
Bc. Libor Zohn
DETECTION OF PERSONS IN A VEHICLE USING IR CAMERAS
Diploma thesis
2016


ACKNOWLEDGEMENT
I would like to express my gratitude to my supervisor Ing. Jana Kaliková, Ph.D. for the useful
comments and remarks. Furthermore, I would like to thank my family – my parents for
allowing me to study on university and my sister for her support. And I must not forget my
girlfriend for supporting me and standing by me in hard times, when deadline was coming
closer and closer.
ABSTRACT
Goal of this diploma thesis is to find out if it is even possible to detect people in a vehicle,
which method will be the best for this purpose and its connection to the emergency system
eCall. First chapters serve as an introduction to the issue and are more likely just devising
possible ways how to fulfill that task as the best. There was chosen a face detection through
thermocameras for detection people in the vehicle. There were selected possible spots
where to locate thermocamera to cover the whole cabin of the car, object detection algorithm
and in the end testing was performed.
KEY WORDS
eCall
Thermal Imager Fluke TiR
Face detection
Viola-Jones Algorithm
System design

Content
1. List of abbreviations .......................................................................................................... 10
2. Introduction ....................................................................................................................... 12
3. eCall .................................................................................................................................. 13
3.1. How does eCall work ................................................................................................. 13
4. Possible ways of detection ............................................................................................... 18
4.1. Pressure sensors ....................................................................................................... 18
4.2. Seat belts sensors ..................................................................................................... 19
4.3. Combination of pressure sensors and a numeric code ............................................ 21
4.4. Camera with face detection ....................................................................................... 21
4.5. Systems with motion detection .................................................................................. 23
PIR sensors ....................................................................................................................... 23
US sensors ........................................................................................................................ 23
MW sensors ...................................................................................................................... 24
Dual sensors ..................................................................................................................... 24
4.6. Thermocamera with face detection ........................................................................... 25
4.6.1. Principles of thermovision .................................................................................. 26
4.6.2. Theoretical basics of thermography measurement ........................................... 27
4.6.3. The measurement principle................................................................................ 28
4.6.4. Influence of temperature on the thermogram of human faces .......................... 29
4.7. Electromagnetic chips ............................................................................................... 32
4.8. Systems outside of the vehicle .................................................................................. 33
5. Hardware ........................................................................................................................... 36
5.1. Thermal Imager Fluke TiR ......................................................................................... 36
5.2. Citroen Xantia 2.1 Turbo D ........................................................................................ 36
6. Face detection algorithms ................................................................................................. 37
6.1. Viola-Jones detection algorithm ................................................................................ 37
6.1.1. Integral image ..................................................................................................... 37

6.1.2. Haar wavelets ..................................................................................................... 39
6.1.3. AdaBoost (Adaptive Boosting) ........................................................................... 40
6.2. Alternatives ................................................................................................................ 42
Model-based face tracking ................................................................................................ 42
Neural network .................................................................................................................. 43
PRACTICAL PART................................................................................................................... 44
7. System design................................................................................................................... 44
7.1. System elements ....................................................................................................... 44
7.2. Relations .................................................................................................................... 45
7.3. Processes .................................................................................................................. 45
7.4. System identity .......................................................................................................... 45
7.5. System competence .................................................................................................. 46
7.6. System ethics ............................................................................................................ 46
8. Position of thermocameras in the car ............................................................................... 47
8.1. Detection of adults and kids ...................................................................................... 47
8.1.1. One TC in rear-view mirror................................................................................. 47
8.1.2. Two TCs in rear view mirror ............................................................................... 48
8.1.3. First TC located in A slope, Second TC located in rear-view mirror ................. 49
8.1.4. First TC located in dashboard, Second TC located in rear-view mirror ............ 51
8.2. Detection of babies .................................................................................................... 52
9. Algorithm ........................................................................................................................... 54
9.1. Matlab code ............................................................................................................... 55
9.2. Outcomes................................................................................................................... 56
10. Conclusion ..................................................................................................................... 64
11. Sources ......................................................................................................................... 65
12. Attachments................................................................................................................... 69
Act no. 361/2000 Coll., On Traffic on the Road Network and on Changing Certain Acts ... 69
Description of Thermal Imager FLUKE TiR ......................................................................... 70

Proportions of the car ........................................................................................................... 71
Emissivity table ..................................................................................................................... 72
General specification of the Thermal Imager Fluke TiR ...................................................... 73
Detailed specification of the Thermal Imager Fluke TiR ...................................................... 75
13. List of pictures ............................................................................................................... 77
14. List of tables .................................................................................................................. 78
15. List of attachments ........................................................................................................ 79

10
1. List of abbreviations
CTU – Czech technical university in Prague
IRS – Integrated rescue system
EU – European Union
eCall – Emergency Call
OBU – On-board unit
MSD – Minimum set of data
PSAP – Public-safety answering point
GSM – Global System for Mobile Communications (originally Groupe Spécial
Mobile)
GTP – Global Telematics Protocol
ACP – Application Communication Protocol
GATS – Global Automotive Telematics Standard
ERTICO – Partnership of around 100 companies and institutions involved in ITS
Europe
OTAP – Over-the-air protocol
ETSI EMTEL – Emergency Communications
IVS – In-vehicle system
MS – Mobile station (e.g. GSM modulus)
MNO – Mobile network operator
PIR – Passive Infra Red
US – Ultrasonic

11
MW – Microwave
LCD – Liquid Crystal Display
NIR – Near Infrared
SW – Short wave
LW – Long wave
RFID – Radio Frequency Identification
IR – Infra Red
AdaBoost – Adaptive Boosting
TC – Thermovision camera
PASU – Photo analysis software unit

12
2. Introduction
The main aim of the thesis "Detection of people in a car," is to find the most suitable method
for the detection of passengers and determine their exact number in the cab car. Detection in
cars is more or less uncharted territory, where the only attempts take place in the USA. The
US government need this to ensure that the lanes for cars with multiple passengers are
actually used by these cars. For this purpose, there were used systems that were outside of
the car. However, this goal can be achieved in many other (better) ways in which the
detection system is located on board of the vehicle. As already noted, due to the small
exploration of this issue, the beginning of the theoretical part, where possible ways of
detection are written down, is rather like my own reflections and thoughts on these options.
Some possibilities of detection methods are better than others, some more technically
challenging than others. We must compare the pros and cons of every conceivable
methodology to choose the best and then test it in practice. The reason for this exploration is
to facilitate the work of the Integrated Rescue System (IRS) in crash accidents. In the event
of a crash accident, it is planned to use the detection of passengers and with "on-board unit"
(OBU) to launch the so-called. "Emergency Call" (eCall). It notifies rescue units not only that
the accident occurred, but also sends the exact number of passengers, which could be
potential victims, or injured. Then they can be better prepared for the future situation at the
crash site, they will have to deal with. Alternatively, there can be sent additional troops IRS if
the OBU sends information about a larger number of passengers involved in an accident.
This system could help save lives or health of individuals.

13
3. eCall
Intelligent transport system called eCall (pan-European in-vehicle emergency call system
which uses the European emergency number 112 to transmitting information about accident
when it´s detected) is a European Commission project and Czech Republic is one of the nine
countries, where it´s tested. CTU and their experts are one of the partners in this testing.
Many people are afraid of misuse of this system, because of government (or another state or
private agency) spying on their citizens. People don´t trust that eCall isn´t tracking system
something like in novel 1984 by George Orwell. Expert Zdeněk Lokaj from CTU says that “It
is not a tracking system, but a security system. Humans can be traced by simpler ways -
mobile phones, camera systems etc. Therefore, I have feeling that the impact of eCall to the
privacy is greatly overrated.“[1]
3.1. How does eCall work
eCall system in case of a serious accident automatically dials united European emergency
number 112 and notifies the rescue forces of the exact position of the crashed car. This call
is activated either automatically by in-vehicle sensors or manually. eCall transfers a file of
information (especially the position of the vehicle and its type) and initiates a voice
connection between the vehicle crew and the operator of emergency service.[2]
It is expected that the security system eCall will reduce the number of fatal accidents in the
EU and the seriousness of injuries caused by road accidents. Thanks to the knowledge of
the exact location of the crash site the emergency response time is cut by 50 % in rural and
by 40 % in urban areas and the consequences of injuries are reduced by 15 %. Per year
eCall system can save up to 2500 lives in the EU.[1]
Original release date was 1st October 2015, but this deadline was moved to the April 2018 by
the verdict of the European Parliament.[3]
Pic. 1: Basic graphical representation of eCall [4]
14
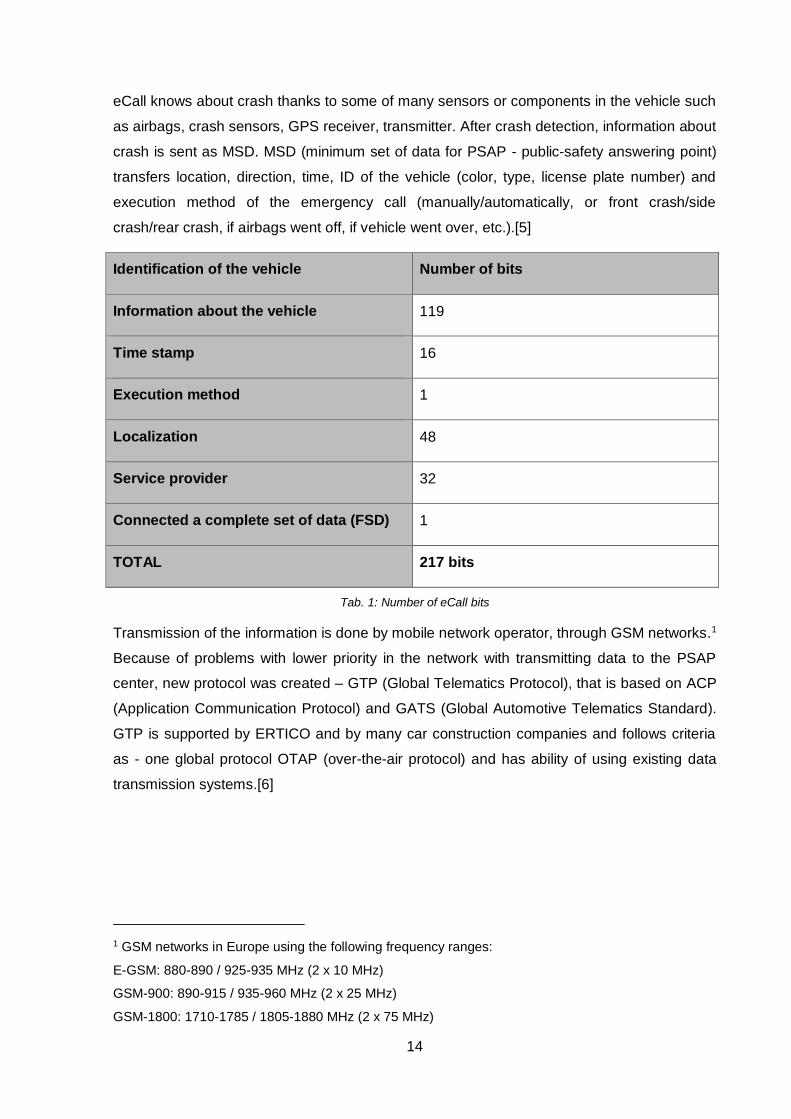
eCall knows about crash thanks to some of many sensors or components in the vehicle such
as airbags, crash sensors, GPS receiver, transmitter. After crash detection, information about
crash is sent as MSD. MSD (minimum set of data for PSAP - public-safety answering point)
transfers location, direction, time, ID of the vehicle (color, type, license plate number) and
execution method of the emergency call (manually/automatically, or front crash/side
crash/rear crash, if airbags went off, if vehicle went over, etc.).[5]
Identification of the vehicle Number of bits
Information about the vehicle 119
Time stamp 16
Execution method 1
Localization 48
Service provider 32
Connected a complete set of data (FSD) 1
TOTAL 217 bits
Tab. 1: Number of eCall bits
Transmission of the information is done by mobile network operator, through GSM networks.1
Because of problems with lower priority in the network with transmitting data to the PSAP
center, new protocol was created – GTP (Global Telematics Protocol), that is based on ACP
(Application Communication Protocol) and GATS (Global Automotive Telematics Standard).
GTP is supported by ERTICO and by many car construction companies and follows criteria
as - one global protocol OTAP (over-the-air protocol) and has ability of using existing data
transmission systems.[6]
1 GSM networks in Europe using the following frequency ranges:
E-GSM: 880-890 / 925-935 MHz (2 x 10 MHz)
GSM-900: 890-915 / 935-960 MHz (2 x 25 MHz)
GSM-1800: 1710-1785 / 1805-1880 MHz (2 x 75 MHz)

15
Pic. 2: Recommended E-call solution [6]
In this diagram we can see recommended eCall solution with every possible interaction.
eCall is a part of ETSI EMTEL (Emergency Communications - EMTEL - addresses a broad
spectrum of aspects related to the use of telecom services in emergency situations.) EMTEL
is used in various situations from everyday incidents like traffic accidents or assault, to major
incidents like airplane crashes or forest fires, to major disasters such as earthquakes or
large-scale terrorist attacks. ETSI is currently defining the four main areas of emergency
communications:
communication from citizens to authorities/organizations (emergency calls)
communication between authorities/organizations (public safety communications)
communication from authorities/organizations to citizens (warning systems)
communication amongst citizens during emergencies
For this purpose, there are used dedicated networks and equipment, often different for
different services, including integrated services with the public telecommunications services
(terrestrial and satellite radio/TV broadcasting and Internet services). This helps to inform
general public, in particular in hazardous and disaster situations.[7]
The following diagram describes how eCall emergency call works. It describes individual
parts of the eCall function, what IVS sends and receives, how the connection with operators
is done and when IVS gets feedback. eCall function has two layers – voice connection

16
between passengers and PSAP and data flow (MSD) between IVS and PSAP. Attempt for
voice connection starts immediately when crash sensors detect crash, IVS requests to call
112, mobile station (e.g. GSM modulus) located in the vehicle creates emergency call.
Mobile network provider (e.g. O2, which was partner in eCall testing in the Czech Republic)
redirects this emergency call to PSAP 1. This basically is only modem that receives data.
PSAP 1 redirects the call to PSAP 2, where an operator is. Voice communication is now
established and operator is sending emergency units to the crash site (in some cases, voice
communication is established, but all passengers are passed out, so no additional
information from the passengers are given). Operator has callback option to the vehicle,
either on the vehicle unit, or another number given by the crew of the vehicle. Data flow is
basically same, but voice communication is replaced with sending minimum set of data
(MSD). There is one little difference, that IVS gets feedback from PSAP about receiving
data.[5]
Pic. 3: eCall functions [5]

17
IVS In-vehicle system
MS mobile station (e.g. GSM modulus)
MSD minimum set of data
MNO mobile network operator
O2 mobile network operator
PSAP Public Service Answering Point
Centre receiving distress calls
Human operator decides, which unit should be sent (Medics, Fire brigade, Police)
This centre should be in every larger city or area
In the Czech Republic there are 14 centres (in every region)
Tab. 2: Shortcuts for eCall
European standardization CEN/TC278
15722 eCall minimum set of data
16072 eCall Pan European operating requirements
16062 eCall High level application protocol
16102 eCall TPSP (Third Party Service Provider – BMW, Audi, Volvo, etc.) eCall
16405 HGV optional additional data
16454 eCall End to end conformance testing[5]

18
4. Possible ways of detection
In the following chapters there will be described in greater details the possible ways of
detecting people in a car, a brief description of their pros and cons and if a method meets or
does not meet our needs. Next chapters are more brainstorming than anything else.
4.1. Pressure sensors
These sensors are located in the seats of motor vehicles, which are used to determine if the
seats are occupied by passengers or not. All of us have met a similar system in the form of
personal scales. Pressure from our body is converted to the weight on personal scales. Such
information is not necessary to know for pressure sensors so OBU receives information only
– 1 (occupied) or 0 (vacant). Most often, these sensors are featured only in front seats of
cars or vans. This system is almost in each new made car so costs to detect people with
pressure sensors be low. Nevertheless, it has one major flaw and that is if on the seat with a
pressure sensor is put any tangible object, the system recognizes this as it is occupied by a
passenger. For this reason, this system appears to our use as unsatisfactory.
Pic. 4: Pressure seat sensor from Mercedenz-Benz class A [8]
One of interesting things is that modern pressure sensors in the seat can detect the unique
print of the bottom. With this new technology, there may be a new way of securing a motor
vehicle against theft. OBU in your car know your (or any another person with permission to
drive your car) bottomprint, that will be used as a key. Anyone who is not in the database,
engine will not start, lock the car and call security service. A similar system of pressure
sensors is tested for the legs, which should serve as the key to the room.[9]

19
Pic. 5: Foot pressure measurement to obtain permission to enter the room [10]
4.2. Seat belts sensors
The safety belt is a device belonging to the safety restraint systems used in motor vehicles,
which aim is to increase passenger´s safety and reduce consequences from the traffic
accidents. It is a textile belt rigidly connected to the vehicle bodywork at several points. Belts
are due to the number of strapped points divided from two-point belts up to the seven-point
belts. In the cars there are most commonly found three-point belts, however on the middle
rear seat (if the car has any) there is in the most cases only two-point. The task of the safety
belts is that in a case of accident it captures a strapped body of the person in the seat, so
that the person is prevented from the uncontrolled movement and impacts in the vehicle
interior, or its ejection or falling out of the vehicle.[11]
Pic. 6: Classic three-point seat belts system [12]

20
In modern motor vehicles, automatic seat belts in "female" terminal equipped with a sensor to
recognize if the belt is turned on or turned off. In combination with pressure sensors that
have been discussed in the previous chapter, on-board computer determines whether on a
given seat is a tangible object, and if so, will provide visual and audio warnings for seatbelt.
Pic. 7: Combination of the pressure sensor and the sensor in the seat belt [13]
Use of seat belts is regulated by Act no. 361/2000 Coll., On Traffic on the Road Network and
on Changing Certain Acts. The responsibility of the driver, among other things, is according
to the first rule of § 6 – driver must be strapped in the seat belt while driving, if seat is fitted
with seat belt under a special regulation. This paragraph also regulates the transportation of
a child under three years and/or less than 150 cm and its weight is not exceeding 36 kg. This
passenger should be placed in a child seat, which corresponds to its weight and physical
dimensions. If body weight exceeds 36 kg or physical height exceeds 150 cm the child must
use restraint safety system. Also the driver must instruct other transported people about the
obligation to use restraint safety system. The foregoing provision is regulated by second rule,
which states that the obligation to be strapped with safety belts shall not apply to the driver
when reversing, the driver who cannot use a safety belt for medical reasons and drivers of
security forces, armed forces, military intelligence, and other similar security and rescue
forces during official duties. The reason is that the seat belt prevents in a quick exit from the
vehicle. This obligation also does not apply to the teachers in driving school.
Another paragraph regulating use of safety restraint system is § 9. It states that except the
driver, also transported person is required to be strapped in the seat belt while riding in a car,
but this does not apply to a person older than 18 years and less than 150 cm and a person
who cannot do it because of the health reasons on the basis of a medical certificate (this

21
certificate must be with this person while travelling and validity lasts maximum period of one
year).
Because of these paragraphs and especially the fact that some people do not like (see table
no. 3) being attach to the seat belt (even under threat of fines up to 2.000,- CZK and
removing 3 pts in the points system – maximum is 12 pts), the use of seat belt detectors as
detector of the number of passengers in the motor vehicle is unsatisfactory.
Type of road never, rarely, sometimes
often, very often
always do not know / car is not equipped
Highway 7,3 % 13,8 % 74,6 % 4,3 %
Main road 10,6 % 18,7 % 68,6 % 2,1 %
Minor road 17,0 % 22,7 % 58,4 % 1,9 %
In a town 27,4 % 24,1 % 46,6 % 1,9 %
Tab. 3.: Use of seat belts on various types of roads in 2002 [15]
4.3. Combination of pressure sensors and a numeric code
This is non-automatic, manual problem solving when each seat in the vehicle is equipped
with its own pressure sensor. After the passengers enter in the vehicle and before starting
the engine, the driver would have to enter the number of passengers on the keyboard
somewhere on the dashboard. Then on-board unit would check the number entered against
the number of triggered pressure sensors, and if the numbers match, the drivers would be
allowed to start up engine and drive away. This solution has many disadvantages. Firstly, it is
the driver's manual work, which we want to avoid as much as possible. There is also a
problem, that the pressure sensors can be fooled by using a tangible object (e.g. heavy
shopping bags) and thus on-board unit will think the vehicle contains more people than the
driver entered on the keyboard. There could be also a problem when vehicle stops when one
or more persons leaves or boards the car. Then the driver has to re-enter the code on the
keyboard, which is restraining and very impractical. But we must take into account a price of
this solution, which compared to the following solutions is much cheaper. Buyers are often
looking for the total prize and often decides by small amounts. However, this solution has
been proved to be unsatisfactory for our needs.
4.4. Camera with face detection
This methodology uses an image storage device (camcorder or camera), that is equipped
with software for human faces recognition. An algorithm for detecting human faces is using

22
the fact that the face has numerous landmarks, the different peaks and valleys that make up
its overall appearance. These landmarks form the so-called “nodal points”. Each human face
has approximately 80 of these nodal points that are unique to almost every individual. Some
of these nodal points are measured by facial recognition software. Most often measured is –
Distance between eyes
The width of the nose
The depth of the eye sockets
The shape of the cheekbones
The length of the jaw
Pic. 8: Sample of the algorithm for face detection [16]
Exact face detection methods will be described in later chapters, but simplified face
recognition software looks for geometric shapes of the face. The entire process of detection
and identification of a human face takes, in modern photographic camera, just 4/100 of
second. Therefore, there is a possibility that this function, that currently has almost all
equipment used for image storage (cameras, camcorders, mobile phones), can also be used
for detection purposes in the vehicle. But there are some problems, what if the face is
covered with something (whether it would be a scarf or a part of the vehicle) and what if the
face won´t be in the camera view. But the biggest problem arises when software
misinterprets as a passenger face something what just looks like a face, but in fact is not the
face of a living person. This may for example be the title pages of magazines that are full of
photos of celebrities or stickers on shirts. For these reasons, this method seems to be
unsatisfactory.
It was already said in the previous chapter about pressure sensors, even this method could
be very well used in the field of security of motor vehicle. Facial recognition software can
create a numeric code called "faceprint" for each individual human face, which is almost
unique for each person. Then permitted drivers have their own “faceprint” in the OBU that
allows them to drive a car.

23
4.5. Systems with motion detection
Systems for detecting motion or changes in space may operate on the principle:[17]
a) Passive sensors – register physical changes in their surroundings
b) Active sensors – actively participating in their neighborhood and detect a change in
environment
It is possible to find several kinds of motion sensors in practice:[17]
Passive Infra-Red sensors – PIR
Active Ultrasonic sensors– US
Active microwave sensors – MW
Dual sensors (PIR – US, PIR – MW)
PIR sensors
Infrared sensors are the most commonly used sensors in space protection. They do not
radiate any energy, do not affect each other and can be installed so that their detection
zones (active, inactive) overlap.
They are based on the principle of capturing changes in emission of electromagnetic
radiation in the infrared spectrum. Each body whose temperature is higher than -273 °C
(absolute zero) and lower than 560 °C, is the source of radiation.
PIR sensors can be affected by ventilation (draught, air turbulence), direct or indirect
emission of light (sunshine, lights), variable heat source (heating, chimneys) and interfering
IR sources (lamps).[17]
US sensors
Ultrasonic sensors are active sensors that radiate energy into space, then the reflected
radiation is analyzed and interpreted by the sensors. They use part of the spectrum of
mechanical waves over the band of frequencies audible to the human ear (e.g. audible for
dogs, mosquitoes). They operate on the principle of a change in frequency of the reflected
ultrasound signal (about 40 kHz) from a moving object (i.e. Doppler effect). The transmitter
generates a constant signal, the receiver receives the waves reflected from obstacles in
space and after a short time standstill is crated. When standstill is created, the wave received
is same as the wave sent. Moving of any element in the space causes a change in frequency
of the received wave, this phase change is detected by electronics.[17]

24
US motion sensors may be affected in areas with loosely hanging items (lamps), in areas
with freely moving animals (rodents), with heaters, with hot-air heating, and close to the
sound sources with a wide frequency spectrum (phone).[17]
MW sensors
Microwave sensors are based on the same principle as ultrasonic sensors (i.e. Doppler
effect), but instead it uses ultrasound, microwave sensors use electromagnetic energy in the
frequency band of 2.5 GHz, 10 GHz or 24 GHz.[17]
They are realized in the form of microstrip lines in the integrated PCB sources. Unlike the
previous technology, waveguides, this option is much cheaper and ensure increased
availability of the MW sensors. Thanks to polarization of the MW antennas there is possible
simultaneous operation of multiple detectors in one area without interference.[17]
Dual sensors
Dual sensors operate on the principle of combination of two functionally distinct types of
detection. Development of dual sensors is based on the fact that each technology has
propensity to false alarms (various sensors operate on different physical principles).
Combination of different technologies, various physical phenomena, is reducing the number
of poorly evaluated cases. The detector will alert just in case if there is an activation of the
both sensors in the specified interval.
The most common combination of the dual sensors:
PIR + MW
PIR + US
PIR + PIR) with distribution into two horizontal areas[17]
Dual detectors are used in cases of problematic and challenging installations in areas with
significant negative environmental influences.
Installation of these types of sensors must be based on the rules that are valid for each
individual sensors systems. Sensors threshold has been moved up compared to sensors
with a single detection system thanks to the participation of more sensors systems.[17]
The problem with motion detection in the vehicle is that the movement does not necessarily
belong to any human. It may be animal, even though the Road Traffic Act (Act no. 361/2000
Coll., On Traffic on the Road Network and on Changing Certain Acts), § 5 and § 52
announces the responsibilities of the driver during the transport of persons, animals or goods
(both paragraphs are in the appendix at the end of the work).

25
Three of these options (car seat, harness belt and car blanket) place the animal in the cabin
of a motor vehicle where camera with motion detection could be confused. Of course, many
people are violating the law, they do not apply any of these options and peacefully have a
dog on their lap, or on the passenger seat. Due to possibility of the poor evaluation of
movements in the cabin, this option is unsuitable for our purposes.
4.6. Thermocamera with face detection
The next chapter includes more detailed description because of the choice of this method to
detect people in the vehicle. This method examines the temperature in the cabin of the car
and through the algorithm detects human faces and then counts them. Temperature could be
measured by two methods – contact and non-contact. Contact temperature measurement is
realized through contact thermometers (e.g. mercury). Contactless measurement is done by
non-contact thermometers (luminance/spectral pyrometers and thermal imaging).
Contactless temperature measurement method was until not as long ago taken as
unrealistic, it is now widespread. Thermal imaging cameras are widely used eg. in detecting
heat leakages, measurements of electrical equipment, searches for people or animals in the
wild, measurements of the surface temperatures of solids, in transportation of energy, in
medicine and distant (non-intrusive) research of the Earth. Thermal measurement is one of
the contactless methods of measuring surface temperatures. It uses electromagnetic
radiation that each body with a temperature greater than absolute zero, i.e. -273 °C, radiates.
Thermocamera is a device that allows you to view objects in infrared spectrum. More
sophisticated thermal imaging systems further allow to quantify the infrared radiation emitted
by the objects (in the range from -40 °C to 3000 °C). For proper quantification of measured
values is necessary to count with the these parameters – emissivity2, distance, apparently
reflecting temperature, the temperature of the atmosphere and its humidity.[18]
Unlike infrared thermometer the thermal imager measures the temperature distribution on the
surface of larger parts, often even entire buildings. The original systems were difficult to use
and use decomposition of the image into individual pixels. Current types of thermal imaging
cameras are based on the activities of wavelengths from 8 to 14 μm and have been working
2 Emissivity (emissivity table is in attachments) is a measure of the efficiency in which a surface emits thermal energy. It is defined as the fraction of energy being emitted relative to that emitted by a thermally black surface (a black body). A black body is a material that is a perfect emitter of heat energy and has an emissivity value of 1. A material with an emissivity value of 0 would be considered a perfect thermal mirror.. - ThermoWorks.com [online]. [cit. 2016-04-21]. Available from: http://www.thermoworks.com/emissivity_table.html

26
without image decomposition while using matrix detector. Matrix detector has a large number
of individual sensors of thermal radiation.[19]
Optical part of the imager has similar characteristics as a normal digital camera. The lens is,
however, adapted to the penetration of the infrared radiation. Heat radiation is projected by
the objective into the matrix detector, where an infrared image of the measured object is
formed. Signals from the individual sensors of the matrix detector is then processed in
electronic circuits. The outcome of the process is the visible color image – thermogram.
Measurement proceeds in few steps:
1. Infrared energy from the object is focused through the lens into the infrared detector
2. This transmits the information to the electronics for image processing
3. Electronics task is to convert the data into a visible image in the viewfinder or on a
standard monitor or LCD screen.
4. Complex computational algorithms, that is thermal camera equipped, allowing
reading of temperature values from the image
5. Each pixel of the radiometric image is then assigned with a specific temperature
value
Simplified – the infrared camera is used to convert infrared image into a radiometric
image.[19][20]
4.6.1. Principles of thermovision
As already mentioned, infrared sensors operate with the ability to sense and record the
infrared radiation. It is emitted by all objects with a temperature higher than absolute zero.
Thermocamera captures radiation not only from the object surface, but also from the
surroundings. Therefore, it takes into consideration the radiation reflected from the space
between object and the camera. Then everything is converted into an electrical signal and
exposed to the human eye through e.g. LCD screen.[21]
The result is a color image displayed on the display of the thermal imager called
“thermogram”. Then expert could determine the temperature differences from thermogram.
The measurement accuracy is affected by the emissivity of the subject. For most ideal
measurement is so-called “black body”, which reaches emissivity 1.0. Black body is
lampblack, as well as water or glass. Reliability decreases with a lower emissivity value.3
Thermogram is displayed in a wide range according to the color temperature. The black color
in the picture symbolizes the coldest place of the object, vice versa the white symbolizes the
warmest place. However the credibility of this depends on the type of scanned material.[21]
3 Human skin has emissivity around 0.98

27
Except emissivity, measurements are significantly affected by other things. Specialized
companies dealing with thermography measurements recommend to do measurements in
the coldest weather as possible, when the temperature difference of the interior of the
building and the external environment is at least 15 °C, and at least for a period of two days.
The most appropriate time is also considered to be in the evening or early morning, as the
object of measurement should not be at least for two hours before in the sun shine.[21]
4.6.2. Theoretical basics of thermography measurement
Thermal measurement requires knowledge of some physical laws. For proper understanding
of the thermal measurement is useful to know Planck's law, Stefan – Boltzmann's law, the 1st
and 2nd Kirchhoff's law, and Wien's displacement law.[22]
Planck's law formulates the electromagnetic radiation emitted by a black body in thermal
equilibrium at a definite temperature. It can be expressed graphically or mathematically
by:[22][23][24]
Stefan-Boltzmann Law states that the thermal energy radiated by a blackbody radiator per
second per unit area is proportional to the fourth power of the absolute temperature and is
given by: H = σT4.[25]
E0λ – Spectral radiance of a black body
T – Object temperature
λ – Wavelength radiation
c1 – Planck constant = 3,741 . 10-16 W/m2
c2 – Planck constant = 1,438 . 10-2 m . K
H – Total intensity of radiation
T – Thermodynamic temperature
σ – Stefan-Boltzmann constant

28
Kirchhoff's First Law solves the interaction of radiation with the object. Sum of the
reflectance, absorbance a transmittance4 of the object is always equal one: r + a + t = 1.
Kirchhoff's Second Law states, that perfection of the object radiation is determined by its
skill to absorb radiation: ε = a.[22]
Wien's displacement law points out, that not only the intensity of the radiation is changing.
There is also a change in the spectral distribution of radiated power. With increasing
temperature, the maximum temperature of the emission shifts toward shorter wavelengths.
Mathematical expression represents the equation:[26]
λ𝑚𝑎𝑥 =𝑏
𝑇, 𝑤ℎ𝑒𝑛 𝑏 = 2,898 mm . K
4.6.3. The measurement principle
Picture no. 9 below this text shows the electromagnetic spectrum. It is divided into several
groups - wavelength bands - according to wavelength. We recognize X-rays, ultraviolet
radiation, visible radiation, infrared radiation, microwave radiation and radio radiation.[27]
Pic. 9: Electromagnetic spectrum [28]
Thermal imaging cameras use the infrared waveband. This band is divided into four
subbands – near, medium, remote and very remote. In practice, the most often used range
NIR (Near InfraRed – from 0.9 to 2.5 μm), SW (Short Wave – 2.5 to 5 μm) and LW (Long
Wave – 7 to14 μm). Shortwave systems are used for measuring high temperatures. These
detectors require a cooling. Longwave systems are preferable in the most cases. This is due
to lower energy consumption, smaller size and weight of the camera.[29]
4 Transmittance is a measurement of how much light passes through a substance. The higher the amount of light that passes through, the larger the transmittance. Emissivity coefficient depends on - type of material, properties of the surface, wavelength, material temperature, and direction of radiation – Pediaa.com [online]. [cit. 2016-04-21]. Available from: http://pediaa.com/difference-between-absorbance-and-transmittance/

29
Thermal measurement itself is always affected by the radiation of the surrounding
environment. Furthermore, if the transmission of the measured object is equal to zero, there
has to be taken into account the effect of background radiation. In case, when the emissivity
between object and the camera is not equal to zero, there has to be taken into consideration
the influence of the radiation of the surrounding environment. Picture 10 shows a diagram of
a practical measurement. The effects of scattered light in the atmosphere and radiation from
sources outside the field of view of the thermal imaging camera were disregarded.[25][30]
Pic. 10: Diagram of the general thermographic measurement situation [30]
1. Reflected radiation from other objects
2. Emission of the object
3. Atmosphere
4. Thermocamera
For proper contactless temperature measurement is necessary to have some knowledge of
thermography and the laws of physics. Also the selection of a suitable thermography
equipment is important. Thermocameras should be selected with regard to quality, which
fundamentally affects the measurement result. Attention should be also paid to the spectral
sensitivity of the device. This depends on the required range of temperature. To measure
higher temperatures there are selected cameras with a shorter wavelength, for measuring
the lower temperatures there are used cameras with larger wavelength. Requirements for
thermal imaging camera can be summarized into six key points - image quality, temperature
sensitivity, accuracy, camera features, software and training requirements.
4.6.4. Influence of temperature on the thermogram of human faces
In this chapter there will be analyzed the influence of the outside temperature on a human
face, how chilly, frosty or high temperature affects human face and how it will affect
thermogram and our detection of faces in lower or higher temperatures.

30
Temperature 15 °C 20 °C 25 °C 30 °C 35 °C
Foot 17,4 ± 2,4 21,7 ± 0,9 27,1 ± 0,8 31,6 ± 1,0 35,5 ± 0,3
Shin 22,3 ± 1,8 25,8 ± 1,0 28,9 ± 1,0 32,7 ± 0,7 35,3 ± 0,2
Thigh 23,2 ± 2,2 27,9 ± 1,5 30,5 ± 1,1 33,4 ± 0,6 35,0 ± 0,4
Belly 29,1 ± 2,3 30,7 ± 1,7 33,5 ± 0,4 34,7 ± 0,8 35,1 ± 0,6
Back 30,1 ± 2,4 31,3 ± 1,1 32,7 ± 1,5 34,4 ± 0,8 35,4 ± 0,4
Chest 29,9 ± 2,2 31,9 ± 1,1 32,8 ± 0,9 34,5 ± 0,8 35,9 ± 0,3
Shoulder 26,2 ± 1,3 28,0 ± 0,8 30,8 ± 2,0 33,4 ± 0,8 36,0 ± 0,2
Forearm 27,0 ± 2,0 27,7 ± 0,7 30,3 ± 1,3 33,6 ± 0,6 35,7 ± 0,3
Hand 19,7 ± 2,7 24,0 ± 1,3 25,4 ± 2,1 32,9 ± 0,9 35,8 ± 0,2
Forehead 29,7 ± 2,1 32,9 ± 0,9 33,9 ± 0,4 34,8 ± 0,7 35,8 ± 0,6
Average
Value 25,7 ± 1,2 28,2 ± 0,8 30,6 ± 0,9 33,4 ± 0,5 35,7 ± 0,2
Tab. 4: The average human body temperature (blue = min., red = max.) [31][32]
The first measurements took place in the Faculty of Applied Informatics Tomáš Baťa
University in Zlín, classroom U54 / 309, which is located on the 3rd floor of the building. The
second part of the measurement was performed in an outdoor environment to obtain the
values below freezing. The first part of measurement was attended by 9 people, and the
whole measurements was attended by six people.[33]
Date of measurement 5. 12. 2011
Selected temperature 35 °C, 20 °C, 15 °C, 10 °C
Distance thermal imager lens from the object 1,5 m
Humidity 35 %
Tab. 5: First measurement [33]

31
Date of measurement 2. 2. 2012
Selected temperature 5 °C, 0 °C, -5 °C, -10 °C
Distance thermal imager lens from the object 1,5 m
Humidity 56 %
Outside temperature -10 °C
Air velocity 1,67 m/s
Tab. 6: Second measurement [33]
In the following table (no. 7) is stated, that the average temperature on the surface of human
faces distributed unevenly. The coldest part of the human face is the nose, which has in each
case the lowest temperature. The temperature of the eye is gradually decreased, but
stabilized at about 30 °C, however the eye area almost vanished (pic. 12), so there is
possibility, that in lower temperatures, there is no chance to detect face through IR
camera.[33]
Temperatures Eyes Nose Mouth Cheeks Forehead
35 °C 35,9 32,3 35,3 35,5 35,4
20 °C 34,3 30,5 33,8 33,4 33,1
15 °C 33,0 25,1 30,3 30,4 31,6
10 °C 31,5 22,1 29,7 29,0 31,1
5 °C 30,1 19,9 28,1 27,9 30,6
0 °C 29,0 17,3 26,4 25,6 28,9
- 5 °C 30,7 18,5 27,1 25,7 31,0
- 10 °C 29,1 16,0 25,9 24,4 25,4
Tab. 7: Average temperatures of selected zones face of the test persons [33]
The biggest difference in average temperatures occurred in the nose area. The smallest
change occurred in the eye area.

32
Pic. 11: The average temperatures [33]
Pic. 12: Individual images taken at the different temperatures [33]
4.7. Electromagnetic chips
This is after all still a bit futuristic solution to our problem. This system consists of radio
frequency (RFID) information exchange. Information about themselves would be carried by
the subject (implemented in the identity card) in the form of small chips that can be read

33
remotely. When entering into a motor vehicle, OBU load all of the chips and their information
(it would be possible to transfer very important information about health or mental disability of
passengers or other illnesses – e.g. allergy), which if necessary would be sent to PSAP. This
technology is already used in the transport and sale of goods or animals´ identification.
However, in human case it raises a little Orwellian problem, where the technology can be
easily abused (whether by the state or another power) for detailed tracking of the movement
of people and the violation of their basic human rights, human freedom and privacy. At the
present and the near future, this solution is unsatisfactory.
Pic. 13: RFID chip in comparison with a grain of rice [34]
4.8. Systems outside of the vehicle
Detection systems outside of the vehicle are the most commonly used in lanes for High
Occupancy Vehicle (HOV). HOV is a restricted traffic lane reserved at peak travel times or
longer for the exclusive use of vehicles with a driver and one or more passengers, including
carpools, vanpools, and transit buses. HOV lanes are normally created to increase average
vehicle occupancy and persons traveling with the goal of reducing traffic congestion and air
pollution, although their effectiveness is questionable.[35]
A vehicle occupied by two or more people may use HOV lanes. Vehicles eligible to use HOV
lanes include, but are not limited to:[36]
passenger cars
pickup trucks
vans
buses
motorcycles
emergency vehicles responding to a call

34
Traditionally detection is done by local police visually confirming each vehicle has the
required number of occupants and chasing offenders to issue a ticket. However, Xerox has
developed a Vehicle Passenger Detection System (VPDS) which automatically counts the
number of passengers in vehicles with better than 95 % accuracy. According to the
company, seeing inside a vehicle poses a variety of problems ranging from line of sight into
vehicles of different heights, window tinting and vehicle geometries, to the more traditional
weather, lighting conditions and tracking a vehicle in lane difficulties. It says it has developed
algorithms which can detect a windshield regardless of the vehicle’s shape and is able to
accurately process the images of vehicles travelling at any speed from stop/start to
160 km/h.[37]
Xerox's system automates HOV/HOT enforcement (system can be mounted either
alongside or above the high-occupancy lane)[37]
Tab. 8: Xerox's system for HOV lanes detection [37]
However, drivers are constantly trying to evade congestion and fines for usage of HOV
lanes. So because of this they are putting some sort of dolls or mannequins to the vehicles to
confuse police officers or detection systems. Some pregnant women, for example, according
to police, assert that their unborn fetus constitutes an extra passenger, justifying their right to
use the HOV lanes. People also go to all sorts of extremes - even putting make-up on
mannequins, and stuffing their clothing with newspaper in an attempt at realism.[38]

35
Pic. 14: Attempt to avoid detection in HOV lane with mannequin [38]
Because of attempts to sneak into high-occupancy carpool lanes, company called Vehicle
Occupancy, based at Loughborough University, in Leicestershire, England developed an
infrared camera-mounted scanning system that foils 95 % of such trickery. Vehicle
Occupancy’s system, dubbed Dtect uses a proprietary infrared technology that can identify
human skin by measuring its water content and detecting hemoglobin in the blood just
beneath the skin. Dtect camera captures two images of oncoming vehicles at different
frequencies in the infrared range. At those frequencies, live human skin has different light-
absorbing attributes than heated plastic or steam emanating from a cup of coffee–or even a
bladder of hot water, which might be used to try to fool the system. In addition to recognizing
the infrared signatures of hemoglobin and water, Dtect’s software can differentiate between a
person and a large animal.[39]
Pic. 15: Infrared image of the front seat of a Ford Focus [39]

36
5. Hardware
In this diploma thesis there will be used many various tools to successful closure. From
laboratory with a car and thermocameras to evaluation program. This paragraph is focused
on hardware that is everything physical, every part of computer, basically everything human
can touch.
5.1. Thermal Imager Fluke TiR
The Fluke TiR Thermal Imager are handheld imaging cameras used for predictive
maintenance, equipment troubleshooting, and verification. Imager produce thermal and
visual images on a 640 x 480 display. Thermal and visual images are displayed on the
Imager LCD and can be saved to an SD memory card. Transferring images to a PC is
accomplished by removing the SD memory card and connecting it to a PC through the
included card reader. SmartView® software is included for image analysis and report
generation from these saved images.[40]
5.2. Citroen Xantia 2.1 Turbo D
CTU in Prague let me use their laboratory with torso of Citroen Xantia for my testing. This
laboratory takes place in building on Horska street.
Pic. 16: Torso of Citroen Xantia
The car was stripped of engine (in fact the whole front part is missing) and wheels to get to
the lowest weight as possible, because the laboratory is placed in the third floor. However,
this is more than sufficient for my laboratory work. All my work need is the cabin of the
car, that was there.

37
6. Face detection algorithms
Thermocamera itself isn´t sufficient to detect people. Hardware solution must be supported
by software that can handle decision whether on the thermogram is or is not a human. This
can be achieved by a large number of methods from counting the heat spots (number of heat
spots of a certain size → number of people in a car), detection of human faces and detection
of auricles ending. The next chapter will describe some of the selected methods. However, in
our case analyzing the thermogram and detection of a human face, will be processed by
Viola-Jones algorithm automatically implemented in MatLAB (Matrix Laboratory) from
companies HUMUSOFT Ltd. And MathWorks under the command –
faceDetector = vision.CascadeObjectDetector();
6.1. Viola-Jones detection algorithm
This algorithm is a machine learning approach to visual object detection and was first
demonstrated in 2001 by P. Viola and M. Jones. This algorithm is able to process image
extremely quickly, reaching a high percentage of successful detection → high reliability and
independence on the size of the object. For these reasons it is one of the most used
detectors and large number of its modifications are produced. The actual work of the
algorithm can be divided into three key parts which we will describe in more detail.[41]
Integral image
Haar wavelets
AdaBoost
Because this is the learning algorithm, you can learn to detect almost anything. In our case it
is the face detection in the IR range. The greater number of photos training set will contain,
the lower is risk of error.
6.1.1. Integral image
The calculation of the amount of pixel values corresponding to the feature is very time
consuming, so integral image is used to quickly and efficiently calculate the value of
individual features. Here, each point of the image (pic. 17) converted to the sum of all
previous pixel in the input image according to the equation[41][42]
𝑠(𝑥, 𝑦) = 𝑠(𝑥, 𝑦 − 1) + 𝑖(𝑥, 𝑦)
𝑖𝑖(𝑥, 𝑦) = 𝑖𝑖(𝑥, 𝑦 − 1) + 𝑠(𝑥, 𝑦)
s(x,y) – is the cumulative row sum, s(x,-1) = 0, ii(-1, y) = 0

38
When ii is integral image represents value
𝑖𝑖(𝑥, 𝑦) = ∑ 𝑖(𝑥´, 𝑦´)
𝑥´≤𝑥,𝑦´≤𝑦
Pic. 17: The point value of the integral image
Calculation of the values is then simply done, because on the calculation of the amount is
sufficient just two mathematical operations – summation and subtraction. The first
demonstration will be general, and then an example (pic. 18). In general, it is assumed that
the x, y are initial coordinates and w, h are the width and height of the desired rectangle,
assign these variables points –
Location 1 – 𝐼𝑖𝑛𝑡(𝑥, 𝑦)
Location 2 – 𝐼𝑖𝑛𝑡(𝑥 + 𝑤, 𝑦)
Location 3 – 𝐼𝑖𝑛𝑡(𝑥, 𝑦 + ℎ)
Location 4 – 𝐼𝑖𝑛𝑡(𝑥 + 𝑤, 𝑦 + ℎ)
And the resulting sum for a rectangle D could be generally written as[67]
(𝐼𝑖𝑛𝑡(𝑥 + 𝑦) + 𝐼𝑖𝑛𝑡(𝑥 + 𝑤, 𝑦 + ℎ)) − ( 𝐼𝑖𝑛𝑡(𝑥, 𝑦 + ℎ) + 𝐼𝑖𝑛𝑡(𝑥 + 𝑤, 𝑦))
The following picture (pic. 18) shows you how it is in practice. It shows the four areas
(rectangles) - A, B, C and D, and four points
Location 1 – sum of rectangle A
Location 2 – sum of rectangles A + B
Location 3 – sum of rectangles A + C
Location 4 – sum of rectangles A + B + C + D
The resulting sum for a rectangle D will be calculated 4 + 1 – (3 + 2).[41][42]
39
Pic. 18: Example of the calculation of any rectangle using the integral image
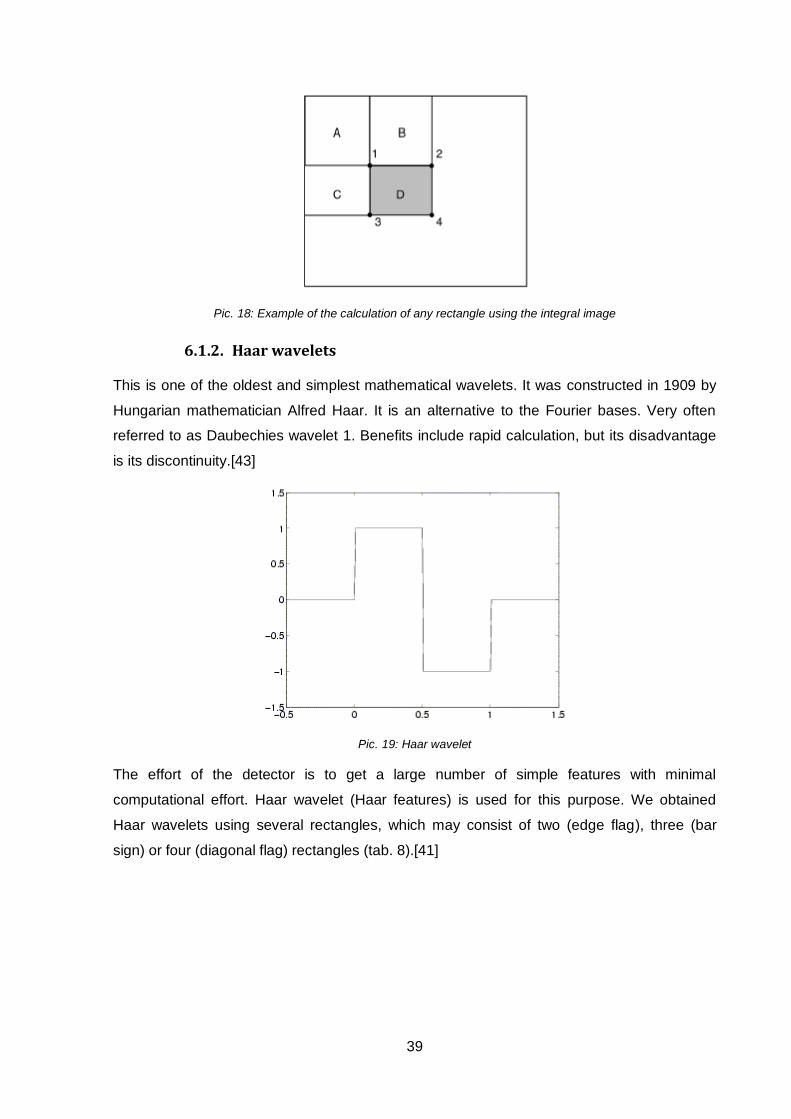
6.1.2. Haar wavelets
This is one of the oldest and simplest mathematical wavelets. It was constructed in 1909 by
Hungarian mathematician Alfred Haar. It is an alternative to the Fourier bases. Very often
referred to as Daubechies wavelet 1. Benefits include rapid calculation, but its disadvantage
is its discontinuity.[43]
Pic. 19: Haar wavelet
The effort of the detector is to get a large number of simple features with minimal
computational effort. Haar wavelet (Haar features) is used for this purpose. We obtained
Haar wavelets using several rectangles, which may consist of two (edge flag), three (bar
sign) or four (diagonal flag) rectangles (tab. 8).[41]

40
Tab. 9: Haar wavelets
Feature value f(x) is calculated from the input image x as the sum of white pixels r0, which is
subtracted from the sum of the black part r1.
𝑓(𝑥) = 𝜔0𝑟0 + 𝜔1𝑟1
Individual features are applied to the entire input image (features are used depending on the
type of information to be detected), when the first is set the basic screen (using a resolution
of 24 x 24 pixels get an approximate final number of features somewhere around number
180 000). Then the individual features are slid along one pixel in either the horizontal or
vertical direction. At the same time there is a change in size of individual features until it is
the same size as the corresponding input image.[41][42][44]
6.1.3. AdaBoost (Adaptive Boosting)
This is classification algorithm using any machine learning algorithm creates a simple (weak)
classifier (weak learner), which hasn´t great accuracy. This classifier come to existence from
the sampling of the training set. It creates and gradually combine classifiers with a similar
degree of accuracy (error of this classification shall not exceed 0.5) to give the file of the
required precision – strong classifier (strong learner). The overall classification accuracy is
arbitrarily high, depending on the training set → classification was amplified
(boosted).[41][44]
Mathematically AdaBoost creates a strong classifier for classifying data 𝑥𝑖 by combination of
weak classifiers ℎ(𝑥𝑖)
ℎ(𝑥𝑖) ∈ {−1,1}
𝐻(𝑥) = 𝑠𝑖𝑔𝑛 ∑ 𝛼𝑖ℎ(𝑥𝑖)
𝑁
𝑖=1
- Two-rectangle feature
- Three-rectangle feature
- Four-rectangle feature

41
𝐻(𝑥) is final – strong classifier
𝛼𝑖 is the weight, we need to set up by training
The whole process of learning is in a cycle in which it is always necessary to perform these
steps –
Select the best possible classifier (with the smallest error)
Verify that this error does not exceed 0.5
Calculate the coefficient of the weak classifier at a linear combination H(x)
Update the weights Dt [45]
1. INPUT
(𝑥1, 𝑦1), … , (𝑥𝑚 , 𝑦𝑚); 𝑥𝑖 ∈ 𝑋, 𝑦𝑖 ∈ {−1,1}
2. INITIALIZE WEIGHTS
𝐷1(𝑖) =1
𝑚
3. For t=1,…,T:
a) Find ℎ𝑡 = 𝑎𝑟𝑔 minℎ𝑗∈H
𝜖𝑗; 𝜖𝑗 = ∑ 𝐷𝑡(𝑖)𝐼[𝑦𝑖 ≠ ℎ𝑗(𝑥𝑖)]𝑚𝑖=1
b) If 𝜖𝑡 ≥1
2 then stop
c) 𝛼𝑡 =1
2𝑙𝑜𝑔 (
1−𝜖𝑡
𝜖𝑡)
d) 𝐷𝑡+1(𝑖) =𝐷𝑡(𝑖)𝑒𝑥𝑝(−𝛼𝑡𝑦𝑖ℎ𝑡(𝑥𝑖))
𝑍𝑡
where 𝑍𝑡 = ∑ 𝐷𝑡(𝑖)𝑒𝑥𝑝𝑚𝑖=1 (−𝛼𝑡𝑦𝑖ℎ𝑡(𝑥𝑖))
4. FINAL STRONG CLASSIFIER
𝐻(𝑥) = 𝑠𝑖𝑔𝑛 ∑ 𝛼𝑖ℎ(𝑥𝑖)
𝑁
𝑖=1
In the following picture (pic. 20) it is shown how such cycle progresses.

42
Pic. 20: Example of AdaBoost [46]
6.2. Alternatives
Next to Viola-Jones algorithm, which is most commonly used algorithm for face detection
nowadays, exists many other solutions how to detect faces in a picture. Because in this
thesis there is used Viola-Jones algorithm, in this chapter will be quick view on the others
methods. For example it could be –
Model-based face tracking
Neural network
Model-based face tracking
This system uses a general purpose object-tracker for certain model. This model has a
number of parameters (basically, "knobs" of control), some of which describe the shape of
the resulting face, and some describe its motion.
In the picture below, the default model (top, center) can be made to look like specific
individuals by changing shape parameters (the 4 faces on the right). The model can also
display facial motions (the 4 faces on the left showing eyebrow frowns, raises, a smile, and
an open mouth) by changing motion parameters. And of course, we can simultaneously
change both shape and motion parameters (bottom, center).[47]

43
Pic. 21: A model of face shape and motion [47]
Neural network
In machine learning and cognitive science, artificial neural networks (ANNs) are a family of
models inspired by biological neural networks that are used to estimate or approximate
functions that can depend on a large number of inputs and are generally unknown. Artificial
neural networks are generally presented as systems of interconnected "neurons" which
exchange messages between each other. The connections have numeric weights that can
be tuned based on an experience, making neural nets adaptive to inputs and capable of
learning.[48]
Neural networks are used among others for the recognition and compressing images or
sounds, predict future time series (e.g. exchange index), sometimes even to spam filtering. In
the medicine neural network is used to build knowledge about the functioning of the nervous
systems of living organisms.[49]
One of the most widely used model is –
𝑌 = 𝑆 (∑(𝑤𝑖𝑥𝑖) + 𝜃
𝑁
𝑖=1
)
xi – Neuron inputs
wi – Synaptic weights
𝜃 – Threshold
S(x) – transfer function of the neuron (activation function)
Y – Neuron output

44
PRACTICAL PART
7. System design
Pic. 22: System design
Minimum set of data (MSD) – Information about crash is send via MSD. Transmission of
the information is done by mobile network operator, through GSM networks.
7.1. System elements
Thermovision camera (TC) – Is used for infrared photo of the cabin of the vehicle.
Purpose of this is searching for answer how many passengers were in cabin in the
time of crash.
Photo analysis software unit (PASU) – External OBU contains face detection
algorithm software to count how many passengers are in vehicle in the moment of
crash.
On-board-unit (OBU) – Gets information about quantity of passengers from PASU,
creates eCall and sends information about crash.
Public-safety answering point (PSAP) – Obtain information about how many
possible injured persons are in vehicle with additional information from eCall5.
According to this information operator can decide how many emergency vehicles are
needed.
12V Battery – Battery is charging the whole car system.
5 Such as location, direction, time, ID of the vehicle (color, type, license plate number) and execution method of the emergency call (manually/automatically, or front crash/side crash/rear crash, if airbags went off, if vehicle went over, etc.)

45
7.2. Relations
OBU – TC
Every time when any doors are detected as opened, then 5 seconds after OBU sends
request to thermovision camera to take an infrared photo of cabin of the vehicle.
TC – PASU
Infrared photo is sent to the photo analysis software unit, where photo is processed
by the algorithm.
PASU – OBU
Output from PASU is just simple number about how many passengers were in cabin
in the time of photo.
OBU – PSAP
OBU creates eCall with additional information about quantity of passengers. PSAP
now has a better view to the crash site and have improved response to the
emergency situations.
7.3. Processes
1. OBU – detects opened door, sends photo request
2. TC – takes infrared photo and sends it to PASU
3. PASU – analyzes infrared photo and sends information to OBU
4. OBU – gets information about quantity of the passengers, creates eCall in case of
crash
5. PSAP – received eCall, makes appropriate response to the particular crash
7.4. System identity
In testing phase system will be used in personal vehicles (later possible in all vehicles on
roads). System should help emergency services to have better idea of the situation on the
crash site (how many possible injured people are on the site -> how many emergency cars
will be needed) before they arrive to the destination. Main goals of the system are to prevent
greater injuries and save lives. Only two relations with outside systems are when TC
receives photo request and output from PASU is added to eCall and sent to PSAP.
46
7.5. System competence
Functions of the system are determined (when photo is taken, how to analyze photo, etc.)
and content is purely information.
7.6. System ethics
System is closed (only trained PSAP operators receive emergency information) and
moreover output is just a number, so system can´t possibly have bad influence to anyone.
47
8. Position of thermocameras in the car
Positions of TCs in the cabin of car is crucial thing in this thesis. Thanks to the proper choice
of the places it can detect the whole cabin with the least TCs possible and save on costs.
8.1. Detection of adults and kids
Kids´ and adults´ detection is done by placing thermocamera in the front part of the cabin of
the car. TCs are aimed to detect faces of the passengers, thanks to algorithm running in
PASU.
Many of solutions have TCs placed in rear-view mirror. This place was chosen because of
many others systems (such as rain sensor, auto-headlights sensor, black box, or auto-
dimmer for rear-view mirror) are around rear-view mirror as well.
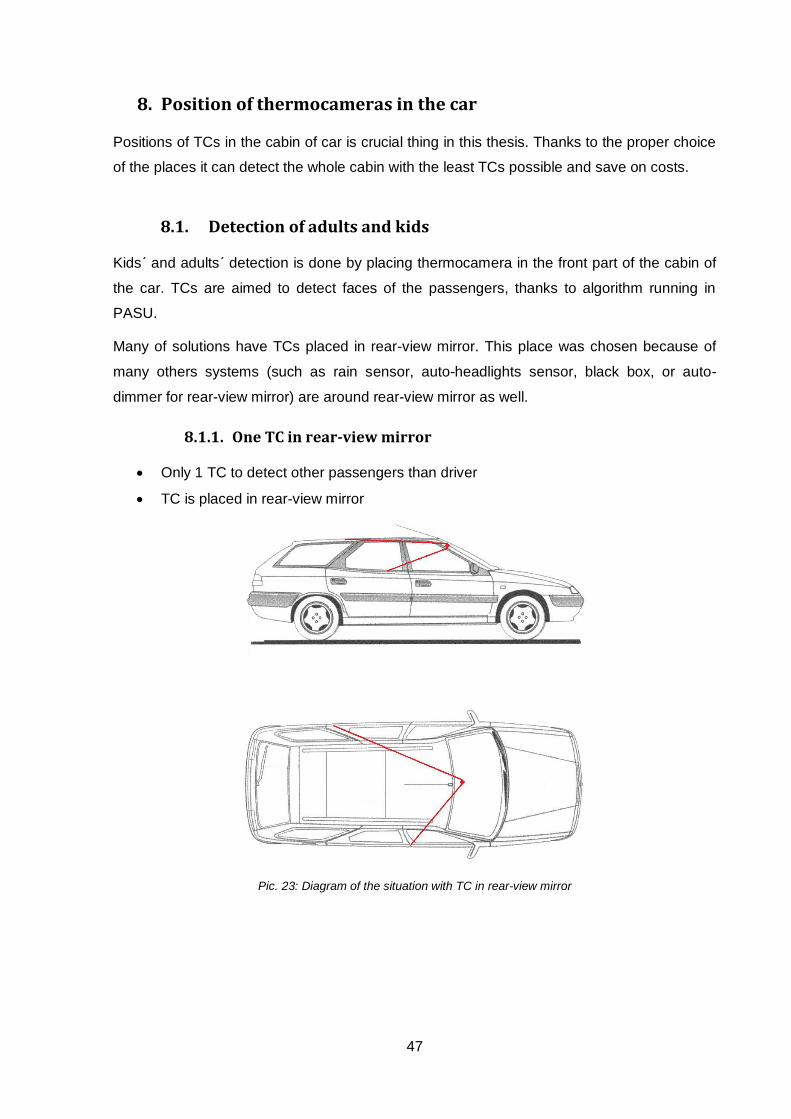
8.1.1. One TC in rear-view mirror
Only 1 TC to detect other passengers than driver
TC is placed in rear-view mirror
Pic. 23: Diagram of the situation with TC in rear-view mirror

48
Pic. 24: Perspective from rear-view mirror
In picture no. 17 is displayed perspective from TC located in rear-view mirror. Maximum
number of detected faces in this type of car thanks to this angle is 4. Because of this angle,
driver isn´t in the view, so every time TC detects some number of passengers, there has to
be +1 due to the driver spot. Although autonomous cars are already tested in real-world, it
takes some time before driver-less cars will be common on our roads.
This solution with only one TC, allows makers to reduce costs as much as possible, thanks
to elimination of the second thermocamera.
8.1.2. Two TCs in rear view mirror
Both TCs are located in rear-view mirror to cover the whole cabin of the car
Cabin of the car is divided into two halves by TCs
Pic. 25: Diagram of the situation with both TCs in rear-view mirror

49
Pic. 26: Perspective from rear-view mirror for both TCs
This solution helps to the better coverage of the cabin of the car. On-board unit has better
view on the cabin thanks to usage of the two TCs and there are no blind spot (unlike
previous case, where driver seat was in blind spot).
8.1.3. First TC located in A slope, Second TC located in rear-view mirror
2 TCs in front of passengers (TCs are labeled with another colors in diagram)
Red TC is in same spot as in the first case (pic. 17)
Blue TC is placed in the left A slope to detect driver only (pic. 21)
Blue may be used for face recognition (pic. 22 – for a future research) as a security
measurement
Pic. 27: Diagram of the situation with one TC in rear-view mirror and second in A slope

50
Pic. 28: Perspective from A slope
This solution has also few problems. First is that Blue TC probably has to have a greater
resolution to properly recognize drivers with permission to drive, so the cost of this type of TC
will be very expensive. Second is that Blue TC is in place where no electronics are, so there
has to be new attachment of the wires and thermocamera itself. And the last is that Blue TC
in case of car accident may be damaged because of location near to the crumple zone.
Car´s security measurement with face recognition
In the future research it is possible to secure cars with face recognition software to authorize
or prohibit driving.
Pic. 29: Car´s security measurement with face recognition

51
8.1.4. First TC located in dashboard, Second TC located in rear-view
mirror
2 TCs in front of passengers (TCs are labeled with another colors in diagram)
Red TC is in same spot as in the first case (pic. 17)
Blue TC is located in dashboard (e.g. between speedometer and tachometer)
Pic. 30: Diagram of the situation with one TC in rear-view mirror and second in dashboard
This solution was created because of the high possibility of car accident in which TC in A
slope could be damaged or destroyed. TC in this case is located in dashboard (e.g. in the
middle of triangle tachometer-speedometer-fuel level sensor).
Pic. 31: Location of the TC in the dashboard[50]

52
This position would be perfect, because of many systems in dashboard, so there is no need
to prepare new attachment of the TC. However, TC in dashboard could be simply blocked by
the driver´s hand in incorrect position on the driving wheel.
Proper way of holding the steering
wheel[51]
Wrong way of holding the steering
wheel[51]
Pic. 32: Blocked perspective of TC in dashboard solution
8.2. Detection of babies
Idea for detection of babies was, that the little ones are in special seat. Baby car seat are in
opposite direction to the traffic, because of safety measurements. From this assumption I
wanted to put some TCs (one or two) in the roof to spot faces of little babies from rear view.
So every faces detected by these TCs will have to be a baby´s face, therefore we should
have exact number of babies in the car. However, shape of the baby car seats doesn´t allow
this. Almost every for the smallest babies have shade shield to protect them against
sunshine. This could block the view to their faces. Also angle of TCs to detect their faces will
be acute and every another obstacle (cap, hat) could block the view. For this reason I don´t
think the thermal detection solution of babies isn´t the best possible.

53
Pic. 33: Baby car seat with shade shield on
One of the possible way, how to detect baby in the passenger seat, is to use combination of
the sensors in this particular seat. This solution unfortunately is only usable in front seat.
Face detected
on the TC Seatbelts Airbags
Pressure
sensors RESULT
No OFF ON ON Others
No OFF OFF ON Others
Yes ON ON ON Adult
Yes ON OFF ON Adult
Yes OFF OFF ON Adult
No ON OFF ON Baby
Tab.10: Settings of outputs from various sensors in passenger seat
However, there are at least two possible ways how to detect babies in baby car seats in back
seats. First is to train algorithm to detect contour of the baby car seat, due to the training set.
Idea of this solution is, that baby car seat is empty in minimum cases, therefore there is a big
chance if baby car seat is detected, it contains a little baby. Of course there is possibility of a
minor errors, but no system is exact. Second possible way is to equip baby car seats with
seat belts sensors and RFID. Whenever seat belt in baby car seat is locked, RFID will send
signal to OBU, that baby is on board.
54
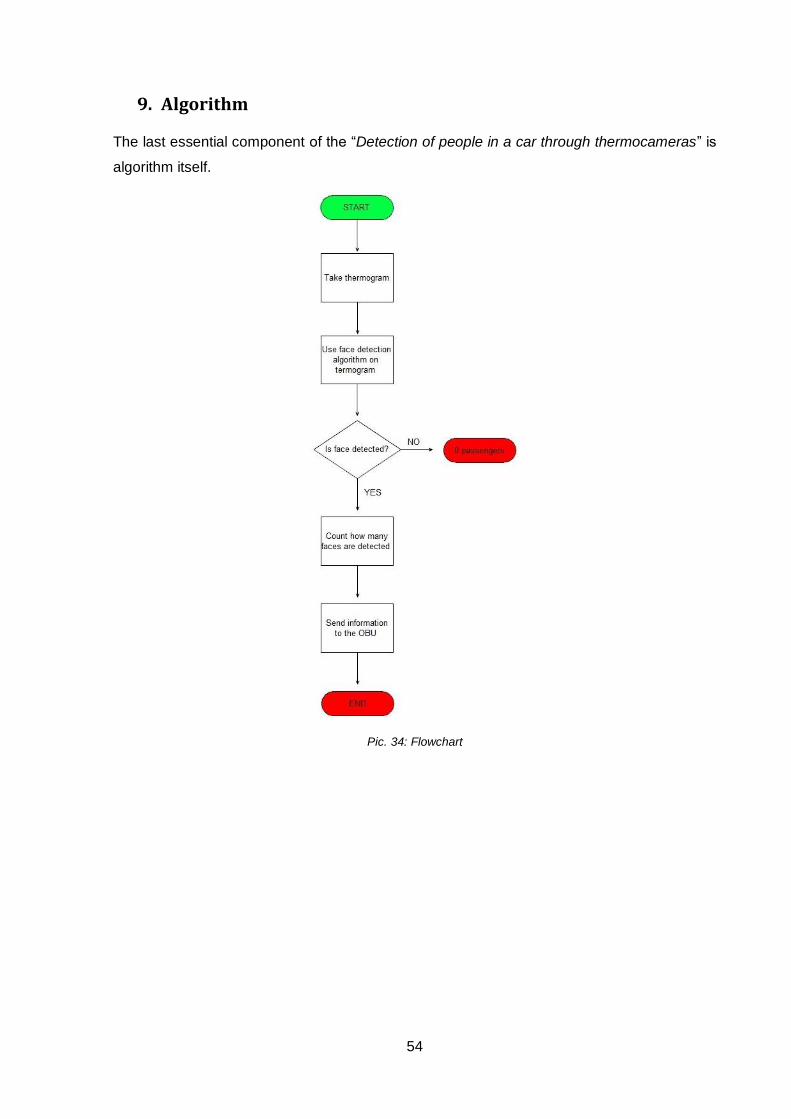
9. Algorithm
The last essential component of the “Detection of people in a car through thermocameras” is
algorithm itself.
Pic. 34: Flowchart

55
9.1. Matlab code
MatLAB 2013b was used for programming the code.
%Load Image A = imread('image.jpg'); %Load FaceDetector FaceDetector = vision.CascadeObjectDetector(); %Use FaceDetector on Image A BBOX = step(FaceDetector, A); %Annotate faces on the top of the Image B = insertObjectAnnotation(A, 'rectangle', BBOX, 'FACE'); imshow (B), title ('Detected Faces'); %Display number of faces in string n = size(BBOX,1); str_n = num2str(n); str = strcat('Number of detected faces are = ', str_n); disp(str);
It was written before, that Viola-Jones detector used in this MatLAB code is set to detect
faces as default object. But it can be trained with training set to detect any other objects as
well. For example, it could be used in detection of baby car seats contour to detect the
smallest passengers in the vehicle.

56
9.2. Outcomes
ORIGINAL THERMOGRAM BOX AROUND DETECTED FACE
NUMBER OF DETECTED FACES
COMMENT
On original (blue-red scale) thermogram there is one woman and it was taken in apartment
(approximately 20-22 °C). MatLAB process thermogram (converted into .jpg or .png file) with
the correct result.
Tab. 11: Outcome 1

57
ORIGINAL THERMOGRAM BOX AROUND DETECTED FACE
NUMBER OF DETECTED FACES
COMMENT
Thermogram was taken few seconds after the first one (but instead of using blue-red scale,
grey scale was used), so there is one women and it was taken in apartment (approximately
20-22 °C) as in the previous case. MatLAB process thermogram (converted into .jpg or .png
file) with the correct result.
Tab. 12: Outcome 2
58
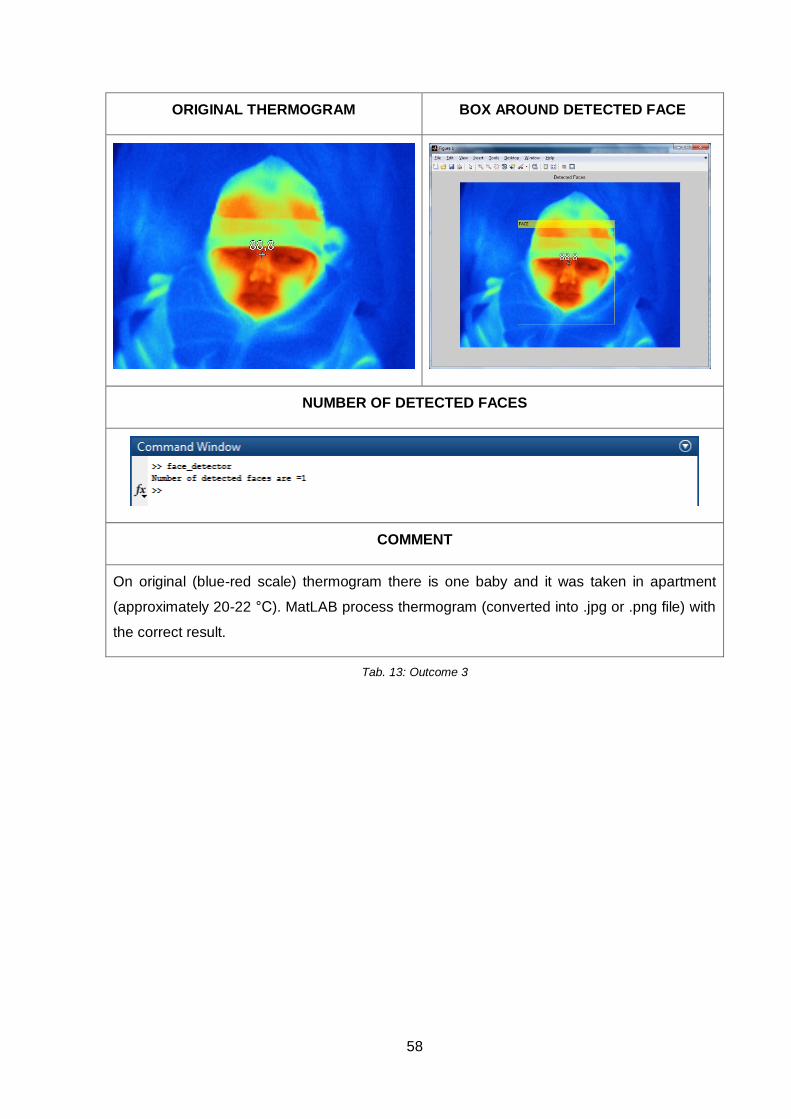
ORIGINAL THERMOGRAM BOX AROUND DETECTED FACE
NUMBER OF DETECTED FACES
COMMENT
On original (blue-red scale) thermogram there is one baby and it was taken in apartment
(approximately 20-22 °C). MatLAB process thermogram (converted into .jpg or .png file) with
the correct result.
Tab. 13: Outcome 3

59
ORIGINAL PICTURE
BOXES AROUND DETECTED FACES
NUMBER OF DETECTED FACES
COMMENT
This picture is used just as confirmation that software can detect multiple faces in only one
picture. As it is shown in picture with boxes around faces, result is correct.[52]
Tab. 14: Outcome 4

60
ORIGINAL THERMOGRAM
BOXES AROUND DETECTED FACES
NUMBER OF DETECTED FACES
COMMENT
On thermogram there is one male and one female and it was taken in apartment
(approximately 20-22 °C). MatLAB process thermogram with the wrong results. As it is
shown, software detects only female face. Probable cause of this is higher temperature of
male body, therefore face features vanished. On following outcomes there are thermograms
that were taken just few seconds apart and every thermogram have another result.
Tab. 15: Outcome 5

61
ORIGINAL THERMOGRAM
BOXES AROUND DETECTED FACES
NUMBER OF DETECTED FACES
COMMENT
Thermogram was taken few seconds after thermogram in “outcome 5”, so there is one male
and one female and it was taken in apartment as in the previous case. MatLAB process
thermogram (converted into .jpg or .png file) with the wrong results. In the blue-red scale
detects two faces (but male face is detected badly) and in gray scale detects only one face.
Tab. 16: Outcome 6
62
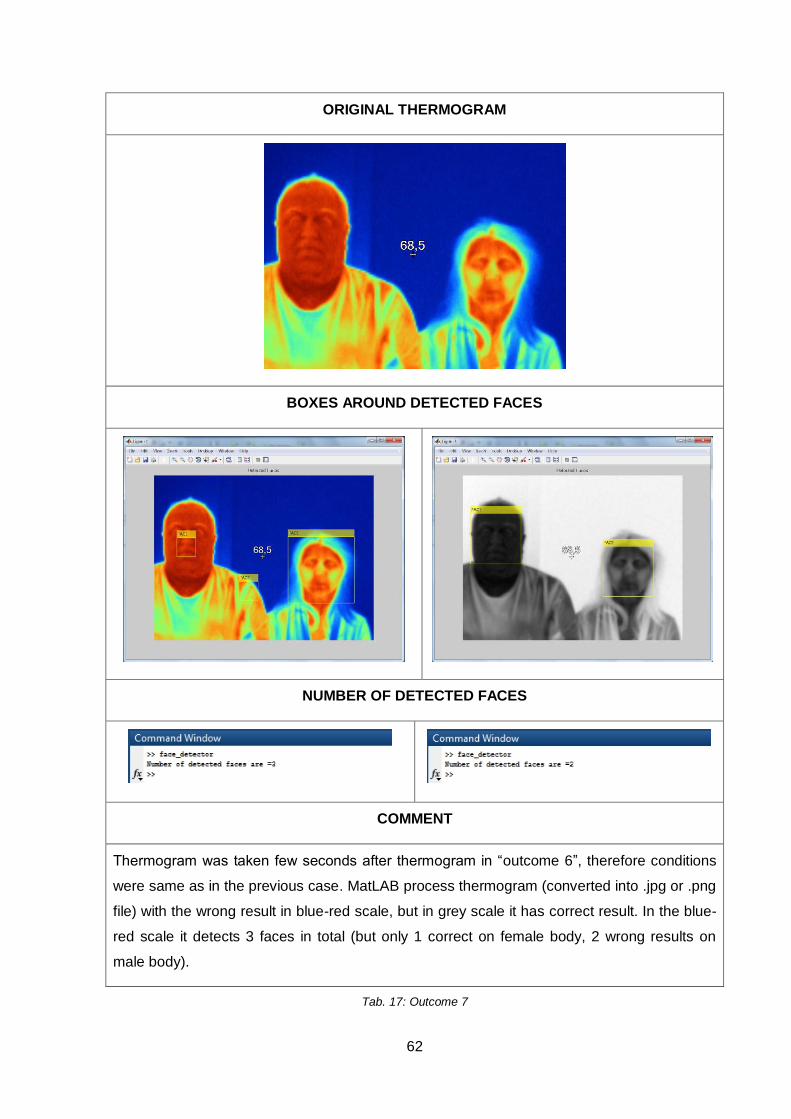
ORIGINAL THERMOGRAM
BOXES AROUND DETECTED FACES
NUMBER OF DETECTED FACES
COMMENT
Thermogram was taken few seconds after thermogram in “outcome 6”, therefore conditions
were same as in the previous case. MatLAB process thermogram (converted into .jpg or .png
file) with the wrong result in blue-red scale, but in grey scale it has correct result. In the blue-
red scale it detects 3 faces in total (but only 1 correct on female body, 2 wrong results on
male body).
Tab. 17: Outcome 7

63
ORIGINAL THERMOGRAMS BOXES AROUND DETECTED FACES
NUMBER OF DETECTED FACES
COMMENT
This thermogram was used from previous chapter, exploring influence of the surrounding
temperature to the human skin. As you see on result, only 2 faces out of 8 were detected
due to the lack of the main face features. However, there are pretty stable temperatures
inside modern cars, so after few minutes in the cabin, face should be stabilized and therefore
be correctly detected. This downloaded thermogram with another temperatures has the best
results (out of 6).
Tab. 18: Outcome 8

64
10. Conclusion
Main goal of my diploma thesis was to find out, if it is even possible to detect human beings
inside the vehicle and what method will be the best. I found out many possible methods how
to detect human inside the vehicle, but my choice was face detection in IR spectrum. I still
think, that this is the best possible solution, however there has to be a lot more research
done. One possible way to improve my solution is to write better algorithm to face detection
in IR spectrum. I think many problems were due to MatLAB face detection function were
created to detect faces in normal spectrum, so in IR spectrum there is a lot of problems
because of lack of some of the face features due to similar skin temperature (outcomes
no. 5,6 and 7) in the decisive features. Maybe this could be done just by re-training Viola-
Jones algorithm to faces in IR spectrum. Also one of the biggest problems are in lower and
higher temperatures in the vehicle, when surrounding air affects skin and causes lack of
some of the face features (outcome no. 8), however every modern car has heating system
and/or AC therefore in few minutes driving, this problem disappear because of temperature
stabilization in the vehicle (most commonly around 20-22 °C).
On the other hand my solution has the biggest costs, because of use of the industrial
thermocameras, that costs around 70 000-200 000,- CZK. For example brand new ŠKODA
Fabia starts at 209 900,- CZK6, so if there will be only one industrial thermocamera, the final
cost of this new car, will be doubled. So in productive process there has to be use of the
low-cost thermocameras with less sensitivity and lower resolution. This two factors also may
have effects on the face detection results.
6 22.5.2016

65
11. Sources
[1] Auto.idnes.cz [online]. [cit. 2015-05-10]. Available from: <http://auto.idnes.cz/ecall-v-
cesku-0c2-/automoto.aspx?c=A131002_145402_automoto_fdv>
[2] Heero-pilot.eu [online]. [cit. 2015-05-10]. Available from: <http://www.heero-
pilot.eu/view/en/ecall.html>
[3] Imobilitysupport.eu [online]. [cit. 2015-05-15]. Available from:
<http://www.imobilitysupport.eu/component/easyblog/?view=entry&id=146&Itemid=101>
[4] Europa.eu [online]. [cit. 2015-05-10]. Available from: <http://europa.eu/rapid/press-
release_IP-09-1245_en.htm?locale=EN>
[5] PŘIBYL, Pavel. Lectures from Traffic telematics on roads (20DTEL). Praha, 2015.
[6] BĚLINOVÁ, Zuzana. Lectures from Telematic systems and their design. Praha, 2015.
Available from: <http://www.its.fd.cvut.cz/ms-en/courses/telematic-systems-and-their-design-
1/6-e-call-rds-tmc_en>
[7] Etsi.org [online]. [cit. 2015-05-15]. Available from: <http://www.emtel.etsi.org/>
[8] Aclassinfo.co.uk [online]. [cit. 2015-12-30]. Available from:
<http://http://www.aclassinfo.co.uk/mypage.39.htm>
[9] Cartalk.com [online]. [cit. 2015-12-30]. Available from:
<http://http://www.cartalk.com/content/bottom-line-japanese-butt-sensor-protect-your-car/>
[10] Cnet.com [online]. [cit. 2015-12-30]. Available from: <http://http://www.cnet.com/news/in-
japan-seat-sensors-that-can-recognize-you/>
[11] CHVÍLÍČKOVÁ, Kateřina. Zádržné systémy v motorových vozidlech jako prvek pasivní
bezpečnosti. Brno, 2011. Bakalářská práce. Masarykova univerzita. Vedoucí práce doc.
RNDr. PhDr. Mojmír Stojan, CSc.
[12] En.wikipedia.org [online]. [cit. 2015-05-15]. Available from:
<https://en.wikipedia.org/wiki/Seat_belt>
[13] Delphi.com [online]. [cit. 2015-05-15]. Available from:
<http://http://www.delphi.com/manufacturers/auto/safety/passive/oc/pods>
[14] Act no. 361/2000 Coll., On Traffic on the Road Network and on Changing Certain Acts,
as amended
66
[15] SKLÁDANÁ, Pavlína. CENTRUM DOPRAVNÍHO VÝZKUMU. Postoje českých řidičů k
používání bezpečnostních pásů [online]. 2006, 23.12.2008 [cit. 2015-02-06]. Available from:
<http://www.cdv.cz/postoje-ceskych-ridicu-k-pouzivani-bezpecnostnich-pasu/
[16] Secamcctv.co.rs [online]. [cit. 2015-05-15]. Available from:
<http://http://www.secamcctv.co.rs/what_is_biometric.php>
[17] Alarmsecurity.cz [online]. [cit. 2016-04-04]. Available from:
<https://www.alarmsecurity.cz/www-alarmsecurity-cz/5-TECHNICKA-PODPORA/38-Typy-
pohybovych-senzoru>
[18] TMVSS.cz [online]. ©2015. [cit. 2015-09-28]. Available from: <http://www.tmvss.cz/>.
[19] KADLEC, Karel. Automa: odborný časopis pro automatizační techniku [online]. Praha:
FCC public, 2014, č. 2. [cit. 2015-09-28]. ISSN 1210-9592. Available from:
<http://automa.cz/teoreticke-zaklady-bezdotykoveho-mereni-teploty-cast-2-52626.html>
[20] Flirmedia.com [online]. Available from:
<http://www.flirmedia.com/MMC/THG/Brochures/T820325/T820325_CZ.pdf>.
[21] ADAMÍK, M. Termovize: Cena, využití a k čemu se hodí? In: Nazeleno.cz [online]. 7. 4.
2010. [cit. 2015-09-28]. ISSN 1803-4160. Available from: <http://www.nazeleno.cz/termovize-
cena-vyuziti-a-k-cemu-se-hodi.aspx>
[22] PAVELEK, M. Teorie termovizních měření. In: Vutbr.cz [online]. [cit. 2015-09-28].
Available from: <http://ottp.fme.vutbr.cz/~pavelek/optika/0700-z01.pdf>.
[23] ROSINA, J.; VRÁNOVÁ, J.; KOLÁŘOVÁ, H.; STANEK, J. Biofyzika. Pro zdravotnické a
medicínské obory. Praha: Grada Publishing, 2013. s. 62. ISBN 978-80-247-4237-3.
[24] BAŠTA, J. Velkoplošné sálavé vytápění: podlahové, stěnové a stropní vytápění a
chlazení. Praha: Grada Publishing, 2010. s. 119-120. ISBN 978-80-247-7308-7.
[25] BENEŠ, J.; KYMPLOVÁ, J.; VÍTEK, F. Základy fyziky pro lékařské a zdravotnické obory:
pro studium i praxi. Praha: Grada Publishing, 2015. s. 145. ISBN 978-80-247-4712-5.
[26] Termokamera.cz [online]. [cit. 2015-09-28]. Available from:
<http://www.termokamera.cz/princip-a-funkce/tepelne-zareni/>
[27] Mega-blog.cz [online]. [cit. 2015-09-28]. Available from: <http://www.mega-
blog.cz/lasery/zelene-a-uv-lasery/>.
[28] Fau.edu [online]. [cit. 2016-05-24]. Available from:
<http://www.ces.fau.edu/nasa/module-2/radiation-sun.php/>

67
[29] SVOBODA, Štěpán. TMV SS, SPOL. S R. O. Elektro: odborný časopis pro
elektrotechniku. Praha: FCC Public, 2005, č. 12. ISSN 1210-0889. Available from:
<http://www.odbornecasopisy.cz/elektro/casopis/tema/mereni-teploty-bezkontaktni-
teplomery-a-termovizni-kamery—13376>.
[30] BRYNDA, P. Úvod do teorie termovizního měření. In: Cvut.cz [online]. [cit. 2015-09-28].
Available from: <http://www.fd.cvut.cz/projects/k611x1s/doc/works/teorie_brynda.pdf>
[31] Pekarská, Veronika: Multimediální učebnice konvenčních zobrazovacích systémů – IR.
ČVUT – Fakulta biomedicínského inženýrství, [online], [cit. 2016-04-27], Available from:
<webzam.fbmi.cvut.cz/hozman/AKK/ZSL_IR.ppt>.
[32] posterus.sk [online]. [cit. 2016-05-02]. Available from:
<http://www.posterus.sk/?p=13335/>
[33] posterus.sk [online]. [cit. 2016-05-02]. Available from:
<http://www.posterus.sk/?p=13337/>
[34] Wikipedia.org [online]. [cit. 2016-04-04]. Available from:
<https://en.wikipedia.org/wiki/Radio-frequency_identification>
[35] Wikipedia.org [online]. [cit. 2016-05-15]. Available from:
<https://en.wikipedia.org/wiki/High-occupancy_vehicle_lane/>
[36] Txdot.gov [online]. [cit. 2016-05-15]. Available from: <http://www.txdot.gov/inside-
txdot/projects/studies/dallas/high-occupancy-vehicle-lanes.html/>
[37] ITSinternational.com [online]. [cit. 2016-05-15]. Available from:
<http://www.itsinternational.com/sections/nafta/features/xerox-automates-hov-hot-
enforcement/>
[38] Autoblog.com [online]. [cit. 2016-05-15]. Available from:
<http://www.autoblog.com/2012/01/18/hov-lane-scams/>
[39] Technologyreview.com [online]. [cit. 2016-05-15]. Available from:
<https://www.technologyreview.com/s/408818/foiling-carpool-lane-cheaters/>
[40] Fluke Thermal Imagers Ti9, Ti10, Ti25, TiRx, TiR and TiR1 User manual
[41] PŘINOSIL, Ing. Jiří a Bc. Martin KROLIKOWSKI. Využití detektoru Viola-Jones pro
lokalizaci obličeje a očí v barevných obrazech. Elektrorevue. 2008, 2008(31): 16. ISSN 1213-
1539.

68
[42] DVOŘÁK, Bc. Lukáš. Oblasti zájmu v kompresi znakového mluvčího [online]. Praha,
2014, 2014 [cit. 2015-12-31]. Available from:
<https://dspace.cvut.cz/bitstream/handle/10467/24419/F3-DP-2014-Dvorak-Lukas-
prace.pdf?sequence=3&isAllowed=y. Diplomová práce. ČVUT v Praze>
[43] Uamt.feec.vutbr.cz [online]. [cit. 2015-12-31]. Available from:
<http://www.uamt.feec.vutbr.cz/~richter/vyuka/0910_mpov/tmp/integral_tr_wavelety.html>
[44] Viola, P.; Jones, M., "Rapid object detection using a boosted cascade of simple
features," in Computer Vision and Pattern Recognition, 2001. CVPR 2001. Proceedings of
the 2001 IEEE Computer Society Conference on , vol.1, no., pp.I-511-I-518 vol.1, 2001
doi: 10.1109/CVPR.2001.990517
[45] ŠOCHMAN, Jan. Cvičení z RPZ – AdaBoost. Praha, 2005. Available from:
<http://cmp.felk.cvut.cz/cmp/courses/recognition/Labs/adaboost/adaboost.pdf>
[46] ANONYM. ADABOOST – Detekce objektu v obraze. Available from:
<http://www.kky.zcu.cz/uploads/courses/zdo/lesson8/ADABOOST_cz.ppt>
[47] Rutgers.edu [online]. [cit. 2016-05-22]. Available from:
<http://www.cs.rutgers.edu/~decarlo/facetrack.html/ >
[48] Wikipedia.org [online]. [cit. 2016-05-22]. Available from:
<https://en.wikipedia.org/wiki/Artificial_neural_network>
[48] Wikipedia.org [online]. [cit. 2016-05-22]. Available from:
<https://cs.wikipedia.org/wiki/Neuronov%C3%A1_s%C3%AD%C5%A5 / >
[50] Colourbox.com [online]. [cit. 2016-04-04]. Available from:
<https://www.colourbox.com/preview/2119444-dashboard-car-tachometer-speedometer-and-
fuel-level-sensor.jpg/>
[51] Topdrive.cz [online]. [cit. 2016-04-04]. Available from: <http://www.topdrive.cz/clanky/jak-
se-spravne-drzi-volant//>
[52] Intechopen.com [online]. [cit. 2016-05-25]. Available from:
<http://www.intechopen.com/books/reviews-refinements-and-new-ideas-in-face-
recognition/thermal-infrared-face-recognition-a-biometric-identification-technique-for-robust-
security-system/>

69
12. Attachments
Act no. 361/2000 Coll., On Traffic on the Road Network and on Changing
Certain Acts
§ 5 Responsibilities of the driver (1) The driver is in addition to the obligations specified in § 4 further obliged j) ensure the safety of the transported person or animal7 and secure the cargo, k) secure transported animal so it cannot harm the driver or transported persons, § 52 Cargo transportation (5) During transportation of living animals must not be compromise the safety of the driver, passengers or animals and even traffic safety on roads.
According to the law, there are 6 possible ways how to transport an animal (usually a dog) –
Net / grid separating part for the animal and for the people
Car seat
Harness belt
Car blanket
Crate / cage
Trailer
7 Act No 246/1992 Coll. On the protection of animals against cruelty

70
Pic. 9 Thermal imager features and controls
Description of Thermal Imager FLUKE TiR
Item Description
1 LCD Display
2 Function Softkeys (F1, F2 and F3)
3 Battery Cover
4 Speaker
5 Microphone
6 Auto backlight sensor
7 Hand Strap
8 AC adapter/charger input terminal
9 SD memory card compartment
10 Retractable Lens Cover
11 Visual camera
12 Thermal (IR) camera
13 Focus control
14 Trigger

71
Proportions of the car
Pic. 11: Proportions of the car
A 2740 mm I 1464 mm
B 4712 mm J 780 mm
C 989 mm K 520 mm
D 983 mm L 1236 mm
E 1502 mm M 750 mm
F 1755 mm N 1100 mm
G 1140 mm O 1650 mm
H 1420 mm

72
Emissivity table
Aluminium: anodised 0.77
Aluminium: polished 0.05
Asbestos: paper 0.93
Brick: common, red 0.93
Brick: fireclay 0.75
Carbon: graphite, filed surface 0.98
Cement: 0.54
Concrete 0.92
Copper: oxidized 0.65
Fibreglass 0.75
Glass 0.92
Graphite: powder 0.97
Gravel 0.28
Ice 0.97
Iron: heavily rusted .91-.96
Lampblack 0.96
Limestone: natural surface 0.96
Mortar 0.87
P.V.C. .91-.93
Paper: black 0.90
Paper: white 0.68
Plaster .86-.90
Plastic: black 0.95
Plastic: white 0.84
Porcelain: glazed 0.92
Rubber 0.95
Sand 0.90
Skin, human 0.98
Snow 0.80
Soil: dry 0.92
Stainless Steel 0.59
Tape: masking 0.92
Wallpaper: slight pattern, red 0.90
Water: 0.95
Water: distilled 0.95
Water: snow 0.85
Wood: planed 0.90
Wood: spruce, polished, dry 0.86

73
General specification of the Thermal Imager Fluke TiR
Temperature
Operating -10 °C to 50 °C
Storage -20 °C to 50 °C without batteries
Charging 0 °C to 40 °C
Relative Humidity 10 to 90 % non-condensing
Display 640 x 480 Color LCD, approx. 2” to 3” (Landscape
orientation) with Backlight (selectable Bright or Auto)
Controls and Adjustment
User selectable temperature scale (°C/°F)
Language selection
Time/Date set
Software SmartView® full analysis and reporting software included
Power
Battery Rechargeable battery pack (included)
Battery Life 3 to 4 hours continuous use (assumes 50 % brightness
of LCD)
Battery Charge Life 2 hours full charge with ac adapter or dc car changer
AC Operation/Charging AC adapter/charger (110 -220 V ac, 50/60 Hz). Charges
battery while imager is operating. Universal ac mains
adapters included.
Power Saving Sleep mode activated after 5 minutes of inactivity
Automatic Power Off after 30 minutes of inactivity

74
Safety Standards
CE Directive IEC/EN 61010-1 2nd Edition Pollution Degree 2
Electromagnetic Compatibility
EMC Directive EN61326-1
C Tick IEC/EC61326
US FCC CFR 47, Part 15 Class A
Vibration 2 G, IEC 68-2-29
Shock 25 G, IEC 68-2-6
Drop 2 meter drop, all-sides
Size (H x W x L) 25.4 cm x 12.7 cm x 15.2 cm
Weight 1.1 kg
Enclosure Rating IP54
Warranty 2 years
Calibration cycle 2 years (assumes normal operation and normal aging)
Supported languages Czech, English, Finnish, French, German, Italian,
Japanese, Korean, Polish, Portuguese, Russian,
Simplified Chinese, Spanish, Swedish, Traditional
Chinese, and Turkish
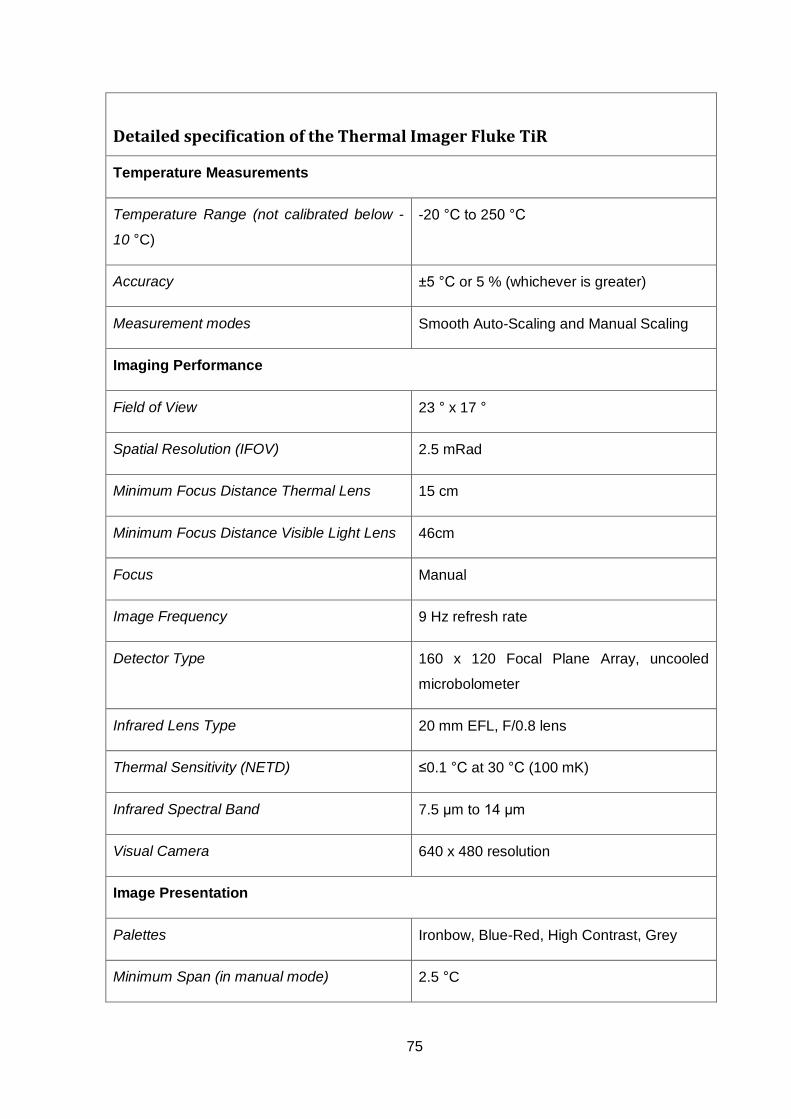
75
Detailed specification of the Thermal Imager Fluke TiR
Temperature Measurements
Temperature Range (not calibrated below -
10 °C)
-20 °C to 250 °C
Accuracy ±5 °C or 5 % (whichever is greater)
Measurement modes Smooth Auto-Scaling and Manual Scaling
Imaging Performance
Field of View 23 ° x 17 °
Spatial Resolution (IFOV) 2.5 mRad
Minimum Focus Distance Thermal Lens 15 cm
Minimum Focus Distance Visible Light Lens 46cm
Focus Manual
Image Frequency 9 Hz refresh rate
Detector Type 160 x 120 Focal Plane Array, uncooled
microbolometer
Infrared Lens Type 20 mm EFL, F/0.8 lens
Thermal Sensitivity (NETD) ≤0.1 °C at 30 °C (100 mK)
Infrared Spectral Band 7.5 μm to 14 μm
Visual Camera 640 x 480 resolution
Image Presentation
Palettes Ironbow, Blue-Red, High Contrast, Grey
Minimum Span (in manual mode) 2.5 °C

76
Minimum Span (in auto mode) 5 °C
IR-Fusion® Information
Picture-in-Picture (PIP) 100 % IR displayed in center 320 x 240 p
Full Screen (PIP off) 100 % IR displayed in center 640 x 480 LCD
Image and Data Storage
Storage Medium SD Memory Card (2 GB memory card will
store at least 1200 fully radiometric (.is2) IR
and linked visual images each with 60
seconds voice annotations or 3000 basic
(.bmp) IR images)
File Format Non-Radiometric (.bmp) or Fully-
Radiometric (.is2)
Export File Formats w/ SmartView® software JPEG, JPG, JPE, JFIF, BMP, GIF, DIP,
PNG, TIF A TIFF
77
13. List of pictures
Pic. 1: Basic graphical representation of eCall Pic. 2: Recommended E-call solution Pic. 3: eCall functions Pic. 4: Pressure seat sensor from Mercedenz-Benz class A Pic. 5: Foot pressure measurement to obtain permission to enter the room Pic. 6: Classic three-point seat belts system Pic. 7: Combination of the pressure sensor and the sensor in the seat belt Pic. 8: Sample of the algorithm for face detection Pic. 9: Electromagnetic spectrum Pic. 10: Diagram of the general thermographic measurement situation Pic. 11: The average temperatures Pic. 12: Individual images taken at the different temperatures Pic. 13: RFID chip in comparison with a grain of rice Pic. 14: Attempt to avoid detection in HOV lane with mannequin Pic. 15: Infrared image of the front seat of a Ford Focus Pic. 16: Torso of Citroen Xantia Pic. 17: The point value of the integral image Pic. 18: Example of the calculation of any rectangle using the integral image Pic. 19: Haar wavelet Pic. 20: Example of AdaBoost Pic. 21: A model of face shape and motion Pic. 22: System design Pic. 23: Diagram of the situation with TC in rear-view mirror Pic. 24: Perspective from rear-view mirror Pic. 25: Diagram of the situation with both TCs in rear-view mirror Pic. 26: Perspective from rear-view mirror for both TCs Pic. 27: Diagram of the situation with one TC in rear-view mirror and second in A slope Pic. 28: Perspective from A slope Pic. 29: Car´s security measurement with face recognition Pic. 30: Diagram of the situation with one TC in rear-view mirror and second in dashboard Pic. 31: Location of the TC in the dashboard Pic. 32: Blocked perspective of TC in dashboard solution Pic. 33: Baby car seat with shade shield on Pic. 34: Flowchart

78
14. List of tables
Tab. 1: Number of eCall bits Tab. 2: Shortcuts for eCall Tab. 3: Use of seat belts on various types of roads in 2002 Tab. 4: The average human body temperature (blue = min., red = max.) Tab. 5: First measurement Tab. 6: Second measurement Tab. 7: Average temperatures of selected zones face of the test persons Tab. 8: Xerox's system for HOV lanes detection Tab. 9: Haar wavelets Tab. 10: Settings of outputs from various sensors in passenger seat Tab. 11: Outcome 1 Tab. 12: Outcome 2 Tab. 13: Outcome 3 Tab. 14: Outcome 4 Tab. 15: Outcome 5 Tab. 16: Outcome 6 Tab. 17: Outcome 7 Tab. 18: Outcome 8

79
15. List of attachments
1. Act no. 361/2000 Coll., On Traffic on the Road Network and on Changing Certain Acts
2. Description of Thermal Imager FLUKE TiR 3. Proportions of the car 4. Emissivity table 5. General specification of Thermal Imager Fluke TiR 6. Detailed specification of Thermal Imager Fluke TiR