Czech Technical University in Prague -...
111
Czech Technical University in Prague Master’s Thesis June 2013 Bc. Michal Bodn ´ ar
Transcript of Czech Technical University in Prague -...

Czech Technical University in Prague
Master’s Thesis
June 2013 Bc. Michal Bodnar

Czech Technical University in Prague
Faculty of Civil Engineering
Department of Mapping and Cartography
Michal Bodnar
Master’s thesis
Research on Geovisualization Methods and
Technology for The WikiGlobe System
Study Programme: Geodesy and Cartography
Field of Study: Geoinformatics
Thesis Supervisors: Ing. Jirı Cajthaml, Ph.D.
Prof. Weng Jingnong


Abstract
The main goal of the thesis is to conduct a research on geovisualization methods and tech-
nology of the WikiGlobe system, a project developed at Beihang University by a team
of GIS software-specialized students under the guidance of Prof. Weng Jingnong from
the College of Software. WikiGlobe project can be seen as ”Wikipedia on Digital Globe”
and its purpose is to merge 3D virtual globe with different kinds of information, such
as text, audio recordings or video. It has its own SDK, which is based on NASA World
Wind Java SDK, a technology for displaying 3D virtual globe. The research is maintained
by developing Great Places WikiGlobe, an application incorporating 100 Great Places of
History according to the book Great Places of History: Civilization’s 100 Most Important
Sites: An Illustrated Journey, published by TIME. About every site, data is collected and
then displayed in a user-friendly and logical way with an extensive use of geovisualization
methods. Even though the main part of the thesis is connected to the application, its
workflow and methodology, a sufficient interest is also given to a research on the literature
describing the terms Digital Earth and Virtual Globe as both of the terms are very closely
related to each other. A very precise description of NASA World Wind Java SDK as a
technology being extensively used in application’s development is convened as well.
Key words : NASA World Wind Java SDK, Virtual Globe, Digital Earth
ii

Abstrakt
Hlavnym ciel’om tejto diplomovej prace je vyskum geovisualizacnych metod a technologie
systemu WikiGlobe, projektu realizovanom na Beihang univerzite tımom studentov spe-
cializovanych na vyvoj GIS softveru pod vedenım profesora Weng Jingnong. WikiGlobe
projekt moze byt’ popısany ako”Wikipedia na Digitalnom Globe“ a jeho hlavnym ciel’om
je dosiahnut’ zlucenie technologie zobrazujucej 3D virtualny globus s rozdielnymi druhmi
informaciı, ako je text, zvukova nahravka alebo video. Disponuje svojım vlastnym SDK,
zalozenym na NASA World Wind Java SDK, technologii ktora umoznuje zobrazit’ 3D
virtualny globus. Vyskum je realizovany prostrednıctvom vyvoja aplikacie s nazvom Great
Places WikiGlobe, ktora ma za ulohu implementovat’ 100 najdolezitejsıch miest historie
vzhl’adom ku knihe Great Places of History: Civilization’s 100 Most Important Sites: An
Illustrated Journey, vydanou nakladatel’stvom TIME. O kazdej pamiatke su zozbierane
potrebne data a zobrazene v aplikacii uzıvatel’sky prıjemne a logicky. Praca sa, okrem
popisu metodologie a postupu pri vytvaranı aplikacie, zaobera taktiez reserse literatury
ohl’adom pojmov Digitalna Zem a Virtualny Globus nakol’ko su si navzajom vel’mi blızko
prepojene. Vel’mi podrobne je taktiez popısana NASA World Wind Java SDK, technologia
nezbytna pri tvorbe aplikacie.
Kl’ucove slova: NASA World Wind Java SDK, Virtualny Globus, Digitalna Zem
iii

Declaration of authorship
Hereby I declare that I have completed the Master thesis called Research on Geovisu-
alization Methods and Technology for The WikiGlobe System by myself. Literature used
and all other references are mentioned in the Bibliography.
In Prague, May 17th, 2013 ...................................
iv

Acknowledgements
At the very beginning, let me thank Prof. Ales Cepek, Csc., a vice-dean for the study
programme Geodesy and Cartography at CTU Prague, who kindly allowed me, without
any doubts, an opportunity to conduct my Master thesis at Beihang University in Beijing
in China as an exchange student.
I would also like to thank Prof. Weng Jingnong from the College of Software at Beihang
University and a vice-dean of International School at the same time, who served as my
external supervisor of the thesis, for all the meetings, useful comments, exchanged emails
and pointing me to the right direction. Let me thank also my home supervisor, Ing. Jirı
Cajthaml, PhD., who did not hesitate to support me in going to study abroad, while still
helping me with a lot of issues via email.
A huge thanks belongs to the members of a research team at Beihang University from
the office G934 of New Main Building, who always, when needed, were eager to help me
with the problems regarding application’s development. Let me thank also Alba Alvarez,
a student of Beihang University, who helped me with a translation of chinese research
papers, searching for the videos for every site and translating data attributes from chinese
into english and vice-versa.
Finally, I would like to thank my family, without whom this thesis would never be a
reality, for their financial and psychological support during my whole studies at either
CTU Prague or Beihang University.
v

Contents
Introduction 1
1 Theoretical background 3
1.1 Digital Earth . . . . . . . . . . . . . . . . . . . . . . . . . . . . . . . . . . 3
1.1.1 Definition . . . . . . . . . . . . . . . . . . . . . . . . . . . . . . . . 3
1.1.2 Digital Earth Initiative . . . . . . . . . . . . . . . . . . . . . . . . . 6
1.1.3 Academic platforms of Digital Earth . . . . . . . . . . . . . . . . . 8
1.2 Virtual Globe . . . . . . . . . . . . . . . . . . . . . . . . . . . . . . . . . . 11
1.2.1 Definition . . . . . . . . . . . . . . . . . . . . . . . . . . . . . . . . 11
1.2.2 Development of virtual globes . . . . . . . . . . . . . . . . . . . . . 12
1.2.3 List of virtual globes . . . . . . . . . . . . . . . . . . . . . . . . . . 13
1.3 NASA World Wind . . . . . . . . . . . . . . . . . . . . . . . . . . . . . . . 22
1.3.1 Definition . . . . . . . . . . . . . . . . . . . . . . . . . . . . . . . . 22
1.3.2 World Wind Data . . . . . . . . . . . . . . . . . . . . . . . . . . . . 26
2 Methodology 38
2.1 Great Places WikiGlobe . . . . . . . . . . . . . . . . . . . . . . . . . . . . 38
2.1.1 Description . . . . . . . . . . . . . . . . . . . . . . . . . . . . . . . 38
2.1.2 Study area . . . . . . . . . . . . . . . . . . . . . . . . . . . . . . . . 40
2.2 Required methods . . . . . . . . . . . . . . . . . . . . . . . . . . . . . . . . 42
2.2.1 Java programming language . . . . . . . . . . . . . . . . . . . . . . 42
2.2.2 Relational Database Management System (RDBMS) . . . . . . . . 45
2.3 Database design . . . . . . . . . . . . . . . . . . . . . . . . . . . . . . . . . 47
2.4 Application design . . . . . . . . . . . . . . . . . . . . . . . . . . . . . . . 49
2.4.1 Graphical User Interface . . . . . . . . . . . . . . . . . . . . . . . . 49
2.4.2 Design of GUI . . . . . . . . . . . . . . . . . . . . . . . . . . . . . . 51
vi

2.5 Implementation . . . . . . . . . . . . . . . . . . . . . . . . . . . . . . . . . 52
2.5.1 Development environment . . . . . . . . . . . . . . . . . . . . . . . 52
2.5.2 Implementation of GUI . . . . . . . . . . . . . . . . . . . . . . . . . 54
2.5.3 Implementation of World Wind Java technology . . . . . . . . . . . 60
2.5.4 Implementation of an information window . . . . . . . . . . . . . . 66
3 Results 77
4 Conclusion and Discussion 80
Bibliography 82
List of Figures 89
Listing 90
List of Tables 91
A Content of the attached DVD 92
B Application’s guide 93
B.1 Application’s requirements . . . . . . . . . . . . . . . . . . . . . . . . . . . 93
B.2 Running the application . . . . . . . . . . . . . . . . . . . . . . . . . . . . 93
C TIME’s Great Places of History 94
vii

Introduction
Today’s world is the world of the information. A new wave of technological innovation is
allowing us to capture, store, process and display an unprecedented amount of information
about our planet and a wide variety of environmental and cultural phenomena [7]. The
most of this information refers to a specific place on the Earth, i.e. it is georeferenced. We
call this data geospatial data and the information derived from it geospatial information.
The amount of geodata that large spatial databases have to deal every day with is in-
credibly huge. Examples are the terabytes of georeferenced data generated daily by Earth
Observation Satellites, census databases and large databases of climate and environmental
data [12]. The question that arises from managing such flood of geospatial information
is how to manage and take an advantage of this data, how to turn them into an under-
standable information. Satellite systems, such as Landsat, is capable of taking the digital
images of the whole planet every two weeks, which gives us a great number of such images
for 20 years of its working. Viewing these images one by one would be ineffective and not
helpful in terms of finding any valuable information or spatial pattern in this data.
The solution for this issue was firstly presented by former U.S. vice-president Al Gore
during his speech in 1998 in California. He spoke about the project called Digital Earth,
which described as a ” ... multi-resolution, three-dimensional representation of the planet,
into which we can embed vast quantities of georeferenced data” [7]. He saw the way of de-
picting geographic information on the globe as a very revolutionary attempt of displaying
geodata that will be understandable at the same time.
Al Gore’s innovating idea turned into creation of many different projects. One such
example is GoogleTM Earth, one of the phenomena of these days, being widely used by
1

CONTENTS
millions of people at their home. In 2004, a group of engineers in NASA1 came up with
the project called NASA World Wind. They created a so-called virtual globe, a 3D model
representing the Earth. Since NASA has more planetary information than any other
organization in the world, the software’s population was increasing rapidly. Different
geovisualization technologies, that time revolutionary, were implemented. For example,
the user could zoom from a space altitude onto the whole Earth covered by the satellite
imagery, or, in contrary, zoom into a particular place on the Earth and look on its features.
He could plan a journey from New York to Beijing by exploring the route and measuring
the length between the cities. All of that could be done within a short time and for free,
what in a real world would cost much money.
The goal of this Master thesis is to give a deeper look into geovisualization techniques
that NASA World Wind Java SDK is equipped with. This research is conducted via
creating the WikiGlobe application called Great Places WikiGlobe. WikiGlobe is a project
undertaken by a team of GIS-specialized students at Beihang University for many years
with the basic idea of putting the 3D globe together with different kind of information,
such as text, audio recordings or video. It disposes with its own SDK, which is based
on above mentioned World Wind Java SDK. The application is incorporating 100 Great
Places of History according to the book Great Places of History: Civilization’s 100 Most
Important Sites: An Illustrated Journey published by TIME Home Entertainment.
The remainder of the thesis is organised as follows: the chapter 2 serves as a theoretical
background of the thesis, where sufficient interest is given to a research on the literature
describing the terms Digital Earth and Virtual Globe as both of them are very closely
related to each other. A very precise description of World Wind Java SDK as a technology
being extensively used in application’s development is convened as well. The chapter 3
describes the workflow of the application’s development as well as methods and technology
needed for it. In the chapter 4, the results are depicted. Chapter 5 offers the conclusion
of the thesis together with the discussion, where future possible work is outlined.
1National Aeronautics and Space Administration
Michal Bodnar: Research on Geovisualization Methods and Technology forThe WikiGlobe System
2

Chapter 1
Theoretical background
This chapter serves to clarify and get better understanding of the terms being continu-
ously used in this thesis and so Digital Earth and Virtual Globe. The first section deals
with the term Digital Earth, its evolving over time, the technology hidden behind it and
an initiative in scientific, commercial and academic areas. The second section describes
the term Virtual Globe and its connection to Digital Earth in terms of the development.
It is also listing the most famous virtual globes today with pointing out Google Earth as
the leader on the market within this technology. Last section serves as a deep introduction
into NASA World Wind, one of the virtual globes being developed these days. Firstly, it
explains the difference between two its applications: WorldWind.NET and World Wind
Java SDK. Afterwards, the process of data retrieval is outlined, together with mentioning
all the digital imagery this virtual globe disposes with.
1.1 Digital Earth
1.1.1 Definition
It was January 31, 1998 when an US vice-president Al Gore (Figure 1.1) mentioned
the term Digital Earth for the first time in its relatively short history. This all happened
during one of his speeches given at California Science Center in Los Angeles. Speaking
to the crowd, he described Digital Earth as ” ... a multi-resolution, three-dimensional
representation of the planet, into which we can embed vast quantities of geo-referenced
data” [7]. He tried to outline its potential use by giving the following example (a passage
extracted from his speech):
3

1. THEORETICAL BACKGROUND
”Imagine, for example, a young children going to a Digital Earth exhibit at a local
museum. After donning a head-mounted display, she sees Earth as it appears from space.
using a data glove, she zooms in, using higher and higher levels of resolution, to see
continents, then regions, countries, cities, and finally individual horses, trees, and other
natural and man-made objects. Having found an area of the plant she is interested in
exploring, she takes the equivalent of a ”magic carpet ride” through a 3-D visualization of
the terrain. Of course, terrain is only one of the many kinds of data with which she can
interact. Using systems’ voice recognition capabilities, she is able to request information
on land cover, distribution of plant and animal species, real-time weather, roads, political
boundaries, and population” [20].
Figure 1.1: Former US vice-president Al Gore.
To fulfil this vision, according to [7] there was a need to merge following technologies:
Computational Science, Mass Storage, Satellite Imagery, Broadband Networks, Interop-
erability and Metadata. Each of them would play an important role in creating a global,
collaborative linking of systems. Computational Science is a technology that is all around
us in every aspect of our life. Al Gore said that ” ... with high-speed computers as a
new tool, we can simulate phenomena that are impossible to observe, and simultaneously
better understand data from observations ... modelling and simulation will give us new
insights into the data that we are collecting about our planet” [7]. Mass Storage is another
Michal Bodnar: Research on Geovisualization Methods and Technology forThe WikiGlobe System
4

1. THEORETICAL BACKGROUND
important element in the process of Digital Earth’s development as it is obvious that
creating Digital Earth would require storing billions of bytes of information. Satellite
Imagery would fulfil its importance as a very rich source of data. Taken into account
number of satellite images provided by for example Landsat satellite every day, it would
give the whole technology another dimension. Broadband Networks would play their role
in connecting all the servers storing data by thousands of different organizations. Interop-
erability could not be omitted as there would be a huge need for stating a protocol upon
which all the geographic information produced would become compatible and readable by
different application software. Finally, Metadata, also known as data about data, would
be the last piece of imaginary puzzle. It would provide us with extremely useful infor-
mation of let’s say imagery, with its name, location, data format or resolution. Here we
have to understand that technologies which seem to be for us a natural part of our life
and science nowadays, have not been truly realized 15 years ago.
From the example with the young girl mentioned above, one could see Google Earth as
being the perfect example of Digital Earth application. After all, the following extraction
of Al Gore’s speech includes Virtual Globe as a technology incorporated within Digital
Earth:
”A Digital Earth could provide a mechanism for users to navigate and search for geospa-
tial information-and for producers to publish it. The Digital Earth would be composed of
both the user interface - a browsable, 3D version of the planet available at various levels
of resolution, a rapidly growing universe of networked geospatial information, and the
mechanisms for integrating and displaying information from multiple sources” [7].
In a scientific community, however, different authors offer different perspectives towards
this issue while using different terminology as well. Majority of them call Google Earth
Virtual Globe or geobrowser rather than Digital Earth. There is no clear ”yes” or ”no”
answer on the question whether geobrowsers could be considered being Digital Earth.
Grossner and Clarke [20] say that ”Google Earth is fun, and it is breakthrough technology
with terrific potential, but it is simply not that (Digital Earth)”. They argue Google Earth
(or any other geobrowser being used nowadays) is just a part of Digital Earth system and
” ... a notable advance in virtual globe interfaces and geographic visualization that will
inform any digital earth system going forward”. Madden et al. [11] also call Google Earth
Michal Bodnar: Research on Geovisualization Methods and Technology forThe WikiGlobe System
5
1. THEORETICAL BACKGROUND
Virtual Globe rather than Digital Earth. Foresman [18] sees creation of geobrowsers as
a transition point in Digital Earth community. He stresses an importance of its release
and says ”... Digital Earth vision can be expressed as reaching its first operational phase
with the advent of multiple commercial and government web-based 3D geobrowsers.” Guo
et al. [16], on the other hand, consider Google Earth as an example of commercial Digital
Earth systems. The same pays for Wang et al. [10] who see 3D geobrowsers as Digital
Earth Science system.
As can be seen from the previous paragraph, opinions regarding whether Digital Earth
and Virtual Globe (or geobrowser) should be considered as one system, differ. Looking
back to the past and taking into account the words spoken by Al Gore, it looks like Virtual
Globe cannot be truly considered being Digital Earth. Digital Earth, in a vision of former
US vice-president, should be a system that ” ... will include not only high-resolution
satellite imagery of the planet, digital and economic, social and demographic information.
If we are successful, it will have broad societal and commercial benefits in areas such as
education, decision-making for a sustainable future, land-use planning, agricultural and
crisis management.” [7]. As virtual globes do not meet all the mentioned requirements,
then, in this work, Virtual Globe and Digital Earth are regarded as two different terms,
however, and this has to be stressed, closely related to each other. Because of that reason,
a first part of this chapter deals with the development of Digital Earth, since advent of
geobrowsers can be regarded as an important step in order to realize the Gore’s vision.
1.1.2 Digital Earth Initiative
It has been 15 year since the term Digital Earth has been mentioned for the first time.
During this time period, a lot of effort have been put in order to try to fulfil the vision
outlined by former US vice-president. While at the beginning it has been mainly research
community (USA, China) putting the idea of Digital Earth technology forward, later on,
commercial sector has also given a valuable input into it by creating already mentioned
geobrowsers.
The first country that took part in developing Digital Earth was USA. During the three
years between 1998 and 2001, a US Government sponsored ”Digital Earth Initiative”,
coordinated by the Interagency Digital Earth Working Group (IDEWG), and chaired by
Michal Bodnar: Research on Geovisualization Methods and Technology forThe WikiGlobe System
6

1. THEORETICAL BACKGROUND
the National Aeronautics and Space Administration (NASA), sought to realize the Gore’s
vision to priorities outlined in the speech: ”In the first stage, we should focus on integrating
the data from multiple sources that we already have” [7]. The group itself has specialized
on the following sectors defining the early concept for Digital Earth: visualization and
exploration, education and outreach, science and applications, advanced display sites,
data access and distribution and standards and architecture. Government patricipants of
IDEWG included representatives from NOAA, USGS, USACE, EPA, USDF and NSF1.
Major standard associations taking part in IDEWG were the Open Geospatial Consortium
(OGC), the Global Spatial Data Infrastructure (GSDI) and the International Standards
Organization (ISO).
The three-years working effort of IDEWG resulted into development of widely known
and accepted Web Mapping Service (WMS) and Digital Earth Reference Model (DERM)
in order to define standards and architecture guidelines of Digital Earth. The workshops
organized by IDEWG became visited by more and more representatives from industry and
academia. By march 2000, over dozens of Digital Earth 3D prototypes, called also Digital
Earth Alpha version, were presented by different industries. Within two years, these
prototypes were captivating international audiences in government, business, science, and
mass media who began to purchase the early commercial geobrowsers (Figure 1.2, more
about geobrowser in the section 1.2). Therefore we can call the advent of geobrowsers
becoming a symbolic harbinger for the Digital Earth initiative.
After 2001, the banner raised for Digital Earth Initiative lowered down and the coordi-
nation of related activities was taken up by Geospatial Applications and Interoperability
(GAI) working group, a part of the US Federal Geographic Data Committee (FGDC),
formed in 1990 [20]. This working group remained active until 2004. During these three
years, a couple of achievements were made, from which the biggest one was a development
of Geospatial Interoperability Reference Model (GIRM). By 2008, Digital Earth initia-
tives in US Government were limited primarily to NASA’s World Wind (more about it in
section 1.3), Earth Observatory programs and NOAA’s Science on a Sphere [18]. Besides
governmental support of Digital Earth, there were also academia and industry taking part
in its development, however, being not so active as could be expected. IDEWG documents
1 National Oceanographic and Atmospheric Administration (NOAA); US Geological Survey (USGS);US Army Corps of Engineers (USACE); Environmental Protection Agency (EPA); US Department ofAgriculture (USDA); National Science Foundation (NSF)
Michal Bodnar: Research on Geovisualization Methods and Technology forThe WikiGlobe System
7
1. THEORETICAL BACKGROUND
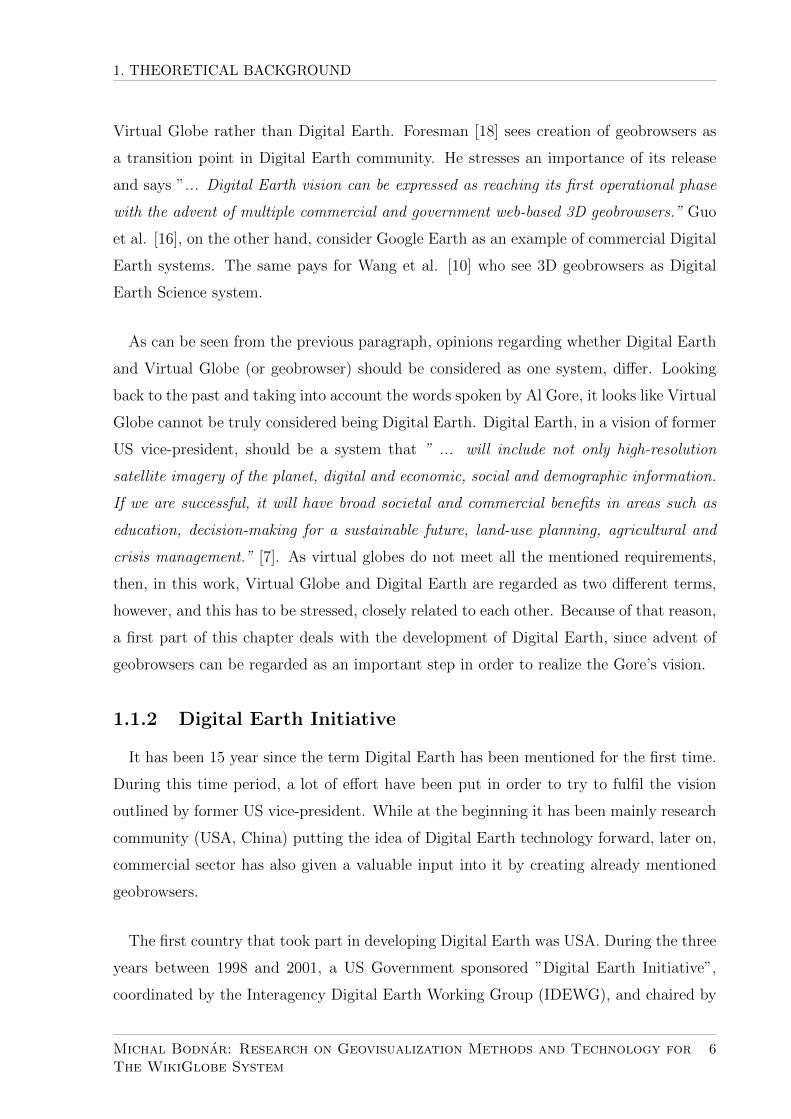
Figure 1.2: First international showing of EarthviewerR©
geobrowser in Nairobi, Kenya2001.
mentioned only University of Maryland and GIS software developers, ESRIR©
, as only two
representatives from either academia or industry involved in the process of development
of Digital Earth in USA.
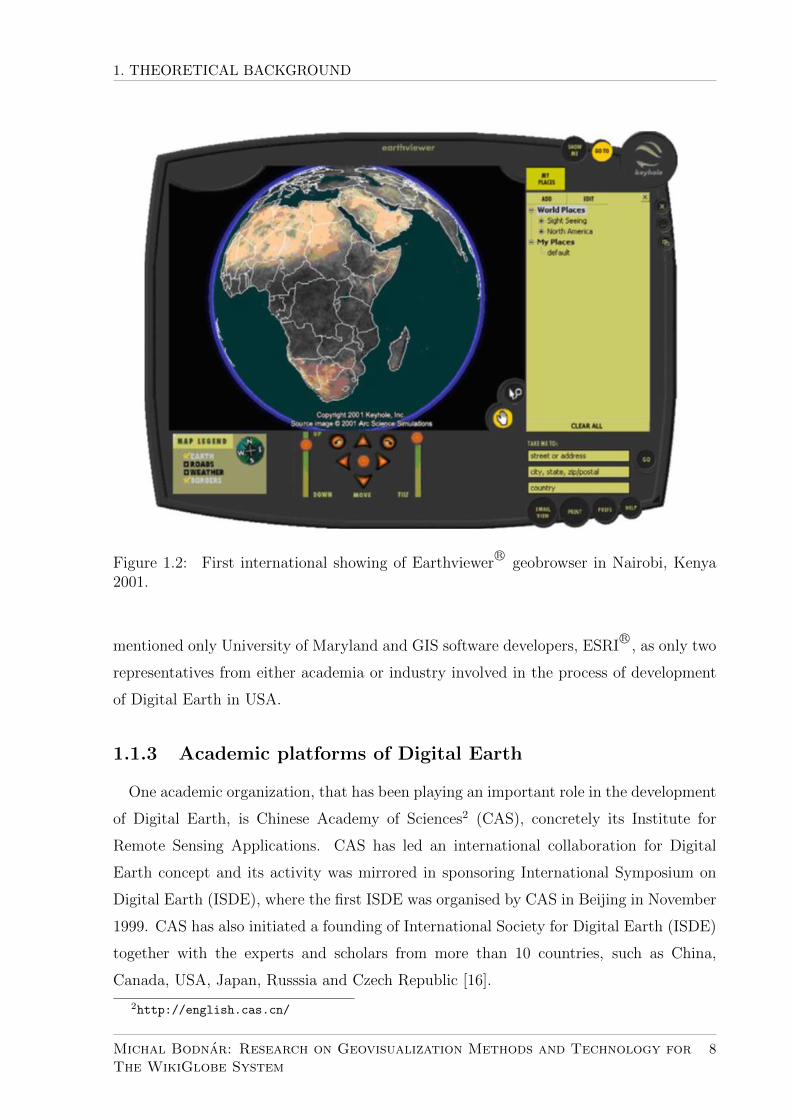
1.1.3 Academic platforms of Digital Earth
One academic organization, that has been playing an important role in the development
of Digital Earth, is Chinese Academy of Sciences2 (CAS), concretely its Institute for
Remote Sensing Applications. CAS has led an international collaboration for Digital
Earth concept and its activity was mirrored in sponsoring International Symposium on
Digital Earth (ISDE), where the first ISDE was organised by CAS in Beijing in November
1999. CAS has also initiated a founding of International Society for Digital Earth (ISDE)
together with the experts and scholars from more than 10 countries, such as China,
Canada, USA, Japan, Russsia and Czech Republic [16].
2http://english.cas.cn/
Michal Bodnar: Research on Geovisualization Methods and Technology forThe WikiGlobe System
8
1. THEORETICAL BACKGROUND
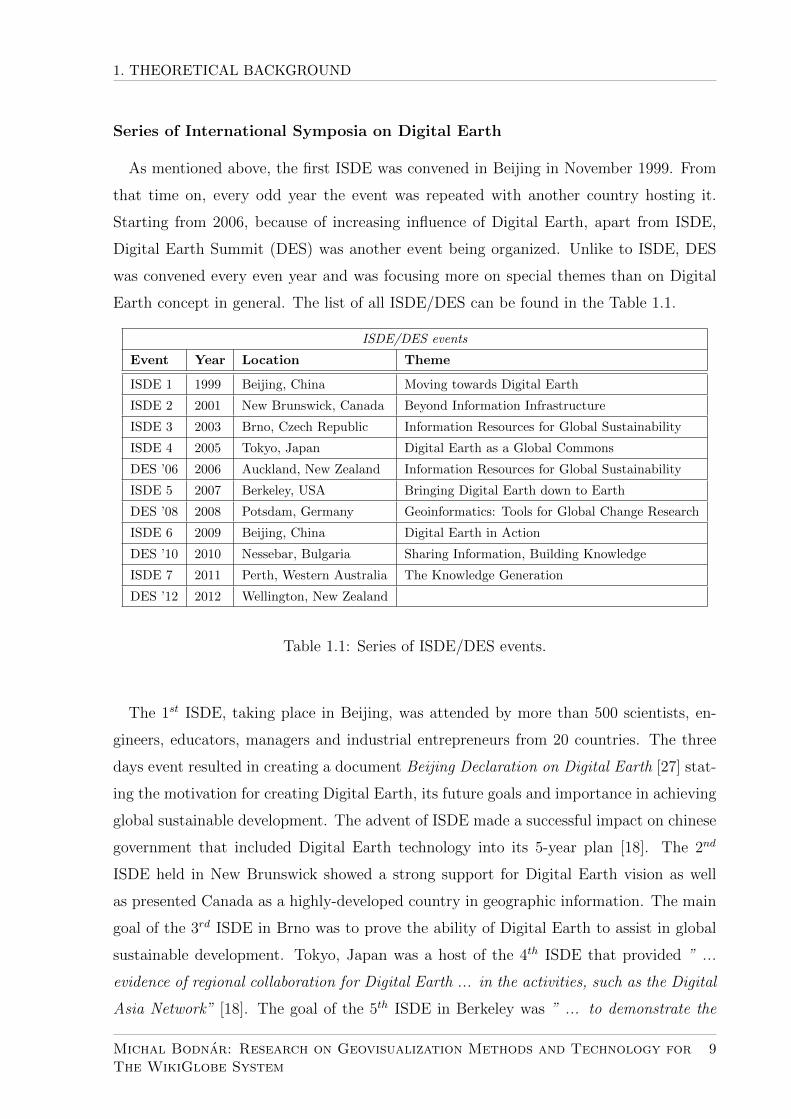
Series of International Symposia on Digital Earth
As mentioned above, the first ISDE was convened in Beijing in November 1999. From
that time on, every odd year the event was repeated with another country hosting it.
Starting from 2006, because of increasing influence of Digital Earth, apart from ISDE,
Digital Earth Summit (DES) was another event being organized. Unlike to ISDE, DES
was convened every even year and was focusing more on special themes than on Digital
Earth concept in general. The list of all ISDE/DES can be found in the Table 1.1.
ISDE/DES events
Event Year Location Theme
ISDE 1 1999 Beijing, China Moving towards Digital Earth
ISDE 2 2001 New Brunswick, Canada Beyond Information Infrastructure
ISDE 3 2003 Brno, Czech Republic Information Resources for Global Sustainability
ISDE 4 2005 Tokyo, Japan Digital Earth as a Global Commons
DES ’06 2006 Auckland, New Zealand Information Resources for Global Sustainability
ISDE 5 2007 Berkeley, USA Bringing Digital Earth down to Earth
DES ’08 2008 Potsdam, Germany Geoinformatics: Tools for Global Change Research
ISDE 6 2009 Beijing, China Digital Earth in Action
DES ’10 2010 Nessebar, Bulgaria Sharing Information, Building Knowledge
ISDE 7 2011 Perth, Western Australia The Knowledge Generation
DES ’12 2012 Wellington, New Zealand
Table 1.1: Series of ISDE/DES events.
The 1st ISDE, taking place in Beijing, was attended by more than 500 scientists, en-
gineers, educators, managers and industrial entrepreneurs from 20 countries. The three
days event resulted in creating a document Beijing Declaration on Digital Earth [27] stat-
ing the motivation for creating Digital Earth, its future goals and importance in achieving
global sustainable development. The advent of ISDE made a successful impact on chinese
government that included Digital Earth technology into its 5-year plan [18]. The 2nd
ISDE held in New Brunswick showed a strong support for Digital Earth vision as well
as presented Canada as a highly-developed country in geographic information. The main
goal of the 3rd ISDE in Brno was to prove the ability of Digital Earth to assist in global
sustainable development. Tokyo, Japan was a host of the 4th ISDE that provided ” ...
evidence of regional collaboration for Digital Earth ... in the activities, such as the Digital
Asia Network” [18]. The goal of the 5th ISDE in Berkeley was ” ... to demonstrate the
Michal Bodnar: Research on Geovisualization Methods and Technology forThe WikiGlobe System
9

1. THEORETICAL BACKGROUND
pace of the world’s leading countries in Digital Earth construction” [10]. 10 years after
the 1st ISDE was convened in Beijing, its 6th continuation took place again at the same
place. And again, a document Beijing Declaration on Digital Earth [27] was presented
and somehow highlighted the advance in Digital Earth development that has happened
during previous 10 years. The 7th, and until now the last ISDE was convened in Perth
and explored the role Digital Earth played in economic and social sustainable develop-
ment, environmental protection, disaster mitigation, natural resource conservation and
improvement of human being’s living standard [26].
Apart from ISDE, a series of DES has been convened continuously every 2 years from
2006. The DES ’06, which took place in Auckland, represented the most significant scien-
tific gathering ever held in this part of the world [28]. It focused on the most important
issue in last decade – long-term survival. The importance of Digital Earth as a technology
to ensure the global sustainability was stressed. Two years later, DES ’08 was held in
Potsdam and its main goal was ” ... to discuss a role of digital earth science and tech-
nology, especially geoinformatics, in global change issues, which has significant meanings”
[29]. The DES ’10 in bulgarian Nessebar focused on the role that Digital Earth played
in the society and sustainable development at a local and regional level [29]. Last year,
DES ’12 was organized in Wellington with three main work streams: Digital environment,
Resilient cities and Growing up digital [31].
International Society for Digital Earth
International Society for Digital Earth (ISDE)3 is a ” ... non-political, non-governmental,
and not-for-profit international organization initiated by the CAS with the collaboration
of institutes and related scholars throughout the world. The ISDE secretariat is hosted by
the Center for Earth Observation and Digital Earth, CAS. Prof. Lu Yongxiang serves as
the founding president of the ISDE” [16]. It was established in 2006 with the aim ” ... to
promote international cooperation of Digital Earth vision and enable Digital Earth tech-
nologies to play key roles in, inter alia, economic and socially sustainable development, to
promote information technology and to reduce the digital gap” [14]. From 2006 on, both
bi-annual symposia and summits were convened under the auspices of ISDE. It is worth
it to mention that former US vice-president Al Gore, from who the vision of Digital Earth
3http://digitalearth-isde.org/
Michal Bodnar: Research on Geovisualization Methods and Technology forThe WikiGlobe System
10

1. THEORETICAL BACKGROUND
was predicted, acts as the Special Advisor of the Society.
Figure 1.3: A logo of ISDE.
International Journal of Digital Earth
One of the big achievements made by ISDE was a release of the electronic journal
focusing on Digital Earth issues, International Journal of Digital Earth (IJDE). It was
launched with a cooperation of Taylor & Francis Group in March 2008. IJDE is ” ...
an international, peer-reviewed research journal and it is the first professional journal in
the field of Digital Earth” [16]. It serves as a response to the Digital Earth initiative and
focuses on Digital Earth applications that can improve human conditions, protect the
environment and support sustainable development. The International Editorial Board of
IJDE includes 23 experts from 16 different countries. It is likely that IJDE is going to
play an important role in a future research of Digital Earth.
1.2 Virtual Globe
1.2.1 Definition
Virtual Globe is a 3D software model or representation of Earth or another world [6]. It
provides user with an ability to move around the globe, zoom in/out, view the globe from
a different angle and position. As being mentioned for couple of times before, advent of
the geobrowser can be regarded as the first milestone in the development of Digital Earth
according to the vision of Al Gore.
Virtual Globe is a term closely related with the term (3D) geobrowser. Because of that,
many authors do not distinguish between them, such as Grossner and Clarke [18], who
Michal Bodnar: Research on Geovisualization Methods and Technology forThe WikiGlobe System
11

1. THEORETICAL BACKGROUND
Figure 1.4: A cover of IJDE.
even put these two terms together and call Google Earth ”virtual globe geobrowser” soft-
ware. Foresman [18] uses only the term geobrowser, while Madden et al.[11] call it virtual
globe. Guo et al.[16] regard Google Earth and other virtual globes being ”commercial
Digital Earth systems.”
1.2.2 Development of virtual globes
In 2000, the United Nations Environment Programme (UNEP) applied Digital Earth
architecture in order to design its data and information resources. The application
UNEP.Net was based on GSDI/DERM architecture, that is, a network of databases cre-
ating a framework of linked servers, incorporating that time advanced GIS tools and
its capabilities. However, there was clearly a need for a universal interface, that could
be easily operated by non-scientists as well. UNEP began actively testing prototypes for
UNEP.Net geobrowser beginning in mid-2001 with a showcase for the African commu-
nity displayed at the 5th African GIS Conference in Nairobi, Kenya in November 2001
[18]. Lot of prototypes were presented, among which the most promising were Keyhole’s
EarthviewerR©
(Figure 1.2) and the Goefusion’s GeoplayerR©
. At the same time, NASA
was hard at building its own virtual globe called NASA World Wind, being firstly released
in 2004.
Michal Bodnar: Research on Geovisualization Methods and Technology forThe WikiGlobe System
12

1. THEORETICAL BACKGROUND
The demand for creating prototypes for 3D geobrowsers became such huge that a docu-
ment called Functional User Requirements for geobrowsers was proposed in order to define
the requirements that common user of geobrowser would have on this system. The pro-
posal was sent to the ISDE Secretariat and organising committee for the 3rd ISDE and
together with CAS an agreement was made to host the first of the geobrowser meetings.
In December 2002, the 1st International Digital Earth Workshop (IDEW) was hosted by
the newly constituted ISDE secretariat to review the status of visualization and geobrowser
technological advances [18]. It was such a great success that a series of similar events fo-
cusing on 3D geobrowsers were convened. During the ISDE5, which was held in Nessebar
in Bulgaria, a maturity of geobrowsers was so big that it started to find its use in dif-
ferent areas and applications for humanitarian, environmental protection and community
empowerment were presented.
Despite a huge scientific effort given to the development of geobrowsers, the biggest
breakthrough in its history was made in a commercial sector by the release of Google Earth
presented by GoogleTM . The advent of Google Earth as a free commercial product brought
the idea of Digital Earth to the home of millions of users of the internet, what significantly
increased the popularity of this system. Zooming from a birds-eye (or satellite’s) 3D
view of the planet to hovering helicopter-like over the site of a news event has become
commonplace, thank to the unique technology developed by KeyholeR©
. While Google
Earth was not the first virtual globe geobrowser software, it has been easily the most
successful with having more than 100 million product activations by June 2006 [20]. Later
on, in November 2006, MicrosoftR©
entered the market of virtual globes as well with
Virtual Earth 3DR©
(Figure 1.5) application that was similar to Google Earth in terms of
its functionality but was lacking the number of users. At the same time, ESRI came up
with ArcGISR©
Explorer (Figure 1.6), a client of its ArcGISR©
Server. It differed from the
other geobrowsers in a way that it was a ”true” GIS application allowing users queries
and analysis on the underlying data.
1.2.3 List of virtual globes
During last decade, many different virtual globes were produced. To keep it all orga-
nized, here is the list of most famous and used virtual globes today according to [6]:
• NASA World Wind;
Michal Bodnar: Research on Geovisualization Methods and Technology forThe WikiGlobe System
13

1. THEORETICAL BACKGROUND
Figure 1.5: Microsoft Virtual 3D.
• CitySurf Globe;
• BingR©
Maps 3D (previously Microsoft Virtual Earth 3D);
• Worldwide Telescope;
• Google Earth;
• Marble;
• OpenWebGlobe;
• Cesium;
• ArcGIS Explorer;
• EarthBrowser;
• Earth 3D;
• Bhuvan.
Michal Bodnar: Research on Geovisualization Methods and Technology forThe WikiGlobe System
14
1. THEORETICAL BACKGROUND
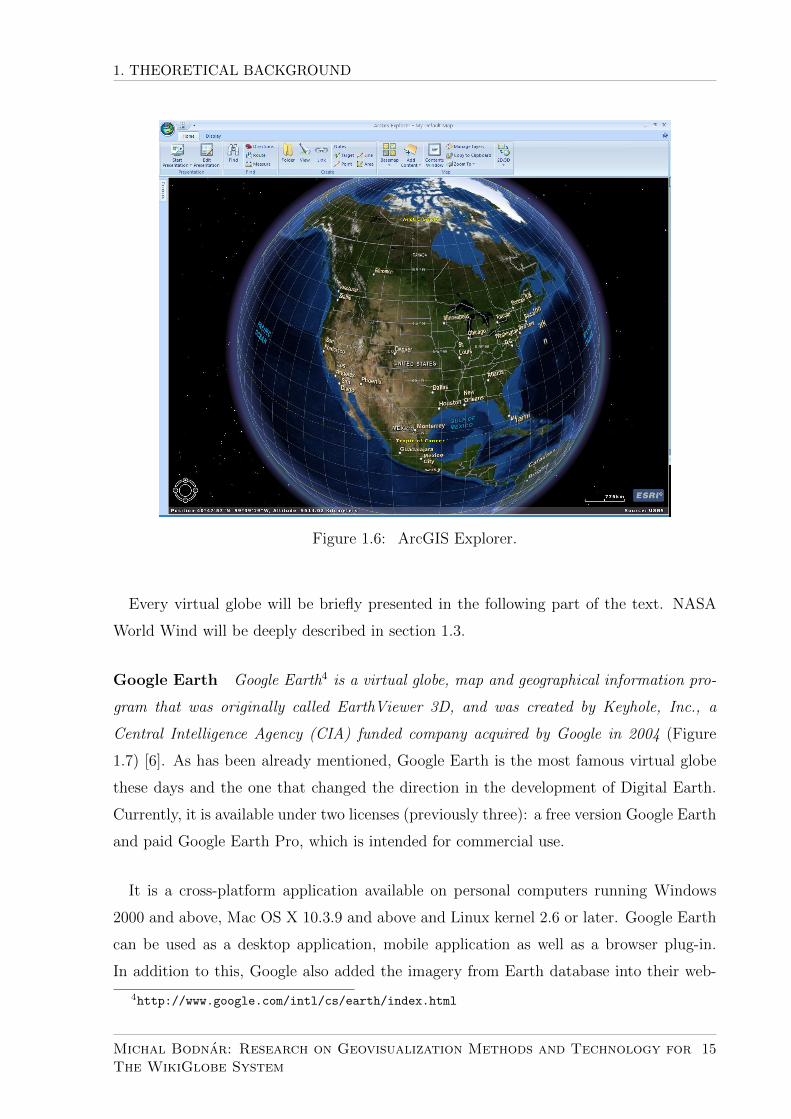
Figure 1.6: ArcGIS Explorer.
Every virtual globe will be briefly presented in the following part of the text. NASA
World Wind will be deeply described in section 1.3.
Google Earth Google Earth4 is a virtual globe, map and geographical information pro-
gram that was originally called EarthViewer 3D, and was created by Keyhole, Inc., a
Central Intelligence Agency (CIA) funded company acquired by Google in 2004 (Figure
1.7) [6]. As has been already mentioned, Google Earth is the most famous virtual globe
these days and the one that changed the direction in the development of Digital Earth.
Currently, it is available under two licenses (previously three): a free version Google Earth
and paid Google Earth Pro, which is intended for commercial use.
It is a cross-platform application available on personal computers running Windows
2000 and above, Mac OS X 10.3.9 and above and Linux kernel 2.6 or later. Google Earth
can be used as a desktop application, mobile application as well as a browser plug-in.
In addition to this, Google also added the imagery from Earth database into their web-
4http://www.google.com/intl/cs/earth/index.html
Michal Bodnar: Research on Geovisualization Methods and Technology forThe WikiGlobe System
15

1. THEORETICAL BACKGROUND
based mapping application, GoogleTM Maps [6]. The user can view the Earth in 3D by
using Digital Elevation Model (DEM) collected by USGS. Another interesting feature
is its own developed language for managing geospatial data, Keyhole Markup Language
(KML), allowing user to add his own data into the application. As of October 2011, this
application has been downloaded for more than a billion times.
Figure 1.7: Google Earth.
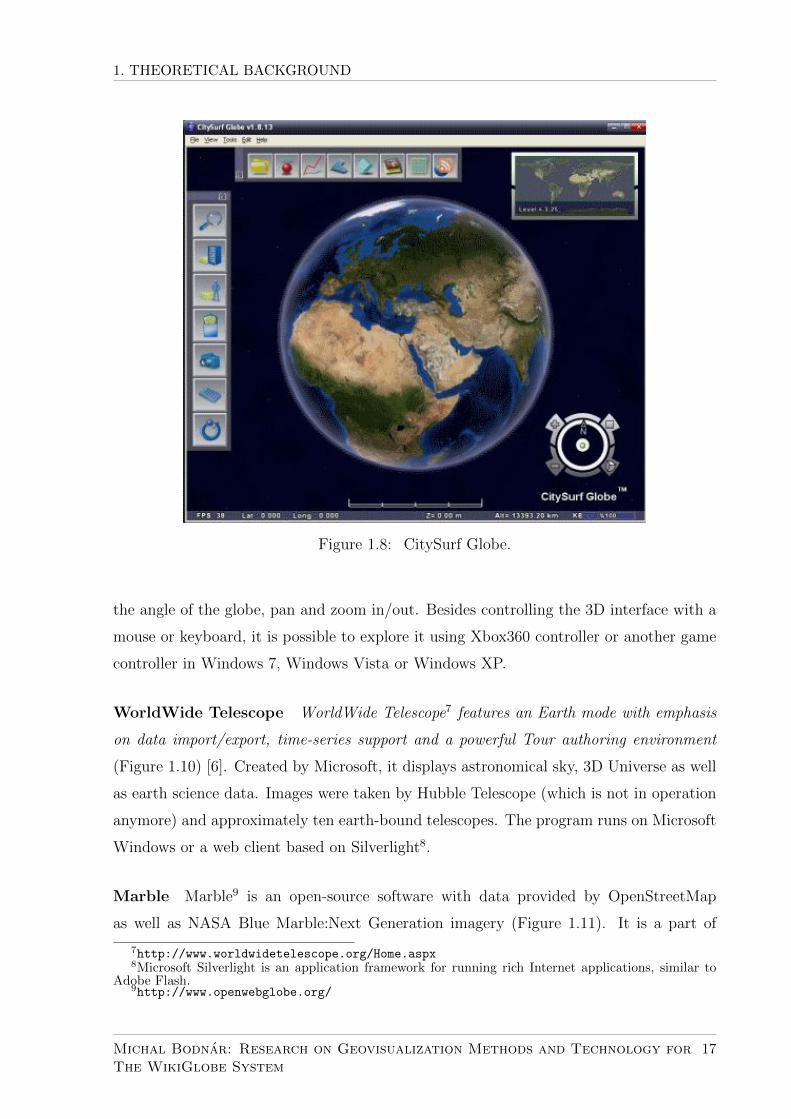
CitySurf Globe CitySurf Globe5 is developed by PiriReis Bilisim Teknolojileri and is
known as a new model in mapping servers and interaction with the end user (Figure 1.8).
It models raster data, such as satellite images under using high-speed digital terrain model
and vector geographical information systems and accordingly serves that via internet or
local nets. With its OpenGL-based viewer connecting to the server for streaming data is
similar to Google Earth, Bing Maps or ArcGIS concept.
Bing Maps Bing Maps6 is a web mapping service provided as a part of Microsoft’s Bing
suite of search engines and powered by the Bing Maps for Enterprise framework [6]. In
order to view 3D maps (Figure 1.9), a user is required to install plug-in. An interface runs
in Internet Explorer and Mozilla Firefox and uses NASA Blue Marble:Next Generation
globe cover imagery. It lets users see the buildings in 3D with ability to rotate it, tilt
5http://www.citysurf.com.tr/en/index.asp6http://www.bing.com/maps/
Michal Bodnar: Research on Geovisualization Methods and Technology forThe WikiGlobe System
16
1. THEORETICAL BACKGROUND
Figure 1.8: CitySurf Globe.
the angle of the globe, pan and zoom in/out. Besides controlling the 3D interface with a
mouse or keyboard, it is possible to explore it using Xbox360 controller or another game
controller in Windows 7, Windows Vista or Windows XP.
WorldWide Telescope WorldWide Telescope7 features an Earth mode with emphasis
on data import/export, time-series support and a powerful Tour authoring environment
(Figure 1.10) [6]. Created by Microsoft, it displays astronomical sky, 3D Universe as well
as earth science data. Images were taken by Hubble Telescope (which is not in operation
anymore) and approximately ten earth-bound telescopes. The program runs on Microsoft
Windows or a web client based on Silverlight8.
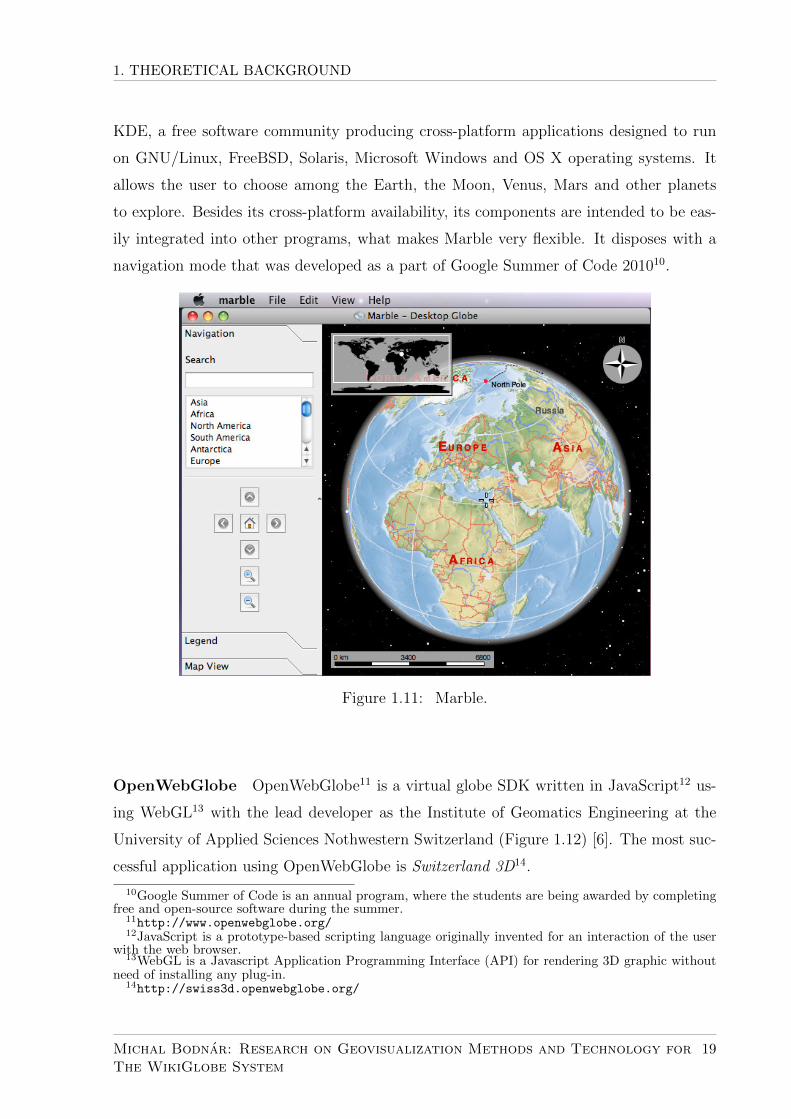
Marble Marble9 is an open-source software with data provided by OpenStreetMap
as well as NASA Blue Marble:Next Generation imagery (Figure 1.11). It is a part of
7http://www.worldwidetelescope.org/Home.aspx8Microsoft Silverlight is an application framework for running rich Internet applications, similar to
Adobe Flash.9http://www.openwebglobe.org/
Michal Bodnar: Research on Geovisualization Methods and Technology forThe WikiGlobe System
17

1. THEORETICAL BACKGROUND
Figure 1.9: Bing Maps 3D.
Figure 1.10: Worldwide Telescope.
Michal Bodnar: Research on Geovisualization Methods and Technology forThe WikiGlobe System
18
1. THEORETICAL BACKGROUND
KDE, a free software community producing cross-platform applications designed to run
on GNU/Linux, FreeBSD, Solaris, Microsoft Windows and OS X operating systems. It
allows the user to choose among the Earth, the Moon, Venus, Mars and other planets
to explore. Besides its cross-platform availability, its components are intended to be eas-
ily integrated into other programs, what makes Marble very flexible. It disposes with a
navigation mode that was developed as a part of Google Summer of Code 201010.
Figure 1.11: Marble.
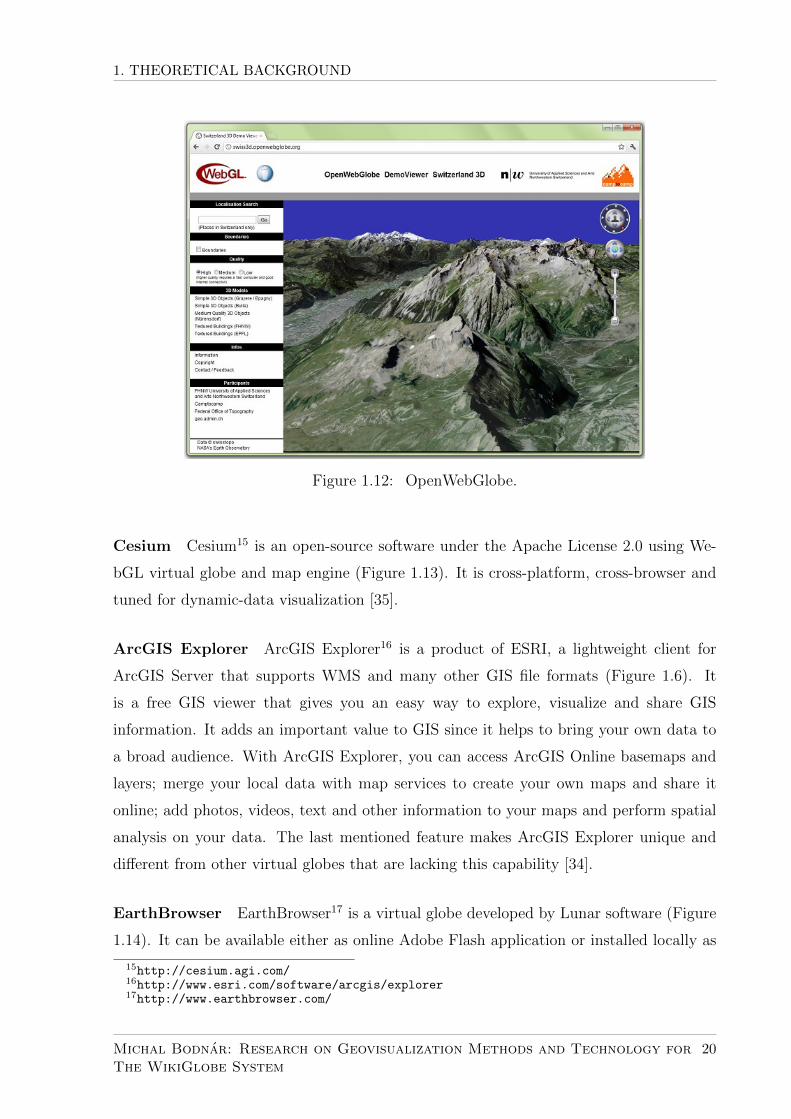
OpenWebGlobe OpenWebGlobe11 is a virtual globe SDK written in JavaScript12 us-
ing WebGL13 with the lead developer as the Institute of Geomatics Engineering at the
University of Applied Sciences Nothwestern Switzerland (Figure 1.12) [6]. The most suc-
cessful application using OpenWebGlobe is Switzerland 3D14.
10Google Summer of Code is an annual program, where the students are being awarded by completingfree and open-source software during the summer.
11http://www.openwebglobe.org/12JavaScript is a prototype-based scripting language originally invented for an interaction of the user
with the web browser.13WebGL is a Javascript Application Programming Interface (API) for rendering 3D graphic without
need of installing any plug-in.14http://swiss3d.openwebglobe.org/
Michal Bodnar: Research on Geovisualization Methods and Technology forThe WikiGlobe System
19
1. THEORETICAL BACKGROUND
Figure 1.12: OpenWebGlobe.
Cesium Cesium15 is an open-source software under the Apache License 2.0 using We-
bGL virtual globe and map engine (Figure 1.13). It is cross-platform, cross-browser and
tuned for dynamic-data visualization [35].
ArcGIS Explorer ArcGIS Explorer16 is a product of ESRI, a lightweight client for
ArcGIS Server that supports WMS and many other GIS file formats (Figure 1.6). It
is a free GIS viewer that gives you an easy way to explore, visualize and share GIS
information. It adds an important value to GIS since it helps to bring your own data to
a broad audience. With ArcGIS Explorer, you can access ArcGIS Online basemaps and
layers; merge your local data with map services to create your own maps and share it
online; add photos, videos, text and other information to your maps and perform spatial
analysis on your data. The last mentioned feature makes ArcGIS Explorer unique and
different from other virtual globes that are lacking this capability [34].
EarthBrowser EarthBrowser17 is a virtual globe developed by Lunar software (Figure
1.14). It can be available either as online Adobe Flash application or installed locally as
15http://cesium.agi.com/16http://www.esri.com/software/arcgis/explorer17http://www.earthbrowser.com/
Michal Bodnar: Research on Geovisualization Methods and Technology forThe WikiGlobe System
20

1. THEORETICAL BACKGROUND
Figure 1.13: Cesium.
an AIR application [6]. Its main interest is in visualizing geophysical information such
as real-time weather forecasts, earthquakes or volcano. Besides this, it is also compatible
with KML files.
Earth3D Earth3D18 is an open-source software developed as a part of diploma thesis
of Dominique Andre Gunia at Braunschweig University of Technology to display a virtual
globe (Figure 1.15) [6]. An interesting thing about this application is that it has been
developed even before the release of Google Earth. It uses data from NASA, USGS,
CIA19 and the city of Osnabruck. A strong feature that this virtual globe disposes with
is an ability of displaying meteorological phenomena in near-real time [6]. It exists both
as a Java and C++ application [37].
Bhuvan Bhuvan 3D20 is a virtual globe tailored specifically to India (Figure 1.16) [6]. It
allows users to view 2D and 3D images together with an information about soil, wasteland
and water resources on Indian subcontinent. It has numbers of other features, including
weather information and administrative boundaries of all states and districts in India. It
18http://www.earth3d.org/19Central Intelligence Agency20http://bhuvan.nrsc.gov.in/bhuvan_links.php
Michal Bodnar: Research on Geovisualization Methods and Technology forThe WikiGlobe System
21

1. THEORETICAL BACKGROUND
Figure 1.14: EarthBrowser.
is a free software and runs on Windows operating system.
1.3 NASA World Wind
1.3.1 Definition
Different definitions of NASA World Wind can be found from different sources. Bell et
al. [13] say that ” ... NASA World Wind is a three-dimensional geographic information
system developed by National Aeronautics & Space Administration(NASA), its partners,
and the open-source21 community. World Wind is both a system for highly interactive
geographic data browsing utilizing the Internet, as well as a stand alone computer applica-
tion.” Later, they are adding that World Wind ” ... provides graphical access to terabytes
of imagery and elevation models for planets and other celestial objects including satellite
and other data of the Earth, Moon, Mars, Venus, and Jupiter; ...” Wikipedia [6] defines
21Open-source software (OSS) is a computer software with its source code made available and licensedwith an open-source license in which the copyright holder provides the rights to study, change anddistribute the software for free to anyone and for any purpose.
Michal Bodnar: Research on Geovisualization Methods and Technology forThe WikiGlobe System
22

1. THEORETICAL BACKGROUND
Figure 1.15: Earth3D.
Figure 1.16: Bhuvan 3D.
NASA World Wind as ” ... an open-source (released under the NOSA22 license) virtual
22The NASA Open Source Agreement (NOSA) is an OSI-approved software license.
Michal Bodnar: Research on Geovisualization Methods and Technology forThe WikiGlobe System
23

1. THEORETICAL BACKGROUND
globe developed by NASA and the open source community for use on personal computers.”
Guo et al. [16] consider World Wind being a ”scientific digital earth system” and ”... a
scientific-oriented software, which provides an open framework of geographic information
and allows users to further develop it in the future.” The most important thing about
NASA World Wind is its unique potential to aggregate a huge number of public and
private geographic data sets, providing access not only to NASA data but also to data
from other government agencies, industries and the general public.
The history of NASA World Wind comes back to the year 2002, when the project began
under the auspices of NASA Learning Technologies, a program to get ”NASA content”
into the classrooms [43]. Being lead by the project manager Patrick Hogan, NASA World
Wind was released with its version 1.2 on August 6, 2004 and became one of the first NASA
programs to be presented as open source [11][43]. An interesting thing is that World Wind
existed approximately concurrently with Keyhole (that was developing Google Earth as
it is known today), however, without knowing of each other until later. A popularity of
the software was increasing rapidly and by September, 2004 over 60 000 copies of World
Wind were distributed in one week [16]. NASA World Wind has been developed in two
versions: WorldWind.NET and World Wind Java SDK.
WorldWind.NET
WorldWind.NET (Figure 1.17) is a NASA World Wind software that relies on .NET
framework23 and is restricted to Windows operating system. Besides displaying the Earth,
there are also several other planets available: Moon, Mars, Venus, Jupiter etc. The
application was developed in such a way that its operation would become instinctive for
any possible user of the software, not looking on his technical background, who could
naturally interact with the displayed planet by zooming in/out, rotating the globe and
tilting the view.
WorldWind.NET provides the ability to browse maps and geospatial information using
the WMS24 servers, import ESRI Shapefiles and KML/KMZ files. Basically, the applica-
tion is an extensive suite of plug-ins and add-ons. Here are listed possible types of add-ons
23The .NET Framework (pronounced dot net) is a software framework developed by Microsoft thatruns primarily on Microsoft Windows.
24A Web Map Service (WMS) is a standard protocol for serving georeferenced map images over theInternet that are generated by a map server using data from a GIS database.
Michal Bodnar: Research on Geovisualization Methods and Technology forThe WikiGlobe System
24

1. THEORETICAL BACKGROUND
Figure 1.17: WorldWind.NET.
that can be imported into the application according to [6]:
• Point layer – XML file that displays placemarks as icons;
• Trail layer – paths (routes, boundaries);
• Line features – XML file with a list of points that are visualized as a line or wall;
• Polygon features – XML file with a list of points that are visualized as a filled
polygon (flat or extruded);
• Model features – XML file used to load 3D textured meshes;
• Place names – specific points (such as cities, hills and buildings) that are assigned
text labels;
• Image layer – high resolution imagery for various places in the world;
• Scripts – files that control camera movement.
World Wind Java
The latest .NET-based version, version 1.4, was released on February 14, 2007. After
that, the team of developers in NASA, concentrated around Patrick Hogan, decided to
Michal Bodnar: Research on Geovisualization Methods and Technology forThe WikiGlobe System
25

1. THEORETICAL BACKGROUND
change the concept of their project. Instead of one application, which could be enriched
by users in form of new plug-ins or add-ons, they started to develop World Wind as a Java
Software Development Kit and gave it name World Wind Java (often referred to World
Wind SDK or NASA World Wind Java SDK) [43]. The main difference between .NET and
SDK version is that while WorldWind.NET was a single application, World Wind Java
SDK is, on the other hand, a set of development tools that can be used to create hundreds
of different applications. Unlike to WorldWind.NET, World Wind Java is cross-platform,
being able to be run on Windows, MAC OS X as well as on GNU/Linux. It has API-centric
architecture, which puts World Wind itself in a role of plug-in. That means World Wind
SDK can be used in a numerous number of applications, relying on different technologies.
In one of the interviews, Mr. Hogan said that ” ... together, the NASA World Wind SDK
client and WMS server provide the infrastructure for government, research, and business
communities as well as education and public outreach, to both deliver and experience
information, hopefully increasing our understanding” [38].
World Wind Java disposes with the same features as were mentioned in the previous
.NET version. However, it gives a developer much more flexibility to extend and adjust
SDK in a way he finds it suitable. The first version 1.2 was released on July 19, 2011,
while the last stable one 1.5 was presented on January 23, 2013 [8].
1.3.2 World Wind Data
NASA has more planetary information than any other entity on Earth [43]. Even
though not all of those data are being used in World Wind, most of them do. They include
animated data, satellite images, digital elevation models (DEM), country boundaries etc.
The size of all currently available datasets is about 4.6 terabytes [6].
Data retrieval
Every World Wind application can be regarded as Geographic Information System
(GIS), consisting of clients and heterogeneous networks of data (Figure no.1.18).
A client requests tiled imagery from a server using a NASA custom HTTP request
protocol [13]. A simple request looks like this:
T=dataset&X=column&Y=row&L=level.
Michal Bodnar: Research on Geovisualization Methods and Technology forThe WikiGlobe System
26

1. THEORETICAL BACKGROUND
Figure 1.18: Client-server architecture.
To understand what attributes column, row and level parameters refer to, it is essential
to get to know what tiled imagery is and how World Wind works with it.
In general, World Wind uses a multi-resolution layering technique [13]. The more user
zooms in to the concrete location, the more detailed is this location shown progressively.
This is done by storing multiple copies of the same map on the server. Taking a map
of the Earth as an example, World Wind breaks down the image into 50 tiles, 36◦ x 36◦
segments (Figure 1.19). This is done at a level called Layer 0. Layer 1, then, breaks
down the image into 18◦ x 18◦ segments, which results into 200 tiles of it. At Layer
2, the resolution of the image becomes 9◦ x 9◦ for 800 tiles. As can be seen, in every
next layer, a number of tiles is 4 times higher than in the previous one, resulting in the
segment 4 times smaller. When the user zooms in to a various location, World Wind
requests the necessary data from the servers, downloading only the information that is
required to display the view requested by the user [13]. Coming back to the the meaning
of the parameters of the HTTP request, level refers to Layer in the concrete tiled imagery.
After finding suitable Layer, column and row define a location of the particular segment in
the image. Besides NASA HTTP request protocol, World Wind equally supports WMS
protocol specification from the Open Geospatial Consortium (OGC) [13].
After requesting proper data at the specific resolution layer and view point, World
Wind caches this data locally. Caching the data brings a lot of advantage to the client as
well as the server. The response time when retrieving the data from the cache is on the
order of 0.015 seconds, which is much shorter than overall processing time, that varies
from a few to 20 seconds on a modern fast server [13].
Michal Bodnar: Research on Geovisualization Methods and Technology forThe WikiGlobe System
27

1. THEORETICAL BACKGROUND
Figure 1.19: Tiled image of the Earth at Layer 0.
Digital Elevation Model (DEM)
For each globe (planet), there is a default DEM that is based the nominal radius of the
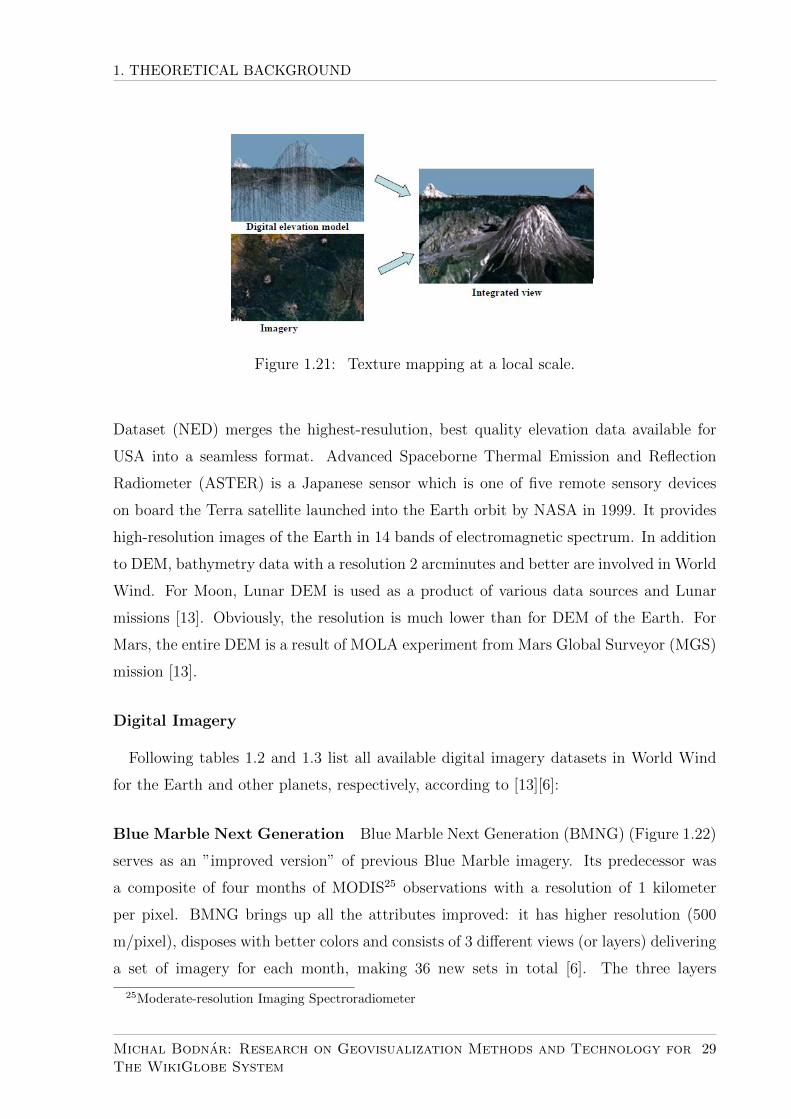
globe and augmented with elevation data from available sources [13]. Figure 1.20 shows
how the images are draped over the elevation model at a global scale and Figure 1.21
illustrates the same situation being done at a local scale.
Figure 1.20: Texture mapping at a global scale.
In case of the Earth, World Wind uses DEM data collected by SRTM, NED and ASTER
giving to the user final resolution of 30 m (1 arcsecond) for USA and 90 m (3 arcseconds)
globally. Shuttle Radar Topography Mission (SRTM) is an international research effort
to generate the most complete high-resolution digital topographic database of the Earth
covering most of the land surface between 60◦ N to 54 ◦ S. It is a project spearheaded by
U.S. National Geospatial-Intelligence agency (NGA) and NASA [6]. National Elevation
Michal Bodnar: Research on Geovisualization Methods and Technology forThe WikiGlobe System
28
1. THEORETICAL BACKGROUND
Figure 1.21: Texture mapping at a local scale.
Dataset (NED) merges the highest-resulution, best quality elevation data available for
USA into a seamless format. Advanced Spaceborne Thermal Emission and Reflection
Radiometer (ASTER) is a Japanese sensor which is one of five remote sensory devices
on board the Terra satellite launched into the Earth orbit by NASA in 1999. It provides
high-resolution images of the Earth in 14 bands of electromagnetic spectrum. In addition
to DEM, bathymetry data with a resolution 2 arcminutes and better are involved in World
Wind. For Moon, Lunar DEM is used as a product of various data sources and Lunar
missions [13]. Obviously, the resolution is much lower than for DEM of the Earth. For
Mars, the entire DEM is a result of MOLA experiment from Mars Global Surveyor (MGS)
mission [13].
Digital Imagery
Following tables 1.2 and 1.3 list all available digital imagery datasets in World Wind
for the Earth and other planets, respectively, according to [13][6]:
Blue Marble Next Generation Blue Marble Next Generation (BMNG) (Figure 1.22)
serves as an ”improved version” of previous Blue Marble imagery. Its predecessor was
a composite of four months of MODIS25 observations with a resolution of 1 kilometer
per pixel. BMNG brings up all the attributes improved: it has higher resolution (500
m/pixel), disposes with better colors and consists of 3 different views (or layers) delivering
a set of imagery for each month, making 36 new sets in total [6]. The three layers
25Moderate-resolution Imaging Spectroradiometer
Michal Bodnar: Research on Geovisualization Methods and Technology forThe WikiGlobe System
29

1. THEORETICAL BACKGROUND
Earth datasets
Imagery Dataset Resolution
Blue Marble Blue Marble Next Generation 500 m
Landsat 7 NLT Landsat Pseudo Color 30 m
NLT Landsat Visible 30 m
GeoCover 1990 30 m
GeoCover 2000 15 m
OnEarth Visible 15 m
OnEarth Pseudo Color 15 m
i-cubed 15 m
USGS Digital Ortho 1 m
Urban Area Ortho 0.25 m
topographic maps
ZoomIt! LINZ 2.5 m
GSWA
South Africa 0.5 - 10 m
US imagery 0.15 - 1 m
Table 1.2: World Wind imagery for Earth.
composing BMNG are as follows: Blue Marble Base, Blue Marble Shaded (topographically
shaded month-to-month record of the Earth) and Blue Marble Shaded + Bathymetry
(Blue Marble Shaded with addition of the bathymetry data). In World Wind, the last
layer is enabled by default and the month of the provided dataset is matched with the
current month. All the imagery was acquired in 2004.
Landsat 7 imagery Landsat 7, launched on April 15, 1999, is the seventh satellite of
the Landsat program [6]. The main goal is to provide a refreshed set of images, which
are up-to-date and cloud-free. The program is managed by USGS. Following datasets
are distributed within World Wind: i-cubed, NLT Landsat (Pseudo Color and Visible),
GeoCover 1990 and 2000 and OnEarth (Pseudo Color and Visible). I-cubed dataset (Fig-
ure 1.23) is a result of sophisticated i3-color balancing algorithms, that optimally process
raw Landsat data. NLT datasets were created by NASA Learning Technologies (NLT),
an organization that was behind all World Wind project idea, with an intention to make
Michal Bodnar: Research on Geovisualization Methods and Technology forThe WikiGlobe System
30

1. THEORETICAL BACKGROUND
Extraterrestrial datasets
Planet Dataset
Mars MOC 256(ASU)
MOC 256 Colorized
MOLA Color (ASU)
Mars THEMIS (ASU)
Mars THEMIS Color
Moon Moon Base Image
Clementine 40xx
Clementine 30xx
Shaded Elevation Map
Jupiter Jupiter Base Map
Venus Magellan Imaging Radar
Shaded Relief
Table 1.3: World Wind extraterrestrial datasets.
Figure 1.22: Blue Marble Next Generation imagery.
their own imagery (Figure 1.24). GeoCover, a positionally accurate orthorectified Landsat
Thematic Mapper and Multispectral Scanner imagery covering the majority of the Earth’s
land mass, is a result of a contract between NASA and EarthSat (Earth Satellite Corpo-
ration). GeoCover 2000 (Figure 1.25) uses the same bands as its predecessor, GeoCover
Michal Bodnar: Research on Geovisualization Methods and Technology forThe WikiGlobe System
31

1. THEORETICAL BACKGROUND
1990, however, the resolution is twice higher - 15 metres. Finally, OnEarth:WMS Global
Mosaic (Figure 1.26) is a project convened by NASA Jet Propulsion Laboratory. The
images, being collected between 1999–2003, create a global image mosaic of the Earth,
produced from more than 8200 individual Landsat 7 scenes [42].
Figure 1.23: I-cubed at its highest resolution.
Figure 1.24: NLT Visible at its highest resolution.
ZoomIt! ZoomIt! is an add-on provided by NASA World Wind Central [42] that gives
a user access to high-resolution imagery of areas not available before. Those areas include:
Michal Bodnar: Research on Geovisualization Methods and Technology forThe WikiGlobe System
32

1. THEORETICAL BACKGROUND
Figure 1.25: Geocover 2000 at its highest resolution.
Figure 1.26: OnEarth Visible at its highest resolution.
New Zealand with its LINZ dataset, West Australia with GSWA dataset available and
South Africa, with Robben Island and Johannesburg having a resolution of 0.5 m and
1 m, respectively. It also disposes with a high-resolution imagery of few cities in USA
(Figure 1.27).
Michal Bodnar: Research on Geovisualization Methods and Technology forThe WikiGlobe System
33

1. THEORETICAL BACKGROUND
Figure 1.27: ZoomIt! image of Miami.
Animated data
Following animated data layers are available in World Wind: MODIS, GLOBE, NRL
Real-Time Weather and NASA Scientific Visualization Studio data.
MODIS The Moderate-resolution Imaging Spectroradiometer (MODIS) is a payload sci-
entific instrument launched into Earth orbit by NASA in 1999 on board the Terra satellite,
and in 2002 on board the Aqua satellite [6]. It captures data in 36 bands and provides
measurements of the dynamics of the changes on the Earth, including its cloud cover,
radiation budget and processes occurring in the oceans, on land and in the lower atmo-
sphere. Rapid Fire MODIS (Figure 1.28) is a feature in World Wind that produces an
easily customized view of this information and marks then directly on the globe. When
one of those markers is clicked, the full image of the event is automatically downloaded
[40].
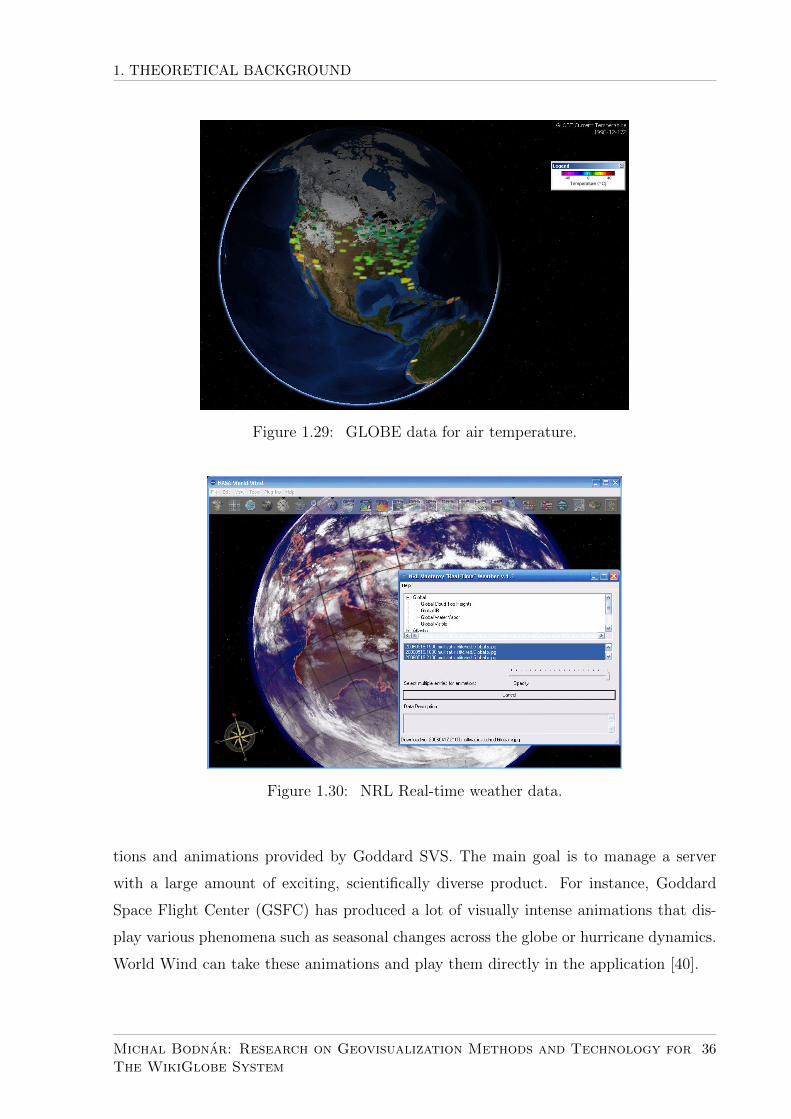
GLOBE The Global Learning and Observations to Benefit the Environment (GLOBE)
Program is a program focused on the environment issues, primary- and secondary-school-
based science and education program in more than 112 countries worldwide [39][42]. The
main goal is to promote teaching and learning of science, enhance environmental literacy
and promote scientific discovery. The program gives young students an unique oppor-
tunity to take part in real experiments in collaboration with scientists from numerous
Michal Bodnar: Research on Geovisualization Methods and Technology forThe WikiGlobe System
34

1. THEORETICAL BACKGROUND
Figure 1.28: Rapid Fire MODIS.
international agencies. It is housed by University Corporation for Atmospheric Research
(UCAR) at Boulder, Colorado, USA and sponsored by National Oceanic and Atmospheric
Administration (NOAA), NASA and the National Science Foundation through an inter-
agency agreement first signed in 1998 [42]. GLOBE data can be viewed in World Wind
through the WMS, where the user can specify from which date this data will be down-
loaded (Figure 1.29).
NRL Real-Time Weather The United States Naval Research Laboratory (NRL) is the
corporate research laboratory for the United States Navy and the United States Marine
Corps and conducts a program of scientific research and development [6]. Located in
Monterrey, California, it provides real-time weather information from GEOS and POES
satellites [13]. Data are being processed and modelled at NRL super computer facilities
and the final real-time weather imagery with barometric weather information is available
via World Wind (Figure 1.30).
NASA SVS The goal of NASA Scientific Visualization Studio (NASA SVS) Image
Server is to make NASA Earth Science data and research results directly available to
the students, educators, and general public through broadly useful applications [41]. The
information that NASA SVS Image Server offers are samples of many different visualiza-
Michal Bodnar: Research on Geovisualization Methods and Technology forThe WikiGlobe System
35
1. THEORETICAL BACKGROUND
Figure 1.29: GLOBE data for air temperature.
Figure 1.30: NRL Real-time weather data.
tions and animations provided by Goddard SVS. The main goal is to manage a server
with a large amount of exciting, scientifically diverse product. For instance, Goddard
Space Flight Center (GSFC) has produced a lot of visually intense animations that dis-
play various phenomena such as seasonal changes across the globe or hurricane dynamics.
World Wind can take these animations and play them directly in the application [40].
Michal Bodnar: Research on Geovisualization Methods and Technology forThe WikiGlobe System
36

1. THEORETICAL BACKGROUND
Additional data
Except for the data mentioned above, World Wind offers by default the following 2
layers: Country & (USA) State Borders and Places Names.
Michal Bodnar: Research on Geovisualization Methods and Technology forThe WikiGlobe System
37

Chapter 2
Methodology
This chapter serves as a comprehensive description of the workflow while creating the
application Great Places WikiGlobe as well as an explanation of methods and technolo-
gies being used during the process. The first section describes the application’s study
area, concretely 100 Great Places of History and offers some statistical relation between
the data. The second section gives an insight into the methods and technology needed
to create an application, and so Java programming language and RDBMS (Relational
Database Management System), concretely MySQL. This section is not intended to be
a deeply-comprehensive guide into the mentioned technologies, it just serves to outline
them briefly. In the third section, the design of the database is shown, together with how
the data were collected. The fourth section brings up an application design, where GUI
(Graphical User Interface) is mentioned to be the right choice and is described appropri-
ately. Last section comprises an implementation of the application, concretely setting up
the development environment, implementation of GUI, World Wind Java technology into
it and creating an information window.
2.1 Great Places WikiGlobe
2.1.1 Description
By increasing functionality of World Wind, many governmental, commercial or non-
commercial organisations started to build their applications based on World Wind Java
SDK. A fact that World Wind is open-source, gives a developer a lot of space to ac-
commodate the SDK to its own needs. One of those projects that relies on World Wind
38

2. METHODOLOGY
Java SDK is also WikiGlobe, a project undertaken at Beihang University (BU) under the
guidance of Prof. Weng Jingnong from the College of Software. Its goal is to integrate an
information that usually Wikipedia offers, and so text, pictures, audio recording or video
into World Wind so that a user will have an opportunity to ”browse Wikipedia on Digi-
tal Globe”. The team of students specialized in the software applications of Geographic
Information Systems have been working on the SDK based on World Wind Java SDK for
couple of years. During that time, different topics connected to WikiGlobe project were
completed, such as ”WikiGlobe – Rise of Nations”, which brings an information about all
the countries of the world into the World Wind.
The aim of Great Places WikiGlobe is to create an application that will contain 100
important civilizations’s sites according to the book Great Places of History: Civilization’s
100 Most Important Sites: An Illustrated Journey [5], published by TIME (Figure 2.1),
using geovisualization methods and technology that World Wind disposes with.
Figure 2.1: TIME HOME ENTERTAINMENT. Great Places of History: Civilization’s100 Most Important Sites: An Illustrated Journey.
Michal Bodnar: Research on Geovisualization Methods and Technology forThe WikiGlobe System
39
2. METHODOLOGY
2.1.2 Study area
All the sites, included in the book Great Places of History: Civilization’s 100 Most
Important Sites: An Illustrated Journey [5], were about to be incorporated into the ap-
plication Great Places WikiGlobe. The book divides them into the following categories
according to their contribution and meaning in the history:
• Cultures,
• Religion,
• Society,
• Politics,
• Civilizations,
• Battles,
• Inquiry,
• Innovation,
• Arts.
All the places are listed in the appendix C. Every site is described in the book in one
or two pages. The description of the place is not in a way that, for example Wikipedia
gives us, mentioning all historical and important facts. On the contrary, each site is
characterized such as an interesting story are picked up, from the point of view of TIME’s
editors, who personally visited all the places.
The sites are not distributed evenly within the continents or the countries. Table 2.1
depicts that the most places are located in Europe, which is more than twice more than
Asia, followed by North America. On the other hand, the country with the highest number
of the places is United States of America, with three European countries (England, Spain,
Germany) and China right behind it (Table 2.2).
Michal Bodnar: Research on Geovisualization Methods and Technology forThe WikiGlobe System
40

2. METHODOLOGY
Sites by continent
Continent Number of sites
Africa 8
Antarctica 1
Asia 21
Australia 1
Europe 50
North America 15
South America 4
Table 2.1: Sites by continent.
Top countries by number of sites
Country Number of sites
United States of America 11
England 9
Germany 6
Spain 6
China 6
France 5
Greece 4
Italy 4
Russia 3
India 3
Austria 3
Table 2.2: Sites by continent.
Additional tables are included in the appendix C, depicting which countries and con-
tinents have their sites included between each category. One interesting point that can
be observed is that Europe is the leading continent for every category except for Religion
with Asia on the first place and Battles, where North America is taking the lead. An-
other finding is that United States of America being as a top country with the highest
number of sites in the book, has no representative in four categories - Cultures, Religion,
Civilizations and Inquiry while having as many as 5 sites in the category Innovation from
Michal Bodnar: Research on Geovisualization Methods and Technology forThe WikiGlobe System
41

2. METHODOLOGY
the total of 16 sites. The only one site that belongs to Australia (Australian Penal Sites)
is included in Society category. For Antarctica, the only representative in the book is
McMurdo station belonging to Inquiry category.
Here is the list of all the countries with at least one site included in the book: Antarc-
tica, Australia, Austria, Belgium, Bosnia and Herzegovina, Cambodia, Canada, Chile,
China, Denmark, Ecuador, Egypt, England, Ethiopia, France, Germany, Ghana, Greece,
Guatemala, India, Iran, Ireland, Israel, Italy, Japan, Mali, Morocco, Nepal, Norway, Pak-
istan, Panama, Peru, Poland, Russia, Saudi Arabia, Scotland, Spain, Syria, Tanzania,
Thailand, Turkey, United Arab Emirates and United States of America.
2.2 Required methods
2.2.1 Java programming language
Definition
As has been already mentioned in this section, the application Great Places WikiGlobe
is based on NASA World Wind SDK. This SDK is written in programming language Java.
Java programming language is a general-purpose, concurrent, class-based, object-oriented
computer programming language that is specifically designed to have as few implemen-
tation dependencies as possible [6]. It was ”born” in 1995 in the laboratories of Sun R©
Microsystems. The name of the programming language can be also translated as ”coffee”
or ”espresso” (the reason why there is a coffee mug displayed in the logo (Figure 2.2)),
said to be consumed by language’s creators in large quantities similarly as people drink
coffee every day. Its founder, James Gosling, firstly wanted to give his newly developed
programming language name Oak, pointing to the oak that has grown up in front of his
house during the work on the language’s development, later on, he came up with the
name Green to finally decide for Java. Today, Java is one of the most popular program-
ming languages with more than 10 million users, who use this language for developing
applications such as applets1, servlets2, distributed systems3 or applications for mobile or
telecommunication devices.
1Java applet is a small application written in Java launched from a web page.2Java servlet is a Java programming language class used to extend the capabilities of a server.3A distributed system is a software system in which components located on a computer network
communicate and coordinate their actions by passing messages.
Michal Bodnar: Research on Geovisualization Methods and Technology forThe WikiGlobe System
42

2. METHODOLOGY
Figure 2.2: Logo of Java programming language.
A current owner of Java platform is company OracleR©
, after its acquiring of Sun Mi-
crosystems in 2010 [6]. Oracle implementation of Java is packaged in two different dis-
tributions: Java Runtime Environment (JRE) and Java Development Kit (JDK). For
developers, it is intended to have JDK installed, for those who just want to run Java
application(s), only JRE is needed.
There are five primary goals in the creation of Java language according to [6]:
1. It should be ”simple, object-oriented and familiar.”
2. It should be ”robust and secure.”
3. It should be ”architecture-neutral and portable.”
4. It should execute with ”high performance.”
5. It should be ”interpreted, threaded and dynamic.”
Java compoments
Java is composed of three basic components according to [2]:
1. Java programming language,
2. Java Virtual Machine (JVM),
3. Application Interface (API).
Michal Bodnar: Research on Geovisualization Methods and Technology forThe WikiGlobe System
43

2. METHODOLOGY
One characteristic feature of Java which makes it different from other programming
languages, is its portability, meaning that computer program written in Java will run in
a similar way on any operating-system platform. Java language code, unlike to other pro-
gramming languages, such as C++, is not compiled directly to platform-specific machine
code, but into its intermediate representation called Java bytecode. Firstly, a source code
of the program represented by a text file with *.java suffix is compiled by a Java compiler
into a language of JVM in a form of bytecode. Since this bytecode can be executed just
on a virtual computer represented by JVM, it is not dependent on any specific hardware/-
software requirements. Afterwards, the bytecode, producing a file with *.class suffix, is
interpreted into the machine code of the running processor (Figure 2.3).
Figure 2.3: Java’s portability.
Syntax
Syntax in Java is largely derived from C++ [6]. The simplest Java program is a famous
Hello World program:
1 class HelloWorld {2 public stat ic void main ( St r ing [ ] a rgs ) {3 System . out . p r i n t l n ( ”He l lo World ! ” ) ; // Disp lay the s t r i n g .
4 }5 }
Listing 2.1: HelloWorld.java.
The source file has to have the same name as the class does with .java suffix added, in
this case HelloWorld.java. Firstly, the file is compiled into the bytecode, producing a
file HelloWorld.class. Just after that, the program can be launched and a string Hello
World will be displayed on the console. Looking back at the source code of the Hello
Michal Bodnar: Research on Geovisualization Methods and Technology forThe WikiGlobe System
44

2. METHODOLOGY
World program, line 1 defines the class name, which every class in Java has to start with.
Everything written after that has to be a content of the class, defined by braces (closing
brace is on line 5). On the line 2, a main method is called. It is a special type of method
in Java, which Java launcher calls to pass control to the program [6]. It has to accept
an array of String objects, which are often passed by means of a command line. The
brace after the main method’s definition on the line 3 indicates everything after that is
the content of the method, enclosed by the brace on the line 4. In this case, it is just one
line, saying to print a string ”Hello World” and display on the console.
2.2.2 Relational Database Management System (RDBMS)
Except for Java, there is also needed the technology that will be able to store the data,
able to operate with this data and make queries on them. There is a need of RDBMS
(Relational Database Management System). RDBMS is a database management system
of relational database.
Relational database
Relational database is a database that has a collection of tables of data items, all of
which is formally described and organized according to the relational model [6]. The rela-
tion model is a result of a research conducted by IBM R© (International Business Machines
Corporation). It was firstly described by Dr.E.F.Codd in an article ”A Relational Model
of Data for Large Shared Data Banks” published in Communications of the ACM (As-
sociation for Computer Machinery) on June 1970 [4]. In the relational model, each table
schema (or relation) is defined by rows (or tuples) and columns (or attributes). It has to
be identified by a primary key, a column disposing with a set of values unique for each
row in the database. It can also have a foreign key, that is pointing to a primary key of
another table schema. Giving an example, table students (Table 2.3) contains the data
about international students of Beihang university. It has 5 rows and 4 columns: id,
name, country and city. As a primary key, an attribute id is chosen.
Relational Database Management System (RDBMS)
Relation Database Management Systems is, as has already been mentioned, a database
management system based on the relational model described above. According to E.F.Codd,
Michal Bodnar: Research on Geovisualization Methods and Technology forThe WikiGlobe System
45

2. METHODOLOGY
Table students
id name country city
1 Wang China Beijing
2 Biman Sri Lanka Colombo
3 Peter Slovakia Kosice
4 Michela Italy Torino
5 Fredrik Sweden Stockholm
Table 2.3: Relational database table schema students.
every RDBMS has to fulfil Codd’s 12 rules in order to be considered being RDBMS [4].
Basically, RDBMS is a software that serves as a tool to manage database, where table
schemas are identified with their primary key and connected to each other according to
their relation. To operate with the data within RMDBS, a special-purpose programming
language, SQL (”S-Q-L” or as the word ”sequel”, Structured Query Language) was de-
signed. It is based on relational algebra and consists of Data Definition Language (DDL)
and Data Manipulation Language (DML). DDL is a language with syntax similar to pro-
gramming language for defining data structures, especially database schemas. DML is a
language used for inserting, deleting and updating data in the database. Looking back to
the example of relational model table schema students (Table 2.3), to create this table,
SQL code (Listing 2.2) has to be executed. Once the table is created, the data can be
inserted into the table (Listing 2.3).
1 CREATE TABLE students (
2 id INTEGER PRIMARY KEY ,
3 name VARCHAR (50) NULL ,
4 country VARCHAR (50) NULL ,
5 city VARCHAR (50) NULL
6 );
Listing 2.2: Creating a table students.
1 INSERT INTO students values (1, ’Wang’, ’China ’, ’Beijing ’);
2 INSERT INTO students values (2, ’Biman ’, ’Sri Lanka ’, ’
Colombo ’);
Michal Bodnar: Research on Geovisualization Methods and Technology forThe WikiGlobe System
46

2. METHODOLOGY
3 INSERT INTO students values (3, ’Peter ’, ’Slovakia ’, ’Kosice ’
);
4 INSERT INTO students values (4, ’Alba’, ’Bolivia ’, ’La Paz’);
5 INSERT INTO students values (5, ’Fredrik ’, ’Sweden ’, ’
Stockholm ’);
Listing 2.3: Inserting the data into the table students.
MySQL According to the research made by company Gartner, the five leading com-
mercial database vendors are Oracle, IBM, Microsoft, SAP R© including SybaseR©
and
Teradata R© [6]. For the purpose of this application, it was MySQL RDBMS being used
to work with the database. MySQL4 is one of the three open source implementations of
RDBMS by Oracle, together with PostgreSQL and SQLite and the world’s most widely
used open source RDBMS running as a server that provides multi-user access to a number
of databases [6]. Its founder is Michael Widenius, who named by him developed RDBMS
after his daughter, My. MySQL is usually the first choice from all RDBMS to use in web
applications, including today’s favorite World Wide Web products such as Facebook R© ,
Wikipedia, Twitter, FlickrTM or YouTube. It is a cross-platform RDBMS, running on
different operating systems and written in C and C++. By default, MySQL as RDBMS
comes with no GUI tools to manage the data contained in the database. The user can use
command-line tools or so-called ”front-ends”, third-party proprietary and free graphical
administration applications. Those tools give an advantage of a possibility to visually
design the database, administer it and manage the data. One such application, MySQL
Workbench, was officially developed by Oracle. Another one, phpMyAdmin, was used for
the purpose of this work and is closely described in the section 2.5.1.
2.3 Database design
Before collecting the data, the database was designed in order to meet the require-
ments for the application. The database wikiglobe contained just one table named
4http://www.mysql.com/
Michal Bodnar: Research on Geovisualization Methods and Technology forThe WikiGlobe System
47

2. METHODOLOGY
greatplaces (Table 2.4), which included 100 rows representing 100 Great Places of His-
tory [5]. An attribute id was chosen to be the primary key as it has a unique value
for every site. The column name serves as a name of every site and is of type varchar,
attributes longitude, latitude represent the coordinates of the site in decimal degrees.
Columns country and continent are of type varchar and display a country and continent
in which every site is located, respectively. Attribute type represents the category which
every site belongs to and is of type varchar. Columns description path, story path,
icon path and picture path are all absolute paths to the concrete files in the file system
within the project. In case of description path and story path, those paths are ad-
dressing to the text files containing description and story about every place, respectively.
In case of icon path, the path is referring to the PNG5 image representing concrete icon.
The attribute picture path is the absolute path to the folder in which pictures for a
concrete site are stored. Finally, the attribute video link is of type varchar and contains
the URL link to the video about every site on YouTube6.
greatplaces
Attribute Type
id int
name varchar
longitude decimal
latitude decimal
country varchar
continent varchar
type varchar
description path varchar
story path varchar
icon path varchar
picture path varchar
video link varchar
Table 2.4: Table greatplaces.
5Portable Network Graphics6http://www.youtube.com/
Michal Bodnar: Research on Geovisualization Methods and Technology forThe WikiGlobe System
48

2. METHODOLOGY
Data collection
The data were collected with a use of different sources. For attributes name and
story path, it was the book Great Places of History [5] that served as a source of data. For
every site, the story written in the book was rewritten into the text file and the absolute
path addressing this file was saved within story path attribute. The values of attributes
longitude, latitude, country and continent were extracted from Wikipedia [6]. Sim-
ilarly for description path containing the path referring to the text file, Wikipedia [6]
was used as a source. Pictures stored in a separate folder for every site were retrieved
from different websites over the internet, but mainly from [32], photo galleries produced
by Alfred Molon. The videos were collected from YouTube.
A special interest was given to the design of the icons for every historical place. The
process in their creating can be divided into three steps. Firstly, a search was made over
the internet in order to find a suitable candidate for being an icon or a picture, whose
part could be extracted and used to create the icon from it. In most cases, the latter
option was present. After that, the picture was loaded into PhotoshopR©
software, where
it was modified in order to meet the final required design. Finally, the icon was saved as
PNG image with a size of 32 x 32 pixels. Figure 2.4 shows how the original image was
used to create the icon, in this case for the site City of Arts and Sciences.
Figure 2.4: Creating an icon for the site City of Arts and Sciences.
2.4 Application design
2.4.1 Graphical User Interface
One of the main goals of the application Great Places WikiGlobe was to make it user-
friendly, intuitive and able to be controlled by the user without a knowledge of any
technology hidden behind it. Creating an interface between human and computer is a
Michal Bodnar: Research on Geovisualization Methods and Technology forThe WikiGlobe System
49

2. METHODOLOGY
task being under research for many years. In the past, command-line interfaces (CLI)
were in use. Operating this interface required typing commands on the keyboard, which
logically meant one had to have a knowledge of the application’s technology. Surely, once
those commands were learned, an effective use of the application could be performed.
However, this made a range of possible users very narrow. Graphical User Interface
(GUI) is a solution how to make an application operable by different types of users, both
experienced and non-experienced. GUI is a type of user interface that allows user to
interact with electronic devices using images [6]. Besides computers, it is being used in
hand-held services, such as MP3 players, portable media players or gaming devices.
GUI uses a combination of methods and technologies to provide a platform between the
user and application. It offers a series of elements, that create a so-called visual language
which allows user to interact with the software. The most common combination of such
elements used today is called WIMP (”window, icon, menu, pointing device”) paradigm,
mainly between personal computers [6]. To implement those elements in one interface,
a set of tools called widget toolkit7 is used. There are different such toolkits based on
different programming languages. In case of Java, the most used one today is a toolkit
called Swing (more about Swing in the section 2.5.2).
The first WIMP component, Window is an area on the screen that serves to display
an information within it and is independent from the other elements of GUI. There are
different kinds of windows such as a container window, a browser window (used in web
pages) or a text terminal window (used in CLI). Container window is the window invoked
by clicking an icon and providing another set of icons than can be clicked. Menu provides
a comprehensive set of the commands that can be executed by clicking the icon or by an
input from the keyboard. Menu bar (Figure 2.5) is usually displayed horizontally across
the top of the screen and is very often associated with a pull-down menu (Figure 2.6),
that is shown every time the user clicks any of the menu bar elements. An Icon is a small
picture representing some objects such as a program, file or web page. In GUI, icons
can be grouped into a so-called toolbar (Figure 2.7), where each of them indicates the
function that will be run once user clicks it. A Pointing device is an input interface that
allows the user to input spatial data into application, by using different operations such
7Widget toolkit, or GUI library, or GUI toolkit is a set of widgets for use in designing applicationswith graphical user interfaces (GUIs).
Michal Bodnar: Research on Geovisualization Methods and Technology forThe WikiGlobe System
50

2. METHODOLOGY
as click or drag & drop. This is usually done by moving a cursor of the mouse across the
screen of the GUI.
Figure 2.5: An example of menu bar.
Figure 2.6: An example of pull-down menu.
Figure 2.7: An example of toolbar.
2.4.2 Design of GUI
A design of GUI of the application was made in such a way that the main part of it
was taken by 3D globe. It was divided into 5 main parts (Figure 2.8):
1. menu bar and toolbar;
2. a window serving as a search engine for the places on the globe;
3. a window containing a list of layers;
4. a window containing a list of Great Places of History with an additional information
to each of it;
5. a window containing 3D globe.
Michal Bodnar: Research on Geovisualization Methods and Technology forThe WikiGlobe System
51
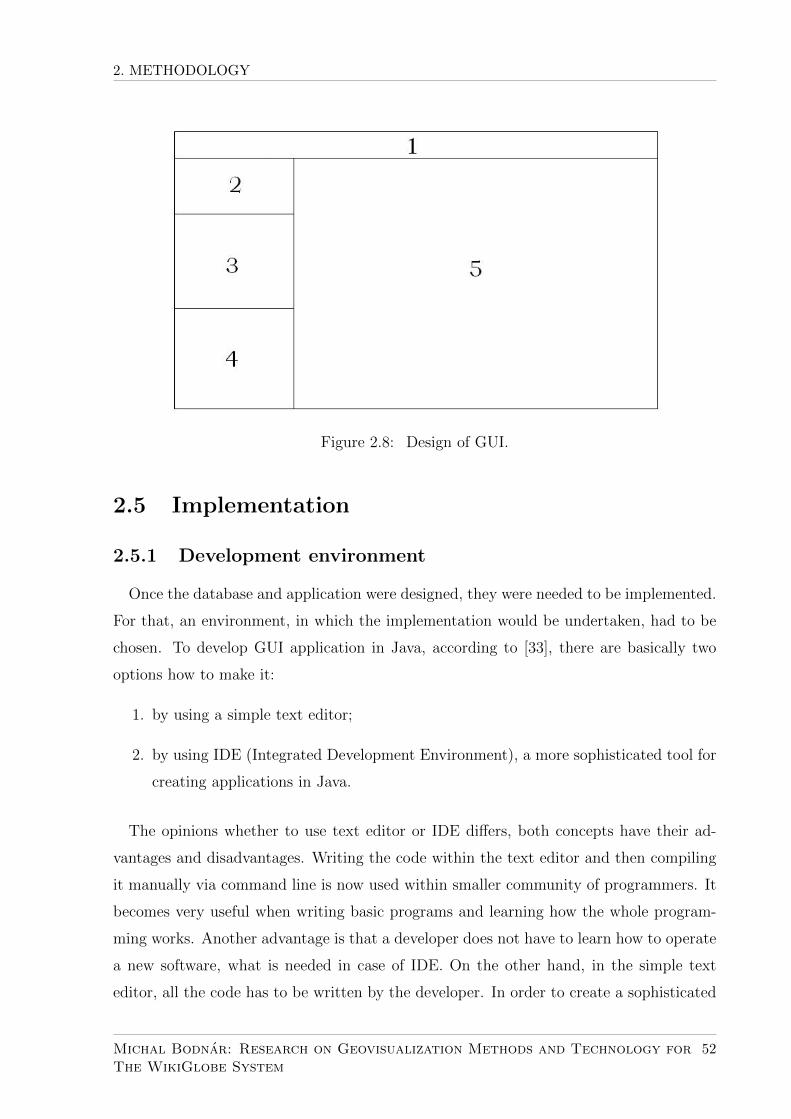
2. METHODOLOGY
Figure 2.8: Design of GUI.
2.5 Implementation
2.5.1 Development environment
Once the database and application were designed, they were needed to be implemented.
For that, an environment, in which the implementation would be undertaken, had to be
chosen. To develop GUI application in Java, according to [33], there are basically two
options how to make it:
1. by using a simple text editor;
2. by using IDE (Integrated Development Environment), a more sophisticated tool for
creating applications in Java.
The opinions whether to use text editor or IDE differs, both concepts have their ad-
vantages and disadvantages. Writing the code within the text editor and then compiling
it manually via command line is now used within smaller community of programmers. It
becomes very useful when writing basic programs and learning how the whole program-
ming works. Another advantage is that a developer does not have to learn how to operate
a new software, what is needed in case of IDE. On the other hand, in the simple text
editor, all the code has to be written by the developer. In order to create a sophisticated
Michal Bodnar: Research on Geovisualization Methods and Technology forThe WikiGlobe System
52

2. METHODOLOGY
GUI application, where the whole project consists of numbers of different classes included
in many different packages, it is easier, time-saving and more clear to use IDE. IDEs are
much more complex then text editors, they integrate tightly with the compiler or applica-
tion server and usually dispose with SDK (Software Development Kit) as well as tools for
debugging, version control and so forth [33]. According to [6], an IDE is ” ... a software
application that provides comprehensive facilities to computer programmers for software
development. An IDE normally consists of a source code editor, build automation tools
and a debugger.” There are many of different IDEs used for developing applications in
Java, from which the most used these days is Eclipse software [33].
Eclipse Helios
Eclipse is a multi-language software development environment comprising a base work-
space and an extensible plug-in system for customizing the environment [6]. It is written
mostly in Java and used to develop applications in Java as well. By using various plug-ins,
other programming languages can be included, such as Python, C or C++. Eclipse SDK,
which includes JDT (Java Development Tools), is a free open source software released
under the term of the Eclipse Public License. It was firstly developed as a version 3.0
on June, 2004 and its last planned version (about to release on June 2014) is 4.4 with a
project called Eclipse Luna. Eclipse Helios (Figure 2.9), which was used for the purpose
of this work, was released on June 23, 2010 as the version 3.6 of this software.
Figure 2.9: A logo of Eclipse Helios.
phpMyAdmin client
Generally, to manage MySQL database, there are couple of third-party proprietary and
free graphical administration tools, that are able to integrate with MySQL and enable
Michal Bodnar: Research on Geovisualization Methods and Technology forThe WikiGlobe System
53

2. METHODOLOGY
users to work with data and database structure visually. For the purpose of this appli-
cation, one such tool, phpMyAdmin (Figure 2.10) was chosen to work with the database
wikiglobe defined in section 2.3. PhpMyAdmin is a free and open source tool written in
PHP8 intended to handle the administration of MySQL with the use of web browser [6].
It gives user a possibility to create, modify or delete database, tables, fields or rows as
well as execute SQL statements.
Figure 2.10: A logo of phpMyAdmin.
At the beginning, the database named wikiglobe was created on localhost under root
as a user. Afterwards, *.xls file, containing the only one table that database was con-
sisting of (Table 2.4), was imported into this database and named as greatplaces. The
whole process of creating the database was done then.
2.5.2 Implementation of GUI
To implement GUI, as has been already mentioned, there is a need of set of tools
for creating GUI components and so widget toolkit. In Java, the first such toolkit was
Abstract Windows Toolkit (AWT), followed by Swing, that is widely used in creating
the majority of GUI applications in Java these days. In order to use this toolkit in the
application, swing package has to be imported into the code: import javax.swing.*.
Making the simplest GUI with Swing is very straight-forward and consists of following
steps according to [3]:
1. making a frame by creating an instance of JFrame object: JFrame frame = new
JFrame();
8PHP is a server-side scripting language designed for web development but also used as a general-purpose programming language.
Michal Bodnar: Research on Geovisualization Methods and Technology forThe WikiGlobe System
54

2. METHODOLOGY
2. making a widget (button, text field, ...): JButton button = new JButton ("click
me");
3. adding the widget into the frame: frame.getContentPane().add(button);
4. displaying the frame (giving it size and making it visible): frame.setSize(300,300);
frame.setVisible().
Figure 2.11 depicts the class hierarchy of Swing components.
Figure 2.11: Swing class hierarchy.
In order to manage more sophisticated GUI, just simple JFrame window is not enough.
Looking back to the application’s design suggested, it is obvious that there will be a need
of more than one window to be implemented within the main frame. Today, the most
effective and popular way how to manage all these windows is making them dockable, i.e.
to create windows that can exist either in a floating state or be attached to the main
frame of the application [46]. Docking the component (or window) means that it can be
dragged to a given location on the screen and then snapped into some unseen grid, not
visible in a layout of the application. Hence, the component being dragged is docked into
this layout at the location where it has been dropped. Dockable windows help to group
the main application’s frame into several fixed areas so that GUI does not look confusing
Michal Bodnar: Research on Geovisualization Methods and Technology forThe WikiGlobe System
55

2. METHODOLOGY
and cluttered [45]. Docking framework is a set of tools responsible for providing a set of
objects to manage these capabilities and its behaviour. There are several such frameworks
available these days, such as Raven Docking, My Doggy, VL Docking, Docking Frames,
JIDE Docking Framework and many others (according to [47]). From all of them, the
most active one is Docking Frames, being also used for the purpose of this application.
Docking Frames
Docking Frames9 is an open source Java Swing framework published under LGPL10
2.1, which allows a developer to use this framework in a way he likes [48]. As it has been
already mentioned, the purpose of such framework is to write an application with floating
panels that can be moved around by user. Here are some of the features listed according
to [50]:
• pure Java/Swing;
• most components are replaceable and customizable;
• different ”themes” allow to change look and feel during the runtime;
• client can associate buttons, checkboxes, drop-down menus and other components
with the panels;
• toolbars;
• pop-up menus;
• behaviour of drag & drop can be modified;
• double clicks with the mouse are handled globally;
• panel’s size can be locked while resizing its parent’s window;
• color and fonts of tabs and titles can depend on the content.
9http://dock.javaforge.com/index.html10Lesser GNU Public License
Michal Bodnar: Research on Geovisualization Methods and Technology forThe WikiGlobe System
56

2. METHODOLOGY
The project itself consists of two sub-projects: Common and Core, represented by libraries
docking-frames-core.jar and docking-frames-common.jar, respectively. Common pro-
vides advanced functionalities that are built on top of Core, it is a wrapper around Core
and requires Core to work [49]. On the client side, Common project is the one that should
be used. In order to do so, both above mentioned libraries have to be included in the
project.
Common project The most current version of Common project is 1.1.1., which consists
of three layers: common, facile and support. For clients, the most used one is common
layer [49]. The basic Common application consists of one main window represented by
an instance of JFrame object, into which several other panels are incorporated, each of
them for different purpose, grouping the GUI thematically. Common adds additional layer
between main frame and panels in order to separate them and thus allows the user to use
drag & drop mechanism within the panels (windows). For doing this, every panel has to be
wrapped into a CDockable. Afterwards, the CDockables are put onto a set of CStations
providing the mentioned layer between the main frame and panels inside it. Furthermore,
a controller (of type CControl) has be to initiliazed in order to manage the look, position
and behaviour of all the elements. Since CDockable is an interface, a developer should use
one of two classes implementing this interface: DefaultSingleCDockable or Default-
MultiCDockable. A basic difference between them is that single-dockables exist just
once, while multi-dockables can be destroyed and created again by the framework any
time.
Figure 2.12: Basic components of Common library.
Michal Bodnar: Research on Geovisualization Methods and Technology forThe WikiGlobe System
57

2. METHODOLOGY
The application Great Places WikiGlobe used Common library to create its GUI. Before
doing so, firstly a main frame together with a menu bar and toolbar were created in order
to get a basic structure of GUI (Listing 2.4). All Swing components were implementing an
interface I18nComponent, which was controlling an internationalization of the application.
1 . . .
2 frame = new JMainFrame ( GreatPlaces . class ) ;
3
4 menuBar = new JMenuBar ( ) ;
5 frame . setJMenuBar (menuBar ) ;
6
7 menuFile = new I18nJMenu ( I18nKeyConstants .MENU FILE) ;
8 menuBar . add (menuFile ) ;
9
10 menuOpenFile = new I18nJMenuItem ( I18nKeyConstants .MENU FILE IMPORTLAYER) ;
11 menuOpenFile . s e t I c on ( Icons . import layer . ge t I con ( ) ) ;
12 menuFile . add (menuOpenFile ) ;
13 menuFile . addSeparator ( ) ;
14 . . .
Listing 2.4: Creating main frame and other Swing components.
According to the application’s design, there were supposed to be four windows in-
side main frame. Eeach of them was wrapped into CDockable by creating a subclass
of DefaultSingleCDockable called I18nDefaultSingleCDockable. This class was im-
plementing I18nComponent interface similarly as JComponents described above. From
I18nDefaultSingleCDockable, four different subclasses were extended, each of them
defining a single window in GUI:
• EarthViewDockable, into which the 3D globe was implemented;
• SearchViewDockable, which provided a window for searching for the places on the
globe;
• LayerViewDockable, providing a list of layers;
• GreatPlacesInfoDockable, providing a window for searching for a concrete place
from 100 Great Places of History.
Michal Bodnar: Research on Geovisualization Methods and Technology forThe WikiGlobe System
58

2. METHODOLOGY
Figure 2.13: A class hierarchy of 4 main windows - CDockables in the application.
These four CDockables were controlled by creating an instance of CControl object,
which served as an inter-layer between them and the main frame called frame (frame was
created as shown in Listing 2.4). CGrid was used to make a layout of all four components
within frame. The method setViewLayout() (Listing 2.5) shows how the whole process
was implemented.
1 private void setViewLayout ( ) {2 c c on t r o l = new CControl ( frame ) ;
3 frame . destroyOnClose ( c on t r o l ) ;
4 frame . getContentPane ( ) . add ( c on t r o l . getContentArea ( ) , BorderLayout .CENTER)
;
5 frame . s e tV i s i b l e ( true ) ;
6
7 earth = new EarthViewDockable (wwd, I18nKeyConstants .VIEWEARTH) ;
8 search = new SearchViewDockable (wwd, I18nKeyConstants .VIEW SEARCH) ;
9 l a y e r s = new LayerViewDockable (wwd, I18nKeyConstants .VIEW LAYERS) ;
10 grea t = new GreatPlacesIn foDockable (wwd, I18nKeyConstants .VIEW FAVORITE) ;
11
12 con t r o l . addDockable ( earth ) ;
13 con t r o l . addDockable ( l a y e r s ) ;
14 c on t r o l . addDockable ( search ) ;
15 con t r o l . addDockable ( g rea t ) ;
16
17 con t r o l . setTheme (ThemeMap .KEY ECLIPSE THEME) ;
18
19 g r id = new CGrid ( c on t r o l ) ;
20 g r id . add (0 , 0 , 40 , 30 , s earch ) ;
21 g r id . add (40 , 0 , 100 , 100 , earth ) ;
Michal Bodnar: Research on Geovisualization Methods and Technology forThe WikiGlobe System
59

2. METHODOLOGY
22 g r id . add (0 , 30 , 40 , 80 , l a y e r s ) ;
23 g r id . s e l e c t (0 , 30 , 40 , 80 , l a y e r s ) ;
24 g r id . add (0 , 80 , 40 , 100 , g r ea t ) ;
25 c on t r o l . getContentArea ( ) . deploy ( g r id ) ;
26 }
Listing 2.5: Setting a layout of the application.
2.5.3 Implementation of World Wind Java technology
World Wind Concept
In order to use the capabilities and functionality of World Wind Java SDK, it is vital to
understand how World Wind components work. To display 3D globe and other geographic
content within Java application, one or more WorldWindow objects have to be inserted into
the code. Except for WorldWindow, there are several other major World Wind interfaces
(Figure 2.14) [39]:
• Globe representing the shape and terrain of the planet, having Tessellator inter-
face included to generate the terrain;
• Layer applying imagery, shapes and other information to the globe;
• Model aggregating the globe and its layers;
• View determining the user’s view of the model and driven by input events from the
user via InputHandler interface;
• SceneController controlling the rendering of Model and associating Model with
View.
All World Wind components are extensible, meaning that a concrete class within SDK
can be replaced or extended. This functionality gives user a lot of space to ”play” with
the components. The easiest example of applying these components is a demo Hello-
WorldWind.java included in gov.nasa.worldwindx.examples package. An extraction
of it is shown in Listing 2.6.
Michal Bodnar: Research on Geovisualization Methods and Technology forThe WikiGlobe System
60

2. METHODOLOGY
Figure 2.14: The concept of World Wind Java SDK.
1 private stat ic class AppFrame extends javax . swing . JFrame
2 {3 public AppFrame ( )
4 {5 WorldWindowGLCanvas wwd = new WorldWindowGLCanvas ( ) ;
6 wwd. s e tP r e f e r r e dS i z e (new java . awt . Dimension (1000 , 800) ) ;
7 this . getContentPane ( ) . add (wwd, java . awt . BorderLayout .CENTER) ;
8 this . pack ( ) ;
9
10 wwd. setModel (new BasicModel ( ) ) ;
11 }12 }13
14 public stat ic void main ( St r ing [ ] a rgs )
15 {16
17 java . awt . EventQueue . invokeLater (new Runnable ( )
18 {19 public void run ( )
20 {21 // Create an AppFrame and immediate ly make i t v i s i b l e . As
per Swing convention , t h i s
22 // i s done wi th in an invokeLater c a l l so t ha t i t e x e cu t e s
on an AWT thread .
23 new AppFrame ( ) . s e tV i s i b l e ( true ) ;
24 }25 }) ;26
Michal Bodnar: Research on Geovisualization Methods and Technology forThe WikiGlobe System
61

2. METHODOLOGY
27 }
Listing 2.6: An extraction of HelloWorldWind.java.
From the demo above it can be seen how World Wind components are implemented
into Java code. Firstly, an instance of WorldWindowGLCanvas object, that is implementing
WorldWindow interface, is created (line 5). Afterwards, the model is passed to it by calling
method setModel (line 10). This method has one argument, defining a type of Model
being used. The most basic model is BasicModel and by creating an instance of this
object, globe and layers are automatically aggregated into WorldWindow.
World Wind’s technology implementation into the application
Similarly as in the demo in Listing 2.6, World Wind components were implemented
into the application defined in the method initEarthModel() (Listing 2.7). There were
also additional components added, and so HighlightController, ToolTipController,
HotSpotController and BalloonController. HighlightController is used to con-
trol highlighting of any shapes in a concrete WorldWindow. ToolTipController compo-
nent controls the display of tool tips of picked objects within WorldWindow. In case of
HotSpotController, this component is used to control mouse and keyboard events made
within WorldWindow. BalloonController controls the display of Balloon objects (more
about Balloon in the section 2.5.4).
1 private void in i tEarthModel ( ) {2 wwd = new WorldWindowGLJPanel ( ) ;
3 Model model = (Model ) WorldWind . createConf igurat ionComponent (AVKey.
MODEL CLASS NAME) ;
4 wwd. setModel (model ) ;
5
6 . . . .
7
8 wwd. addSe l e c tL i s t ene r (new Cl ickAndGoSelectListener (wwd, WorldMapLayer .
class ) ) ;
9
10 h i g h l i g h tCon t r o l l e r = new High l i gh tCon t r o l l e r (wwd, Se lectEvent .ROLLOVER) ;
11 t oo lT ipCont r o l l e r = new ToolTipContro l l e r (wwd, AVKey.DISPLAY NAME, null ) ;
12 hotSpotCpntro l l e r = new HotSpotContro l l e r (wwd) ;
13 ba l l o onCon t r o l l e r = new Ba l l oonCont ro l l e r (wwd) ;
14 }
Listing 2.7: Initializing of World Wind components.
Michal Bodnar: Research on Geovisualization Methods and Technology forThe WikiGlobe System
62

2. METHODOLOGY
By default, following layers are included in any World Wind application:
• Stars,
• Atmosphere,
• NASA Blue Marble Image,
• i-cubed Landsat,
• USDA NAIP,
• USDA NAIP USGS,
• MS Virtual Earth Aerial,
• Bing Imagery,
• USGS Topographic Maps 1:250K,
• USGS Topographic Maps 1:100K,
• USGS Topographic Maps 1:24K,
• USGS Urban Area Ortho,
• Political Boundaries,
• Place Names,
• World Map,
• Scale Bar,
• Compass,
• Controls.
Michal Bodnar: Research on Geovisualization Methods and Technology forThe WikiGlobe System
63

2. METHODOLOGY
All the layers are layers of imagery displayed on the globe, except for the last four
of them. They serve as ”layers” to turn on/off the display of WorldMap, Scale Bar,
Compass and Controls components within WorldWindow, respectively. World Map is a
map of the world located by default in the north-west corner of WorldWindow. Very useful
feature of this component is that by user’s clicking in to any place on this map, it will
automatically zoom in to the same location on 3D globe. To do so, ClickAndGoListener
has to be implemented (see Listing 2.7, line 8). Scale Bar serves to display a scale bar
within WorldWindow and is located in the south-east corner of it, while Compass displays
a compass and is put into the north-east corner of the window. Finally, Controls is a
World Wind component providing a set of tools for zooming in/out, rotating and tilting
the view. Its default position is in the south-west corner of WorldWindow.
To include a list of layers within LayerViewDockable window, firstly, all the layers were
retrieved:
1 LayerL i s t l a y e r s = wwd. getModel ( ) . getLayers ( ) ;
Listing 2.8: A retrieval of the layers.
Afterwards, an instance of LayerTreeModel object called treeModel, a subclass of
TreeModel class defined within java.swing.tree package was created, taking the list
of layers layers as an argument. This model was then passed as an argument of an in-
stance of CheckBoxTree object, a subclass of JTree. Finally, an instance of JScrollPane,
treeContainer was displayed within LayerViewDockable window (Listing 2.9).
1 treeModel = new LayerTreeModel ( l a y e r s ) ;
2 layerTree = new CheckBoxTree ( treeModel ) ;
3 t r eeConta ine r = new JScro l lPane ( layerTree ) ;
4
5 getContentPane ( ) . add ( treeConta iner , BorderLayout .CENTER) ;
Listing 2.9: Including the list of layers within LayerViewDockable window.
To display 3D globe within EarthViewDockable window, wwd, an instance of World-
WindGLJPanel object, defined in the method initEarthModel (Listing 2.7), was added
into a content pane of the window, in a following way:
Michal Bodnar: Research on Geovisualization Methods and Technology forThe WikiGlobe System
64

2. METHODOLOGY
1 getContentPane ( ) . setLayout (new BorderLayout ( ) ) ;
2 getContentPane ( ) . add (wwd, BorderLayout .CENTER) ;
Listing 2.10: Displaying 3D globe within EarthViewDockable window.
100 Great Places of History as add-on
One of the benefits of World Wind Java technology is that a developer can import his
own made plug-in or add-on into the application (see section 1.3.1) meaning that, for
example, besides a default set of layers, any other layer can be incorporated and used.
Those layers, either point, line or polygon, are imported into World Wind as XML layers.
WikiGlobe SDK disposes with a class WWXMLIconLayer, a subclass of IconLayer defined
in gov.nasa.worldwind.layers package, that serves for this purpose (Figure 2.15).
Figure 2.15: Class hierarchy of WWXMLIconLayer.
Moreover, a template for XML file, that could be read by the method readXML(String
file) of WWXMLIconLayer class, was developed. Having this, firstly, XML file GreatPla-
cesIcons.xml (Listing 2.11) was created, including all the places that were about to be
imported.
1 <?xml version="1.0" encoding="UTF -8"?>
2 ...
3 <Icon>
4 <Name_e >Pyramid of Khufu and The Sphinx </Name_e >
5 <Latitude >
6 <Value>29.979 </Value>
Michal Bodnar: Research on Geovisualization Methods and Technology forThe WikiGlobe System
65
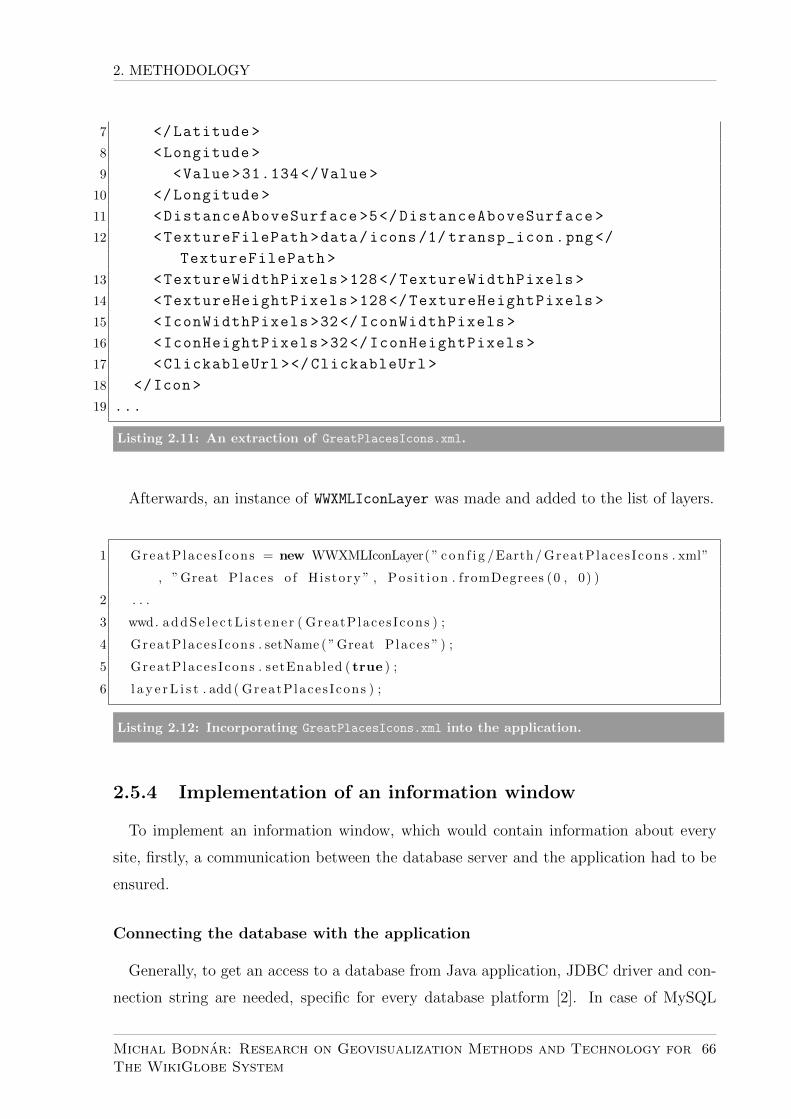
2. METHODOLOGY
7 </Latitude >
8 <Longitude >
9 <Value>31.134 </Value>
10 </Longitude >
11 <DistanceAboveSurface >5</DistanceAboveSurface >
12 <TextureFilePath >data/icons /1/ transp_icon.png</
TextureFilePath >
13 <TextureWidthPixels >128</TextureWidthPixels >
14 <TextureHeightPixels >128</TextureHeightPixels >
15 <IconWidthPixels >32</IconWidthPixels >
16 <IconHeightPixels >32</IconHeightPixels >
17 <ClickableUrl ></ClickableUrl >
18 </Icon>
19 ...
Listing 2.11: An extraction of GreatPlacesIcons.xml.
Afterwards, an instance of WWXMLIconLayer was made and added to the list of layers.
1 GreatPlaces Icons = new WWXMLIconLayer( ” c on f i g /Earth/GreatPlaces Icons . xml”
, ”Great Places o f His tory ” , Pos i t i on . fromDegrees (0 , 0) )
2 . . .
3 wwd. addSe l e c tL i s t ene r ( GreatPlaces Icons ) ;
4 GreatPlaces Icons . setName ( ”Great Places ” ) ;
5 GreatPlaces Icons . setEnabled ( true ) ;
6 l a y e rL i s t . add ( GreatPlaces Icons ) ;
Listing 2.12: Incorporating GreatPlacesIcons.xml into the application.
2.5.4 Implementation of an information window
To implement an information window, which would contain information about every
site, firstly, a communication between the database server and the application had to be
ensured.
Connecting the database with the application
Generally, to get an access to a database from Java application, JDBC driver and con-
nection string are needed, specific for every database platform [2]. In case of MySQL
Michal Bodnar: Research on Geovisualization Methods and Technology forThe WikiGlobe System
66

2. METHODOLOGY
database, JDBC driver is com.mysql.jdbc.driver and the connection string jdbc:-
mysql://server/database name?characterEncoding=UTF-8. Adding the driver for the
communication with the database server is done by including a library mysql-connec-
tor-java-5.0.7-bin.jar within the project. Firstly, a configuration XML file con-
fig.xml was created, in which the connection string to the database stored locally
via phpMyAdmin, username and password for accessing it were defined (Listing 2.13).
Afterwards, this XML file was read by the method openDatabase() included in class
OpenMySql.
1 <?xml version="1.0" encoding="UTF -8" ?>
2 <config >
3 <connecting >
4 <url>jdbc:mysql: // localhost:3306/greatplaces </url>
5 <user>username </user>
6 <password >password </password >
7 </connecting >
8 </config >
Listing 2.13: A configuration XML file config.xml.
Balloon interface
In World Wind Java SDK, there are basically two ways how to display additional data
within WorldWindow:
1. by implementing Annotation interface;
2. by implementing Balloon interface.
Annotations are text labels with support for multi-line text, simple HTML and many
styling attributes such as font face, size and color, bubble shapes and background im-
age. These information can be either attached to a particular location on the globe or
simply to a point on the screen. The concept of Balloons is similar to Annotations,
however, besides simple HTML, it supports JavaScript and Flash11 content as well. Since
the information about every site will include video as well, Balloon interface is a right
choice. There are two interfaces implementing Balloon interface: GlobeBalloon and
11Flash is frequently used to add streamed video or audio players, advertisement and interactive multi-media content to web pages. It was created by Adobe Systems, that implemented Adobe Flash platform.
Michal Bodnar: Research on Geovisualization Methods and Technology forThe WikiGlobe System
67

2. METHODOLOGY
ScreenBalloon. Because the information window should be attached to a particular
place on the globe, GlobeBalloon is used. Two classes are implementing this interface:
GlobeBrowserBalloon and GlobeAnnotationBalloon, from which the first one is suit-
able for the purpose of this application. A class hierarchy between Balloon interface and
its subclasses is depicted in Figure 2.16.
Figure 2.16: Class hierarchy of Balloon.
A constructor of the class GlobeBrowserBalloon, public GlobeBrowserBalloon(Str-
ing text, Position position), is taking two arguments, where text is of type String
and defines the content of the balloon and position says where the balloon should be
located, defined by the latitude and longitude. Package gov.nasa.worldwindx.examples
disposes with an example Balloons.java (Listing 2.14) showing how one can include a
HTML content within the balloon. Firstly, HTML content is read as a byte stream by
using classes within gov.nasa.worldwind.util.WWIO package (line 10). This input byte
stream is then read into String (line 11) and passed as an argument to create an instance
of GlobeBrowserBalloon object (line 23).
1 . . .
2 protected stat ic f ina l St r ing BROWSERBALLOONCONTENTPATH = ”gov/nasa/
worldwindx/examples /data/BrowserBalloonExample . html” ;
3
4 St r ing htmlStr ing = null ;
5 InputStream contentStream = null ;
Michal Bodnar: Research on Geovisualization Methods and Technology forThe WikiGlobe System
68

2. METHODOLOGY
6
7 try
8 {9 // Read the URL content in t o a S t r ing us ing the d e f a u l t encoding (UTF
−8) .10 contentStream = WWIO. openFileOrResourceStream (
BROWSERBALLOONCONTENTPATH, this . g e tC la s s ( ) ) ;
11 htmlStr ing = WWIO. readStreamToString ( contentStream , null ) ;
12 }13 catch ( Exception e )
14 {15 e . pr intStackTrace ( ) ;
16 }17 f ina l ly
18 {19 WWIO. c loseStream ( contentStream , BROWSERBALLOONCONTENTPATH) ;
20 }21 Pos i t i on ba l l o onPos i t i on = Pos i t i on . fromDegrees (38 .883056 , −77.016389) ;22
23 AbstractBrowserBal loon ba l l oon = new GlobeBrowserBalloon ( htmlStr ing ,
ba l l o onPos i t i on ) ;
24 . . .
Listing 2.14: An extraction of Balloons.java.
MainBrowserBalloon.html
To create a HTML template MainBrowserBalloon.html, three technologies have been
used: HTML, CSS and JavaScript. HTML, or HyperText Markup Language, is the main
markup language for creating web pages and other information that can be visualized
in the web browser [6]. Every HTML document is basically a set of HTML elements, or
tags, that define a design of the content. The hierarchy of basic such elements can be seen
on Figure 2.17. Every HTML document has to be enclosed by <html> tags, inside which
there are two main tags included: <head> and <body>. The content within <head> tags is
not visible to the user of the page and includes a definition of scripts (such as JavaScript
scripts), metada information or defines a style of the page (in charge of CSS). On the
other hand, everything put between <body> tags will become visible to the ”world”.
JavaScript (JS) is an interpreted programming language, originally developed as a part
of web browsers so the client-side scripts could interact with the user [6]. The syntax
of the language is influenced the language C and a lot of names and conventions are
copied from Java, however, Java and JavaScript are not related, even though their names
Michal Bodnar: Research on Geovisualization Methods and Technology forThe WikiGlobe System
69

2. METHODOLOGY
Figure 2.17: A basic hierarchy of HTML elements.
could it possibly evoke. The key design principles are taken from the Self and Scheme
programming languages. The purpose of JavaScript included in HTML page is to add
an interactivity within this page, being explained on a very basic example (Listing 2.15).
Here, the JS function myFunction() is defined within <script> tags and called every
time a user clicks on the button saying ”Click Me!”. The calling is invoked by setting an
additional attribute within <button> tag and so onclick="myFunction" (line 13).
1 <!DOCTYPE html>
2 <html>
3 <body>
4
5 <script >
6 function myFunction ()
7 {
8 x=document.getElementById("demo"); // Find the
element
9 x.innerHTML="It works!"; // Change the content
10 }
11 </script >
12
13 <button type="button" onclick="myFunction ()">Click Me!</
button >
14
15 </body>
16 </html>
Listing 2.15: A basic HTML with JS function implemented.
Michal Bodnar: Research on Geovisualization Methods and Technology forThe WikiGlobe System
70

2. METHODOLOGY
Cascading Style Sheets, or CSS, is a style sheet language used for describing the presen-
tation semantics (the look and formatting) of a document written in a markup language
[6]. Its main goal is to design a style of HTML or XHTML12 documents. The definition
of the style of the web page, including elements such as layout, colors and fonts, is
managed within the <head> elements and thus makes the document content represented
by <body> tags separated from the content managing the style. This separation pro-
vides more flexibility, improves content accessibility and the created CSS template can be
interchangeably used between more web pages.
The document MainBrowserBalloon.html was designed in a such way that it was
containing tab interface with four tabs inside it:
• tab Info, including a description of every site;
• tab Story from TIME, containing a text from the book Great Places of History [5];
• tab Pictures, where a photo gallery was implemented;
• tab Video, including a video about every site.
To implement such design, two CSS styles’ templates, one for the overall design of the
document and one for the design of the photo gallery, were used. Moreover, JS functions
ensuring the functionality of tab interface were also implemented. The CSS template and
JS functions operating the tab interface were a modified version of JavaScript tabifier [52]
created by Patrick Fitzgerald.
The whole process of creating the information window is depicted in Figure 2.18.
It starts with the left mouse click on the desired site on the globe, which we want
to display information about. This site is represented by an icon, concretely a class
ClickableIcon, defined as the inner class of the class WWXMLIconLayer (Figure 2.15) and
extending the class UserFacingIcon, included in gov.nasa.worldwind.render package.
An instance of ClickableIcon object, icon, was created as shown in Listing 2.16 (line
9). The mouse left click on it was controlled by the class SelectEvent, defined within
gov.nasa.worldwind.event package. When the user clicked the icon under the cursor,
12XHTML (Extensible HyperText Markup Language) is a family of XML markup languages that mirroror extend versions of the widely used Hypertext Markup Language (HTML), the language in which webpages are written.
Michal Bodnar: Research on Geovisualization Methods and Technology forThe WikiGlobe System
71
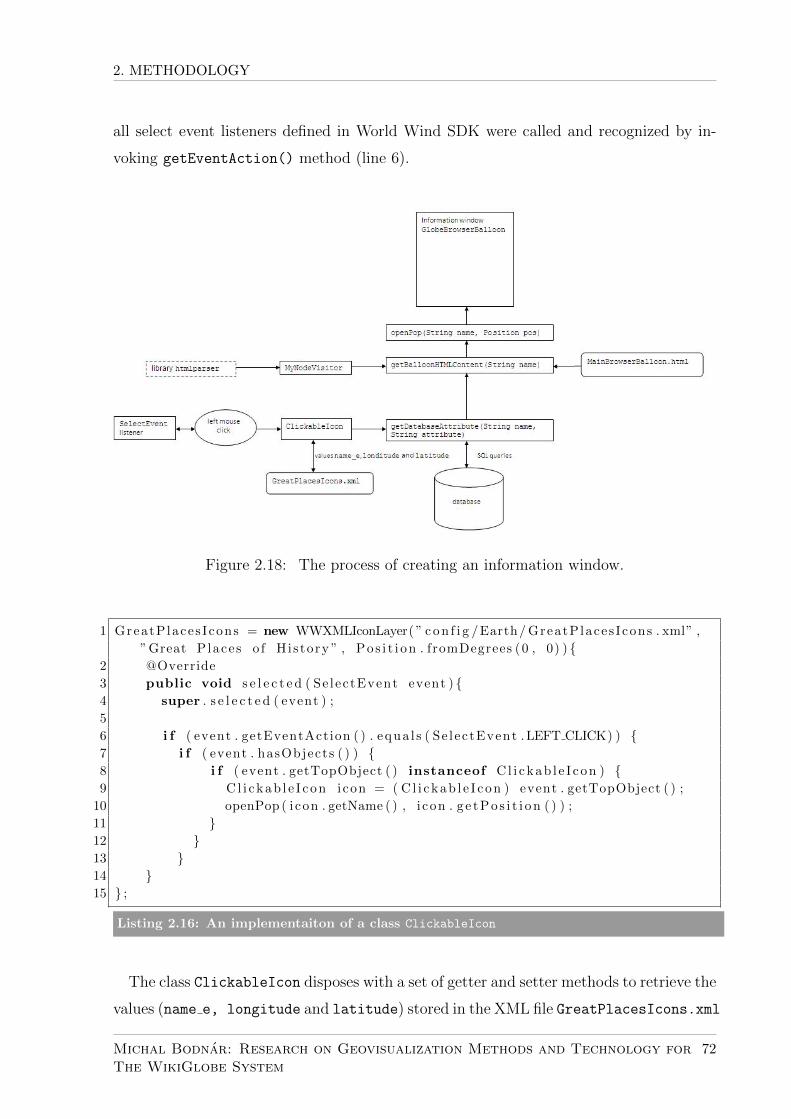
2. METHODOLOGY
all select event listeners defined in World Wind SDK were called and recognized by in-
voking getEventAction() method (line 6).
Figure 2.18: The process of creating an information window.
1 GreatPlaces Icons = new WWXMLIconLayer( ” c on f i g /Earth/GreatPlaces Icons . xml” ,
”Great Places o f His tory ” , Pos i t i on . fromDegrees (0 , 0) ) {2 @Override
3 public void s e l e c t e d ( Se lectEvent event ) {4 super . s e l e c t e d ( event ) ;
5
6 i f ( event . getEventAction ( ) . equa l s ( Se lectEvent .LEFT CLICK) ) {7 i f ( event . hasObjects ( ) ) {8 i f ( event . getTopObject ( ) instanceof Cl i ckab l e I con ) {9 C l i ckab l e I con icon = ( C l i ckab l e I con ) event . getTopObject ( ) ;
10 openPop ( i con . getName ( ) , i con . g e tPo s i t i on ( ) ) ;
11 }12 }13 }14 }15 } ;
Listing 2.16: An implementaiton of a class ClickableIcon
The class ClickableIcon disposes with a set of getter and setter methods to retrieve the
values (name e, longitude and latitude) stored in the XML file GreatPlacesIcons.xml
Michal Bodnar: Research on Geovisualization Methods and Technology forThe WikiGlobe System
72

2. METHODOLOGY
(Listing 2.11). The value name e, referring to the name of the concrete place being clicked,
is then used as one of the parameters in the function getDatabaseAttribute(String na-
me, String attribute) (Listing 2.17). The second parameter, attribute, defines the
attribute in the database whose value we want to retrieve.
1 public St r ing getDatabaseAttr ibute ( S t r ing name , S t r ing a t t r i b u t e )
2 {3 St r ing cmdStr = ”SELECT ∗ FROM gr ea tp l a c e s WHERE name = ’ ”+name+” ’ ; ” ;
4 Resu l tSet r s = ConnectMySql . GetResultSet ( cmdStr ) ;
5
6 St r ing r e s u l t S t r = ”” ;
7 try {8 i f ( r s != null ) {9 i f ( r s . next ( ) ) {
10 r s . l a s t ( ) ;
11
12 r e s u l t S t r = r s . g e tS t r i ng ( a t t r i b u t e ) ;
13 }14 }15 }catch ( Exception e ) {16 e . pr intStackTrace ( ) ;
17 }18 return r e s u l t S t r ;
19 }
Listing 2.17: A method getDatabaseAttribute(String name, String attribute).
The method getDatabaseAttribute(String name, String attribute) was then pa-
ssed into the method getBalloonHTMlContent(String name) (Listing 2.19). Its pur-
pose was to ”recreate” the HTML template MainBrowserBalloon.html according to
the site being clicked. To do that, a method of parsing was implemented. Parsing
is the process of analysing a string of symbols, either in natural language or in com-
puter languages, according to the rules of a formal grammar [6]. To parse the template
MainBrowserBalloon.html into a set of strings, a class MyNodeVisitor (Listing 2.18),
extending the class NodeVisitor defined within org.htmlparser.visitors package, was
created. The purpose of this class is to replace the keyword values defined in the template
MainBrowserBalloon.html with the values of attributes retrieved from the database and
thus make a unique HTML content for each of it. For instance, the string DataName
defined in the template would be replaced by the the string name, representing the name
of the place being clicked (line 19).
Michal Bodnar: Research on Geovisualization Methods and Technology forThe WikiGlobe System
73

2. METHODOLOGY
1 public class MyNodeVisitor extends NodeVis i tor {2 St r ing name ;
3 St r ing text ;
4 S t r ing storyText ;
5 S t r ing videoID ;
6 ArrayList<Str ing> p i c t u r e s ;
7
8
9 public MyNodeVisitor ( ArrayList<Str ing> Pictures , S t r ing Name, S t r ing
Text , S t r ing StoryText , S t r ing VideoId ) {10 this . name = Name ;
11 this . t ex t = Text ;
12 this . s toryText = StoryText ;
13 this . videoID = VideoId ;
14 this . p i c t u r e s = Pi c tu r e s ;
15 }16
17 public void v i s i t S t r i ngNode (Text s t r i n g )
18 {19 i f ( s t r i n g . getText ( ) . equa l s ( ”DataName” ) ) {20 s t r i n g . setText (name) ;
21 }22
23 else i f ( s t r i n g . getText ( ) . equa l s ( ”DataText” ) ) {24 s t r i n g . setText ( t ex t ) ;
25 }26
27 else i f ( s t r i n g . getText ( ) . equa l s ( ”DataStory” ) ) {28 s t r i n g . setText ( storyText ) ;
29 }30 }31
32 . . .
33 }
Listing 2.18: A class MyNodeVisitor.
As has been mentioned, the parsing process was included in the method getBalloon-
HTMlContent(String name) (Listing 2.19). An instance of Parser object, parser, was
taking as a parameter the byte stream representation of HTML template MainBrowser-
Balloon.html, htmlstring (line 29). Afterwards, an instance of MyNodeVisitor object,
nodeVisitor was created and by method visitAllNodesWith(NodeVisitor nodeVisi-
tor) also implemented (line 32). Finally, the list of nodes nl was converted into string
representation by the method toHtml() (line 41).
Michal Bodnar: Research on Geovisualization Methods and Technology forThe WikiGlobe System
74

2. METHODOLOGY
1 public St r ing getBalloonHTMLContent ( S t r ing name)
2 {3 NodeList n l = new NodeList ( ) ;
4 . . .
5
6 St r ing r e s u l t S t r = getDatabaseAttr ibute (name , ” d e s c r i p t i on pa th ” ) ;
7 S t r ing r e s u l t S t r 2 = getDatabaseAttr ibute (name , ”name” ) ;
8 S t r ing r e s u l t S t r 3 = getDatabaseAttr inute (name , p i c tu r e pa th ) ;
9 ArrayList<Str ing> p i c t u r e s = this . ge tPictureFo lderContent (name ,
r e s u l t S t r 3 ) ;
10
11 St r ing r e s u l t S t r 4 = getDatabaseAttr ibute (name , ” s to ry ” ) ;
12 St r ing r e s u l t S t r 5 = getDatabaseAttr ibute (name , ” v ideo path ” ) ;
13
14 try
15 {16 // Read the URL content in t o a S t r ing us ing the d e f a u l t
encoding (UTF−8) .17 contentStream = WWIO. openFileOrResourceStream (BROWSERBALLOON, this .
g e tC la s s ( ) ) ;
18 htmlStr ing = WWIO. readStreamToString ( contentStream , null ) ;
19 contentStream2 = WWIO. openFileOrResourceStream ( r e s u l t S t r , this .
g e tC la s s ( ) ) ;
20 t ex tS t r i n g = WWIO. readStreamToString ( contentStream2 , null ) ;
21 contentStream3 = WWIO. openFileOrResourceStream ( r e su l t S t r 4 , this
. g e tC la s s ( ) ) ;
22 s t o r yS t r i n g = WWIO. readStreamToString ( contentStream3 , null ) ;
23
24 }25 . . .
26
27
28 try {29 Parser par s e r = new Parser ( htmlStr ing ) ;
30 n l = par s e r . parse ( null ) ;
31 MyNodeVisitor nodeVi s i to r = new MyNodeVisitor ( p i c tu r e s , r e su l t S t r 2 ,
t ex tSt r ing , s to rySt r ing , r e s u l t S t r 5 ) ;
32 n l . v i s i tAl lNodesWith ( nodeVi s i t o r ) ;
33
34 n l . t oS t r i ng ( ) ;
35
36 } catch ( ParserExcept ion e ) {37 // TODO Auto−generated catch b l o c k
38 e . pr intStackTrace ( ) ;
39 }40
41 St r ing output = nl . toHtml ( ) ;
42
43 return output ;
44
Michal Bodnar: Research on Geovisualization Methods and Technology forThe WikiGlobe System
75

2. METHODOLOGY
45 }
Listing 2.19: A method getBalloonHTMlContent(String name).
The method getBalloonHTMlContent(String name) was finally passed to the method
openPop(String name, Position pos) (Listing 2.20). An argument pos was defined by
the values latitude and longitude derived from the file GreatPlacesIcons.xml (List-
ing 2.11) at the beginning of the process. An instance of GlobeBrowserBalloon object,
balloon was created (line 4) and the information window was opened in the interface.
1 Gpublic void openPop ( St r ing name , Pos i t i on pos ) {2
3 St r ing content = getBalloonHTMLContent (name) ;
4 GlobeBrowserBalloon ba l l oon = new GlobeBrowserBalloon ( content , pos ) ;
5
6 . . . .
7
8 ba l l oon . setAlwaysOnTop ( true ) ;
9 RenderableLayer l ay e r = new RenderableLayer ( ) ;
10 l ay e r . setName ( ”Bal loons ” ) ;
11
12 l ay e r . addRenderable ( ba l l oon ) ;
13 wwd. getModel ( ) . getLayers ( ) . add ( l ay e r ) ;
14
15 }
Listing 2.20: A method openPop(String name, Position pos).
Michal Bodnar: Research on Geovisualization Methods and Technology forThe WikiGlobe System
76

Chapter 3
Results
The following chapter will present the application Great Places WikiGlobe, mainly by
the screenshots of its GUI, with describing its functionality. When running the applica-
tion, a splash screen is displayed until the interface is loaded (Figure 3.1).
Figure 3.1: A splash screen of the application.
Once the application is loaded, the main interface is shown (Figure 3.2). The menu
bar consists of 5 drop-down menus, and so File, View, Tools, Settings and Help. In the
File menu, the user can import a SHP layer or take a screenshot of the depicted area on
the globe. An interesting feature included in the View menu is a possibility to change the
view mode from ”Earth” to ”Flat” and thus convert 3D globe into 2D map represented
by four different projections: Mercator (Figure 3.3), Sinusoidal, Modified Sinusoidal and
77

3. RESULTS
Latitude-Longitude. In the Settings menu, the language in which the GUI is displayed
can be switched between chinese and english.
Figure 3.2: The main interface of the application.
Figure 3.3: 2D view in Mercator projection.
Michal Bodnar: Research on Geovisualization Methods and Technology forThe WikiGlobe System
78
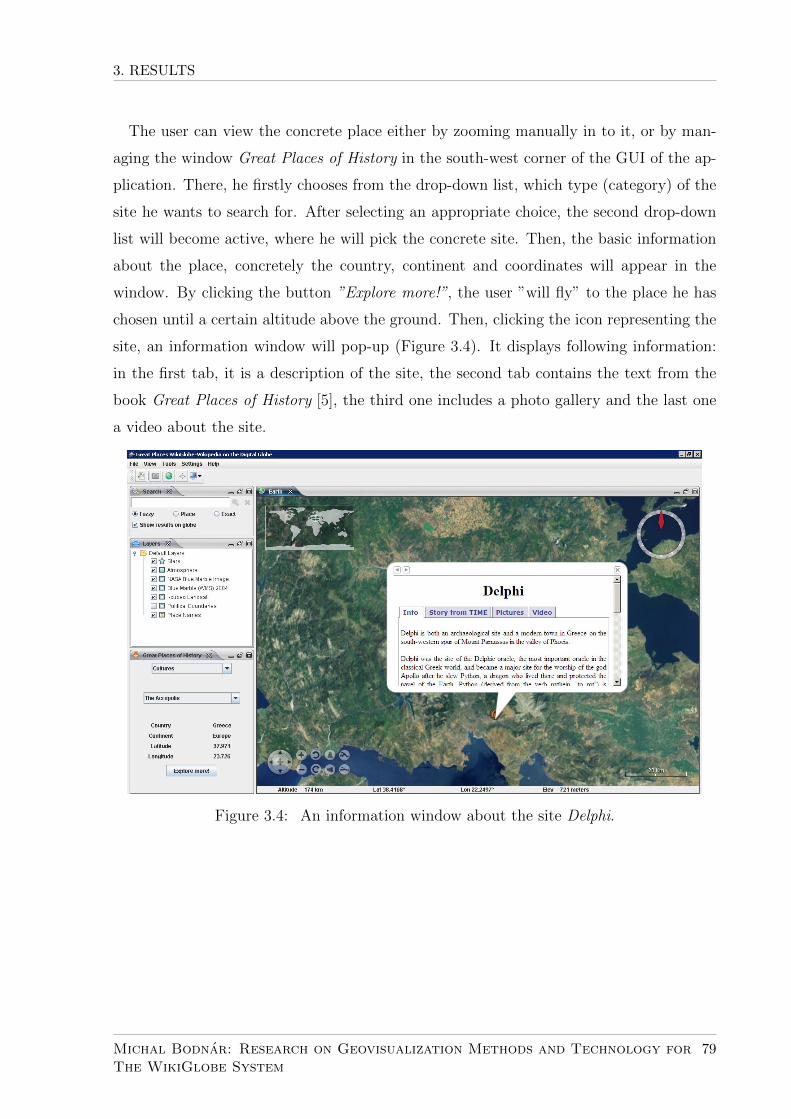
3. RESULTS
The user can view the concrete place either by zooming manually in to it, or by man-
aging the window Great Places of History in the south-west corner of the GUI of the ap-
plication. There, he firstly chooses from the drop-down list, which type (category) of the
site he wants to search for. After selecting an appropriate choice, the second drop-down
list will become active, where he will pick the concrete site. Then, the basic information
about the place, concretely the country, continent and coordinates will appear in the
window. By clicking the button ”Explore more!”, the user ”will fly” to the place he has
chosen until a certain altitude above the ground. Then, clicking the icon representing the
site, an information window will pop-up (Figure 3.4). It displays following information:
in the first tab, it is a description of the site, the second tab contains the text from the
book Great Places of History [5], the third one includes a photo gallery and the last one
a video about the site.
Figure 3.4: An information window about the site Delphi.
Michal Bodnar: Research on Geovisualization Methods and Technology forThe WikiGlobe System
79

Chapter 4
Conclusion and Discussion
Today, one of the most current research themes in geoinformatics is how to integrate an
information from the wide range of sources with a use of geospatial and geovisualization
methods and interpret retrieved data in an understandable way [24]. The main goal of
WikiGlobe project, that has been being developed at Beihang University for couple of
years, is to provide a set of tools that will allow a developer to merge virtual globe with
additional data, such as an extraction from the text, video, audio recordings or pictures in
order to find a way how to fulfil the mentioned research direction. Great Places WikiGlobe
has shown a potential to create an application that can satisfy this criteria and its main
goal, incorporating 100 Great Places of History [5], represented by its description, pictures
and video, was convened.
World Wind Java SDK, a development kit that WikiGlobe SDK is based on, is a unique
set of tools providing the methods for displaying 3D globe and other features related to
it. As the second most used virtual globe these days, with its open-source character and
well-developed SDK, it is undoubtedly the best choice for scientific community trying to
find new directions in the retrieval of geospatial information. Its API-centric architecture
allows World Wind Java to be easily integrated as a plug-in into a numerous of applications
and modified according to the developers’ needs.
It is true that the similar application, as being developed here, could be made more
easily in, for instance, Google Earth, by inputting the set of the points into the application
in a form of KML. This solution would be suitable for the user who wants to integrate the
mentioned sites to the virtual globe in the easiest way. For the purpose of future research,
however, it is vital to use development tools and thus explore the way how the data can
80

4. CONCLUSION AND DISCUSSION
be integrated rather than just wait for a solution provided by the commercial sector.
The future directions of this work are strongly connected with a fact that an author of
the thesis has been successfully admitted for PhD degree at Beihang University. Thus, he
sees this work as just a beginning and one the first steps how his PhD research topic could
be directed. Because of that, this application is just in its beta version and is not exactly
suited for the user yet. Besides Windows operating system, on which the application’s
development was undertaken, it has not been tested yet on any other operating system.
Another fact is, that the most of the data is stored locally on the disk, while the attributes
in the database contain the paths referring to this data. The reason for making such step
is that in the future there is expected the data modification and storing data locally is
thus a comfortable option how to access and update them easily. The development of the
application will continue in Eclipse environment similarly as until now and for the purpose
of this work, the project was converted into JAR file in order to provide an easier way of
running it than from the IDE itself. Similarly, the database wikiglobe was uploaded on
the remote server in order to be able to be accessed outside the author’s computer.
With the future research on the project, lot of plans are outlined. The author sees the
main problem in a small possibility of an interaction between the user and data. Because
of that he would like to create an additional window in which one would be able to save
the information about the desired site and input his own data into it as well. Moreover,
an icon-driven interface, which would be displayed right after the application’s loading,
providing a list of all the places, is another element that is about to be integrated.
To conclude, this work has fulfilled its requirements. Developing the application Great
Places WikiGlobe provided a platform for research on geovisualization methods and tech-
nology of the WikiGlobe system rather than offered a final solution for the possible user of
the application. In the later stage of its development, an emphasis will be put on merging
the research direction with user’s requirements, what could put a new, fresh air into this
problematics.
Michal Bodnar: Research on Geovisualization Methods and Technology forThe WikiGlobe System
81

BIBLIOGRAPHY
Bibliography
[1] Learning to think spatially: GIS as a support system in the K-12 Curriculum. United
States of America: National Academy of Sciences, 2006. ISBN 0-309-53191-8.
[2] BAYER, Tomas and Michal SCHNEIDER. Java pro geoinformatiky. Available on:
http://web.natur.cuni.cz/~bayertom/Prog1/java_rukopis.pdf.
[3] SIERRA, Kathy and Bert BATES. Head First Java: Your Brain on Java – A
Learner’s Guide. 2nd edition. O’Reilly.
[4] CEPEK, Ales. Zaklady SQL a databaze PostgreSQL: 153DASY. 269 p.
[5] TIME HOME ENTERTAINMENT. Great Places of History: Civilization’s 100 Most
Important Sites: An Illustrated Journey. New York: Time Books, 2011. ISBN 1-
60320-196-3.
[6] WIKIPEDIA [online]. [cit. 2012-11-02]. Available on: www.wikipedia.org.
[7] GORE, Al. The Digital Earth: Understanding our planet in the 21st Century. In: [on-
line]. [cit. 2012-11-12]. Available on: http://portal.opengeospatial.org/files/
?artifact_id=6210&version=1&format=htm.
[8] Complete Guide to World Wind Help Resources [online]. [cit. 2012-11-12]. Available
on: http://goworldwind.org/.
[9] KRAAK, Menno-Jan. Geovisualization illustrated. ISPRS Journal of Photogram-
metry & Remote Sensing [online]. 2002. [cit. 2012-11-13]. Available on: http:
//www.geog.ucsb.edu/~kclarke/G232/kraak.pdf.
[10] WANG, Xinuyan, Ruixia YANG, Yaping XU, Jiegui WANG and Heng CAI. ON GE-
OGRAPHICAL THOUGHT AND RESEARCH METHODS BASED ON DIGITAL
EARTH. [cit. 2012-11-13].
Michal Bodnar: Research on Geovisualization Methods and Technology forThe WikiGlobe System
82

BIBLIOGRAPHY
[11] MADDEN, M., H. ZHAO, T.R. JORDAN, M. BLANKENSHIP, J. MASOUR,
H. YANG and J.L. CORN. CONTEXT-AWARE ANALYSIS, GEOVISUALIZA-
TION AND VIRTUAL GLOBES FOR MANAGING EARTH RESOURCES. 8
p. Available on: http://www.isprs.org/proceedings/XXXVIII/4-W10/papers/
VCGVA2009_06614_Madden.pdf.
[12] DEMSAR, Urska. Data mining of geospatial data: combining visual and auto-
matic methods. Stockholm, 2006. ISBN 91-7178-297-4. Available on: http://www.
dissertations.se/dissertation/12c590e5c8/. Doctoral thesis. KTH Stockholm.
Thesis supervisor Doc. Hans Hauska.
[13] BELL, David G., Frank KUEHNEL, Chris MAXWELL, Randy KIM, Kushyar KAS-
RAIE, Tom GASKINS, Patrick HOGAN and Joe COUGHLAN. NASA World Wind:
Opensource GIS for Mission Operations. IEEEAC [online]. 2006, n. 1048, p. 9 [cit.
2013-04-24].
[14] ANNONI, A., M. CRAGLIA, M. EHLERS, Y. GEORGIADOU, A. GIACOMELLI,
M. KONECNY, N. OSTLAENDER, G. REMETEY-FULOPP, D. RHIND, P. SMITS
and S. SCHADE. A European perspective on Digital Earth. International Journal of
Digital Earth [online]. 2011, n. 4, p. 13 [cit. 2013-04-24]. ISSN 1753-8947.
[15] SHUPENG, C. and J. VAN GENDEREN. Digital Earth in support of global change
research. International Journal of Digital Earth [online]. 2008 [cit. 2013-04-24]. ISSN
1753-8947.
[16] GUO, H.D, Z. LIU a L.W. ZHU. Digital Earth: decadal experiences and some
thoughts. International Journal of Digital Earth [online]. 2010 [cit. 2013-04-24]. ISSN
1753-8947.
[17] CRAGLIA, Max, Kees DE BIE, Davina JACKSON, Martino PESARESI, Gabor
REMETEY-FULOPP, Changlin WANG, Alessandro ANNONI, Ling BIAN, Fred
CAMPBELL, Manfred EHLERS, John VAN GENDEREN, Michael GOODCHILD,
Huadong GUO, Anthony LEWIS, Richard SIMPSON, Andrew SKIDMORE and
Peter WOODGATE. Digital Earth 2020: towards the vision for the next decade.
International Journal of Digital Earth [online]. 2012, n. 1 [cit. 2013-04-24]. ISSN
1753-8947.
Michal Bodnar: Research on Geovisualization Methods and Technology forThe WikiGlobe System
83
BIBLIOGRAPHY
[18] FORESMAN, T.W. Evolution and implementation of the Digital Earth vision, tech-
nology and society. International Journal of Digital Earth [online]. 2008, n. 1 [cit.
2013-04-24]. ISSN 1753-8947.
[19] HARVEY, Francis. More than Names - Digital Earth and/or Virtual Globes?: Com-
mentary on Next Generation Digital Earth. International Journal of Spatial Data
Infrastractures Research [online]. 2009 [cit. 2013-04-24].
[20] GROSSNER, Karl E. a Keith C CLARKE. Is Google Earth, ”Digital Earth?” -
Defining a Vision.
[21] WU, Lun a QingXi TONG. Framework and development of digital China. Science
in China Series E: Technological Sciences [online]. 2008 [cit. 2013-04-24]. ISSN 1006-
9321.
[22] GONG, JianYa, LongGang XIANG, Jing CHEN a Peng YUE. Multi-source geospatial
information integration and sharing in Virtual Globes. Science China: Technological
Sciences [online]. 2010 [cit. 2013-04-24].
[23] COMMITTEE ON STRATEGIC DIRECTIONS FOR THE GEOGRAPHICAL SCI-
ENCES IN THE NEXT DECADE. Understanding the Changing Planet: Strate-
gic Directions for Geographical Sciences [online]. [cit. 2013-05-06]. ISBN 978-0-309–
15075-0.
[24] STEERING COMMITTEE ON NEW RESEARCH DIRECTIONS FOR THE NA-
TIONAL GEOSPATIAL-INTELLIGENCE AGENCY. New Research Directions for
the National Geospatial-Intelligence Agency: Workshop report. 70 p. ISBN 978-0-309-
15865-7.
[25] SEARS, Russell, Catharine VAN INGEN a Jim GRAY. To BLOB or Not To
BLOB: Large Object Storage in a Database or a Filesystem?. Microsoft Research
[online]. 2006 [cit. 2013-05-14]. Available on: http://research.microsoft.com/
pubs/64525/tr-2006-45.pdf.
[26] ISDE 7 - International Symposium on Digital Earth. HASTAC: Hu-
manities, Arts, Science, And Technology Advanced Collaboratory [on-
line]. [cit. 2013-04-27]. Available on: http://hastac.org/events/
isde-7-international-symposium-digital-earth.
Michal Bodnar: Research on Geovisualization Methods and Technology forThe WikiGlobe System
84

BIBLIOGRAPHY
[27] Digital Earth vision. ISDE: International Society for Digital Earth [online]. [cit. 2013-
04-27]. Available on: http://www.digitalearth-isde.org/society/56.
[28] 2006 Digital Earth Summit. ISDE: International Society for Digital Earth [online].
[cit. 2013-04-27]. Available on: http://digitalearth-isde.org/ssw/146.
[29] 2008 Digital Earth Summit. ISDE: International Society for Digital Earth [online].
[cit. 2013-04-27]. Available on: http://digitalearth-isde.org/ssw/145.
[30] 2010 Digital Earth Summit. ISDE: International Society for Digital Earth [online].
[cit. 2013-04-27]. Available on: http://digitalearth-isde.org/ssw/144.
[31] 2012 Digital Earth Summit. ISDE: International Society for Digital Earth [online].
[cit. 2013-04-27]. Available on: http://digitalearth-isde.org/ssw/143.
[32] MOLON, Alfred. Photo Galleries [online]. [cit. 2013-05-14]. Available on: http:
//www.molon.de/.
[33] Java Integrated Development Environments (IDEs) and Editors. Java Program-
ming Resources [online]. [cit. 2013-05-14]. Available on: http://www.apl.jhu.edu/
~hall/java/IDEs.html#Java-Editors.
[34] ArcGIS Explorer Desktop: Broaden the Reach of Your Spatial Information. ESRI:
Understanding our world [online]. [cit. 2013-04-28]. Available on: http://www.esri.
com/software/arcgis/explorer.
[35] Cesium: WebGL Virtual Globe and Map Engine [online]. [cit. 2013-04-28]. Available
on: http://cesium.agi.com/.
[36] Earthbrowser for Desktop [online]. [cit. 2013-04-28]. Available on: http://www.
earthbrowser.com/.
[37] Earth 3D [online]. [cit. 2013-04-28]. Available on: http://www.earth3d.org/.
[38] Software of the Year Award: World Wind Java. [online]. [cit. 2013-05-01]. Available
on: http://www.nasa.gov/offices/oce/appel/ask-academy/issues/volume2/
AA_2-12_SF_soya.html.
[39] NASA. NASA World Wind [online]. [cit. 2013-05-01]. Available on: http://
worldwind.arc.nasa.gov/java/.
Michal Bodnar: Research on Geovisualization Methods and Technology forThe WikiGlobe System
85
BIBLIOGRAPHY
[40] NASA.World Wind 1.4: Learning Technologies [online]. 2006 [cit. 2013-05-06]. Avail-
able on: http://worldwind.arc.nasa.gov/index.html.
[41] Global Change Master Directory: Scientific Visualization Studio Image Server.
NASA. Goddar Space Flight Center [online]. [cit. 2013-05-07]. Available
on: http://gcmd.nasa.gov/KeywordSearch/Metadata.do?Portal=GCMD_
Services&KeywordPath=ServiceParameters%7CMETADATA+HANDLING%7CSERVICE+
DISCOVERY&EntryId=SVS_IMAGE_SERVER&MetadataView=Full&MetadataType=
1&lbnode=mdlb2.
[42] World Wind Central [online]. [cit. 2013-05-01]. Available on: http://www.
worldwindcentral.com/wiki/Main_Page.
[43] Interview with Patrick Hogan WWJ Project Manager. In: MURRIS, Patrick. Patrick
Murris: PHOTOGRAPHIE, STEREOSCOPIE, SCIENCE, 3D, NASA WORLD
WIND [online]. [cit. 2013-05-05]. Available on: http://patmurris.blogspot.com/
2009/01/interview-with-patrick-hogan-wwj.html
[44] Patrick Hogan, NASA Worl Wind. In: A blog forum to provide deep dive anal-
ysis and community conversations about software development models. [online].
[cit. 2013-05-05]. Available on: http://howsoftwareisbuilt.com/2007/07/14/
patrick-hogan/.
[45] JIDE SOFTWARE. JIDE Docking Frameworkd Developer Guide. Available
on: http://www.jidesoft.com/products/JIDE_Docking_Framework_Developer_
Guide.pdf.
[46] Dockable Window. ESRI Developer Network [online]. [cit. 2013-05-15]. Ava-
iable on: http://edndoc.esri.com/arcobjects/8.3/Samples/Application%
20Framework/Dockable%20Window/DOCKABLEWINDOW.htm
[47] KARICH, Peter. VL Docking and other window docking managers for
Java. Karussell: Thoughts about Java and more [online]. [cit. 2013-
05-15]. Available on: http://karussell.wordpress.com/2009/10/12/
vl-docking-and-other-window-docking-managers-for-java/.
Michal Bodnar: Research on Geovisualization Methods and Technology forThe WikiGlobe System
86

BIBLIOGRAPHY
[48] SIGG, Bejamin. Docking Frames 1.1.1 - Core. Docking Frames [online]. 2012, s. 78
[cit. 2013-05-15]. Available on: http://dock.javaforge.com/dockingFrames_v1.
1.1/core.pdf.
[49] SIGG, Bejamin. Docking Frames 1.1.1 - Common. Docking Frames [online]. 2012, s.
78 [cit. 2013-05-15]. Available on: http://dock.javaforge.com/dockingFrames_
v1.1.1/common.pdf.
[50] Features and Future. Docking Frames [online]. 2001 [cit. 2013-05-15]. Available on:
http://dock.javaforge.com/features.html.
[51] W3schools.com: the world’s largest web development site [online]. 1999 [cit. 2013-05-
22]. Available on: http://www.w3schools.com/.
[52] BARELYFITZ DESIGNS. BarelyFitzDesigns.: Web-standard solutions for a non-
standard world. [online]. 2006 [cit. 2013-05-22]. Available on: http://www.
barelyfitz.com/projects/tabber/.
Michal Bodnar: Research on Geovisualization Methods and Technology forThe WikiGlobe System
87
LIST OF FIGURES
List of Figures
1.1 Former US vice-president Al Gore. . . . . . . . . . . . . . . . . . . . . . . 4
1.2 First international showing of EarthviewerR©
geobrowser in Nairobi, Kenya
2001. . . . . . . . . . . . . . . . . . . . . . . . . . . . . . . . . . . . . . . . 8
1.3 A logo of ISDE. . . . . . . . . . . . . . . . . . . . . . . . . . . . . . . . . . 11
1.4 A cover of IJDE. . . . . . . . . . . . . . . . . . . . . . . . . . . . . . . . . 12
1.5 Microsoft Virtual 3D. . . . . . . . . . . . . . . . . . . . . . . . . . . . . . . 14
1.6 ArcGIS Explorer. . . . . . . . . . . . . . . . . . . . . . . . . . . . . . . . . 15
1.7 Google Earth. . . . . . . . . . . . . . . . . . . . . . . . . . . . . . . . . . . 16
1.8 CitySurf Globe. . . . . . . . . . . . . . . . . . . . . . . . . . . . . . . . . . 17
1.9 Bing Maps 3D. . . . . . . . . . . . . . . . . . . . . . . . . . . . . . . . . . 18
1.10 Worldwide Telescope. . . . . . . . . . . . . . . . . . . . . . . . . . . . . . . 18
1.11 Marble. . . . . . . . . . . . . . . . . . . . . . . . . . . . . . . . . . . . . . 19
1.12 OpenWebGlobe. . . . . . . . . . . . . . . . . . . . . . . . . . . . . . . . . . 20
1.13 Cesium. . . . . . . . . . . . . . . . . . . . . . . . . . . . . . . . . . . . . . 21
1.14 EarthBrowser. . . . . . . . . . . . . . . . . . . . . . . . . . . . . . . . . . . 22
1.15 Earth3D. . . . . . . . . . . . . . . . . . . . . . . . . . . . . . . . . . . . . . 23
1.16 Bhuvan 3D. . . . . . . . . . . . . . . . . . . . . . . . . . . . . . . . . . . . 23
1.17 WorldWind.NET. . . . . . . . . . . . . . . . . . . . . . . . . . . . . . . . . 25
1.18 Client-server architecture. . . . . . . . . . . . . . . . . . . . . . . . . . . . 27
1.19 Tiled image of the Earth at Layer 0. . . . . . . . . . . . . . . . . . . . . . 28
1.20 Texture mapping at a global scale. . . . . . . . . . . . . . . . . . . . . . . 28
1.21 Texture mapping at a local scale. . . . . . . . . . . . . . . . . . . . . . . . 29
1.22 Blue Marble Next Generation imagery. . . . . . . . . . . . . . . . . . . . . 31
1.23 I-cubed at its highest resolution. . . . . . . . . . . . . . . . . . . . . . . . . 32
1.24 NLT Visible at its highest resolution. . . . . . . . . . . . . . . . . . . . . . 32
1.25 Geocover 2000 at its highest resolution. . . . . . . . . . . . . . . . . . . . . 33
Michal Bodnar: Research on Geovisualization Methods and Technology forThe WikiGlobe System
88

LIST OF FIGURES
1.26 OnEarth Visible at its highest resolution. . . . . . . . . . . . . . . . . . . . 33
1.27 ZoomIt! image of Miami. . . . . . . . . . . . . . . . . . . . . . . . . . . . . 34
1.28 Rapid Fire MODIS. . . . . . . . . . . . . . . . . . . . . . . . . . . . . . . . 35
1.29 GLOBE data for air temperature. . . . . . . . . . . . . . . . . . . . . . . . 36
1.30 NRL Real-time weather data. . . . . . . . . . . . . . . . . . . . . . . . . . 36
2.1 TIME HOME ENTERTAINMENT. Great Places of History: Civilization’s
100 Most Important Sites: An Illustrated Journey. . . . . . . . . . . . . . . 39
2.2 Logo of Java programming language. . . . . . . . . . . . . . . . . . . . . . 43
2.3 Java’s portability. . . . . . . . . . . . . . . . . . . . . . . . . . . . . . . . . 44
2.4 Creating an icon for the site City of Arts and Sciences. . . . . . . . . . . . 49
2.5 An example of menu bar. . . . . . . . . . . . . . . . . . . . . . . . . . . . . 51
2.6 An example of pull-down menu. . . . . . . . . . . . . . . . . . . . . . . . . 51
2.7 An example of toolbar. . . . . . . . . . . . . . . . . . . . . . . . . . . . . . 51
2.8 Design of GUI. . . . . . . . . . . . . . . . . . . . . . . . . . . . . . . . . . 52
2.9 A logo of Eclipse Helios. . . . . . . . . . . . . . . . . . . . . . . . . . . . . 53
2.10 A logo of phpMyAdmin. . . . . . . . . . . . . . . . . . . . . . . . . . . . . 54
2.11 Swing class hierarchy. . . . . . . . . . . . . . . . . . . . . . . . . . . . . . . 55
2.12 Basic components of Common library. . . . . . . . . . . . . . . . . . . . . . 57
2.13 A class hierarchy of 4 main windows - CDockables in the application. . . . 59
2.14 The concept of World Wind Java SDK. . . . . . . . . . . . . . . . . . . . . 61
2.15 Class hierarchy of WWXMLIconLayer. . . . . . . . . . . . . . . . . . . . . . . 65
2.16 Class hierarchy of Balloon. . . . . . . . . . . . . . . . . . . . . . . . . . . 68
2.17 A basic hierarchy of HTML elements. . . . . . . . . . . . . . . . . . . . . . 70
2.18 The process of creating an information window. . . . . . . . . . . . . . . . 72
3.1 A splash screen of the application. . . . . . . . . . . . . . . . . . . . . . . . 77
3.2 The main interface of the application. . . . . . . . . . . . . . . . . . . . . . 78
3.3 2D view in Mercator projection. . . . . . . . . . . . . . . . . . . . . . . . . 78
3.4 An information window about the site Delphi. . . . . . . . . . . . . . . . . 79
Michal Bodnar: Research on Geovisualization Methods and Technology forThe WikiGlobe System
89

LISTINGS
Listings
2.1 HelloWorld.java. . . . . . . . . . . . . . . . . . . . . . . . . . . . . . . . . . 44
2.2 Creating a table students. . . . . . . . . . . . . . . . . . . . . . . . . . . . 46
2.3 Inserting the data into the table students. . . . . . . . . . . . . . . . . . . 46
2.4 Creating main frame and other Swing components. . . . . . . . . . . . . . 58
2.5 Setting a layout of the application. . . . . . . . . . . . . . . . . . . . . . . 59
2.6 An extraction of HelloWorldWind.java. . . . . . . . . . . . . . . . . . . . 61
2.7 Initializing of World Wind components. . . . . . . . . . . . . . . . . . . . . 62
2.8 A retrieval of the layers. . . . . . . . . . . . . . . . . . . . . . . . . . . . . 64
2.9 Including the list of layers within LayerViewDockable window. . . . . . . . 64
2.10 Displaying 3D globe within EarthViewDockable window. . . . . . . . . . . 65
2.11 An extraction of GreatPlacesIcons.xml. . . . . . . . . . . . . . . . . . . 65
2.12 Incorporating GreatPlacesIcons.xml into the application. . . . . . . . . . 66
2.13 A configuration XML file config.xml. . . . . . . . . . . . . . . . . . . . . 67
2.14 An extraction of Balloons.java. . . . . . . . . . . . . . . . . . . . . . . . 68
2.15 A basic HTML with JS function implemented. . . . . . . . . . . . . . . . . 70
2.16 An implementaiton of a class ClickableIcon . . . . . . . . . . . . . . . . 72
2.17 A method getDatabaseAttribute(String name, String attribute). . 73
2.18 A class MyNodeVisitor. . . . . . . . . . . . . . . . . . . . . . . . . . . . . 74
2.19 A method getBalloonHTMlContent(String name). . . . . . . . . . . . . . 75
2.20 A method openPop(String name, Position pos). . . . . . . . . . . . . . 76
Michal Bodnar: Research on Geovisualization Methods and Technology forThe WikiGlobe System
90

LIST OF TABLES
List of Tables
1.1 Series of ISDE/DES events. . . . . . . . . . . . . . . . . . . . . . . . . . . 9
1.2 World Wind imagery for Earth. . . . . . . . . . . . . . . . . . . . . . . . . 30
1.3 World Wind extraterrestrial datasets. . . . . . . . . . . . . . . . . . . . . . 31
2.1 Sites by continent. . . . . . . . . . . . . . . . . . . . . . . . . . . . . . . . 41
2.2 Sites by continent. . . . . . . . . . . . . . . . . . . . . . . . . . . . . . . . 41
2.3 Relational database table schema students. . . . . . . . . . . . . . . . . . 46
2.4 Table greatplaces. . . . . . . . . . . . . . . . . . . . . . . . . . . . . . . . 48
C.1 Cultures’ sites. . . . . . . . . . . . . . . . . . . . . . . . . . . . . . . . . . 94
C.2 Innovation’s sites. . . . . . . . . . . . . . . . . . . . . . . . . . . . . . . . . 94
C.3 Society’ sites. . . . . . . . . . . . . . . . . . . . . . . . . . . . . . . . . . . 95
C.4 Politics’ sites. . . . . . . . . . . . . . . . . . . . . . . . . . . . . . . . . . . 95
C.5 Battles’ sites. . . . . . . . . . . . . . . . . . . . . . . . . . . . . . . . . . . 95
C.6 Arts’ sites. . . . . . . . . . . . . . . . . . . . . . . . . . . . . . . . . . . . . 95
C.7 Inquiry’s sites. . . . . . . . . . . . . . . . . . . . . . . . . . . . . . . . . . . 96
C.8 Civilizations’ sites. . . . . . . . . . . . . . . . . . . . . . . . . . . . . . . . 96
C.9 Religion’s sites. . . . . . . . . . . . . . . . . . . . . . . . . . . . . . . . . . 96
C.10 Cultures’ sites – countries and continents. . . . . . . . . . . . . . . . . . . 97
C.11 Religion’s sites – countries and continents. . . . . . . . . . . . . . . . . . . 97
C.12 Society’s sites – countries and continents. . . . . . . . . . . . . . . . . . . . 98
C.13 Politics’ sites – countries and continents. . . . . . . . . . . . . . . . . . . . 98
C.14 Civilizations’ sites – countries and continents. . . . . . . . . . . . . . . . . 99
C.15 Battles’ sites – countries and continents. . . . . . . . . . . . . . . . . . . . 99
C.16 Innovation’ sites – countries and continents. . . . . . . . . . . . . . . . . . 100
C.17 Arts’ sites – countries and continents. . . . . . . . . . . . . . . . . . . . . . 100
C.18 Inquiry’ sites – countries and continents. . . . . . . . . . . . . . . . . . . . 101
Michal Bodnar: Research on Geovisualization Methods and Technology forThe WikiGlobe System
91

A. CONTENT OF THE ATTACHED DVD
Appendix A
Content of the attached DVD
The attached DVD has following structure:
/-- thesis/
/-- text/
The folder thesis contains the source code of the application, together with the data
stored. The folder text contains the text of the thesis in pdf format as well as source
codes of the typesetting program LATEX, in which this text was typeset.
Michal Bodnar: Research on Geovisualization Methods and Technology forThe WikiGlobe System
92

B. APPLICATION’S GUIDE
Appendix B
Application’s guide
B.1 Application’s requirements
Following technology has to be accessed in order to run the application:
• Windows operating system;
• JRE 7 installed;
• JDK 7.0.01 (or any other higher subversion) installed;
• Adobe Shockwawe Player installed;
• 1.10 GB of free space on the disk C:;
• a connection to the internet.
B.2 Running the application
To run the application, first off, the user is required to copy the folder thesis from the
attached DVD into its C:\ directory such that the following path in his file system will
be created: C:\thesis. Then, he can run the application in two ways:
1. By running it from any IDE software (preferably Eclipse).
To perform that, import the folder eclipse ws stored in C:\thesis\100GreatP as
a project into the IDE. Then, two sub-projects will appear, Docking Frames and
test. Go to test\src\org\cnstar\wiki\app and run GreatPlaces.java file from
there.
Michal Bodnar: Research on Geovisualization Methods and Technology forThe WikiGlobe System
93

B. APPLICATION’S GUIDE
2. By running an executable jar file GreatPlaces.jar stored in the folder C:\the-sis\100GreatP\eclipse ws\test.
Michal Bodnar: Research on Geovisualization Methods and Technology forThe WikiGlobe System
94

C. TIME’S GREAT PLACES OF HISTORY
Appendix C
TIME’s Great Places of History
Cultures
Pyramid of Khufu and The Sphinx
Ayutthaya
Confucius Temple
The Acropolis
Machu Picchu
Kathmandu Valley
Imperial Rome
Easter Island
Nazca Lines
Ronda
Roskilde
Historic Damasqus
Historic Kyoto
St. Petersburg
Table C.1: Cultures’ sites.
Innovation
Segovia Aqueduct
Reims Cathedral
Chateau de Chenonceau
Imperial Vienna
Grand Place
Jefferson´s Virginia
Mountain Railways of India
Iron Bridge
Skyscrapers Of Chicago
Panama Canal
Brooklyn Bridge
Hoover Dam
Bauhaus School
City of Arts and Sciences
CCTV Headquarters
Burj Khalifa
Table C.2: Innovation’s sites.
Michal Bodnar: Research on Geovisualization Methods and Technology forThe WikiGlobe System
95

C. TIME’S GREAT PLACES OF HISTORY
Society
Olduvai Gorge
Mohenjo-Daro
Altamira Cave
Skara Brae
Avebury
Knossos
Persepolis
Olympia
Aachen Cathedral
Cahokia Mounds
Australian Penal Sites
Table C.3: Society’ sites.
Politics
The Forbidden City
Tikal
Red Square
Hill of Tara
Edinburgh Castle
Chateau de Fontainebleau
Revolutionary Philadelphia
Brandenburg Gate
Cape Coast Castle
Robben Island
Table C.4: Politics’ sites.
Battles
Masada
The Plains of Abraham
Concord Bridge
Gettysburg
Trenches of World War I
Pearl Harbor
Normandy beaches
Hiroshima
Auschwitz
Table C.5: Battles’ sites.
Arts
Renaissance Florence
Mozart’s Salzburg
Shakespeare’s Globe
Dickens’ London
The Strausses’ Vienna
Wagner’s Bayreuth
Yasnaya Polyana
Monet’s Garden
Burning Man
Table C.6: Arts’ sites.
Michal Bodnar: Research on Geovisualization Methods and Technology forThe WikiGlobe System
96

C. TIME’S GREAT PLACES OF HISTORY
Inquiry
Medina of Fez
Jagiellonian University
Mosques of Timbuktu
Royal Observatory
Bodleian Library
Royal Botanic Gardens
Galapagos Islands
Lowell Observatory
Svalbard Global Seed Vault
McMurdo Station
Table C.7: Inquiry’s sites.
Civilizations
Hadrian’s Wall
The Great Mosque of Cordoba
Historic Istanbul
The Silk Road
The Great Wall of China
Lindisfarne
Crac des Chevaliers
L´Anse aux Meadows
The Ghetto, Venice
Mostar Bridge
Table C.8: Civilizations’ sites.
Religion
Lalibela
Temple Mount
Mecca
Delphi
Historic Cairo
Angkor Wat
Vatican City
Potala Palace
Santiago de Compostela
The Golden Temple
Varanasi
Table C.9: Religion’s sites.
Michal Bodnar: Research on Geovisualization Methods and Technology forThe WikiGlobe System
97

C. TIME’S GREAT PLACES OF HISTORY
Cultures
Sites by country Sites by continent
Country Number of sites Continent Number of sites
Peru 2 Europe 5
Russia 1 Asia 5
Egypt 1 South America 3
Thailand 1 Africa 1
China 1
Greece 1
Nepal 1
Chile 1
Italy 1
Spain 1
Denmark 1
Syria 1
Japan 1
Table C.10: Cultures’ sites – countries and continents.
Religion
Sites by country Sites by continent
Country Number of sites Continent Number of sites
India 2 Asia 6
Spain 1 Europe 3
China 1 Africa 2
Italy 1
Cambodia 1
Egypt 1
Greece 1
Saudi Arabia 1
Israel 1
Ethiopia 1
Table C.11: Religion’s sites – countries and continents.
Michal Bodnar: Research on Geovisualization Methods and Technology forThe WikiGlobe System
98

C. TIME’S GREAT PLACES OF HISTORY
Society
Sites by country Sites by continent
Country Number of sites Continent Number of sites
Greece 2 Europe 6
Pakistan 1 Asia 2
Spain 1 Africa 1
Scotland 1 North America 1
England 1 Australia 1
Iran 1
Germany 1
United States of America 1
Australia 1
Table C.12: Society’s sites – countries and continents.
Politics
Sites by country Sites by continent
Country Number of sites Continent Number of sites
China 1 Europe 5
Guatemala 1 North America 2
Russia 1 Africa 2
Ireland 1 Asia 1
Scotland 1
France 1
United States of America 1
Germany 1
Ghana 1
South Africa 1
Table C.13: Politics’ sites – countries and continents.
Michal Bodnar: Research on Geovisualization Methods and Technology forThe WikiGlobe System
99

C. TIME’S GREAT PLACES OF HISTORY
Civilizations
Sites by country Sites by continent
Country Number of sites Continent Number of sites
England 2 Europe 6
China 2 Asia 3
Turkey 1 North America 1
Canada 1
Italy 1
Syria 1
Bosnia and Herzegovina 1
Spain 1
Table C.14: Civilizations’ sites – countries and continents.
Battles
Sites by country Sites by continent
Country Number of sites Continent Number of sites
United States of America 3 North America 4
Canada 1 Europe 3
France 1 Asia 2
Japan 1
Israel 1
Belgium 1
Germany 1
Table C.15: Battles’ sites – countries and continents.
Michal Bodnar: Research on Geovisualization Methods and Technology forThe WikiGlobe System
100

C. TIME’S GREAT PLACES OF HISTORY
Innovation
Sites by country Sites by continent
Country Number of sites Continent Number of sites
United States of America 5 Europe 8
France 2 North America 5
Spain 2 Asia 3
Panama 1
Germany 1
India 1
Austria 1
Belgium 1
United Arab Emirates 1
China 1
Table C.16: Innovation’ sites – countries and continents.
Arts
Sites by country Sites by continent
Country Number of sites Continent Number of sites
Austria 2 Europe 8
England 2 North America 1
Italy 1
France 1
Russia 1
Germany 1
United States of America 1
Table C.17: Arts’ sites – countries and continents.
Michal Bodnar: Research on Geovisualization Methods and Technology forThe WikiGlobe System
101

C. TIME’S GREAT PLACES OF HISTORY
Inquiry
Sites by country Sites by continent
Country Number of sites Continent Number of sites
England 3 Europe 5
Ecuador 1 Africa 2
Norway 1 South America 1
Morocco 1 North America 1
Mali 1 Antarctica 1
Poland 1
Antarctica 1
Table C.18: Inquiry’ sites – countries and continents.
Michal Bodnar: Research on Geovisualization Methods and Technology forThe WikiGlobe System
102