CZECH TECHNICAL UNIVERSITY FACULTY OF MECHANICAL …
64
AMIR MOHAMED AMIR ELHOSINY IBRAHIM CZECH TECHNICAL UNIVERSITY IN PRAGUE FACULTY OF MECHANICAL ENGINEERING GRADUATE THESIS 2018
Transcript of CZECH TECHNICAL UNIVERSITY FACULTY OF MECHANICAL …

AMIR MOHAMED AMIR ELHOSINY IBRAHIM
CZECH TECHNICAL
UNIVERSITY
IN PRAGUE FACULTY OF MECHANICAL ENGINEERING
GRADUATE THESIS 2018

1
IdeclarethatIworkoutthediploma(bachelor)thesisonmyownunderasupervisionofthesupervisorofthethesisandIcitedallthematerialsandliteraturewhichIusedinthework.InPrague……………… ………………… NameandSurname

2

3
Annotation sheet
Name: Amir Mohamed Amir Surname: Elhosiny Ibrahim Title Czech: Prikonocé charakteristiky míchadel Title English: Power Characteristics of impellers Scope of work: number of pages: 64
number of figures: 56
number of tables: 8
number of appendices:1
Academic year:2017/2018 Language: English Department:Process Engineering Specialization : Power and Process Technology Supervisor: Jiri Moravec Reviewer: Tutor: Submitter: : Czech Technical University Prague Faculty of Mechanical Engineering Department of process. Annotation - Czech: Práce se zabývá experimentálním stanovením příkonových charakteristik mechanicky míchané nádoby s centrálním míchadlem a to pro různé typy míchadel, různá geometrická uspořádání míchaného systému a pro dvě různé kapaliny, vodu a glycerin. Annotation - English: The thesis deals to experimentally evaluate power number dependence on Reynolds number for mechanically agitated systems with central mixing systems without baffles for various types of impellers, their geometrical set-up and for two different liquids, i.e. water and glycerine. Keywords: Impellers; Mixing performance; Stirred vessel, Renolad Number, power number, Viscosity. Utilization: Design of power for mixing equipment with the researched geometrical set-up.

4
Table of contents
Table of contents ..................................................................................................... 4
Abstract ................................................................................................................... 6
Introduction .............................................................................................................. 7
Part 1: Literature review .......................................................................................... 9
1. Mixing Equipment ..................................................................................... 10
Baffles ............................................................................................................ 10
Stirrer shaft ..................................................................................................... 11
Impellers ......................................................................................................... 12
2. Mechanism of Mixing ............................................................................... 14
3. Flow Patterns in Agitated Tanks .............................................................. 15
4. Power Requirements for Mixing ............................................................... 16
5. Assessing Mixing Effectiveness ............................................................... 21
6. Effect of Rheological Properties on Mixing .............................................. 22
7. Improving Mixing ...................................................................................... 22
Part 2: Experiments ............................................................................................... 25
1. Methods and Equipment .......................................................................... 25
Vessels ........................................................................................................... 26
Impellers ......................................................................................................... 27
Viscometer ..................................................................................................... 29
2. The torque measurements ....................................................................... 30
3. Viscosity and temperature tables ............................................................. 33
Part 3: Results and discussion of practical part .................................................... 34
Part 4: Conclusion ................................................................................................. 57
Lists ....................................................................................................................... 58
5
1. Table of Symbols ..................................................................................... 58
2. List of figures ............................................................................................ 58
3. List of tables ............................................................................................. 61
References ............................................................................................................ 62

6
Abstract Liquid-liquid mixing is a key procedure to industries that is usually trying to
accomplish mechanical agitation system. Liquid-liquid mixing execution done in
mixed tank can be assessed Eventually tested for Different parameters, in
particular base minimum fomentation speed, blending time, power consumption,
circulation time, interfacial area. The vitality from claiming these liquid-liquid
blending parameters, the estimation method will be discussed briefly. Enter
parameters for example, impeller type, control number, stream pattern, number of
impellers, furthermore scattered stage volume fraction, furthermore will physical
properties about stages for example, such that viscosity and density, need aid
reviewed. The correlation of Reylonld's number and power number and its effect
on the system and the mixing process is mentioned in details in this paper.

7
Introduction
Mixing is very important in many industrial applications. It is physical operation in
which there is a heterogeneous physical system and the intent is to make it more
homogenous. The physical operation of mixing is essential for the success of a bio
process. Mixing has a direct effect on mass and heat transfer, which are two key
thermodynamic parameters. The equipment that we use to mix affects the
agitation efficiency, power requirements, and operating costs.
Bad mixing would result in:
1. pH gradients
2. Temperature gradients
3. Compartmentalization
4. Nutrient gradients
5. Poor parameter control
In industrial mixing applications power consumption per unit volume is widely used
for scale up, scale down and design. Although it’s widely used, we can just define
the dependence of power consumption on Impeller and tank geometry only in the
most general terms. This is because it’s hard sometimes to obtain accurate torque
measurements on small scales.
Homogeneity and uniformity of the system is improved by one key process called
mixing, and this mixing occurs when materials tend to move from one side to
another in the vessel. (Rushton, 1956. The system is referred to as uniform based
on gradient of properties such as concentration, viscosity, temperature (Paul et al.,
2004). There are three main mixing operations gas-liquid, solid-liquid, and liquid-
liquid mixing. Liquid-liquid mixing plays an important role in producing and
increasing essential interfacial area to improve mass and heat transfer between
phases (Paul et al., 2004). And according to van de Vusse, Liquid-liquid mixing is
divided into miscible and immiscible liquid-liquid mixing. The term ‘‘blending’’ is
used to describe miscible liquid mixing, while the term ‘‘mixing’’ is used for
dispersions of immiscible liquids or the formation of emulsions (Rushton, 1956).
The dispersion of immiscible liquids is used to mix water and hydrocarbons and

8
acidic or alkaline solutions combined with organic liquids, and produce various
types of emulsion products. Also, according to Paul,. Liquid-liquid mixing is
applicable for special process objectives such as solvent extraction and removal or
addition of heat. Generally, blending of miscible liquids happens slowly by
molecular diffusion and natural convection. Thus, agitation systems can apply
forced convection to obtain homogeneity more rapidly (Rushton, 1956). Tanks and
vessels are the most accessible and universal equipment used in a wide range of
process industries such as esterification and hydrolysis (Paul et al., 2004).
Furthermore, inadequate understanding of mixing could result in undesirable
product quality and increased production costs. Nevertheless, it is possible to
waste large amounts of input energy through inappropriate system selection
(Holland and Bragg, 1995). Mixing operations are often complex. They not only
require understanding the fluid flow aspects, but also consideration of the
mechanical equipment and power requirements.
9
Part 1: Literature review
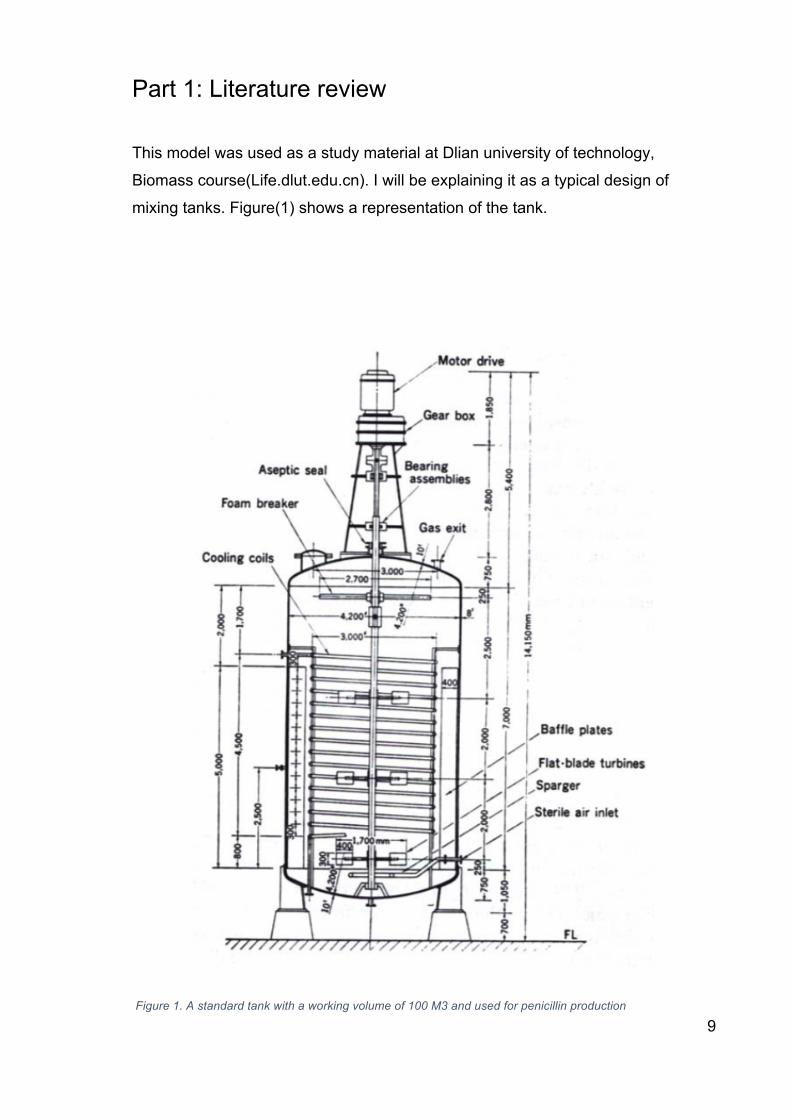
This model was used as a study material at Dlian university of technology,
Biomass course(Life.dlut.edu.cn). I will be explaining it as a typical design of
mixing tanks. Figure(1) shows a representation of the tank.
Figure 1. A standard tank with a working volume of 100 M3 and used for penicillin production
10
1. Mixing Equipment
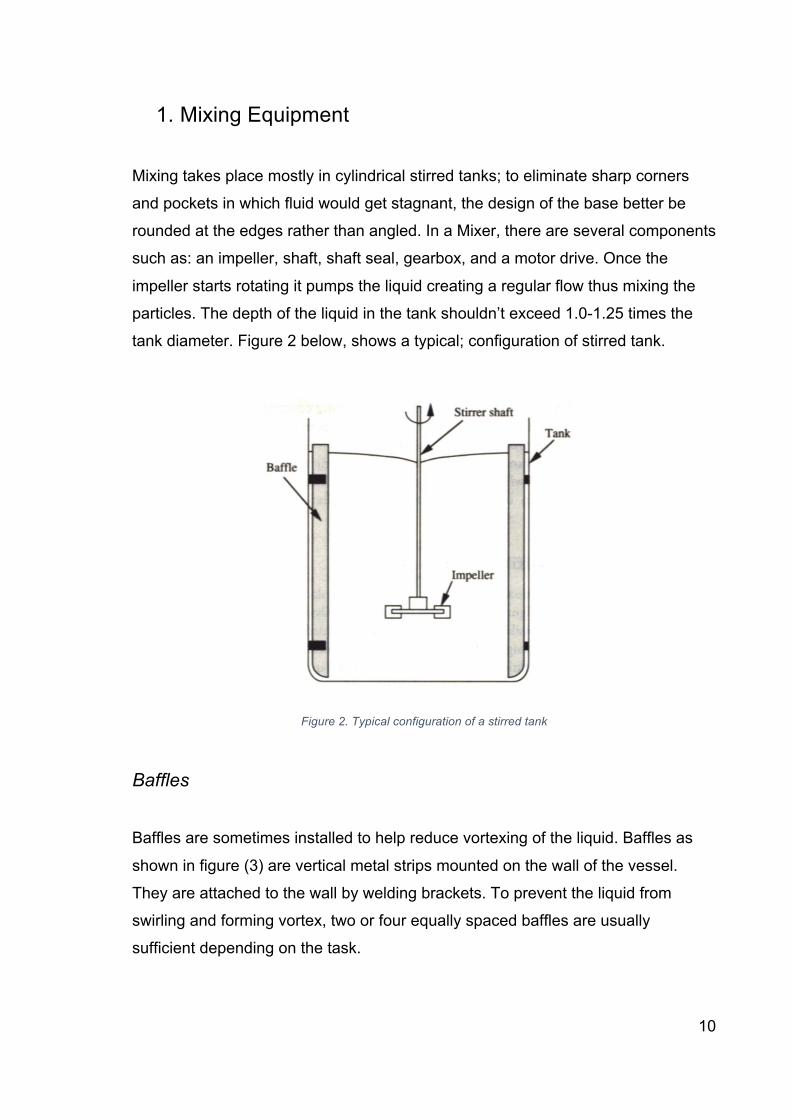
Mixing takes place mostly in cylindrical stirred tanks; to eliminate sharp corners
and pockets in which fluid would get stagnant, the design of the base better be
rounded at the edges rather than angled. In a Mixer, there are several components
such as: an impeller, shaft, shaft seal, gearbox, and a motor drive. Once the
impeller starts rotating it pumps the liquid creating a regular flow thus mixing the
particles. The depth of the liquid in the tank shouldn’t exceed 1.0-1.25 times the
tank diameter. Figure 2 below, shows a typical; configuration of stirred tank.
Figure 2. Typical configuration of a stirred tank
Baffles
Baffles are sometimes installed to help reduce vortexing of the liquid. Baffles as
shown in figure (3) are vertical metal strips mounted on the wall of the vessel.
They are attached to the wall by welding brackets. To prevent the liquid from
swirling and forming vortex, two or four equally spaced baffles are usually
sufficient depending on the task.

11
Figure 3. Baffle arrangements.
Stirrer shaft
The main function of the stirring shaft is to transmit the torque from the stirrer
motor to the impeller; It also have more mechanical functions like resisting the
bending force that is created by the impeller, limit lateral deflections and support
the weight of the impeller. All these functions must be reached with the least
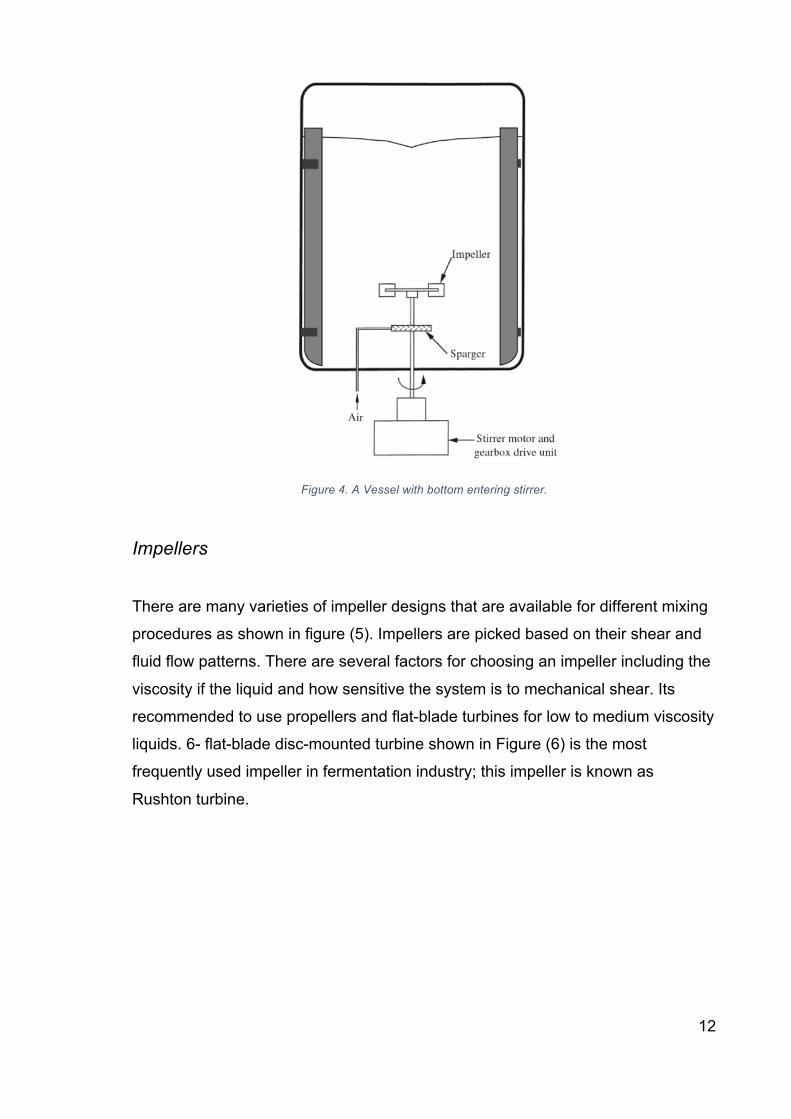
vibration. Typically, the stirring shaft shown in (figure 4) passes through a motor
that is placed on the top of the vessel but in some cases when mixing viscous
fluids, the shaft is designed to enter through the base of the vessel to alleviate
mechanical stresses. The main disadvantage of bottom entering stirrers is that
there is a risk of fluid leaks due to failure of wearing of the seals.
12
Figure 4. A Vessel with bottom entering stirrer.
Impellers
There are many varieties of impeller designs that are available for different mixing
procedures as shown in figure (5). Impellers are picked based on their shear and
fluid flow patterns. There are several factors for choosing an impeller including the
viscosity if the liquid and how sensitive the system is to mechanical shear. Its
recommended to use propellers and flat-blade turbines for low to medium viscosity
liquids. 6- flat-blade disc-mounted turbine shown in Figure (6) is the most
frequently used impeller in fermentation industry; this impeller is known as
Rushton turbine.

13
Figure 5. Impeller designs.
Figure 6.Viscosity ranges for different impellers.

14
2. Mechanism of Mixing
Poor performance in mixing can be caused different factors. One of them is large
liquid circulation loops. For mixing to be successful, fluid coursed by the impeller
must sweep the whole vessel in a sensible time. What's more, the speed of liquid
leaving the impeller must be adequate to convey material into the most remote
parts of the tank. Turbulence should likewise be produced in the fluid; Mixing is
sure to be poor unless there is a turbulent stream in the vessel. These are the
essential factors in blending, which can be portrayed as a mix of three physical
procedures: circulation, scattering and dissemination.
Distribution is the procedure whereby materials are transported to all locales of the
vessel by bulk circulation currents. In mixing, distribution is really important,
however it can be moderately slow. The size of the circulation flows is big in large
tanks and the time taken to cross them is long; this and how regular the fluid
pumping at the impeller hinders quick mixing. Therefore, distribution is the slowest
step in mixing.
But if the rotational speed of the impeller is adequately high, turbulence is
superimposed on the process of distribution. Turbulence stream happens when
the fluid stops traveling along streamlines but moves inconsistently in cross
currents.
15
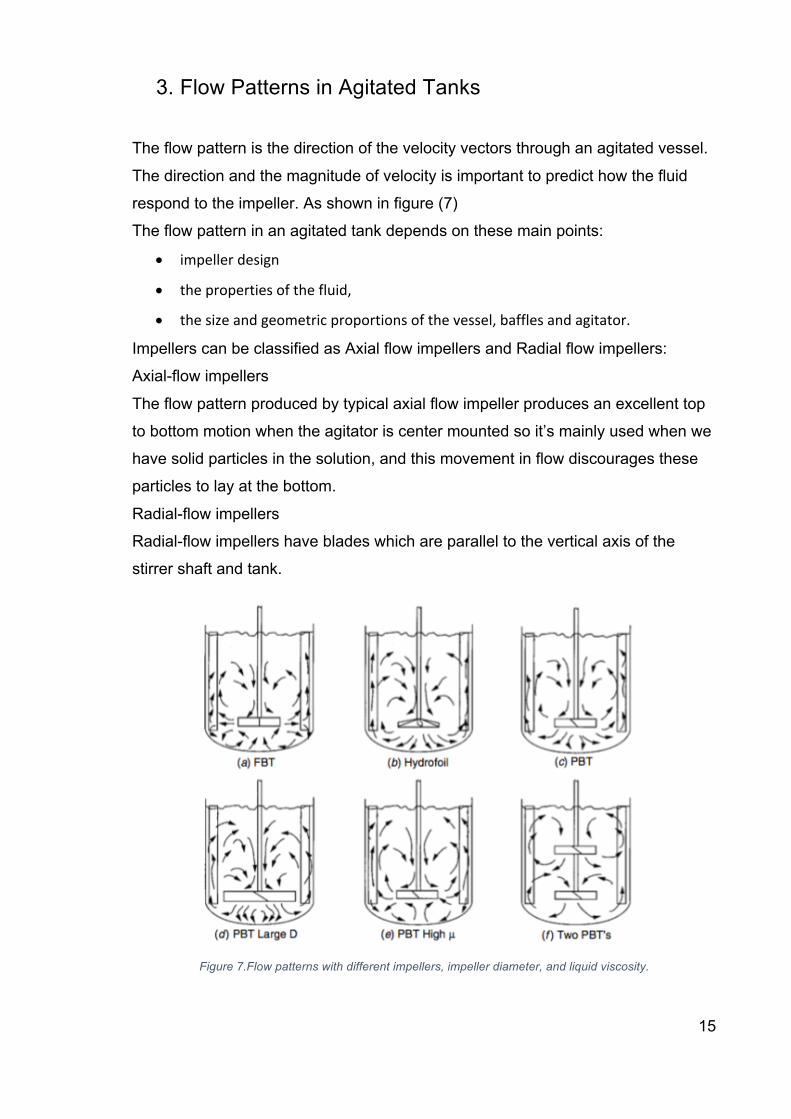
3. Flow Patterns in Agitated Tanks
The flow pattern is the direction of the velocity vectors through an agitated vessel.
The direction and the magnitude of velocity is important to predict how the fluid
respond to the impeller. As shown in figure (7)
The flow pattern in an agitated tank depends on these main points:
• impellerdesign
• thepropertiesofthefluid,
• thesizeandgeometricproportionsofthevessel,bafflesandagitator.
Impellers can be classified as Axial flow impellers and Radial flow impellers:
Axial-flow impellers
The flow pattern produced by typical axial flow impeller produces an excellent top
to bottom motion when the agitator is center mounted so it’s mainly used when we
have solid particles in the solution, and this movement in flow discourages these
particles to lay at the bottom.
Radial-flow impellers
Radial-flow impellers have blades which are parallel to the vertical axis of the
stirrer shaft and tank.
Figure 7.Flow patterns with different impellers, impeller diameter, and liquid viscosity.

16
Circular flow of liquid around the shaft is disadvantageous because sometimes
when the impeller speed is high the vortex reaches the impeller allowing
surrounding gas to be drawn into the fluid adding a lot of stress on the stirring
shaft and the bearings. To avoid this, we usually introduce baffles which interrupts
this circular flow and creates turbulence. This holds for both axial and radial
impellers.
4. Power Requirements for Mixing
The earliest studies we have on power consumptions date back to the beginnings
of the 1940s; The study by Rushton et al. is yet considered the first definitive in the
field. Rushton et al. used dimensional analysis to develop several dimensionless
groups, one of them is the Power Number Np
The power that is consumed by an agitator mainly depends on the stirrer speed,
the geometry of the vessel and the impeller, and the physical properties of the fluid
such as density and viscosity. The power required for a given stirrer speed
depends on the resistance of the fluid to rotation speed of the impeller. The
relationship between these variable is often expressed in dimensionless number
such as the impeller Reynolds number (Re) and the power number (Np).The
Equations are shown bellow. The electric power consumed by the motor is greater
than the mixing power by an amount that depends on the efficiency. This is mainly
happening because there is always friction in the stirrer motor gear box and the
seals which reduces the amount of energy transmitted to the fluid.
𝑃 = 2 ∗ 𝜋 ∗ 𝑁𝑖 ∗ 𝑀……..(1)
𝑅𝑒 = +,∗-.∗/0
……………(2)
𝑁𝑝 = 2/∗+,3∗-,4
………….(3)
Equations 1, 2 and 3

17
Processes in mixers occur either under laminar or turbulent flow conditions; It
depends on the Reynolds number of the impeller. process is laminar For Reynolds
numbers below about 10; At Reynolds numbers higher than about 104 , fully
turbulent conditions are achieved, and between these 2 regimes the flow is
transitional. Figures (8,9, and 10) relates impeller size, power number, and
Reynold number.

18
Figure 8. Correlation between power number and Reynolds number for Rushton turbine, paddle and marine propeller without sparging

19
Figure 9. Correlation between power number and Reynolds number for anchor and helical-ribbon impeller without sparging

20
Figure 10. Power number versus impeller Reynolds number for seven different impellers. (Modified from Rushton et al., 1950.)

21
5. Assessing Mixing Effectiveness
Mixing time is a helpful parameter for evaluating efficiency of mixing and is applied
to portray bulk stream in fermenters. The mixing time tm is the time required to
accomplish a given level of homogeneity beginning from the totally segregated
state. It can be aquired by infusing a tracer into the vessel and following its focus
at a settled point in the tank. Tracers in like manner utilize acids, bases and salt
solutions (concentrated);detectors are pH probs and conductivity cells. Mixing
time can likewise be dicta. Concentration response after tracer is injected into a
stirred tank is shown in figure(11).
Figure 11. Concentration response after tracer is injected into a stirred tank
22
6. Effect of Rheological Properties on Mixing
For mixing to be effective turbulent conditions should be achieved. Impeller’s
Reynolds number represents how intense the turbulence is; Once it falls bellow
criteria the turbulence is damped and therefore mixing time increases in a
significant way. Re decreases indirectly proportional to the increase in viscosity;
That’s why non-turbulent conditions and poor mixing always result during mixing
high viscous fluids. You can solve this by increasing the impeller speed but this
would require increasing the power consumption. When we want to measure
rheological properties of fluids using impellers, we have to be in the laminar
(creeping) regime of the flow, so that power number would depend on Re ,and
thus the viscosity can be determined.
7. Improving Mixing
In some cases, it’s not possible to reduce the time of mixing by raising the input
power into the stirrer. So instead of increasing the stirrer speed there are other
various techniques to improve fluid circulation. We can improve the mixing in our
system by installing baffles; This routine is for stirrer fermenters, and it produces
greater turbulence. For efficient mixing, we should place the impeller below the
geometric center of the vessel. The impeller in standard designs is located with a
distance about one impeller diameter or one-third the tank diameter above the
bottom of the tank.
Mixing is eased when the currents above the impeller are bigger that those below;
Basically, the fluid particles would leave the impeller at the same time but takes
different periods of time to return and exchange material. When upper and lower
circulation loops are asynchronous, the rate of distribution throughout the vessel
increases.

23
To improve mixing we can also use multiple impellers as shown in figure(12), but
you must add in consideration that this will require an increase in the power input.
Bioreactors are usually tall cylindrical vessels with liquid depth that is greater than
the tank diameter. This design results in a higher hydrostatic pressure at the
bottom of the vessel, and gives the rising air bubbles a longer contact time with the
liquid. To achieve mixing effectively in tall fermenters, it requires the use of more
than one impeller.
Figure 12. Multiple impellers in a tall fermenter

24
Objective:
The general approach of this experiment is to find the correlation of Reylonld's
number and power number and its effect on the system and the mixing process.
Also, the effect of impeller type, control number, stream pattern, number of
impellers, volume fraction, and some physical properties, such that viscosity and
density on the mixing process.
The goal of my work is to determine power characteristics of anchor agitator,
pitched four-blade impeller and four-blade turbine, and then compare these results
to the values I provide through Literature search. Therefore, to describe effects of
geometrical parameters on mixing processes.

25
Part 2: Experiments
1. Methods and Equipment
The experiments were carried out in 3 Vessels with different diameters. There
were used 3 different types of impellers in each vessel. (4RT , 4PBT and Anchor)
as shown in the table 1.
Experiments were done using water and glycerin separately; the aim is to be able
to measure in wider range of Reynolds numbers since the higher viscosity liquid
needs higher torque (power) at the same speed. The depth of the liquid in the tank
is equals to 1.0 times the tank diameter. Reynolds numbers were investigated
covering the range from low transitional to fully turbulent flow. The geometry of
used equipment( impellers , vessels) is shown in figures (13, 14) respectively.
Figure 13. Geometry of mixing impellers
26
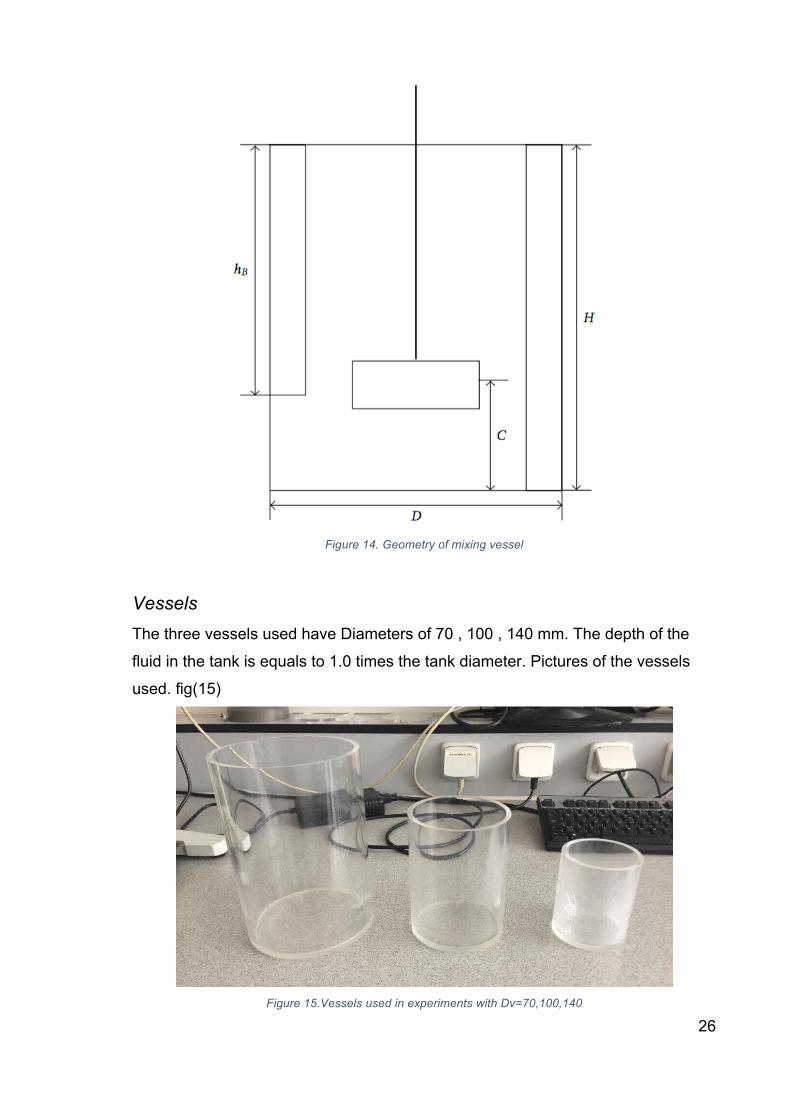
Figure 14. Geometry of mixing vessel
Vessels The three vessels used have Diameters of 70 , 100 , 140 mm. The depth of the
fluid in the tank is equals to 1.0 times the tank diameter. Pictures of the vessels
used. fig(15)
Figure 15.Vessels used in experiments with Dv=70,100,140

27
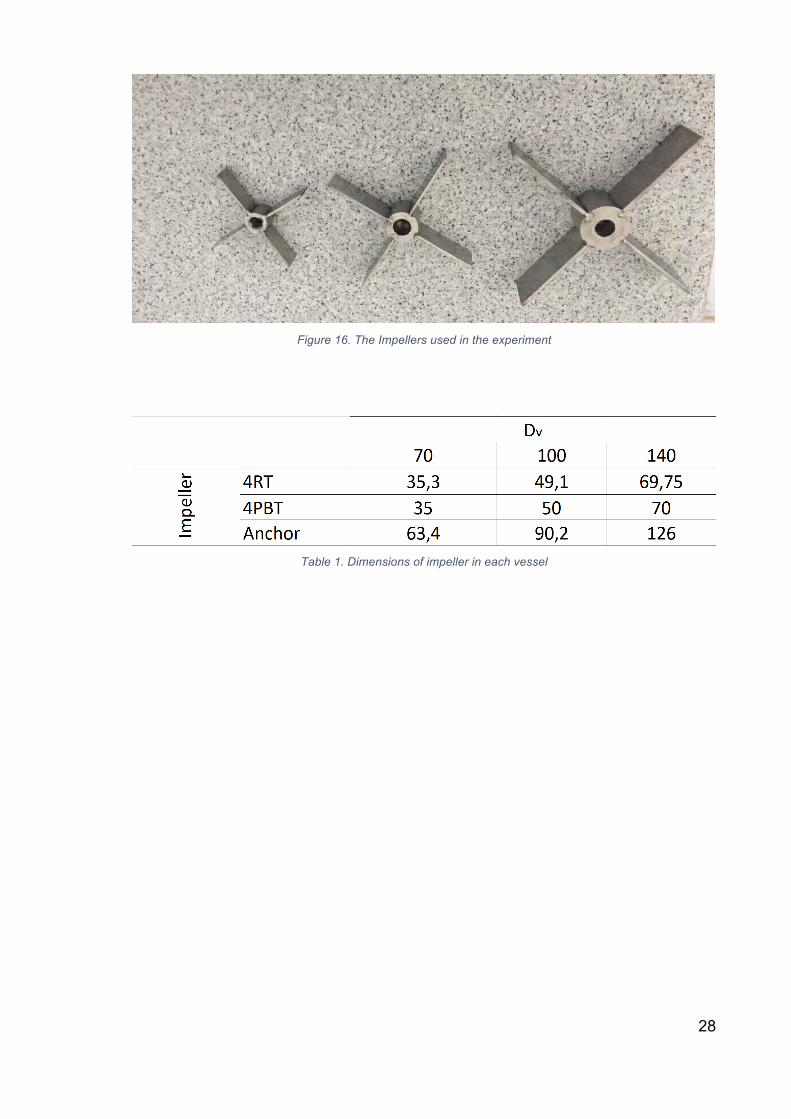
Impellers
Pictures Of impellers 4RT, 4PBT and Anchor are given in Figure.(16). Their
dimensions are given in details in Table (1). In water, Experiments were done
twice in each vessel for impellers 4Rt and 4PBT; impellers were located one time
at an off-bottom clearance C=0.5Dimp ,and another time at C=Dimp .On the other
hand, Anchor impeller was located with clearance C=0.055Dimp .
28
Figure 16. The Impellers used in the experiment
Table 1. Dimensions of impeller in each vessel

29
Viscometer The Viscometer used for the tests is RheoTec RC20 as shown in fig(17) . Its
maximum torque is 50 mNm and maximum rotations is 800 rpm.
Figure 17. Viscometer

30
2. The torque measurements
Torque measurements were taken over a wide range of RPM for each tested
impeller. To ensure that steady state measurements were reached the dynamics
had to be closely watched.
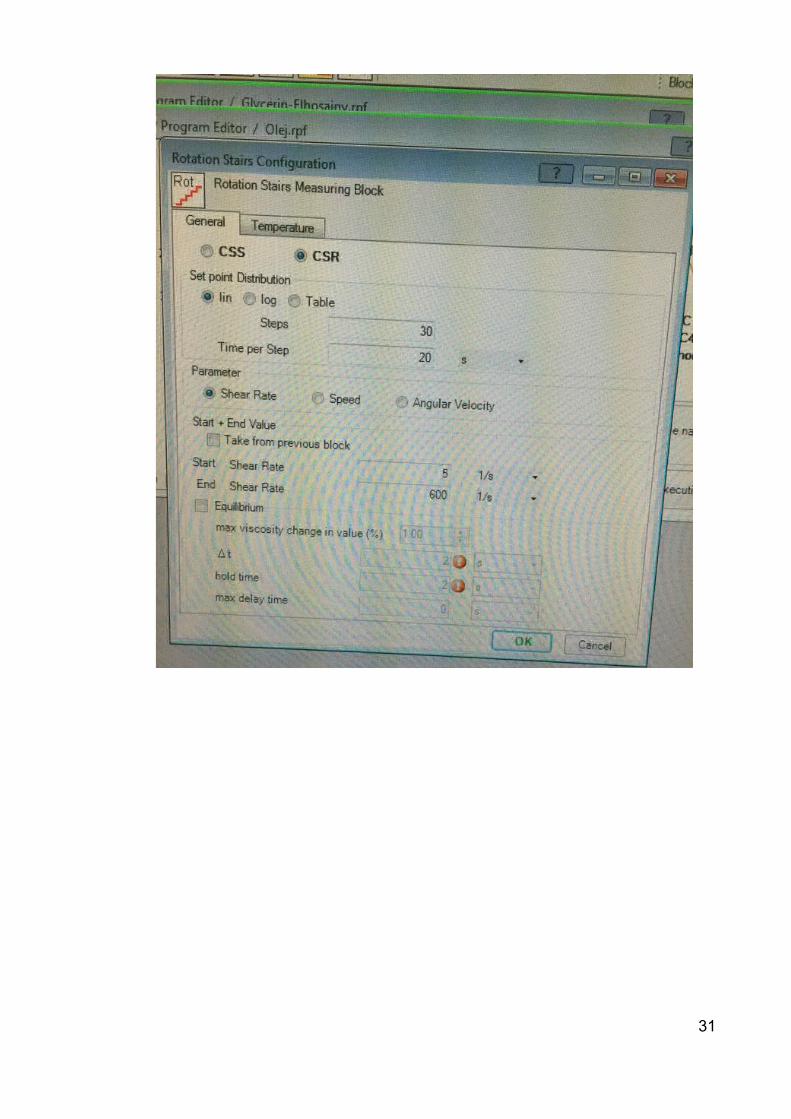
Data is collected through the software RheoWin(18) . Before each experiments
you have to set some parameters in the program like how many steps do you
need in which speed changes gradually in each step, the time during each step,
starting Speed, Maximum Speed as shown in Fig.(19) Each experiment for each
impeller starts at step no. 1 with the starting speed set depending on the impeller
and time during each step is set to 20 seconds. After each step the velocity
increases till it reaches step no. 30 with maximum speed (Set depending on the
impeller). Then it starts reducing again gradually till it Reaches Starting Speed
again. Starting and ending speeds, shown in table (2), are checked manually and
separately before each experiment so that we are sure it’s the sufficient speed for
the impeller concerning torque limits and vortex formation.
All the data are recorded after each step then exported in an excel sheet later and
used to analyze readings and make various calculations to detect the power
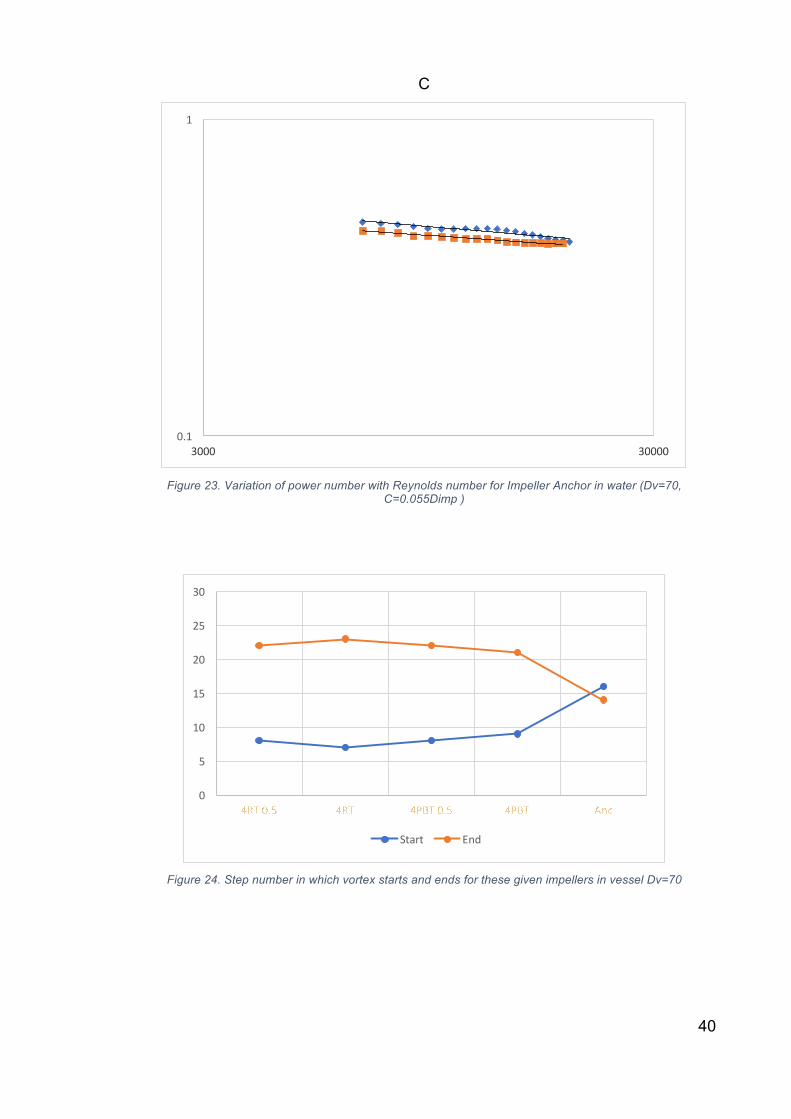
characteristics of each impeller in each vessel tables (6,7,8). Vortex was also
measure during each experiment in which I monitored when it starts and take
measurements of the height of the vortex at step no. 30 (maximum speed) as
shown in Fig(25). I also made some charts showing in which step did the vortex
start and end as shown in fig.(24)
Viscosities and Densities were selected according to the standard tables of Water
and Glycerin within given temperatures measured during the experiments, as
shown in Tables (2-5)
31

32
Figure 18. Setting parameters for experiments on RheoWin software.

33
3. Viscosity and temperature tables
Table 2. Viscosity values chosen from the standard tables of Glycerin viscosity according to the temperature values obtained from experiments for several impellers in 3 different Vessels Dv=70,100,140
Table 3. . Viscosity values chosen from the standard tables of water viscosity according to the temperature values obtained from experiments for several impellers in 3 different Vessels Dv=70,100,140
Table 4. . Viscosity values chosen from the standard tables of water viscosity according to the temperature values obtained from experiments for several impellers in 3 different Vessels Dv=70,100,140
Table 5 . Viscosity values chosen from the standard tables of water viscosity according to the temperature values obtained from experiments for several impellers in 3 different Vessels Dv=70,100,140

34
Part 3: Results and discussion of practical part
At this stage I have the values of speed , density, viscosity , torque and diameter
of the impeller; As you can see in tables (6) and (7),(8) , the software extract the
results to an excel sheet which I added more parameters like density and
viscosity.So now i can calculate the Reynold’s number and power then power
number using the equations (1,2,3). After obtaining results for Re and Np I made a
graph for each experiment to explain their relation, as show in Fgures (19-48) .
Values of torque less than 0.2 mNm were neglected for more precise results.
Measured vortexes during experiments are plotted on charts Fig(25). Reynolds
number which is referred to sometimes as the impeller’s Reynolds numbers. At
High Reynolds number, the power number tends to be independent of the impeller
Reynolds number and dependent only on the geometry. The Reynolds number
increases with the square of the vessel size for the same rotational speed. While
power number is contestant and independent of the Reynolds number in baffled
systems in Reynolds number above 10^3-10^4, depending on the impeller.
Results of this correlation of Re and Np is shown in figures (50-56) in which I have
chosen three random values of impellers diameter which means vessel size as
well. Each vessel with had a constant speed of impeller for the particular value
chosen, then to be resulted is how Re and Np change respectively.

35
Table 6 Values obtained from the experiment for impeller 4PBT in Vessel Dv=100 (1)

36
Table 7. Values obtained from the experiment for impeller 4PBT in Vessel Dv=100 (2).

37
Table 8. Excel calculations for impeller 4PBT in Vessel Dv=100

38
Figure 19. Variation of power number with Reynolds number for Impeller 4RT in water (Dv=70, C=0.5Dimp )
Figure 20. Variation of power number with Reynolds number for Impeller 4RT in water (Dv=70, C=Dimp )
0.1
17000
0.1
17000

39
Figure 21. Variation of power number with Reynolds number for Impeller 4PBT in water (Dv=70, C=0.5Dimp )
Figure 22. Variation of power number with Reynolds number for Impeller 4PBT in water (Dv=70, C=Dimp )
0.1
1
7000
0.1
1
7000
40
C
Figure 23. Variation of power number with Reynolds number for Impeller Anchor in water (Dv=70,
C=0.055Dimp )
Figure 24. Step number in which vortex starts and ends for these given impellers in vessel Dv=70
0.1
1
3000 30000
0
5
10
15
20
25
30
Start End

41
Figure 25. Vortex length in mm at Max point for these given impellers in Vessel Dv=70
Figure 26. Variation of power number with Reynolds number for Impeller 4RT in water (Dv=100, C=0.5Dimp )
0
10
20
30
40
50
60
70
4RT0.5 4RT 4PBT0.5 4PBT Anc
0.1
1
1000 10000 100000

42
Figure 27. Variation of power number with Reynolds number for Impeller 4RT in water (Dv=100, C=Dimp )
Figure 28.Variation of power number with Reynolds number for Impeller 4PBT in water (Dv=100, C=0.5Dimp)
0.1
1
3000
1
10
3000 30000

43
Figure 29. Variation of power number with Reynolds number for Impeller 4PBT in water (Dv=100, C=Dimp )
Figure 30. Variation of power number with Reynolds number for Impeller Anchor in water (Dv=100,
C=0.055Dimp )
1
10
3000 30000 300000
0.1
1
3000 30000 300000

44
Figure 31. Step number in which vortex starts and ends for these given impellers in vessel Dv=100
Figure 32. Vortex length in mm at Max point for these given impellers in Vessel Dv=100
0
5
10
15
20
25
30
4RT0.5 4RT 4PBT0.5 4PBT Anc
Start End
0
20
40
60
80
100
120
4RT0.5 4RT 4PBT0.5 4PBT Anc
45
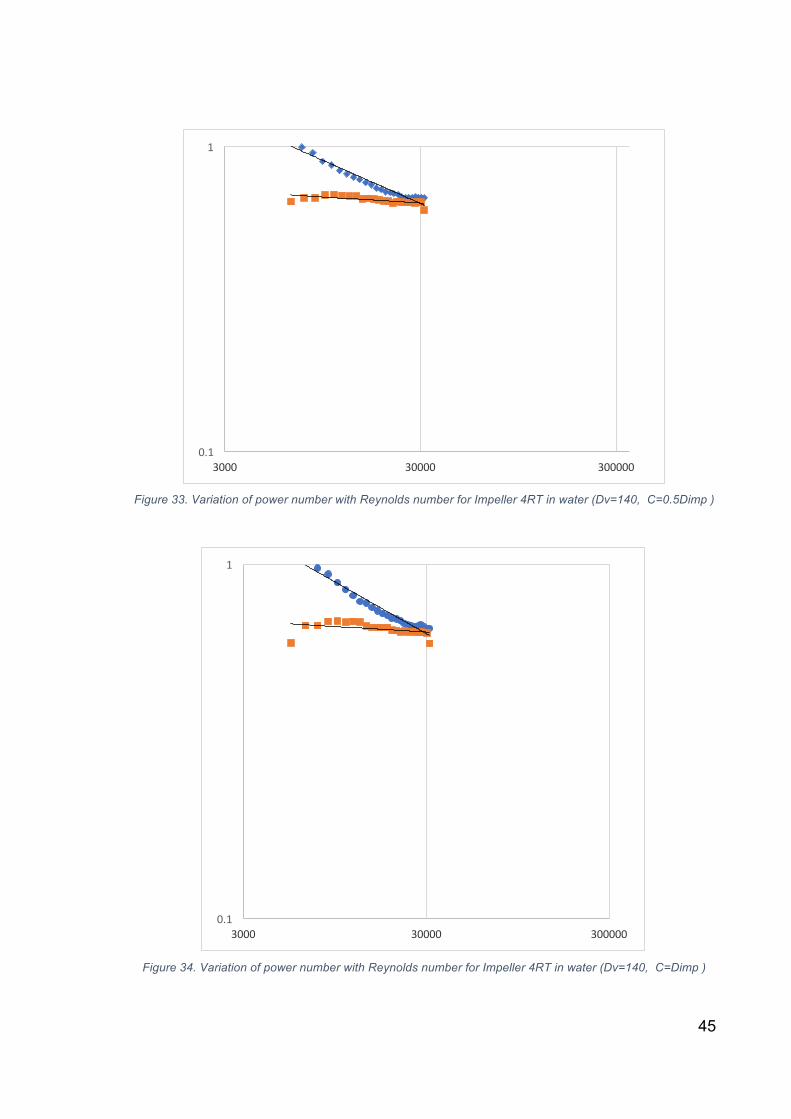
Figure 33. Variation of power number with Reynolds number for Impeller 4RT in water (Dv=140, C=0.5Dimp )
Figure 34. Variation of power number with Reynolds number for Impeller 4RT in water (Dv=140, C=Dimp )
0.1
1
3000 30000 300000
0.1
1
3000 30000 300000

46
Figure 35. Variation of power number with Reynolds number for Impeller 4PBT in water (Dv=140,
C=0.5Dimp)
Figure 36. Variation of power number with Reynolds number for Impeller 4PBT in water (Dv=140, C=Dimp )
0.1
1
3000 30000 300000
0.1
1
3000 30000 300000
47
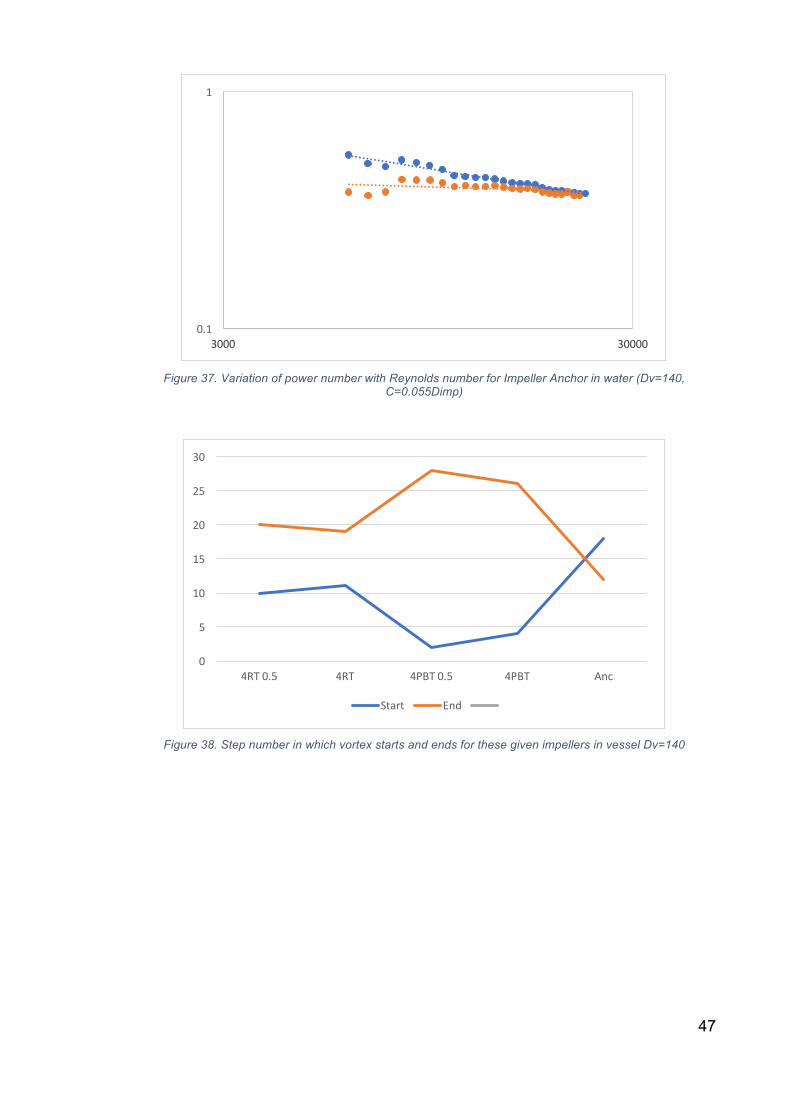
Figure 37. Variation of power number with Reynolds number for Impeller Anchor in water (Dv=140,
C=0.055Dimp)
Figure 38. Step number in which vortex starts and ends for these given impellers in vessel Dv=140
0.1
1
3000 30000
0
5
10
15
20
25
30
4RT0.5 4RT 4PBT0.5 4PBT Anc
Start End

48
Figure 39. Vortex length in mm at Max point for these given impellers in Vessel Dv=140
Figure 40. Variation of power number with Reynolds number for Impeller 4RT in Glycerine (Dv=70,
C=0.5Dimp )
0
20
40
60
80
100
120
4RT0.5 4RT 4PBT0.5 4PBT Anc
1
10
4

49
Figure 41. Variation of power number with Reynolds number for Impeller 4BTT in Glycerine (Dv=70,
C=0.5Dimp )
Figure 42. Variation of power number with Reynolds number for Impeller Anchor in Glycerine (Dv=70,
C=0.055Dimp )
1
10
4
1
10
100
1 10 100

50
Figure 43. Variation of power number with Reynolds number for Impeller 4RT in Glycerin (Dv=100,
C=0.5Dimp)
Figure 44. Variation of power number with Reynolds number for Impeller 4PBT in Glycerin (Dv=100,
C=0.5Dimp)
1
10
1 10 100
1
10
1 10 100

51
Figure 45. Variation of power number with Reynolds number for Impeller Anchor in Glycerin (Dv=100,
C=0.055Dimp)
Figure 46. Variation of power number with Reynolds number for Impeller 4RT in Glycerin (Dv=140,
C=0.5Dimp)
1
10
100
1 10 100
1
10
100
1 10 100

52
Figure 47. Variation of power number with Reynolds number for Impeller 4PBT in Glycerin (Dv=140,
C=0.5Dimp)
Figure 48. Variation of power number with Reynolds number for Impeller Anchor in Glycerin (Dv=140,
C=0.055Dimp)
1
10
100
1 10 100
1
10
100
1000
1 10 100

53
Figure 49. Values of Re and Np in water for Anchor impeller placed at a height C=0.055Dimp, in vessels with
Dv=70 (point 1), 10 (point 2), 140 (point3) at Ni1=1.35 rps and Ni2=1.8 rps.
Figure 50. Values of Re and Np in water for 4RT impeller placed at a height C=Dimp , in vessels with Dv=70
(point 1), 10 (point 2), 140 (point3) at Ni1=5.12 rps and Ni2=6.49 rps
0
0.05
0.1
0.15
0.2
0.25
0.3
0.35
0.4
0.45
0.5
0
5000
10000
15000
20000
25000
1 2 3
Re1 Re2 Np1 Np2
0.6
0.62
0.64
0.66
0.68
0.7
0.72
0.74
0
5000
10000
15000
20000
25000
30000
35000
1 2 3Re1 Re2 Np1 Np2
54
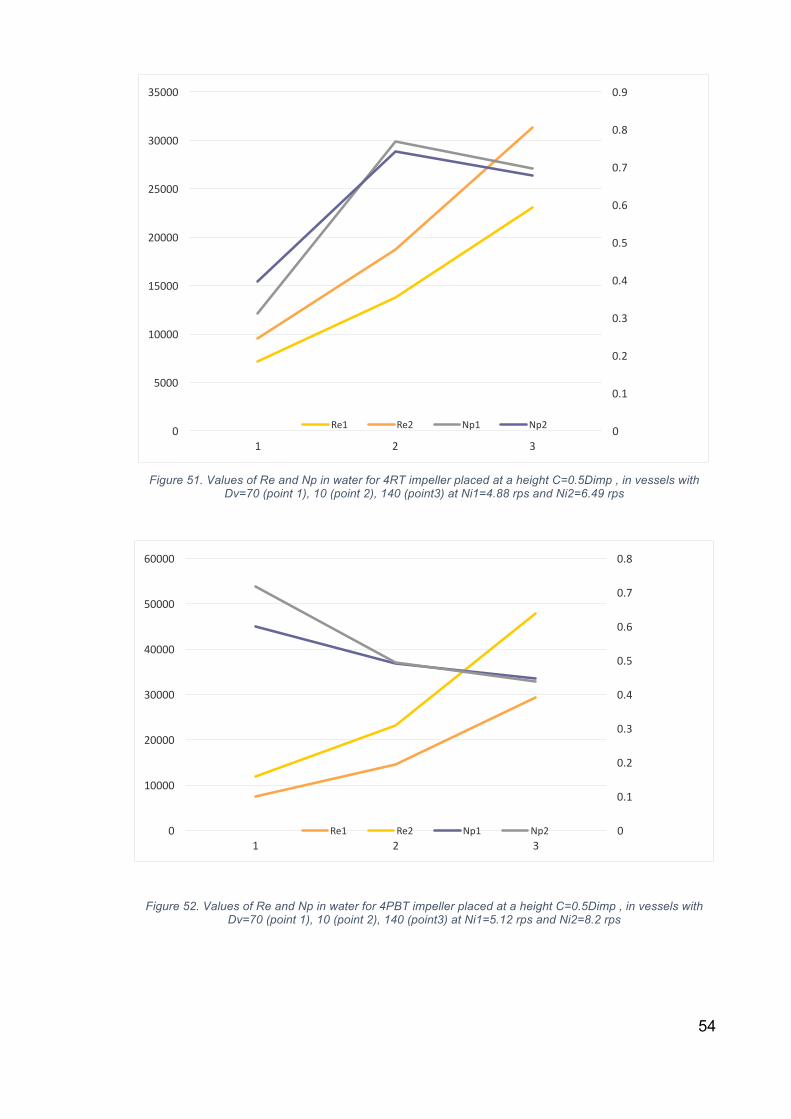
Figure 51. Values of Re and Np in water for 4RT impeller placed at a height C=0.5Dimp , in vessels with
Dv=70 (point 1), 10 (point 2), 140 (point3) at Ni1=4.88 rps and Ni2=6.49 rps
Figure 52. Values of Re and Np in water for 4PBT impeller placed at a height C=0.5Dimp , in vessels with Dv=70 (point 1), 10 (point 2), 140 (point3) at Ni1=5.12 rps and Ni2=8.2 rps
0
0.1
0.2
0.3
0.4
0.5
0.6
0.7
0.8
0.9
0
5000
10000
15000
20000
25000
30000
35000
1 2 3
Re1 Re2 Np1 Np2
0
0.1
0.2
0.3
0.4
0.5
0.6
0.7
0.8
0
10000
20000
30000
40000
50000
60000
1 2 3Re1 Re2 Np1 Np2

55
Figure 53. Values of Re and Np in water for 4PBT impeller placed at a height C=Dimp , in vessels with Dv=70
(point 1), 10 (point 2), 140 (point3) at Ni1=5.12 rps and Ni2=6.49 rps
Figure 54. Values of Re and Np In Glycerin for Anchor impeller placed at a height C=0.05Dimp , in vessels
with Dv=70 (point 1), 10 (point 2), 140 (point3) at speed Ni1=0.66 rps
0
0.1
0.2
0.3
0.4
0.5
0.6
0
5000
10000
15000
20000
25000
30000
35000
40000
45000
1 2 3Re1 Re2 Np1 Np2
0
2
4
6
8
10
12
14
16
18
20
0
2
4
6
8
10
12
14
16
1 2 3Np1 Re1

56
Figure 55. Values of Re and Np In Glycerin for 4PBT impeller placed at a height C=0.5Dimp , in vessels with
Dv=70 (point 1), 10 (point 2), 140 (point3) at Ni1=2.7 rps and Ni2=5rps
Figure 56. Values of Re and Np In Glycerin for 4RT impeller placed at a height C=0.5Dimp , in vessels with
Dv=70 (point 1), 10 (point 2), 140 (point3) at Ni1=2.7 rps and Ni2=5rps
0
0.5
1
1.5
2
2.5
3
3.5
0
10
20
30
40
50
60
1 2 3Re1 Re2 Np1 Np2
0
0.5
1
1.5
2
2.5
3
3.5
4
4.5
0
10
20
30
40
50
60
1 2 3
Re1 Re2 Np1 Np2
57
Part 4: Conclusion
As we can see from the results , its obvious that the scale up affects the power
characteristics significantly as we increase the impeller diameter , the power
number decreases and Reynold’s number increases .The results of this analysis
supports literature data I collected; But some curves’ slopes ,for impellers 4rt and
4PBT in the small vessel (Dv), were increasing instead of decreasing . At low
Dimp values the value of the torque is so low, So the precision is bad. In glycerin
there was no vortex formation during testing impellers 4RT and 4PBT in the three
Vessels as it was in laminar regime with low reynold’s number; For Anchor
impeller vortex formations happened in vessels Dv=70,100 but in the bigger vessel
Dv=140 it started forming. This proves that Glycerin is a high viscous fluid and this
is the reason why vortex didn’t form. Some of the problems I faced was that the
software sometimes would crash in the middle of the experiment and oi would
have to repeat it atleast 2 times before it would start functioning properly again.
Also sometimes I found difficulty in figuring out which maximum speed I should
use so that the water doesn’t splash on the whole counter while working , as for
each impeller the speed had to be chosen separately.

58
Lists
1. Table of Symbols
Symbol Quantity Unit
Re Reynold’s number
Ni Speed rps
Dimp Impeller Diameter mm
ρ Density Kg/m3
µ Viscosity Pa.S
M Torque N.m
P Power Watt
Dv Vessel Diameter mm
C Off-bottom clearance mm
tm Mixing time s
2. List of figures
Figure 1. A standard tank with a working volume of 100 M3 and used for penicillin
production ................................................................................................................ 9
Figure 2. Typical configuration of a stirred tank .................................................... 10
Figure 3. Baffle arrangements. .............................................................................. 11
Figure 4. A Vessel with bottom entering stirrer. .................................................... 12
Figure 5. Impeller designs. .................................................................................... 13
Figure 6.Viscosity ranges for different impellers. ................................................. 13
Figure 7.Flow patterns with different impellers, impeller diameter, and liquid
viscosity. ................................................................................................................ 15

59
Figure 8. Correlation between power number and Reynolds number for Rushton
turbine, paddle and marine propeller without sparging ......................................... 18
Figure 9. Correlation between power number and Reynolds number for anchor
and helical-ribbon impeller without sparging ......................................................... 19
Figure 10. Power number versus impeller Reynolds number for seven different
impellers. (Modified from Rushton et al., 1950.) .................................................... 20
Figure 11. Concentration response after tracer is injected into a stirred tank ....... 21
Figure 12. Multiple impellers in a tall fermenter ..................................................... 23
Figure 13. Geometry of mixing impellers ............................................................... 25
Figure 14. Geometry of mixing vessel ................................................................... 26
Figure 15.Vessels used in experiments with Dv=70,100,140 ................................ 26
Figure 16. The Impellers used in the experiment .................................................. 28
Figure 17. Viscometer ........................................................................................... 29
Figure 18. Setting parameters for experiments on () software. ............................. 32
Figure 19. Variation of power number with Reynolds number for Impeller 4RT in
water (Dv=70, C=0.5Dimp ) .................................................................................. 38
Figure 20. Variation of power number with Reynolds number for Impeller 4RT in
water (Dv=70, C=Dimp ) ....................................................................................... 38
Figure 21. Variation of power number with Reynolds number for Impeller 4PBT in
water (Dv=70, C=0.5Dimp ) .................................................................................. 39
Figure 22. Variation of power number with Reynolds number for Impeller 4PBT in
water (Dv=70, C=Dimp ) ....................................................................................... 39
Figure 23. Variation of power number with Reynolds number for Impeller Anchor in
water (Dv=70, C=0.055Dimp ) ............................................................................... 40
Figure 24. Step number in which vortex starts and ends for these given impellers
in vessel Dv=70 ..................................................................................................... 40
Figure 25. Vortex length in mm at Max point for these given impellers in Vessel
Dv=70 .................................................................................................................... 41
Figure 26. Variation of power number with Reynolds number for Impeller 4RT in
water (Dv=100, C=0.5Dimp ) ................................................................................ 41
Figure 27. Variation of power number with Reynolds number for Impeller 4RT in
water (Dv=100, C=Dimp ) ..................................................................................... 42
Figure 28.Variation of power number with Reynolds number for Impeller 4PBT in
water (Dv=100, C=0.5Dimp) ................................................................................. 42

60
Figure 29. Variation of power number with Reynolds number for Impeller 4PBT in
water (Dv=100, C=Dimp ) ..................................................................................... 43
Figure 30. Variation of power number with Reynolds number for Impeller Anchor in
water (Dv=100, C=0.055Dimp ) ............................................................................ 43
Figure 31. Step number in which vortex starts and ends for these given impellers
in vessel Dv=100 ................................................................................................... 44
Figure 32. Vortex length in mm at Max point for these given impellers in Vessel
Dv=100 .................................................................................................................. 44
Figure 33. Variation of power number with Reynolds number for Impeller 4RT in
water (Dv=140, C=0.5Dimp ) ................................................................................ 45
Figure 34. Variation of power number with Reynolds number for Impeller 4RT in
water (Dv=140, C=Dimp ) ..................................................................................... 45
Figure 35. Variation of power number with Reynolds number for Impeller 4PBT in
water (Dv=140, C=0.5Dimp) ................................................................................. 46
Figure 36. Variation of power number with Reynolds number for Impeller 4PBT in
water (Dv=140, C=Dimp ) ..................................................................................... 46
Figure 37. Variation of power number with Reynolds number for Impeller Anchor in
water (Dv=140, C=0.055Dimp) ............................................................................. 47
Figure 38. Step number in which vortex starts and ends for these given impellers
in vessel Dv=140 ................................................................................................... 47
Figure 39. Vortex length in mm at Max point for these given impellers in Vessel
Dv=140 .................................................................................................................. 48
Figure 40. Variation of power number with Reynolds number for Impeller 4RT in
Glycerine (Dv=70, C=0.5Dimp ) .......................................................................... 48
Figure 41. Variation of power number with Reynolds number for Impeller 4BTT in
Glycerine (Dv=70, C=0.5Dimp ) .......................................................................... 49
Figure 42. Variation of power number with Reynolds number for Impeller Anchor in
Glycerine (Dv=70, C=0.055Dimp ) ...................................................................... 49
Figure 43. Variation of power number with Reynolds number for Impeller 4RT in
Glycerin (Dv=100, C=0.5Dimp) ............................................................................. 50
Figure 44. Variation of power number with Reynolds number for Impeller 4PBT in
Glycerin (Dv=100, C=0.5Dimp) ............................................................................. 50
Figure 45. Variation of power number with Reynolds number for Impeller Anchor in
Glycerin (Dv=100, C=0.055Dimp) ......................................................................... 51

61
Figure 46. Variation of power number with Reynolds number for Impeller 4RT in
Glycerin (Dv=140, C=0.5Dimp) ............................................................................. 51
Figure 47. Variation of power number with Reynolds number for Impeller 4PBT in
Glycerin (Dv=140, C=0.5Dimp) ............................................................................. 52
Figure 48. Variation of power number with Reynolds number for Impeller Anchor in
Glycerin (Dv=140, C=0.055Dimp) ......................................................................... 52
Figure 49. Values of Re and Np in water for Anchor impeller placed at a height
C=0.055Dimp, in vessels with Dv=70 (point 1), 10 (point 2), 140 (point3) at
Ni1=1.35 rps and Ni2=1.8 rps. .............................................................................. 53
Figure 50. Values of Re and Np in water for 4RT impeller placed at a height
C=Dimp , in vessels with Dv=70 (point 1), 10 (point 2), 140 (point3) at Ni1=5.12
rps and Ni2=6.49 rps ............................................................................................. 53
Figure 51. Values of Re and Np in water for 4RT impeller placed at a height
C=0.5Dimp , in vessels with Dv=70 (point 1), 10 (point 2), 140 (point3) at
Ni1=4.88 rps and Ni2=6.49 rps ............................................................................. 54
Figure 52. Values of Re and Np in water for 4PBT impeller placed at a height
C=0.5Dimp , in vessels with Dv=70 (point 1), 10 (point 2), 140 (point3) at
Ni1=5.12 rps and Ni2=8.2 rps ............................................................................... 54
Figure 53. Values of Re and Np in water for 4PBT impeller placed at a height
C=Dimp , in vessels with Dv=70 (point 1), 10 (point 2), 140 (point3) at Ni1=5.12
rps and Ni2=6.49 rps ............................................................................................. 55
Figure 54. Values of Re and Np In Glycerin for Anchor impeller placed at a height
C=0.05Dimp , in vessels with Dv=70 (point 1), 10 (point 2), 140 (point3) at speed
Ni1=0.66 rps .......................................................................................................... 55
Figure 55. Values of Re and Np In Glycerin for 4PBT impeller placed at a height
C=0.5Dimp , in vessels with Dv=70 (point 1), 10 (point 2), 140 (point3) at Ni1=2.7
rps and Ni2=5rps ................................................................................................... 56
Figure 56. Values of Re and Np In Glycerin for 4RT impeller placed at a height
C=0.5Dimp , in vessels with Dv=70 (point 1), 10 (point 2), 140 (point3) at Ni1=2.7
rps and Ni2=5rps ................................................................................................... 56
3. List of tables Table 1. Dimensions of impeller in each vessel .................................................... 28

62
Table 2. Viscosity values chosen from the standard tables of water viscosity
according to the temperature values obtained from experiments for several
impellers in 3 different Vessels Dv=70,100,140 .................................................... 33
Table 3. ................................................................................................................. 33
Table 4. ................................................................................................................. 33
Table 5 .................................................................................................................. 33
Table 6 Values obtained from the experiment for impeller 4PBT in Vessel Dv=100
(1) .......................................................................................................................... 35
Table 7. Values obtained from the experiment for impeller 4PBT in Vessel Dv=100
(2). ......................................................................................................................... 36
Table 8. Excel calculations for impeller 4PBT in Vessel Dv=100 .......................... 37
Appendix
Number Equation Name
1 𝑃 = 2 ∗ 𝜋 ∗ 𝑁𝑖 ∗ 𝑀 Power
2 𝑁𝑝 =𝑃
𝜌 ∗ 𝑁𝑖6 ∗ 𝐷𝑖8 Power Number
3 𝑅𝑒 =
𝑁𝑖 ∗ 𝐷9 ∗ 𝜌𝜇
Reynold’s Number
References Rushton, J. (1956). Principles of mixing in the fatty oil industries. [online] Wiley
online library. Available at:
http://onlinelibrary.wiley.com/doi/10.1007/BF02638498/abstract
Van de Vusse, J. (1955). Mixing by agitation of miscible liquids Part I. Chemical
Engineering Science, [online] 4(4), pp.178-200. Available at:
https://www.sciencedirect.com/science/article/pii/0009250955850208

63
Holland, F. and Bragg, R. (1995). Fluid Flow for Chemical and Process Engineers.
Burlington: Elsevier.
Life.dlut.edu.cn. Research. [online] Available at: http://life.dlut.edu.cn/english.htm
Correlation of Power Consumption for Several Kinds of Mixing Impellers
[Report] : International Journal of Chemical Engineering / auth. Furukawa Haruki,
Yoshihito Kato and Yoshiro Inoue. - Osaka : Hindawi Publishing Corporation,
2012.
HANDBOOK OF INDUSTRIAL MIXING SCIENCE AND PRACTICE [Book] / auth.
Paul Edward L.. - New Jersey : A JOHN WILEY & SONS, INC., 2004. - Vol. 1.