Cycling performance and morphological evolution …swamp.mse.ufl.edu/articles/2015/Journal of...
9
Cycling performance and morphological evolution of pulsed laser-deposited FeF 2 thin film cathodes for Li-ion batteries Shadi Al Khateeb 1 • Aaron G. Lind 2 • Reinaldo Santos-Ortiz 3 • Nigel D. Shepherd 3 • K. S. Jones 2 Received: 22 December 2014 / Accepted: 27 April 2015 Ó Springer Science+Business Media New York 2015 Abstract Electronic conductor-free FeF 2 films deposited by pulsed laser deposition (PLD) were studied as potential cathode materials for Li-ion batteries. The correlation be- tween microstructural evolution and electrochemical cy- cling of PLD FeF 2 films was investigated. Cross-sectional transmission electron microscopy (X-TEM) of the films indicates that they are composed of particles varying in size between 10 and 50 nm. 20–50 nm particles were initially deposited on the sample substrate and were not cycled, irrespective of film thickness and applied C-rate; 10 nm particles were cycled at low C-rates. Cross-sectional TEM of delithiated films shows that the reconversion process starts from the bottom to the top of the film by forming FeF 2 on the 20–50 nm FeF 2 particles. Galvanostatic mea- surements show that thinner FeF 2 films have higher ca- pacities and expansion percentages than thick films, but the measured capacity of these films is still less than the the- oretical capacity. These results suggest that the cycling performance of PLD FeF 2 is limited by electron transport and that the addition of an electronic conductor will in- crease the cycling capacity of FeF 2 films. Introduction Pulsed laser deposition (PLD) has been widely used for the deposition of thin films of a variety of materials, such as electrochromic materials (WO 3 [1] and NiO [2]) and bat- tery electrode materials (Co 3 O 4 [3], TiS x [4], and FeF 2 [5]). The use of transition metal fluorides as electrodes in lithium-ion batteries is limited by their poor electronic conductivity due to their large band gap. Improved cycling performance of the electrically insulating iron fluoride has been achieved with the addition of carbon as an electronic conductor for iron fluoride powders [6]. PLD allows for uniform growth of thin films with the electrochemical properties of bulk powders and does not require the addi- tion of binders or electronic conductors required for elec- trochemical characterization of powders [3, 5]. The PLD technique has been used for the deposition of electronic conductor-free FeF 2 films previously [5, 7, 8], but there are relatively few reports on the use of PLD FeF 2 films as cathodes for Li-ion batteries [5, 7]. FeF 2 is an attractive conversion cathode material due to its high theoretical capacity of 571 mAh/g [5] at full conversion according to Eq. 1: 2 Li 2þ þ FeF 2 þ 2e ! 2 LiF þ Fe: ð1Þ The large conversion capacity of FeF 2 gives it a distinct advantage over cathodes of intercalation compounds such as LiCoO 2 and LiFePO 4 , which have capacities ranging from 120 to 200 mAh/g [9–13]. Experimental capacities of PLD FeF 2 films close to the theoretical maximum were obtained using coin cell configuration, and the electro- chemical behavior of the FeF 2 films grown at low tem- perature has been investigated [5, 7]. Studies on the morphological evolution and/or conversion reaction mechanism have been performed on C–FeF 2 powders & Shadi Al Khateeb [email protected] 1 Department of Materials Engineering, Faculty of Engineering, Al-Balqa’ Applied University, Al-Salt 19117, Jordan 2 Department of Materials Science and Engineering, University of Florida, Gainesville, FL 32611, USA 3 Department of Materials Science and Engineering, University of North Texas, Denton, TX 76203, USA 123 J Mater Sci DOI 10.1007/s10853-015-9062-5
Transcript of Cycling performance and morphological evolution …swamp.mse.ufl.edu/articles/2015/Journal of...

Cycling performance and morphological evolution of pulsedlaser-deposited FeF2 thin film cathodes for Li-ion batteries
Shadi Al Khateeb1 • Aaron G. Lind2 • Reinaldo Santos-Ortiz3 •
Nigel D. Shepherd3 • K. S. Jones2
Received: 22 December 2014 / Accepted: 27 April 2015
� Springer Science+Business Media New York 2015
Abstract Electronic conductor-free FeF2 films deposited
by pulsed laser deposition (PLD) were studied as potential
cathode materials for Li-ion batteries. The correlation be-
tween microstructural evolution and electrochemical cy-
cling of PLD FeF2 films was investigated. Cross-sectional
transmission electron microscopy (X-TEM) of the films
indicates that they are composed of particles varying in size
between 10 and 50 nm. 20–50 nm particles were initially
deposited on the sample substrate and were not cycled,
irrespective of film thickness and applied C-rate; 10 nm
particles were cycled at low C-rates. Cross-sectional TEM
of delithiated films shows that the reconversion process
starts from the bottom to the top of the film by forming
FeF2 on the 20–50 nm FeF2 particles. Galvanostatic mea-
surements show that thinner FeF2 films have higher ca-
pacities and expansion percentages than thick films, but the
measured capacity of these films is still less than the the-
oretical capacity. These results suggest that the cycling
performance of PLD FeF2 is limited by electron transport
and that the addition of an electronic conductor will in-
crease the cycling capacity of FeF2 films.
Introduction
Pulsed laser deposition (PLD) has been widely used for the
deposition of thin films of a variety of materials, such as
electrochromic materials (WO3 [1] and NiO [2]) and bat-
tery electrode materials (Co3O4 [3], TiSx [4], and FeF2 [5]).
The use of transition metal fluorides as electrodes in
lithium-ion batteries is limited by their poor electronic
conductivity due to their large band gap. Improved cycling
performance of the electrically insulating iron fluoride has
been achieved with the addition of carbon as an electronic
conductor for iron fluoride powders [6]. PLD allows for
uniform growth of thin films with the electrochemical
properties of bulk powders and does not require the addi-
tion of binders or electronic conductors required for elec-
trochemical characterization of powders [3, 5]. The PLD
technique has been used for the deposition of electronic
conductor-free FeF2 films previously [5, 7, 8], but there are
relatively few reports on the use of PLD FeF2 films as
cathodes for Li-ion batteries [5, 7]. FeF2 is an attractive
conversion cathode material due to its high theoretical
capacity of 571 mAh/g [5] at full conversion according to
Eq. 1:
2 Li2þ þ FeF2 þ 2e� ! 2 LiF þ Fe: ð1Þ
The large conversion capacity of FeF2 gives it a distinct
advantage over cathodes of intercalation compounds such
as LiCoO2 and LiFePO4, which have capacities ranging
from 120 to 200 mAh/g [9–13]. Experimental capacities of
PLD FeF2 films close to the theoretical maximum were
obtained using coin cell configuration, and the electro-
chemical behavior of the FeF2 films grown at low tem-
perature has been investigated [5, 7]. Studies on the
morphological evolution and/or conversion reaction
mechanism have been performed on C–FeF2 powders
& Shadi Al Khateeb
1 Department of Materials Engineering, Faculty of
Engineering, Al-Balqa’ Applied University, Al-Salt 19117,
Jordan
2 Department of Materials Science and Engineering, University
of Florida, Gainesville, FL 32611, USA
3 Department of Materials Science and Engineering, University
of North Texas, Denton, TX 76203, USA
123
J Mater Sci
DOI 10.1007/s10853-015-9062-5

prepared by chemical routes [14, 15] and on FeF2 films
prepared by a physical approach [16]. Previous investiga-
tions of FeF2 as a cathode material in lithium-ion cells have
resulted in measured capacities ranging from 137 mAh/g to
near theoretical capacity with the large range in measured
capacities generally being attributed to differences in FeF2processing technique or cycling rate (C-rate) [5, 7, 14, 15,
17, 18]. Nevertheless, questions regarding how PLD tech-
nique would affect the electronic pathway and morpho-
logical evolution during the cycling of electronic
conductor-free FeF2 films deposited by PLD still remain.
We found that the steel components of the coin and
pouch cells can contribute to the total capacity of a given
cell and result in erroneous capacity measurements; so
pouch cells with aluminum leads were used in this work to
avoid contributions in capacity from stainless steel com-
ponents. The effect of film thickness, cycling rate, and the
number of cycles on the cycling performance and the
corresponding morphological evolution of electronic con-
ductor-free FeF2 films was investigated.
Experimental
FeF2 cathode films were deposited via PLD of FeF2 targets
(fabricated from anhydrous FeF2 powder of 99 % purity:
Alfa Aesar) onto 0.5 cm 9 0.5 cm 9 25 lm AISI 304
stainless steel substrates (Trinity Brand Industries) held at
400 �C at a base pressure of 4–5 9 10-7 torr. FeF2 films
were deposited using a 248 nm ultraviolet krypton fluoride
excimer laser operated at a frequency of 10 Hz with a
fluence of 3.75 J/cm2 using Lambda Physik, Compex 201.
After PLD deposition onto the stainless steel substrate,
test cells were assembled inside a glove box in Ar envi-
ronment with less than 0.1 ppm H2O. Figure 1 shows the
construction of a pouch cell consisting of Al leads, a
0.75 cm 9 0.75 cm 9 0.38 mm lithium metal anode
(99.9 % purity, Sigma Aldrich), and an 1.5 cm 9
1.5 cm 9 21.5 lm Celgard C480 polypropylene separator.
The FERRO electrolyte solution used in the cells consisted
of 1 M LiPF6 in dimethyl carbonate:ethylene carbonate
(DMC: EC) (1:1 by volume). The purity of LiPF6 was
99.8 % and the water content of the electrolyte was 20 ppm
maximum. In the construction of the pouch cells, the alu-
minum laminate sheets were heat sealed together to form
the body of the pouch. The first heat seal occurred at the
leads, which were positioned in a (V) shape. The electrodes
were attached to the leads with a piece of Kapton tape.
Electrochemical characterization of the assembled cells
was performed using galvanostatic and cyclic voltammetry
measurements using an Arbin BT2000 over a potential
window of 1–4.5 V. Galvanostatic tests were performed at
a C-rate of C/1 or C/43, while cyclic voltammetry was
performed at 1 mV/s. Herein, C-rate is related to the
number of hours required for the cell to charge in the
predefined potential window (1–4.5 V), and therefore C/1
denotes a charge rate at which the electrode will be charged
from 1 to 4.5 V in 1 h. The samples were coated with
300 nm of amorphous carbon to protect the sample surface
from amorphization due the ion beam during the X-TEM
lamella formation prior to formation of cross-sectional
transmission electron microscopy (X-TEM) sample
lamellas using an in situ Focused Ion Beam (FIB: FEI dual-
beam Strata DB 235) technique, described elsewhere [19].
All X-TEM sample lamellas after being prepared were
immediately transferred from the FIB to the TEM (JOEL
2010F) for structural characterization, and sample exposure
to the atmosphere was limited to 3 min or less. Surface
structure of the as-deposited films was investigated using a
scanning electron microscope (SEM:FEI Dual-Beam Strata
DB235).
Results and discussion
Electrochemical measurements
Galvanostatic cycling tests of FeF2 films of different
thicknesses at a constant C-rate of C/1 are shown in Fig. 2.
These results indicate that thinner films result in higher
measured capacities. A solid electrolyte interface (SEI)
formation during first discharge cycle in FeF2 films has
been reported [20], and a capacity in excess of the theo-
retical value of FeF2 at C/10 was reported and attributed to
the SEI layer formation [5]. The large capacity in the first
discharge cycle observed in this work compared to subse-
quent cycles irrespective of the FeF2 thickness is also likely
due to the formation of an SEI layer.
Discharge–charge curves for the 130 nm FeF2 film are
shown in Fig. 3. These discharge curves are characterized
by two sloping voltage regions and indicate that the con-
version reaction began at 1.5 V. Such behavior has been
observed for PLD FeF2 films cycled at C/10 [5] and for
chemically synthesized FeF2 powders [15, 18]. The first
sloping region shown in Fig. 3 accounts for up to 20 mAh/
g, and it was reported that such sloping is due to the for-
mation of SEI and the involvement of both intercalation
and conversion in early stages of the discharge [18, 21]. A
second sloping region starts at the discharge potential of
1.5 V. Sloping has been observed in previous studies of
FeF2 films [5] and powders [15, 18], but the cause has not
been identified and requires future investigation.
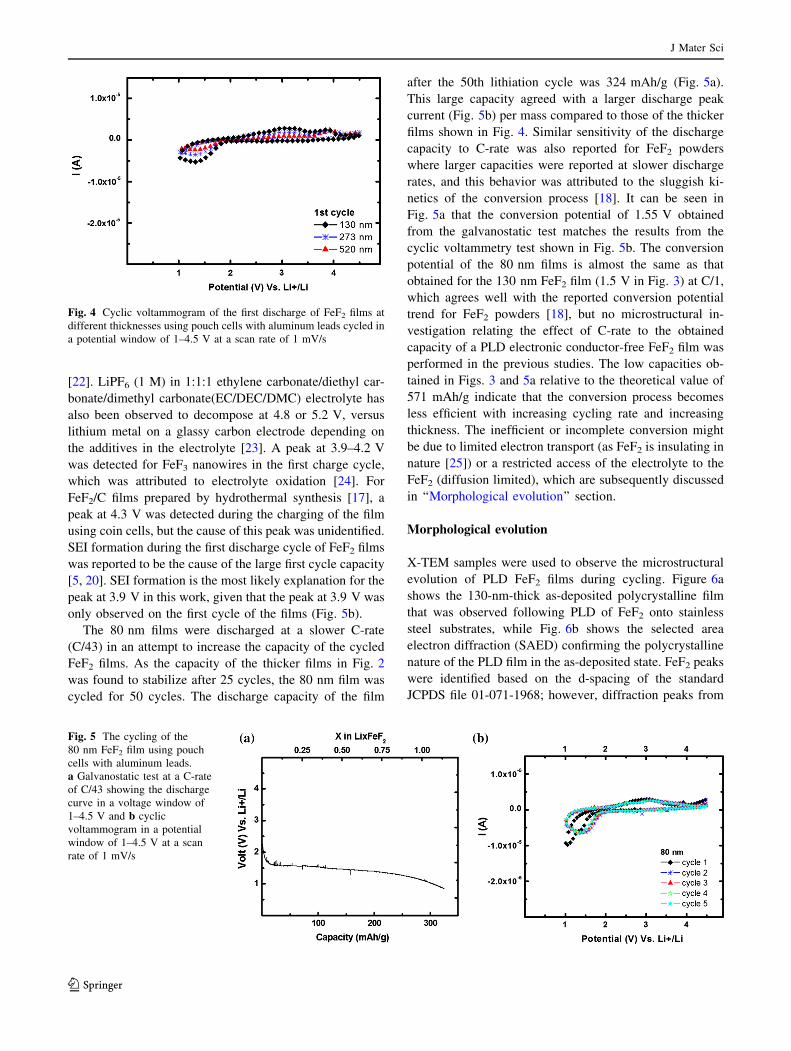
The cyclic voltammetry tests of different film thick-
nesses shown in Fig. 4 indicate that the conversion (dis-
charge) reaction occurs at larger peak currents for the
thinner films, which suggests that inefficient conversion is
J Mater Sci
123

occurring in thicker films and lower capacities are conse-
quently obtained as observed in Fig. 2. Larger peak cur-
rents in the thinner films are due to more efficient
conversion of FeF2, which may indicate that conversion is
limited by either electrolyte access (diffusion limited) or
electron transport. Charging peaks between 2.75 and
3.25 V were also observed, similar to those reported for C–
FeF2 prepared by a chemical approach and cycled at dif-
ferent C-rates [14, 15, 18]. During the first charge cycle for
the FeF2 films (Fig. 4), two resolved peaks were observed.
The first peak was observed at approximately 3.2 V, and
the second peak was detected at 3.9 V. On subsequent
charge cycles, only the peak at 3.2 V was detected as
shown for an 80 nm film (Fig. 5b). Similar peaks were
observed by other researchers for LiPF6 stabilized with
tris(2,2,2-trifluoroethyl) phosphite, where a peak at about
4 V appeared due to an electrolyte reaction during the
charging cycle of Li/graphite and Li/cathode half-cells
Fig. 1 Pouch cell battery
showing the different
components and cell
construction
Fig. 2 Galvanostatic test of the FeF2 films showing the discharge
capacity as a function of cycle number and films’ thicknesses using
pouch cells with aluminum leads. The films were cycled at a C-rate of
C/1. The inset shows a closer view on the capacities of 130, 273, and
520 nm films
Fig. 3 Discharge–charge curves for the 130 nm FeF2 film using
pouch cell with aluminum leads cycled in a voltage window of
1–4.5 V at a C-rate of C/1
J Mater Sci
123
[22]. LiPF6 (1 M) in 1:1:1 ethylene carbonate/diethyl car-
bonate/dimethyl carbonate(EC/DEC/DMC) electrolyte has
also been observed to decompose at 4.8 or 5.2 V, versus
lithium metal on a glassy carbon electrode depending on
the additives in the electrolyte [23]. A peak at 3.9–4.2 V
was detected for FeF3 nanowires in the first charge cycle,
which was attributed to electrolyte oxidation [24]. For
FeF2/C films prepared by hydrothermal synthesis [17], a
peak at 4.3 V was detected during the charging of the film
using coin cells, but the cause of this peak was unidentified.
SEI formation during the first discharge cycle of FeF2 films
was reported to be the cause of the large first cycle capacity
[5, 20]. SEI formation is the most likely explanation for the
peak at 3.9 V in this work, given that the peak at 3.9 V was
only observed on the first cycle of the films (Fig. 5b).
The 80 nm films were discharged at a slower C-rate
(C/43) in an attempt to increase the capacity of the cycled
FeF2 films. As the capacity of the thicker films in Fig. 2
was found to stabilize after 25 cycles, the 80 nm film was
cycled for 50 cycles. The discharge capacity of the film
after the 50th lithiation cycle was 324 mAh/g (Fig. 5a).
This large capacity agreed with a larger discharge peak
current (Fig. 5b) per mass compared to those of the thicker
films shown in Fig. 4. Similar sensitivity of the discharge
capacity to C-rate was also reported for FeF2 powders
where larger capacities were reported at slower discharge
rates, and this behavior was attributed to the sluggish ki-
netics of the conversion process [18]. It can be seen in
Fig. 5a that the conversion potential of 1.55 V obtained
from the galvanostatic test matches the results from the
cyclic voltammetry test shown in Fig. 5b. The conversion
potential of the 80 nm films is almost the same as that
obtained for the 130 nm FeF2 film (1.5 V in Fig. 3) at C/1,
which agrees well with the reported conversion potential
trend for FeF2 powders [18], but no microstructural in-
vestigation relating the effect of C-rate to the obtained
capacity of a PLD electronic conductor-free FeF2 film was
performed in the previous studies. The low capacities ob-
tained in Figs. 3 and 5a relative to the theoretical value of
571 mAh/g indicate that the conversion process becomes
less efficient with increasing cycling rate and increasing
thickness. The inefficient or incomplete conversion might
be due to limited electron transport (as FeF2 is insulating in
nature [25]) or a restricted access of the electrolyte to the
FeF2 (diffusion limited), which are subsequently discussed
in ‘‘Morphological evolution’’ section.
Morphological evolution
X-TEM samples were used to observe the microstructural
evolution of PLD FeF2 films during cycling. Figure 6a
shows the 130-nm-thick as-deposited polycrystalline film
that was observed following PLD of FeF2 onto stainless
steel substrates, while Fig. 6b shows the selected area
electron diffraction (SAED) confirming the polycrystalline
nature of the PLD film in the as-deposited state. FeF2 peaks
were identified based on the d-spacing of the standard
JCPDS file 01-071-1968; however, diffraction peaks from
Fig. 4 Cyclic voltammogram of the first discharge of FeF2 films at
different thicknesses using pouch cells with aluminum leads cycled in
a potential window of 1–4.5 V at a scan rate of 1 mV/s
Fig. 5 The cycling of the
80 nm FeF2 film using pouch
cells with aluminum leads.
a Galvanostatic test at a C-rate
of C/43 showing the discharge
curve in a voltage window of
1–4.5 V and b cyclic
voltammogram in a potential
window of 1–4.5 V at a scan
rate of 1 mV/s
J Mater Sci
123
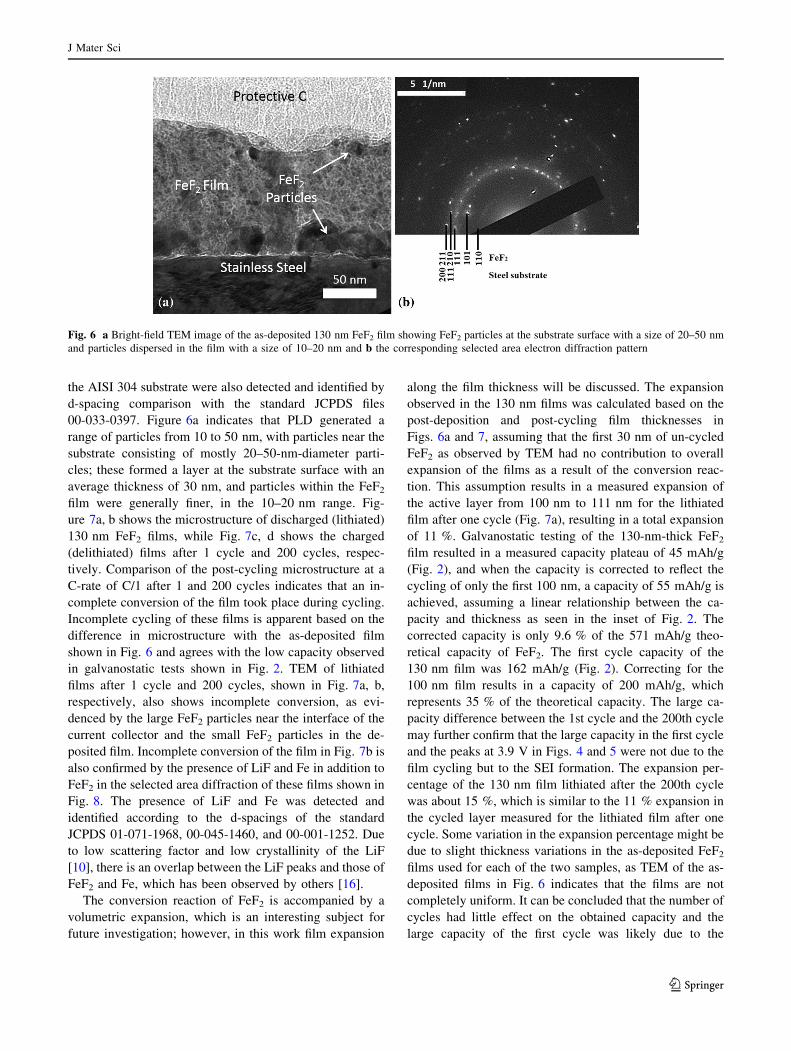
the AISI 304 substrate were also detected and identified by
d-spacing comparison with the standard JCPDS files
00-033-0397. Figure 6a indicates that PLD generated a
range of particles from 10 to 50 nm, with particles near the
substrate consisting of mostly 20–50-nm-diameter parti-
cles; these formed a layer at the substrate surface with an
average thickness of 30 nm, and particles within the FeF2film were generally finer, in the 10–20 nm range. Fig-
ure 7a, b shows the microstructure of discharged (lithiated)
130 nm FeF2 films, while Fig. 7c, d shows the charged
(delithiated) films after 1 cycle and 200 cycles, respec-
tively. Comparison of the post-cycling microstructure at a
C-rate of C/1 after 1 and 200 cycles indicates that an in-
complete conversion of the film took place during cycling.
Incomplete cycling of these films is apparent based on the
difference in microstructure with the as-deposited film
shown in Fig. 6 and agrees with the low capacity observed
in galvanostatic tests shown in Fig. 2. TEM of lithiated
films after 1 cycle and 200 cycles, shown in Fig. 7a, b,
respectively, also shows incomplete conversion, as evi-
denced by the large FeF2 particles near the interface of the
current collector and the small FeF2 particles in the de-
posited film. Incomplete conversion of the film in Fig. 7b is
also confirmed by the presence of LiF and Fe in addition to
FeF2 in the selected area diffraction of these films shown in
Fig. 8. The presence of LiF and Fe was detected and
identified according to the d-spacings of the standard
JCPDS 01-071-1968, 00-045-1460, and 00-001-1252. Due
to low scattering factor and low crystallinity of the LiF
[10], there is an overlap between the LiF peaks and those of
FeF2 and Fe, which has been observed by others [16].
The conversion reaction of FeF2 is accompanied by a
volumetric expansion, which is an interesting subject for
future investigation; however, in this work film expansion
along the film thickness will be discussed. The expansion
observed in the 130 nm films was calculated based on the
post-deposition and post-cycling film thicknesses in
Figs. 6a and 7, assuming that the first 30 nm of un-cycled
FeF2 as observed by TEM had no contribution to overall
expansion of the films as a result of the conversion reac-
tion. This assumption results in a measured expansion of
the active layer from 100 nm to 111 nm for the lithiated
film after one cycle (Fig. 7a), resulting in a total expansion
of 11 %. Galvanostatic testing of the 130-nm-thick FeF2film resulted in a measured capacity plateau of 45 mAh/g
(Fig. 2), and when the capacity is corrected to reflect the
cycling of only the first 100 nm, a capacity of 55 mAh/g is
achieved, assuming a linear relationship between the ca-
pacity and thickness as seen in the inset of Fig. 2. The
corrected capacity is only 9.6 % of the 571 mAh/g theo-
retical capacity of FeF2. The first cycle capacity of the
130 nm film was 162 mAh/g (Fig. 2). Correcting for the
100 nm film results in a capacity of 200 mAh/g, which
represents 35 % of the theoretical capacity. The large ca-
pacity difference between the 1st cycle and the 200th cycle
may further confirm that the large capacity in the first cycle
and the peaks at 3.9 V in Figs. 4 and 5 were not due to the
film cycling but to the SEI formation. The expansion per-
centage of the 130 nm film lithiated after the 200th cycle
was about 15 %, which is similar to the 11 % expansion in
the cycled layer measured for the lithiated film after one
cycle. Some variation in the expansion percentage might be
due to slight thickness variations in the as-deposited FeF2films used for each of the two samples, as TEM of the as-
deposited films in Fig. 6 indicates that the films are not
completely uniform. It can be concluded that the number of
cycles had little effect on the obtained capacity and the
large capacity of the first cycle was likely due to the
Fig. 6 a Bright-field TEM image of the as-deposited 130 nm FeF2 film showing FeF2 particles at the substrate surface with a size of 20–50 nm
and particles dispersed in the film with a size of 10–20 nm and b the corresponding selected area electron diffraction pattern
J Mater Sci
123

formation of SEI, as observed from the similar mi-
crostructural evolution as a function of number of cycles
(Fig. 7a, b), and nearly constant capacity of the 130 nm
film over a large number of cycles (Fig. 2). X-TEM of the
130 nm FeF2 films after being charged (delithiated) for 1
and 200 cycles is shown in Fig. 7c, d, respectively. Two
regions were identified for these films: the upper cycled
region and the lower un-cycled region. The microstructure
of the cycled region resembles the lithiated film depicted in
Fig. 7a, b, whereas the un-cycled region resembles the
microstructure of the as-deposited FeF2 film depicted in
Fig. 6a. The cycled region of the 130-nm-thick FeF2 in
Fig. 7c was found to be 60 nm thick, and 73.8-nm of the
FeF2 remained un-cycled. The total thickness of 133.8 nm
resulted in a measured expansion of 3.8 % after delithiation
compared to the thickness of the as-deposited FeF2 film
(130 nm). The thickness of the FeF2 film should return
back to 130 nm upon full delithiation; however, the 3.8 %
expansion remained in the film after the delithiation pro-
cess, confirming incomplete delithiation. It is mentioned
earlier that the thickness of the active film is 100 nm, but
after the first delithiation cycle (Fig. 7c), the thickness of
the active material became 73.8 nm (un-cycled re-
gion).Thinner films result in larger capacities, as seen in
Fig. 2. Thinner layers of active material may explain the
slight increase in the capacity observed after the first few
cycles for the 130 nm film. The larger thickness of the un-
cycled region (73.8 nm) (Fig. 7c), compared to 30 nm of
FeF2 in the lithiated film shown in Fig. 7a, suggests that
during the delithiation process FeF2 started to reform by
building up through diffusion on the already-existing FeF2particles at the substrate surface further indicating that the
Fig. 7 Bright-field TEM images of the 130 nm FeF2 film after
galvanostatic cycling at C/1 using pouch cells with aluminum leads
after lithiation for a one cycle showing a thickness of 141 nm and
b two hundred cycles showing a thickness of 145 nm and after
delithiation for c one cycle showing a thickness of 133.8 nm and
d two hundred cycles showing a thickness of 139 nm
J Mater Sci
123

delithiation process started from the bottom towards the top
of the film. The delithiation process might be explained by
the following process: porosity improves ionic transport
and hence the amount of film in contact with the elec-
trolyte. The porosity in the as-deposited 130 nm FeF2 as
evidenced by the SEM image in Fig. 9, which might also
be an interconnected porous structure, may cause the en-
trapment of the electrolyte, subsequently facilitating the
delithiation of FeF2 particles at the substrate surface.
Further characterization of the porous nature of the FeF2films is required using scanning probe microscopy for
porosity quantification. The TEM images of the delithiated
samples in Fig. 7c, d shows that the structure of the top part
of the film is similar to the lithiated samples in Fig. 7a, b,
suggesting that lithiated films were not totally reconverted
back from (LiF and Fe) into FeF2. Incomplete reconversion
was less pronounced after the 200th charge cycle (Fig. 7d),
where the thickness of the cycled (lithiated) region was
37 nm compared to 60 nm after the first charge cycle. The
incomplete reconversion of FeF2 from the current collec-
tors toward the film surface resulted in thicker reformed
FeF2 (or thinner lithiated) films after 200 cycles relative to
one cycle and indicates that the restricted access of the
electrolyte (diffusion limited) was not the limiting factor in
the conversion–reconversion cycles of the PLD electronic
conductor-free FeF2 films. As such, electron transport is
more likely to be the factor that controls and limits the
amount of FeF2 involved in the conversion–reconversion
reactions since it is expected that if the conversion–re-
conversion process was diffusion controlled, the thickness
of the cycled (lithiated) regions in Fig. 7c, d should be
independent of the number of cycles.
In addition to the presence of large (20–50 nm) FeF2particles at the substrate surface, which are present before
and after the cycling, small dispersed FeF2 particles of
10–20 nm were also present in the film before and after the
cycling (compare Figs. 6a, 7). Neither of these particles
was observed to be involved in the conversion–reconver-
sion reaction at the fast C-rate (C/1), which further con-
tributed to the low capacity observed in the galvanostatic
tests in Fig. 2. An 80 nm film was discharged at C/43 in an
attempt to cycle the FeF2 particles at the substrate surface
and the dispersed particles in the film. It is obvious from
the TEM image of the 80 nm film after 50 cycles shown in
Fig. 10 that this 80 nm film still has a 30 nm layer of FeF2particles at the substrate surface, which are not involved in
the conversion reaction. The active film shows an expan-
sion percentage after the 50th lithiation cycle of 84 %. If
the capacity in Fig. 5a is corrected for a 50 nm active film,
then the capacity would be 446 mAh/g, which represents
78 % of the theoretical capacity. Accordingly, there is 1.56
Li uptake upon cycling at C/43 during the conversion re-
action as seen in Eq. 2 compared to 0.15 Li for the 130 nm
film cycled at C/1. The micrograph of the post-cycling
morphology of the 80 nm film cycled at C/43, shown in
Fig. 10, indicates that the small (10–20 nm) FeF2 particles
were no longer present after cycling when a lower C-rate
was used, but large particles near the current collector in-
terface still show the presence of un-cycled FeF2. The
galvanostatic testing of the 80 nm film cycled at C/43
indicates that the use of a slow C-rate together with a
Fig. 8 Selected area electron diffraction (SAED) of the lithiated FeF2film after 200 cycles shown in Fig. 7b
Fig. 9 SEM image showing the porous nature of the as-deposited
130 nm FeF2 film
J Mater Sci
123

thinner film would cycle the small, dispersed particles and
lead to larger capacities closer to the theoretical maximum.
1:56 Li2þ þ 0:78 FeF2 ! 1:56 LiF þ 0:78 Fe ð2Þ
The results discussed here suggest that the restricted
access of electrolyte to the cathode during the conversion–
reconversion cycles is not the capacity-controlling factor in
these films. Electron-limited transport is more likely to
result in the observed capacity limits, given the following
observations. The delithiated film after one cycle has a
larger un-reconverted film (cycled region) compared to the
one after 200 cycles (Fig. 7c, d, respectively), and there is a
larger expansion percentage after the lithiation cycles for
the 80 nm film (Fig. 10) compared to the 130 nm film
(Fig. 7b); and capacities much lower than the theoretical
were obtained even when cycling the FeF2 film at slow
C-rate (C/43).
Conclusions
It was found that capacity increased by decreasing the
thickness of the deposited FeF2 films and agreed with the
increase in the discharge peak current as seen from the
cyclic voltammetry test. The slower the C-rate and the
thinner the FeF2 films, the larger the Li uptakes. The
conversion–reconversion reaction was controlled by the
slow access of the electrolyte (diffusion limited) into the
FeF2 films and the slow electron transport, which was
probably the dominant over the diffusion.
It was reported that the thin film deposition technique
has the benefit over the powder technique and that no
binder or electronic conductors are required for subsequent
electrochemical characterization [3, 5]. However, the re-
sults of this work suggest that complete conversion of PLD
FeF2 cathodes is more likely to be achieved with the de-
position of an electronic conductor (such as carbon). This
would improve the conductivity of the films and subse-
quently ease the conversion of FeF2, resulting in capacities
closer to the theoretical maximum upon cycling. Further
improvements could come from controlling the deposition
parameters to eliminate the large FeF2 particles that formed
in the early stages of deposition on the substrate surface, as
these were not shown to contribute to overall cell capacity.
Acknowledgements The corresponding author acknowledges the
Scientific Research Support Fund (SRSF), Jordan, for supporting this
work performed at the University of Florida.
References
1. Rougier A, Portemer F, Quede A, El Marssi M (1999) Charac-
terization of pulsed laser deposited WO3 thin films for elec-
trochromic devices. Appl Surf Sci 153:1–9. doi:10.1016/S0169-
4332(99)00335-9
2. Bouessay I, Rougier A, Poizot P, Moscovici J, Michalowicz A,
Tarascon JM (2005) Electrochromic degradation in nickel oxide
thin film: a self-discharge and dissolution phenomenon. Elec-
trochim Acta 50:3737–3745. doi:10.1016/j.electacta.2005.01.020
3. Pralong V, Leriche JB, Beaudoin B, Naudin E, Morcrette M,
Tarascon JM (2004) Electrochemical study of nanometer Co3O4
Co, CoSb3 and Sb thin films toward lithium. Solid State Ion.
166:295–305. doi:10.1016/j.ssi.2003.11.018
4. Matsuyama T, Sakuda A, Hayashi A, Togawa Y, Mori S, Tat-
sumisago M (2012) Preparation of amorphous TiS x thin film
electrodes by the PLD method and their application to all-solid-
state lithium secondary batteries. J Mater Sci 47:6601–6606.
doi:10.1007/s10853-012-6594-9
5. Makimura Y, Rougier A, Tarascon J-M (2006) Pulsed laser de-
posited iron fluoride thin films for lithium-ion batteries. Appl Surf
Sci 252:4587–4592. doi:10.1016/j.apsusc.2005.06.043
6. Badway F, Pereira N, Cosandey F, Amatucci GG (2003) Carbon-
metal fluoride nanocomposites: structure and electrochemistry of
FeF3: C. J Electrochem Soc 150:A1209–A1218. doi:10.1149/1.
1596162
7. Makimura Y, Rougier A, Laffont L et al (2006) Electrochemical
behaviour of low temperature grown iron fluoride thin films.
Electrochem Commun 8:1769–1774. doi:10.1016/j.elecom.2006.
08.004
8. Santos-Ortiz R, Volkov V, Schmid S et al (2013) Microstructure
and electronic band structure of pulsed laser deposited iron
fluoride thin film for battery electrodes. ACS Appl Mater Inter-
faces 5:2387–2391. doi:10.1021/am3017569
9. Ellis BL, Lee KT, Nazar LF (2010) Positive electrode materials
for Li-ion and Li-batteries. Chem Mater 22:691–714. doi:10.
1021/cm902696j
10. Sina M, Nam KW, Su D et al (2013) Structural phase transfor-
mation and Fe valence evolution in FeOxF2-x/C nanocomposite
Fig. 10 Bright-field TEM image of the 80-nm-thick as-deposited
FeF2 film after the 50th lithiation cycle at C/43 using pouch cells with
Al leads. The total cathode film thickness after cycling was measured
to be 122 nm
J Mater Sci
123

electrodes during lithiation and de-lithiation processes. J Mater
Chem A 1:11629–11640. doi:10.1039/c3ta12109g
11. Goodenough JB, Kim Y (2009) Challenges for rechargeable Li
batteries. Chem Mater 22:587–603. doi:10.1021/cm901452z
12. Xiang H, Zhang D, Jin Y, Chen C, Wu J, Wang H (2011) Hy-
drothermal synthesis of ultra-thin LiFePO4 platelets for Li-ion
batteries. J Mater Sci 46:4906–4912. doi:10.1007/s10853-011-
5403-1
13. Li J, Zhao R, He X, Liu H (2009) Preparation of LiCoO2 cathode
materials from spent lithium–ion batteries. Ionics 15:111–113.
doi:10.1007/s11581-008-0238-8
14. Wang F, Robert R, Chernova NA et al (2011) Conversion reac-
tion mechanisms in lithium ion batteries: study of the binary
metal fluoride electrodes. J Am Chem Soc 133:18828–18836.
doi:10.1021/ja206268a
15. Reddy MA, Breitung B, Chakravadhanula VSK et al (2013) CFxderived carbon–FeF2 nanocomposites for reversible lithium
storage. Adv Energy Mater 3:308–313. doi:10.1002/aenm.
201200788
16. Rangan S, Thorpe R, Bartynski RA et al (2012) Conversion re-
action of FeF2 thin films upon exposure to atomic lithium. J Phys
Chem C 116:10498–10503. doi:10.1021/jp300669d
17. Bai Y, L-w Yang F Wu et al (2013) High performance FeFx/C
composites as cathode materials for lithium-ion batteries. J Re-
new Sustain Energy 5(021402):021401–021409. doi:10.1063/1.
4798423
18. Armstrong MJ, Panneerselvam A, O’Regan C, Morris MA,
Holmes JD (2013) Supercritical-fluid synthesis of FeF2 and CoF2
Li-ion conversion materials. J Mater Chem A 1:10667–10676.
doi:10.1039/c3ta12436c
19. Giannuzzia LA, Stevieb FA (1999) A review of focused ion beam
milling techniques for TEM specimen preparation. Micron
30:197–204. doi:10.1016/S0968-4328(99)00005-0
20. Boyd S, Amatucci G, Pereira N, Greenbaum S (2013) Solid
electrolyte interphase formation in iron (II) fluoride conversion
electrodes. 224th ESC Meeting MA2013-02, pp 933–933
21. Yamakawa N, Jiang M, Key B, Grey CP (2009) Identifying the
local structures formed during lithiation of the conversion ma-
terial, iron fluoride, in a Li ion battery: a solid-state NMR, X-ray
diffraction, and pair distribution function analysis study. J Am
Chem Soc 131:10525–10536. doi:10.1021/ja902639w
22. Zhang SS, Xu K, Jow TR (2002) A thermal stabilizer for LiPF6-
based electrolytes of Li-ion cells. Electrochem Solid State Lett
5:A206–A208. doi:10.1149/1.1499669
23. Yang L, Lucht BL (2009) Inhibition of electrolyte oxidation in
lithium ion batteries with electrolyte additives. Electrochem Solid
State Lett 12:A229–A231. doi:10.1149/1.3238486
24. Li L, Meng F, Jin S (2012) High-capacity lithium-ion battery
conversion cathodes based on iron fluoride nanowires and in-
sights into the conversion mechanism. Nano Lett 12:6030–6037.
doi:10.1021/nl303630p
25. Qiu SR, Yarmoff JA (2001) Self-limiting growth of transition-
metal fluoride films from the reaction with XeF2. Phys Rev B
63:1154091–1154097
J Mater Sci
123