Cyclic Simple-Shear Behavior of Sand-Steel Interfaces under Constant Normal Stiffness Condition
10
CYCLIC SIMPLE-SHEAR BEHAVIOR OF SAND-STEEL INTERFACES UNDER CONSTANT NORMAL STIFFNESS CONDITION By Kazem Fakharian 1 and Erman Evgin Z ABSTRACT: This paper presents the results of an experimental investigation on the cyclic behavior of a sand- steel interface under constant normal stress and normal stiffness conditions. The experiments were performed by using an automated interface testing apparatus called C3DSSI. A simple shear-type soil container was used to measure simultaneously the shear deformation of the sand mass and the sliding displacement at the interface. Two-way cyclic tangential-displacement-controlled experiments were performed under a constant normal stiff- ness condition to study the phenomenon of reduction in the maximum shear stress with cycles. This phenomenon is known to be the cause of degradation of shaft resistance in piles subjected to cyclic loading in the axial direction. Effects of the tangential-displacement amplitude and the magnitude of the normal stiffness on the cyclic response were investigated. It was concluded that the reduction in maximum shear stress was not only due to the reduction in the normal stress, but also to a greater extent due to the increased amount of mobilized sliding displacement at the interface with an increasing number of cycles. The reduction in maximum shear stress with cycles was dramatic when failure was experienced at the interface, Le., when the shear stress-normal stress ratio (T!crn) reached a peak value and subsequently approached a residual value. INTRODUCTION The load-deformation response of soil-structure systems is significantly influenced by the stress-displacement relations of interfaces between soils and structural materials. This is par- ticularly important in the case of systems subjected to cyclic loading conditions, such as those resulting from earthquakes, wind, or ocean waves. Numerous experimental studies have been reported in the literature about the behavior of interfaces under monotonic loading conditions. A detailed literature re- view on interface behavior and also a comparison of various available interface testing devices are given in Paikowsky et al. (1995). The data on the behavior of interfaces between soil and structural materials under cyclic loading conditions, how- ever, are rare, particularly under the constant normal stiffness boundary condition. Desai et al. (1985) employed a direct shear-type device in a series of two-way, small-amplitude tan- gential-displacement-controlled cyclic tests on interfaces be- tween Ottawa sand and concrete under constant normal stress conditions. Desai et al. (1985) concluded that for cohesionless soils, the interface response becomes stiffer with an increase in the number of cycles, and the rate of stiffening decreases as the number of cycles increases. Using a simple shear-type soil container, Uesugi et al. (1989) studied the cyclic behavior of an interface between Toyoura sand and a steel during one- and two-way tangential-displacement-controlled tests. Their results showed that even at small tangential-displacement am- plitudes, the shear stress at the interface could reach a peak value, equivalent to the peak strength of the same interface under monotonic loading conditions, and subsequently it would reduce to a residual value. Generally, a stress boundary condition is specified in the conventional interface experiments in which the normal stress applied on the interface plane is maintained constant through- out shearing. A conventional interface experiment would be appropriate for stability problems such as retaining walls and the stability of slopes. There are many practical problems, 'Res. Assoc., Dept. of Civ. Engrg., Univ. of Ottawa, Ottawa, Ontario KIN 6N5, Canada. 'Prof., Dept. of Civ. Engrg., Univ. of Ottawa, Ottawa, Ontario KIN 6N5, Canada. Note. Discussion open until May I, 1998. To extend the closing date one month, a written request must be filed with the ASCE Manager of Journals. The manuscript for this paper was submitted for review and possible publication on July 31, 1996. This paper is part of the Journal of Geotechnical and Geoenvironmental Engineering, Vol. 123, No. 12, December, 1997. ©ASCE, ISSN 1090-0241/97/0012-1096-1105/$4.00 + $.50 per page. Paper No. 13812. however, where the normal stress acting on the interface does not remain constant during shearing. For example, for a typical interface between a pile shaft and the surrounding soil, any volume change in the interface zone is constrained by the soil beyond this zone. In other words, the surrounding soil imposes a normal stiffness condition on the interface between the pile shaft and the soil. Consequently, the normal stress acting on the interface may increase or decrease, depending on whether the soil in the interface zone tends to compress or to dilate. For the analysis of this class of problems, it would be more realistic to use parameters obtained from constant normal stiff- ness tests rather than using parameters from constant normal stress tests. Failure of piles arising from the degradation of shaft resis- tance is recognized to be predominant under axial two-way cyclic loading conditions (Poulos 1989). The degradation of the shaft resistance was observed in model-scale tests as well as in full-scale field tests (e.g., Chan and Hanna 1980; Poulos 1981; Turner and Kulhawy 1989). Poulos (1989) attributed the degradation in shaft resistance to the compressibility of the soil. Particle crushing, volume changes due to shearing, and particle reorientation were considered to be the causes of large reductions in the soil's volume near the pile shaft. A reduction in volume leads to a reduction in the normal stress, and con- sequently, to a reduction in the maximum shear stress mobi- lized between the shaft and the soil. Airey et al. (1992) and Tabucanon et al. (1995) confirmed experimentally the preced- ing idea, expressed by Poulos (1989), by presenting two-way cyclic displacement-controlled tests on sand under constant normal stiffness conditions using a direct shear device. These investigations, however, were mainly focused on the calcare- ous sands because of their large compressibility. Similarly, Ooi and Carter (1987) performed constant normal stiffness tests on calcareous sediments and attributed the reduction in maximum shear stress to the compressibility of the sediments. Uesugi and Kishida (1991) argued that the governing factor for the degradation of the maximum shear stress is the magnitude of slip (sliding displacement) at the soil-pile interface. This state- ment was based on cyclic two-way tangential-displacement- controlled experiments on an interface between sand and steel using a simple shear-type soil container (Uesugi et al. 1989). In response to Uesugi and Kishida's discussion, Poulos (1991) stated that the degradation of shaft resistance depends not only on the reduction of the maximum shear-stress ratio, which is a function of the absolute cyclic slip displacement, but also on the reduction in normal effective stress at the interface, which results from the development of the volumetric strains 1096/ JOURNAL OF GEOTECHNICAL AND GEOENVIRONMENTAL ENGINEERING / DECEMBER 1997 J. Geotech. Geoenviron. Eng. 1997.123:1096-1105. Downloaded from ascelibrary.org by East Carolina University on 09/22/13. Copyright ASCE. For personal use only; all rights reserved.
Transcript of Cyclic Simple-Shear Behavior of Sand-Steel Interfaces under Constant Normal Stiffness Condition

CYCLIC SIMPLE-SHEAR BEHAVIOR OF SAND-STEEL INTERFACES
UNDER CONSTANT NORMAL STIFFNESS CONDITION
By Kazem Fakharian1 and Erman EvginZ
ABSTRACT: This paper presents the results of an experimental investigation on the cyclic behavior of a sandsteel interface under constant normal stress and normal stiffness conditions. The experiments were performedby using an automated interface testing apparatus called C3DSSI. A simple shear-type soil container was usedto measure simultaneously the shear deformation of the sand mass and the sliding displacement at the interface.Two-way cyclic tangential-displacement-controlled experiments were performed under a constant normal stiffness condition to study the phenomenon of reduction in the maximum shear stress with cycles. This phenomenonis known to be the cause of degradation of shaft resistance in piles subjected to cyclic loading in the axialdirection. Effects of the tangential-displacement amplitude and the magnitude of the normal stiffness on thecyclic response were investigated. It was concluded that the reduction in maximum shear stress was not onlydue to the reduction in the normal stress, but also to a greater extent due to the increased amount of mobilizedsliding displacement at the interface with an increasing number of cycles. The reduction in maximum shearstress with cycles was dramatic when failure was experienced at the interface, Le., when the shear stress-normalstress ratio (T!crn) reached a peak value and subsequently approached a residual value.
INTRODUCTION
The load-deformation response of soil-structure systems issignificantly influenced by the stress-displacement relations ofinterfaces between soils and structural materials. This is particularly important in the case of systems subjected to cyclicloading conditions, such as those resulting from earthquakes,wind, or ocean waves. Numerous experimental studies havebeen reported in the literature about the behavior of interfacesunder monotonic loading conditions. A detailed literature review on interface behavior and also a comparison of variousavailable interface testing devices are given in Paikowsky etal. (1995). The data on the behavior of interfaces between soiland structural materials under cyclic loading conditions, however, are rare, particularly under the constant normal stiffnessboundary condition. Desai et al. (1985) employed a directshear-type device in a series of two-way, small-amplitude tangential-displacement-controlled cyclic tests on interfaces between Ottawa sand and concrete under constant normal stressconditions. Desai et al. (1985) concluded that for cohesionlesssoils, the interface response becomes stiffer with an increasein the number of cycles, and the rate of stiffening decreasesas the number of cycles increases. Using a simple shear-typesoil container, Uesugi et al. (1989) studied the cyclic behaviorof an interface between Toyoura sand and a steel during oneand two-way tangential-displacement-controlled tests. Theirresults showed that even at small tangential-displacement amplitudes, the shear stress at the interface could reach a peakvalue, equivalent to the peak strength of the same interfaceunder monotonic loading conditions, and subsequently itwould reduce to a residual value.
Generally, a stress boundary condition is specified in theconventional interface experiments in which the normal stressapplied on the interface plane is maintained constant throughout shearing. A conventional interface experiment would beappropriate for stability problems such as retaining walls andthe stability of slopes. There are many practical problems,
'Res. Assoc., Dept. of Civ. Engrg., Univ. of Ottawa, Ottawa, OntarioKIN 6N5, Canada.
'Prof., Dept. of Civ. Engrg., Univ. of Ottawa, Ottawa, Ontario KIN6N5, Canada.
Note. Discussion open until May I, 1998. To extend the closing dateone month, a written request must be filed with the ASCE Manager ofJournals. The manuscript for this paper was submitted for review andpossible publication on July 31, 1996. This paper is part of the Journalof Geotechnical and Geoenvironmental Engineering, Vol. 123, No. 12,December, 1997. ©ASCE, ISSN 1090-0241/97/0012-1096-1105/$4.00+ $.50 per page. Paper No. 13812.
however, where the normal stress acting on the interface doesnot remain constant during shearing. For example, for a typicalinterface between a pile shaft and the surrounding soil, anyvolume change in the interface zone is constrained by the soilbeyond this zone. In other words, the surrounding soil imposesa normal stiffness condition on the interface between the pileshaft and the soil. Consequently, the normal stress acting onthe interface may increase or decrease, depending on whetherthe soil in the interface zone tends to compress or to dilate.For the analysis of this class of problems, it would be morerealistic to use parameters obtained from constant normal stiffness tests rather than using parameters from constant normalstress tests.
Failure of piles arising from the degradation of shaft resistance is recognized to be predominant under axial two-waycyclic loading conditions (Poulos 1989). The degradation ofthe shaft resistance was observed in model-scale tests as wellas in full-scale field tests (e.g., Chan and Hanna 1980; Poulos1981; Turner and Kulhawy 1989). Poulos (1989) attributed thedegradation in shaft resistance to the compressibility of thesoil. Particle crushing, volume changes due to shearing, andparticle reorientation were considered to be the causes of largereductions in the soil's volume near the pile shaft. A reductionin volume leads to a reduction in the normal stress, and consequently, to a reduction in the maximum shear stress mobilized between the shaft and the soil. Airey et al. (1992) andTabucanon et al. (1995) confirmed experimentally the preceding idea, expressed by Poulos (1989), by presenting two-waycyclic displacement-controlled tests on sand under constantnormal stiffness conditions using a direct shear device. Theseinvestigations, however, were mainly focused on the calcareous sands because of their large compressibility. Similarly, Ooiand Carter (1987) performed constant normal stiffness tests oncalcareous sediments and attributed the reduction in maximumshear stress to the compressibility of the sediments. Uesugiand Kishida (1991) argued that the governing factor for thedegradation of the maximum shear stress is the magnitude ofslip (sliding displacement) at the soil-pile interface. This statement was based on cyclic two-way tangential-displacementcontrolled experiments on an interface between sand and steelusing a simple shear-type soil container (Uesugi et al. 1989).In response to Uesugi and Kishida's discussion, Poulos (1991)stated that the degradation of shaft resistance depends not onlyon the reduction of the maximum shear-stress ratio, which isa function of the absolute cyclic slip displacement, but alsoon the reduction in normal effective stress at the interface,which results from the development of the volumetric strains
1096/ JOURNAL OF GEOTECHNICAL AND GEOENVIRONMENTAL ENGINEERING / DECEMBER 1997
J. Geotech. Geoenviron. Eng. 1997.123:1096-1105.
Dow
nloa
ded
from
asc
elib
rary
.org
by
Eas
t Car
olin
a U
nive
rsity
on
09/2
2/13
. Cop
yrig
ht A
SCE
. For
per
sona
l use
onl
y; a
ll ri
ghts
res
erve
d.

Soli
Staok of Alum. pia
Initial
position L~~iiiEEEEii!i!iii!~EE.iii.(
The stiffness in the direction normal to the interface is commonly denoted by K, and it is defined as the ratio of the variation in the normal stress to the variation in the normal displacement at the upper boundary of the sample, i.e., K = dajdv. Three typical boundary conditions (Fig. 3) are generallyused in laboratory experiments:
CONSTANT NORMAL STIFFNESS BOUNDARYCONDITION
A pneumatic actuator is used to apply the normal load onthe interface. The operation of this actuator is controlled by acomputer to impose a constant normal stress or a constantnormal stiffness condition, as described in the next section.
The tangential force in the x-direction is applied to the interface plane through a loading table by a computer-controlledball screw stepper motor that is capable of applying displacement or load-controlled cyclic or monotonic shear in thex-direction. The testing apparatus is described in more detailby Fakharian and Evgin (1996) and Fakharian (1996).
A simple shear box is used as the soil container, whichconsists of a stack of 2-mm-thick, anodized, Teflon-coated,square aluminium plates with an inside area of 100 X 100mm. The simple shear box is placed on the steel plate, whichhas an area of 300 X 300 mm. Because the steel plate is longerthan the sand surface, the area of contract surface remainsconstant during sliding. Conceptually, this design is similar tothat of the simple shear box used by Uesugi and Kishida(1986). A thin layer of foam covered with a Teflon sheet ispasted to the bottom surface of the bottom aluminium plate toprevent leakage of the sand particles during shearing. No leakage is observed during any monotonic or cyclic experiments.
Two tangential displacements are measured to distinguishbetween the sliding displacement along the contact surface andthe displacement resulting from the shear deformation of thesoil mass. The tangential displacements are measured by twolinear variable differential transducers (LVDTs). Fig. 2 illustrates the schematic diagrams of tangential displacements inthe x-direction. The total tangential displacement, Uxa' is measured between the top aluminum plate and the steel plate bythe LVDT, ax. The tangential displacement resulting from theshear deformation of the soil mass, Uxb, is measured by theLVDT, b" which reads the relative tangential displacement between the top and bottom aluminium plates. The sliding displacement at the soil-steel interface, u" is obtained from Ux =Uxa - Uxb (Fig. 2).
Case I. K = 0, i.e., dan = 0; dv '# 0 (constant normalstress).
• Case II. K = 00, i.e., dan '# 0; dv =0 (constant volume).• Case III. K = constant, i.e., dan '# 0; dv'# 0 and dan/dv
=K (constant normal stiffness).
FIG. 2. Schematic Diagrams of Tangential Displacements
lII( ) (Horizontal dlsplaoement)
Stepper Motor,x-Direction
Load Cell,x-Direction
Pneumatic Actuator
VerticalLoad Cell
Ball BushingBearing
/Bottom Plate
Bottom
APPARATUS
The interface apparatus is illustrated schematically in Fig.1. Three orthogonal forces can be applied simultaneously onthe interface plane to induce the normal stress, an, in the zdirection, and the shear stresses, 'T'x and 'T'y, in the x- and ydirections, respectively. In this study, the tests were performedin the z-x plane, and therefore, reference will only be made tothe normal stress, am and shear stress, 'T'X'
Top Plate
during cyclic shearing. Poulos (1991) also states that in compressible soils such as calcareous sands, the latter componentmay dominate, and in less compressible soils, the former component may become more significant.
The main objective of this paper is to investigate the relativeimportance of the governing factors influencing the degradation of maximum shear stress acting on an interface betweensilica sand and a steel plate subjected to two-way tangentialdisplacement-controlled cycles. A recently developed interfaceapparatus, C3DSSI (Evgin and Fakharian 1996; Fakharian1996; Fakharian and Evgin 1996), is employed in the investigation of the degradation phenomenon. A simple shear-typesoil container used in C3DSSI permits separate measurementsof the sliding displacement at the interface and the simpleshear deformation of the soil mass. A closed-loop computercontrolled pneumatic actuator is employed to simulate the constant normal stiffness and constant normal stress boundaryconditions. Therefore, this apparatus is a suitable device forinvestigating simultaneously the two previously mentionedcauses of degradation of the maximum shear stress.
A brief description of C3DSSI, the boundary conditions, andthe materials used in the experiments are presented first. Theresults of a monotonic test under constant normal stress conditions are presented as a reference case for the presentationof the cyclic test results. Then the results of a constant normalstress cyclic test are presented. Subsequently, the results of aseries of two-way cyclic tangential-displacement-controlledconstant normal stiffness tests are discussed to evaluate theeffects of the tangential-displacement amplitude and the magnitudes of the normal stiffness on the degradation of the maximum shear stress.
FIG. 1. Schematic View of C3DSSI Case I is a representation of the condition in which the
JOURNAL OF GEOTECHNICAL AND GEOENVIRONMENTAL ENGINEERING 1DECEMBER 1997/1097
J. Geotech. Geoenviron. Eng. 1997.123:1096-1105.
Dow
nloa
ded
from
asc
elib
rary
.org
by
Eas
t Car
olin
a U
nive
rsity
on
09/2
2/13
. Cop
yrig
ht A
SCE
. For
per
sona
l use
onl
y; a
ll ri
ghts
res
erve
d.

TEST MATERIALS
FIG. 3. Boundary Conditions In Direction Normal to Interface:(a) Constant Normal Stress; (b) Constant Volume; (c) ConstantNormal Stiffness (K= dunldv)
4
... j .!i
...J ...i
..__ ! .
31.4
Total Tangential Displacement, Uxl (mm)
[; I..................1"...... ············T············
iiiI I :
··I·················+···················!······
,
f···················1···········
~au
... 80
l 40
JI/) 20
00
(a)
0.8
E 0.4g>
-4.20 1 1.4 2 3 ..
(b) Total Tangential Displacement, Ux. (mm)
100
Peak
'iii 80
"'--~ --... SO
l 40lli1!I/) 20
!
l 0.2 CIotk>n ~~~i~i·orm.ldmu,;;·~;;;·~bi~ii~·~· ..·t'l 0.0 ·-~r·I + + +-.. ·1
00n'IlI.11on
00
0.62 3 ..
(e) Slicing Dlaplacement, Ux (mm)
100
Peak.. 80 til~... 80
I 40 .............
JI/) 20
mm. An average surface roughness, Rmaxo 25 J.Lm for a gaugelength, L =0.8 mm, was created by sand blasting. The valueRmax is the average of 10 measurements along the direction ofinterface shearing. The selected gauge length, L, was the closest available value to the mean grain size of the sand, D~o =0.6 mm, on the surface profile tester device used. The relativedensity of the sand was 88% at the beginning of each testthroughout the experimental program.
TEXT RESULTS
Monotonic Test
The results of a typical monotonic test are presented in Fig.4. The sample was sheared under a constant normal stress, an>
100 r-----;---,---,--,.----,
(d) Shear Deformation of Sand, Uxb (mm)
FIG. 4. Results of Monotonic Test under Constant NormalStress of 100 kPa (Benchmark Test)
K=ConstantK= 00K=O
(J n = ConstantI I I I I I I I I I I I Fixed Boundary ~ ~ I ~ I I ~ I ~ I
soil \ I soil I I soil Istructure ._IIIIIIIII~stlllllrulllct!llulllllre-lIIIIIIIII. structure
L..--F-/x":e:::'d::;B:":ou::'n::'d-ary---' Fixed Boundary Fixed Boundary
Interface
normal stress does not change during the process of shearingas shown in Fig. 3(a). In this case, the interface may compressor dilate freely (dan = 0; dv ¢ 0).
Case II is the condition of constant volume. No displacement is allowed at the upper boundary of the sample in thedirection normal to the interface plane as illustrated in Fig.3(b). During the test, the normal stress increases or decreasesdepending on the tendency of the soil to dilate or compress(dan ¢ 0; dv = 0).
Case III is the condition of constant normal stiffness [Fig.3(c)], in which normal stress and normal displacement varyproportionally where the proportionality constant is denotedby K(dajdv = K). Cases I and II are the lower and upperbounds of case III, respectively. In most of the available interface testing devices, a simply supported reaction beam isused to impose the constant normal stiffness condition. Thedesired stiffness is achieved by varying the span or momentof inertia of the beam.
In C3DSSI, the boundary conditions in the direction normalto the interface are imposed by a computer-controlled system,which includes a pneumatic actuator, a motorized regulator, aload cell, an LVDT, and a closed-loop computer control unit.The stiffness, K, is specified as a set point. The computer control unit varies the pressure in the pneumatic actuator such thatthe ratio between the variation in the normal stress and thevariation in the normal displacement is kept constant at the setpoint, K. A correction is made in the set point to account forthe compliance of the testing device.
The specified normal stiffness is externally imposed on boththe sand mass and the interface. Therefore, the changes takingplace in the normal displacement within the sand mass duringshearing interfere with the imposed normal stiffness intendedfor the interface alone. One of the advantages of the computercontrolled systems, to impose normal stiffness condition, isthat by having the variations of the normal displacement inthe sand mass at different normal stress levels, it would bepossible to make corrections in the magnitude of the appliedexternal boundary condition to impose the desired stiffness onthe interface itself. In this study, however, such correctionswere not made and the normal stiffness imposed represents anaverage value for the sand mass and interface together.
The tests were conducted on an interface between dry medium crushed silica sand and a rough steel plate. The meangrain size, minimum void ratio, and maximum void ratio ofthe sand were 0.6 mm, 0.651, and 1.024, respectively. Thesand was rained on the steel plate by using the multiple-sieving-pluviation method described by Miura and Toki (1982),with some modifications (Fakharian and Evgin 1996). Thesand surface was leveled off by means of suction so that theinitial height of the sand sample was always 20 mm. Thecrushed silica sand had angular grains. The internal frictionangle, <p, was measured 450 at the peak in a direct shear testunder a constant normal stress of 100 kPa and an initial relative density of 88%.
The steel plates, made of low carbon steel, were 300 X 300
1098/ JOURNAL OF GEOTECHNICAL AND GEOENVIRONMENTAL ENGINEERING / DECEMBER 1997
J. Geotech. Geoenviron. Eng. 1997.123:1096-1105.
Dow
nloa
ded
from
asc
elib
rary
.org
by
Eas
t Car
olin
a U
nive
rsity
on
09/2
2/13
. Cop
yrig
ht A
SCE
. For
per
sona
l use
onl
y; a
ll ri
ghts
res
erve
d.

"55
0.5ooQ.5
oQ.1 0 0.5
Sliding Ollplecement, u,. (mm)
oQ.1 0 0.1
TotIIl Tengentlel Ollpl., u.. (mm)
Sheer Deform. of Send, u", (mm)
-100 L....~_.L....._..............__......._~.....
-1
(a)
I 10
~
iii0j
I -10III
-100-1
(c)
100
'iii~
50
~
<Ii
~ 0IiiIi -50.&;III
-100
·1
(d)
100 r----.,---,..---.,..--;:--..,
0.2 r----;-,-----;1-----;'---'
i::=~-m',;I oQ.1 h..h'"'C:i j.h L:::=- 55
. 1 .!oQ.8 L....~_l.-o- .............J.............................._ .......
-1 oQ.1 0 0.5
(b) TotIIl Tengentlel Ollpl., U.. (mm)
100 ,..---;-----"
FIG. 5. lWo-Way Tangentlal-Dlsplacement-Controlled CyclicTest under Constant Normal Stress Condition
I 10~
IJ -10
cycle, reached a peak of 83.0 kPa at cycle 12, after which theshear stress decreased and stabilized at 60.0 kPa. The rapidchanges in the shear stress continued up to about 30 cyclesequivalent to 6000 s, after which the shear stress decreasedgradually toward the residual value of 60.0 kPa.
Figs. 7(a)-7(c) illustrate the changes taking place in thetotal tangential displacement, the displacement resulted fromthe shear deformation of the sand mass, and the sliding displacement as a function of time, respectively. During the firstcycle, the amplitude of the displacement resulting from theshear deformation of the sand mass was 0.5 mm, i.e., 2/3 ofthe total-displacement amplitude of 0.75 mm. As the numberof cycles increased, the shear-deformation amplitude for thesand mass reduced and the sliding-displacement amplitude atthe interface increased. The amplitude of displacement result-
of 100 kPa at a total tangential displacement rate of 1 mmlmin. The normal displacement measurements included thecombined effects of the normal displacement in the interfacezone and in the remaining portion of the sand mass. The peakand residual shear strengths were 80.3 and 62.0 kPa, respectively. If the application of the tangential displacement wascontinued, the residual strength would possibly continue toreduce to about 60 kPa for the described interface. The peakshear strength was reached at a total tangential displacement,UXQ ' of 1.4 mm.
The total tangential displacement, Uxa, includes the slidingdisplacement, ux , and the displacement due to the shear deformation of sand, Uxb (Note: the tangential displacement due tothe shear deformation of the sand mass, Uxb, is indicated inshort form as "shear deformation of sand" in Figs. 4-10). Itwas observed that the major portion of the displacements dueto shear deformation of sand took place before the peak shearstrength was reached [Fig. 4(d)]. Thereafter, the shear deformation of the sand mass was negligibly small while the slidingdisplacement at the contact surface continued [Fig. 4(c)]. Thisobservation indicated that (1) the contribution of the sand massto the normal displacement becomes negligible after the peakshear stress, because the shear deformation does not changesignificantly thereafter; and (2) the shear strength of the soilmass was higher than the shear strength at the interface, otherwise, the shear failure would have occurred within the sandmass. The measured peak shear strength of the sand mass at88% initial relative density was 100 kPa under (J'n of 100 kPa,which was 20% higher than the shear strength of the interface.The peak shear strength was reached at a sliding displacementof 0.6 mm. At this point, the displacement due to the sheardeformation of the sand mass was 0.8 mm. The summation ofthese two values resulted in the total tangential displacementof 1.4 mm, as shown in Fig. 4(a).
Two-Way Cyclic Test under Constant Normal Stress
Based on a series of two-way displacement-controlled cyclictest results, Uesugi et al. (1989) and Uesugi and Kishida(1991) concluded that the dominant factor in the degradationof the maximum shear stress at a sand-steel interface was theamount of sliding displacement at the interface. These testswere conducted under constant normal stress conditions usinga simple shear box. Their results were especially important forthe case of small displacement amplitudes, demonstrating thatthe peak strength could be reached and softening could occureven at tangential-displacement amplitudes smaller than thatrequired to mobilize the peak strength in a monotonicallysheared interface. Similar experiments were conducted in thisstudy to further examine this phenomenon and to establish abasis for evaluating the experimental results under the condition of constant normal stiffness.
The results of a representative test are presented in Figs.5- 7. The normal stress was set at a constant value of 100 kPathroughout cycling, and the total number of cycles was 55 ata frequency of 11200 Hz. The amplitude of the total tangentialdisplacement was set at 0.75 mm, which was smaller than thetotal tangential displacement, Uxa , of 1.4 mm at the peakstrength for a monotonic test on the same interface [Fig. 4(a)].It was observed that the amplitudes of the sliding displacementat the interface, UX ' and the displacement resulting from theshear deformation of the sand mass, Uxb' varied with the cycles,as illustrated in Figs. 5(c) and 5(d), respectively. A gradualcompression was observed in the sand mass in such a mannerthat the rate of compression decreased with an increase in thenumber of cycles [Fig. 5(b)].
The plots of shear stress versus time (Fig. 6), illustrate thatthe peak strength was reached at cycle 12. It is observed thatthe maximum shear stress, which was 72.0 kPa during the first
JOURNAL OF GEOTECHNICAL AND GEOENVIRONMENTAL ENGINEERING / DECEMBER 1997/1099
J. Geotech. Geoenviron. Eng. 1997.123:1096-1105.
Dow
nloa
ded
from
asc
elib
rary
.org
by
Eas
t Car
olin
a U
nive
rsity
on
09/2
2/13
. Cop
yrig
ht A
SCE
. For
per
sona
l use
onl
y; a
ll ri
ghts
res
erve
d.

0.15
0.5o
o
-0.5
-0.15
Totll Tlngentlll Olspl., u.. (mm)
o .
o ,...--~--~~--.,...---.
·200
·1
-0.1-1
ES·U>
1-0.4Q
J-0.1
IJ·100
(a)
are skewed upward. During the initial shearing of the interface(upward or positive direction of x on the uxb-axis), some rearrangement occurs within the sand mass due to shearing,causing some plastic deformation of the sand mass. This plastic deformation is not fully recoverable during reverse shearing(downward or negative direction of x on the uXb-axis). Thus,the variations of the shear deformation component are shiftedslightly upward in Fig. 7(b).
TwO-Way Cyclic Tests under Constant NormalStiffness
The results of a typical test are presented in Figs. 8-13, toidentify the main characteristics of the behavior of a sand-steel
200 ,...---jr-----;---.,.--..,
II ,··..······..····..··1··..··············..·····
12000
12000
12000
10000
10000
10000
1000
10001000
1000
nml(Sec.)
..,00
4000 1000 1000
Time (Seconds)
..,00
2000
2000
2000
-0..
(a) ·1
.1.0 1-__...... ..L-__---i. ...J....__---' ...J
(c)
0.1
-0.1 f·e ..; + I··········· ·········•··· + !!.......•...............······1
I 0.0
~
0.1 r················=r==~~~;ittrniTI'~·1
0.1 ~IT.;·;·i·i·i·;·;·L~~::::T=:~=:¢'·······! j I
FIG. 6. Variations of Shear Stress with Time for Results of Fig.S
•100 1-__--l.. ....L. l...-__...... ...J....__.......J
-110
"i 0..
10
(b)'1 1----200.J..0---..,.J.00---1..J.00-0--~IO...l00---1....1000-0--~1...J2ooo
1.0 r-(~::=============-,-----,---"
100 ,...-----r~
-0.. f······· :..,.,' ,u·H
FIG. 7. Variations of Tangential Displacements with Time forResults of Fig. S (ux• = Ux + UXb)
(b) Total Tangential Olspl., u.. (mm)
200 ,...-----.,.--....,....--...,....----,
0.15
0.15
o
o
-0.15
-0.15
-200 ..................~~-'-.......................................
·1
·200 ...............-'-...............-'-...............- ......................
-1
Ii 100~....<Ii
0~i
·100~
'"
i 100 f ....··..·..........·i......··· ....·........f"
....
(c) Sliding Displacement, u, (mm)
! ·1 00 ~ " ! .
o ~ + .
(d) Shear Deform. of sand, u"" (mm)
200 ,...-----,---,--....,..--..,
FIG. 8. 1\No-Way Totsl Tangential-Displacement-ControlledTest Results under Constant Normal Stiffness Condition
ing from the shear deformation reduced to 0.07 mm [Fig.7(b)], and the sliding-displacement amplitude increased to 0.68mm [Fig. 7(c)], thereafter they remained at these values. Stabilization took place after about 30 cycles, which is equivalentto 6000 s. This was about the same amount of time after whichthe shear stress variations became negligible in Fig. 6. Theseobservations agree qualitatively well with the results reportedby Uesugi et al. (1989).
It was observed that at a total tangential-displacement amplitude of 0.75 mm, which is smaller than the 1.4-mm displacement required for the peak strength to develop in a monotonic test, the mobilized maximum shear stress increased withan increase in the number of cycles. Eventually, however, afterthe peak strength was reached, the maximum shear stressstarted decreasing with an increase in the number of cycles,and after a certain number of cycles, the hysterisis curves converged to a loop, equivalent to the residual shear strength ofthe interface in monotonic shearing. The stiffening of the sandmass with cycles, adjacent to the interface [Fig. 5(b)], and thusa gradual decrease in the amplitude of the shear deformationwith cycles [Figs. 5(d) and 7(b)], caused the amplitude of thesliding displacement of the interface to increase [Figs. 5(c) and7(c)]. A sufficient increase in the sliding-displacement amplitude caused the mobilization of the peak strength, followed bya strength reduction to a residual value. It is also observed inFig. 7(b) that the variations of the displacement related toshear deformation of the sand, Uxb, are not symmetrical and
1100 / JOURNAL OF GEOTECHNICAL AND GEOENVIRONMENTAL ENGINEERING / DECEMBER 1997
J. Geotech. Geoenviron. Eng. 1997.123:1096-1105.
Dow
nloa
ded
from
asc
elib
rary
.org
by
Eas
t Car
olin
a U
nive
rsity
on
09/2
2/13
. Cop
yrig
ht A
SCE
. For
per
sona
l use
onl
y; a
ll ri
ghts
res
erve
d.

200 ~---,----,---....,...----.
0.5o-0.5
Totel Tangential Dlspl., u. (mm)
..I
tS 0.5...I-'01: 0lX:
j -0.5
-1
·1
(a)
0.5o-0.5Total Tangentiel Displ., u. (mm)
-200 L...-...............J ...............l........._ .........~.........J
-1
(a)
.. 100 ~ + ; >,r..
~I-'
I 0
! -100
-0.8
·1Total Tangential Displ., u. (mm) 0.6o-0.6
.1 L...-.........................~........~~........~................
·1
0-
i 0lX:
!fn -0.6
tS 0.6 r···············t·····,~~;'
0.6o-0.6
········~Cycle11~ i~1.....................". ..; ~.... cycle 50. .
o
E.§. -0.2>
~ -0.4isIi
~ -0.6
(b)
200 ...----,,----..,----,.--....,(b) Sliding Displacement, u. (mm)
..(
0.6o-0.6
Shear Deform. of sand, u.., (mm)
,..----,--......,.--......,., cycle 11
~(pe8k)
... i.., ...J, cycle 1
-1 L..-<-........................~................_ ...........................
-1
tS 0.6 cycle 50...I-'
i- i0 ····················t..·····lX:..
j,
-0.6 ....................;...
(e)
FIG. 10. Stress Ratio Variations at Cycles 1, 11 (peak), and 50;Normalized Results of Fig. 9
50 kPa, respectively). A substantial reduction is observed inthe maximum shear stress with an increase in cycles. The mobilized shear stress, which was 170 kPa at the displacementamplitude of 0.75 mm during the first cycle, dropped to 50kPa in the 50th cycle.
The shear stress was normalized by the corresponding normal stress and was plotted against tangential displacements asillustrated in Fig. 10. The variations of the stress ratio, T/(J'",
with the total tangential displacement, sliding displacement,and shear deformation of the sand mass exhibited the sametrend as the results of the constant normal stress tests (Fig. 5).The mobilized stress ratio, T/(J'", which was 0.61 at the maximum tangential displacement during the first cycle, increasedto 0.8 at cycle 11, and subsequently decreased and reached aresidual value of 0.61. Despite the fact that the maximumshear stress decreased from the beginning of the cycles, thestress ratio followed exactly the same pattern as in a typicaltwo-way displacement-controlled cyclic test with a constantnormal stress.
The results also indicate that the sliding displacement at theinterface and the displacement due to the shear deformationof the sand mass underwent the same variations as in the caseof constant normal stress tests. With an increase in the numberof cycles, the amplitude of the displacement resulting from theshear deformation of the sand mass, Uxb, decreased while the
cycle50
0.6
cycle 1
Icycle 11
I. ·····1· cycle 50
o
o
-0.6
-0.6
Sliding Displacement, u. (mm)
200 .------,,----..,----,.--....,
-200 l-o-.........................~........~........................~......
-1
.200 L..-<-. ...........
-1
o ~··················+·····I..,
.. 100~I-'..
0~tii:
·100J:;en
(e)
! -100
..~ 100 ~ ; +/
I-'
interface under a constant normal stiffness condition in twoway total tangential-displacement-controlled tests. The testingprocedure was the same as that presented under a constantnormal stress condition, except that a constant normal stiffness, K, of 400 kPalmm was imposed in the direction normalto the interface plane. The initial normal stress, (J'",,, was 300kPa. The specimen was subjected to 50 cycles of displacements at a frequency of 1/200 Hz with a total tangential-displacement amplitude of 0.75 mm.
Fig. 8 shows that the maximum shear stress reduced withan increase in the number of cycles in such a way that the rateof reduction was higher within the first few cycles. Fig. 9illustrates the plots for cycles I, II, and 50 (T = 170, 109, and
(d) Shear Deform. of sand, u.. (mm)
FIG. 9. Shear-Stress Variations at Cycles 1, 11, and 50 for Results of Fig. 8
JOURNAL OF GEOTECHNICAL AND GEOENVIRONMENTAL ENGINEERING / DECEMBER 1997/1101
J. Geotech. Geoenviron. Eng. 1997.123:1096-1105.
Dow
nloa
ded
from
asc
elib
rary
.org
by
Eas
t Car
olin
a U
nive
rsity
on
09/2
2/13
. Cop
yrig
ht A
SCE
. For
per
sona
l use
onl
y; a
ll ri
ghts
res
erve
d.
300240
7eak!strength ratio
120 18060
-1 .....""--~..J--'-_---'-~~_'-"-...........L...-'-_......
oNormal Slress, O'n (kPa)
FIG. 13. Stress Paths In Tlun - un Space
-0.5 """,,,,,.,,,,.,,,,,,,
'€I i
(0.8 ----+--(:.:1 ..,,71
Residualstrength
ratio-~
-10 10 120 110 240 300
(a) Normal Slress, O'n (kPa)
cycle 11(failure)
cycle 50--0.5
t5--~ci 0'Iii
Cl:on
~-0.5
(b)
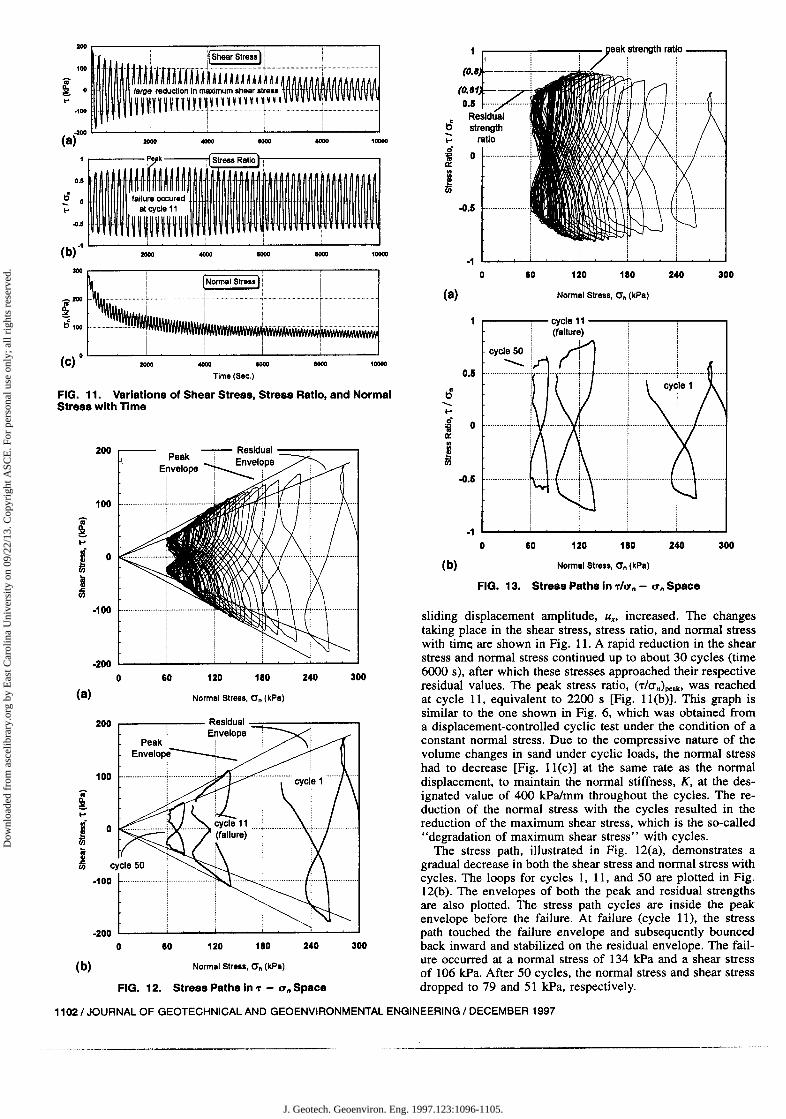
sliding displacement amplitude, ux , increased. The changestaking place in the shear stress, stress ratio, and normal stresswith tim~ are shown in Fig. 11. A rapid reduction in the shearstress and normal stress continued up to about 30 cycles (time6000 s), after which these stresses approached their respectiveresidual values. The peak stress ratio, (7/0'n)peak' was reachedat cycle 11, equivalent to 2200 s [Fig. 11(b»). This graph issimilar to the one shown in Fig. 6, which was obtained froma displacement-controlled cyclic test under the condition of aconstant normal stress. Due to the compressive nature of thevolume changes in sand under cyclic loads, the normal stresshad to decrease [Fig. II(c») at the same rate as the normaldisplacement, to maintain the normal stiffness, K, at the designated value of 400 kPalmm throughout the cycles. The reduction of the normal stress with the cycles resulted in thereduction of the maximum shear stress, which is the so-called"degradation of maximum shear stress" with cycles.
The stress path, illustrated in Fig. 12(a), demonstrates agradual decrease in both the shear stress and normal stress withcycles. The loops for cycles I, 11, and 50 are plotted in Fig.12(b). The envelopes of both the peak and residual strengthsare also plotted. The stress path cycles are inside the peakenvelope before the failure. At failure (cycle 11), the stresspath touched the failure envelope and subsequently bouncedback inward and stabilized on the residual envelope. The failure occurred at a normal stress of 134 kPa and a shear stressof 106 kPa. After 50 cycles, the normal stress and shear stressdropped to 79 and 51 kPa, respectively.
300
300
240
240
110
180
120
120
80
60
-,- Residual --..,.---...,Peak I Envelope
E~velope~!! Ii 'i
i
..........L .j
PeakEnvelope~
2000 - 1000 1000 10000
'~HIT~~~HSlress Ratio
..
failure occuredalcycle 11
i'nnnn~l" I ...
2000 4000 1000 1000 10000
I'Normal Stress II i,I ....!....... ,
"! ·················1!!
.. 1. .. ... ·····················t··
2000 - 1000 1000 10000
Time (Sac,)
o
200
FIG. 12. Stress Paths In T - Un Space
Normal Slress, O'n (kPa)
Normal Slress, O'n (kPa)
200 ...----,--- Residual =r:---...,----,Envelope
100 "..."...,,'
100
cycle 50
-100 ~ ·..·,,"",,·+·· · 1i· d
-200 L.-~_--'-~_---J'--_~....L...~~--'-__.........
o
.200 L.-",,--~...i--,-_--i-~~---'~~'--J...-......._..J
o
-1 00 ~""'"'''''''''''' !".""""."""."..,
200 r---"------,,;===:::;:1'---11.----,! il Shear SlressIi.
.... "HHlnnnnlA AAiAAAAA1A~i;·~~·~~~l;large reduction In maximum shear stress .
lUllUIBJll!l~l~'!V VVlr ' ! VVI I II ill ~ VVVVVV
I !
100
(a)
OJ
·100
(b)
.0.5
SOOh--!--~==:::;:::::::;:r--!--1
~ a..
FIG. 11. Variations of Shear Stress, Stress Ratio, and NormalStress with Time
1102/ JOURNAL OF GEOTECHNICAL AND GEOENVIRONMENTAL ENGINEERING I DECEMBER 1997
.. - ..,._...__._-------------
J. Geotech. Geoenviron. Eng. 1997.123:1096-1105.
Dow
nloa
ded
from
asc
elib
rary
.org
by
Eas
t Car
olin
a U
nive
rsity
on
09/2
2/13
. Cop
yrig
ht A
SCE
. For
per
sona
l use
onl
y; a
ll ri
ghts
res
erve
d.
i Stre.. Ratio
10000
10000
10000
8000
8000
....
8000
8000
.aDO 8000
Time (Sec.)
2000
2000 .aDO
2000
100
aool--i----r-;::==~::::r--T--Ii ! Shear Stress
~. ~l·~·~··~·~··~·l~·l~In·n·n~·J ···~··~T~··~·~·····
.100
".s
.. moderate reduction in maximum shear sire..
~nUl~.l~l~~i~··UJltUl'rU.1JJJJ! ! !-2Q0L .L- -'- ..L- ...L -'
(a)
D••
~ ...HHHno failure
ij~ijHijl.1 l- ..l...- -'- ....L... -J... ......J
(b)
Effect of Displacement Amplitude
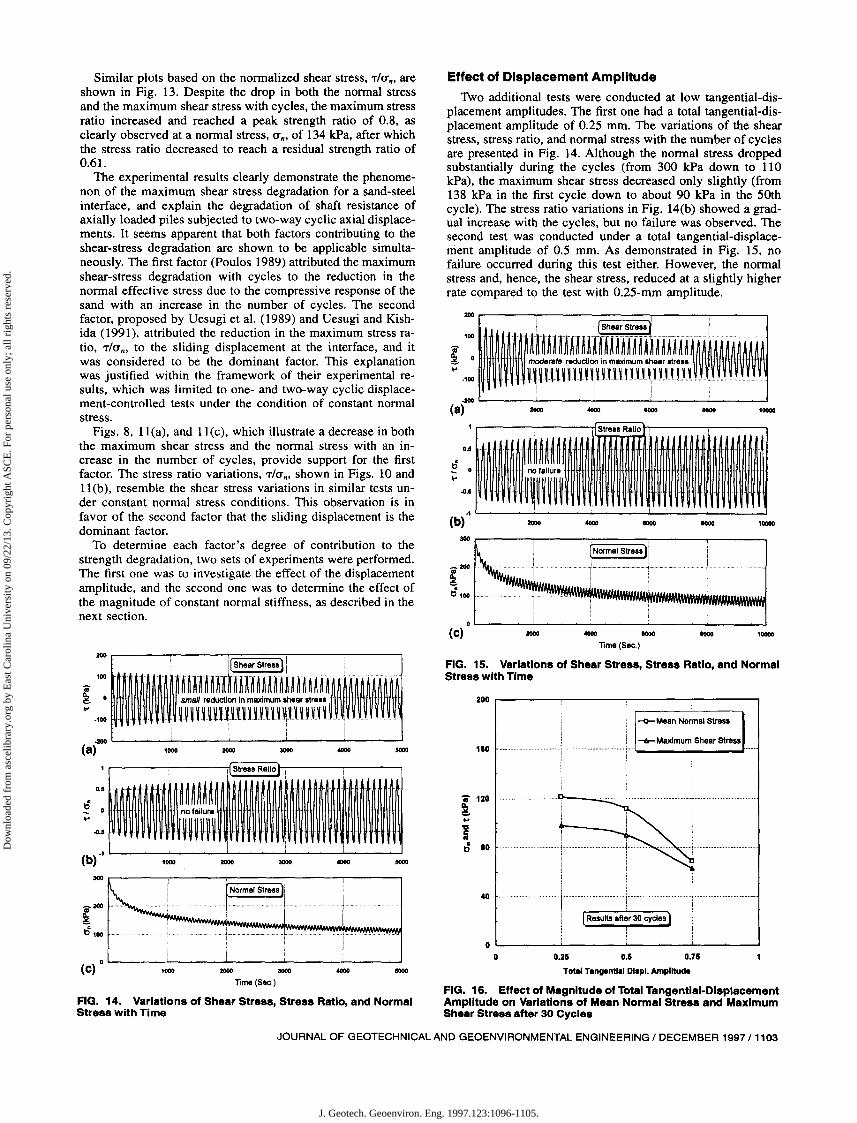
Two additional tests were conducted at low tangential-displacement amplitudes. The first one had a total tangential-displacement amplitude of 0.25 mm. The variations of the shearstress, stress ratio, and normal stress with the number of cyclesare presented in Fig. 14. Although the normal stress droppedsubstantially during the cycles (from 300 kPa down to 110kPa), the maximum shear stress decreased only slightly (from138 kPa in the first cycle down to about 90 kPa in the 50thcycle). The stress ratio variations in Fig. 14(b) showed a gradual increase with the cycles, but no failure was observed. Thesecond test was conducted under a total tangential-displacement amplitude of 0.5 mm. As demonstrated in Fig. 15, nofailure occurred during this test either. However, the normalstress and, hence, the shear stress, reduced at a slightly higherrate compared to the test with 0.25-mm amplitude.
Similar plots based on the normalized shear stress, -r/0"., areshown in Fig. 13. Despite the drop in both the normal stressand the maximum shear stress with cycles, the maximum stressratio increased and reached a peak strength ratio of 0.8, asclearly observed at a normal stress, 0".. of 134 kPa, after whichthe stress ratio decreased to reach a residual strength ratio of0.61.
The experimental results clearly demonstrate the phenomenon of the maximum shear stress degradation for a sand-steelinterface, and explain the degradation of shaft resistance ofaxially loaded piles subjected to two-way cyclic axial displacements. It seems apparent that both factors contributing to theshear-stress degradation are shown to be applicable simultaneously. The first factor (Poulos 1989) attributed the maximumshear-stress degradation with cycles to the reduction in thenormal effective stress due to the compressive response of thesand with an increase in the number of cycles. The secondfactor, proposed by Uesugi et al. (1989) and Uesugi and Kishida (1991), attributed the reduction in the maximum stress ratio, -rIO".. to the sliding displacement at the interface, and itwas considered to be the dominant factor. This explanationwas justified within the framework of their experimental results, which was limited to one- and two-way cyclic displacement-controlled tests under the condition of constant normalstress.
Figs. 8, ll(a), and II(c), which illustrate a decrease in boththe maximum shear stress and the normal stress with an increase in the number of cycles, provide support for the firstfactor. The stress ratio variations, -rIO".. shown in Figs. 10 and11 (b), resemble the shear stress variations in similar tests under constant normal stress conditions. This observation is infavor of the second factor that the sliding displacement is thedominant factor.
To determine each factor's degree of contribution to thestrength degradation, two sets of experiments were performed.The first one was to investigate the effect of the displacementamplitude, and the second one was to determine the effect ofthe magnitude of constant normal stiffness, as described in thenext section.
200 .....----_....----...,.-----;------,
FIG. 15. Variations of Shear Stress, Stress Ratio, and NormalStress with Time
aoo~ Shear Stress) I
100
~k~~n~nlnnnn~ ~ln~~A· i
m
N~ small reduction In maximum shear stres~ II..f ~ ~ ~ ~~UUVIUUJl~~1IHH1 ...·100 "f'"
I . ;i--(a) 1000 2000 3000 .aDO 5000 180 .........!.-..
I
-0- Mean Normal Stress
.i ...-6-__MaxI_rn_urn......Sh_8_ar_S_tre_ssJ
FIG. 14. Variations of Shear Stress, Stress Ratio, and NormalStress with Time
~.Normal Stress
,
f·
I
i Stress Ratio i !I
~AU~~no failure
111~l~lHI
i
2000 3000
Tlma (Sec,)
I:
..........\ .........••• ~ ...••..j•.....
[ Results 8fter 30 cycles )II
.. ·······1··
~-I
··········1··········
II
40
.. 120
l..Jb 10
OL ~_~_~i.-_~_~_~_~
o 0.28 O.S US
Total Tangential Ol.pl. Amplituda
FIG. 16. Effect of Magnitude of Total Tangential-DisplacementAmplitude on Variations of Mean Normal Stress and MaximumShear Stress after 30 Cycles
llOOO
5000
300020001000
1000
".1
...(b) .1
(c) •
•.1
E 0..
JOURNAL OF GEOTECHNICAL AND GEOENVIRONMENTAL ENGINEERING / DECEMBER 1997/1103
J. Geotech. Geoenviron. Eng. 1997.123:1096-1105.
Dow
nloa
ded
from
asc
elib
rary
.org
by
Eas
t Car
olin
a U
nive
rsity
on
09/2
2/13
. Cop
yrig
ht A
SCE
. For
per
sona
l use
onl
y; a
ll ri
ghts
res
erve
d.

.............
(K =200 kPalmmI'·············......··············..···tI
II
....
3OOr---i---r::===:::::=:::=:==\--T-----,
The degradation of the maximum shear stress for differentvalues of the total tangential displacement is shown in Fig. 16,which includes results of the three cyclic tests with displacement amplitudes of 0.25, 0.50, and 0.75 mm. Fig. 16 showsthe plots of the mean normal stress and maximum shear stressafter 30 cycles, at which a large portion of the degradationhad already taken place, against the total tangential-displacement amplitudes. There is not much difference between theresults of the tests at 0.25- and 0.5-mm amplitudes. This isattributed to the fact that no failure occurred at those amplitudes at the interface [Figs. 14(b) and 15(b)]. At the displacement amplitude of 0.75 mm, a substantial reduction took placein both the normal and shear stresses, which is related to thefailure of the interface at cycle 11.
These experimental results demonstrate how the amplitudeof the total tangential displacement affects the degradationphenomenon. If the sliding displacement does not accumulatewith cycles, no degradation will occur in the stress ratio. Themaximum shear stress, however, will still reduce even when afailure does not occur, because of a decrease in the normalstress due to the compression of the sand.
Effect of Magnitude of Normal Stiffness
.....
1800
....
-+-Maxlmum Shear Stress
-0-Mean Nannal Stress
.... ....Time (Sec.)
400 aoo 1200
Nannal 81Iffn•••• K (kPalmm)
....
oL- --'__~_ __I..__~_ __'_ ...J
o
FIG. 18. Variation of Normal Stress with Cycles for DifferentValues of K
ii 120
~..11..~ 80
180
FIG. 19. Effect of Magnitude of Normal Stiffness on Variationsof Mean Normal Stress and Maximum Shear Stress after 30 Cycles
200 ,..-------,----.....,.------;-----..,
CONCLUSIONS
The results of two-way displacement-controlled cyclic testsindicated that the interface may fail, and strength degradationmay occur, even at tangential-displacement amplitudes lessthan that required to mobilize the peak strength in a monotonictest. It was possible to explain this phenomenon by using asimple shear-type soil container. This observation agrees wellwith those presented by Uesugi et al. (1989) and Uesugi andKishida (1991).
The two-way displacement-controlled cyclic tests under thecondition of constant normal stiffness indicated that the maximum shear stress decreases with the increase in the numberof cycles, irrespective of the magnitude of the tangential-dis-
b
1....
1....
....,...
....
....
....•'00
._L-----'------'-----'-----'-----'
... .------,-----F=:=:===:===.---i-----,
.00
The results of four constant normal stiffness tests are presented in Figs. 17 and 18. The total tangential displacementamplitude was 0.75 mm in all tests. The values of K were 200,400, 800, and 1200 kPalmm. All four tests had an initial normal stress of 300 kPa. The changes taking place in the shearstress during the cycles (shown in Fig. 17), indicate that theshear-stress degradation occurred faster, and the maximumshear stress was much lower after the same number of cycles,for higher normal stiffness values. At higher K values, thenormal stress also dropped rapidly (Fig. 18). The reduction inthe mean normal stress and maximum shear stress as a function of the normal stiffness are plotted in Fig. 19, which represents the results after 30 cycles. It is observed that the meannormal stress and the maximum shear stress decreased withincreasing K values.
_:~m;•• ~.~~~~~~m....•.................•...................===l · .. .. .... ; i i·.00 ; [...1.....
1
.
: , I '.-2000 .coo 1000 aooo 10000
..
-:~.K.200kPa/mmI. 1
l · .... ,i,: i 11 .
...~ II tK=i2OOkf'8JI11
~;;;;=;;_.-_..~:_.. --_...._-2000 .cooo 1000 1000 10000
Tima (Sac.)
l ·
FIG. 17. Variation of Shear Stress with Cycles for DifferentValues of K
1104 / JOURNAL OF GEOTECHNICAL AND GEOENVIRONMENTAL ENGINEERING / DECEMBER 1997
J. Geotech. Geoenviron. Eng. 1997.123:1096-1105.
Dow
nloa
ded
from
asc
elib
rary
.org
by
Eas
t Car
olin
a U
nive
rsity
on
09/2
2/13
. Cop
yrig
ht A
SCE
. For
per
sona
l use
onl
y; a
ll ri
ghts
res
erve
d.

placement amplitude. The maximum shear stress begins to decrease right after cycling starts and the rate of reduction ishigher during the first few cycles. This is an indication thatthe degradation of the maximum shear stress depends on thecompressibility of the sand mass during the shearing cycles.Compression of the sand mass results in a reduction in thenormal stress, and consequently, a reduction in the shear stress.The rate of decrease in the maximum shear stress, however,is significantly affected by the magnitude of the tangentialdisplacement amplitude. If the tangential-displacement amplitude is sufficiently large, then the stress ratio, T/an, wouldreach its peak value after several cycles. After the peak (failure), the stress ratio would approach a residual value, and themaximum shear stress would reduce at a faster rate than thecase where no failure is experienced.
Using these observations, it can be concluded that the maximum shear-stress degradation is influenced not only by thecompression of the sand, but is also affected by the amountof mobilized sliding displacement. The occurrence of failureat the interface, as a result of the accumulation of the slidingdisplacement with cycles, plays a major role in the degradationof the maximum shear stress at the interface between the densesilica sand and a steel plate. In addition, the degradation ofthe maximum shear stress is affected by the magnitude of theconstant normal stiffness in such a way that with increasingvalues of the normal stiffness, the reduction in the normalstress becomes larger and, as a result, the maximum shearstress reduces at a faster rate.
ACKNOWLEDGMENTSFinancial support for this research was provided by the Natural Sci
ences and Engineering Research Council of Canada and the NationalEnergy Board of Canada.
APPENDIX. REFERENCESAirey, D. w., Al-Douri, R. H., and Poulos, H. G. (1992). "Estimation of
pile friction degradation from shear box tests." Geotech. Testing J.,ASTM, 15(4), 388-392.
Chan, S. E, and Hanna, T. H. (1980). "Repeated loading on single pilesin sand." J. Geotech. Engrg., ASCE, 106(2), 171-188.
Desai, C. S., Drumm, E. C., and Zaman, M. M. (1985). "Cyclic testingand modeling of interfaces." J. Geotech. Engrg., ASCE, 111(6),793815.
Evgin, E., and Fakharian, K. (1996). "Effect of stress paths on the behaviour of sand-steel interfaces." Can. Geotech. J., 33(6), 853-865.
Fakharian, K. (1996). "Three-dimensional monotonic and cyclic behaviour of sand-steel interfaces: testing and modelling," PhD thesis, Dept.of Civ. Engrg., Univ. of Ottawa, Ottawa, Ont., Canada.
Fakharian, K., and Evgin, E. (1996). "An automated apparatus for threedimensional monotonic and cyclic testing of interfaces." Geotech. Testing J., ASTM, 19(1),22-31.
Miura, S., and Toki, S. (1982). "A sample preparation method and itseffect on static and cyclic deformation-strength properties of sand."Soils and Found., Tokyo, Japan, 22(2),61-77.
Ooi, L. H., and Carter, J. P. (1987). "A constant normal stiffness directshear device for static and cyclic loading." Geotech. Testing J., ASTM,10(1), 3-12.
Paikowsky, S. G., Player, C. M., and Connors, P. J. (1995). "A dualinterface apparatus for testing unrestricted friction of soil along solidsurfaces." Geotech. Testing J., ASTM, 18(2), 168-193.
Poulos, H. G. (1981). "Cyclic axial response of single pile." J. Geotech.Engrg., ASCE, 107(1),41-58.
Poulos, H. G. (1989). "Cyclic axial loading analysis of piles in sand."J. Georech. Engrg., ASCE, 115(6), 836-852.
Poulos, H. G. (1991). "Closure 'Cyclic axial loading analysis of piles insand.''' J. Geotech. Engrg., ASCE, 117(9),1438-1440.
Tabucanon, J. T., Airey, D. w., and Poulos, H. G., (1995). "Pile skinfriction in sands from constant normal stiffness tests." Geotech. TestingJ., ASTM, 18(3),350-364.
Turner, J. P., and Kulhawy, E H. (1989). "Issues in evaluating combinedrepeated loading of deep foundations." Foundation Engineering: Current Principles and Practices, Proc., Congress, Vol. 2, Evanston, Ill.
Uesugi, M., and Kishida, H. (1986). "Frictional resistllnce at yield between dry sand and mild steel," Soils and Found., 26(4), 139-149.
Uesugi, M., and Kishida, H. (1991). "Discussion of 'Cyclic axial loadinganalysis of piles in sand,' by Poulos." J. Geotech. Engrg., ASCE,117(9), 1435 -1457.
Uesugi, M., Kishida, H., and Tsubakihara, Y. (1989). "Friction betweensand and steel under repeated loading," Soils and Found., 29(3),127-137.
JOURNAL OF GEOTECHNICAL AND GEOENVIRONMENTAL ENGINEERING 1DECEMBER 1997/1105
J. Geotech. Geoenviron. Eng. 1997.123:1096-1105.
Dow
nloa
ded
from
asc
elib
rary
.org
by
Eas
t Car
olin
a U
nive
rsity
on
09/2
2/13
. Cop
yrig
ht A
SCE
. For
per
sona
l use
onl
y; a
ll ri
ghts
res
erve
d.