Cyclic Behavior of Cold-Formed Steel Stud-to-Sheathing ... · Cyclic Behavior of Cold-Formed Steel...
8
Cyclic Behavior of Cold-Formed Steel Stud-to-Sheathing Connections K.D. Peterman, N. Nakata, B.W. Schafer Johns Hopkins University, Baltimore, MD, USA SUMMARY: This series of experiments aims to characterize the cyclic behavior of cold-formed steel (CFS) stud-to-sheathing connections. This connection provides the key energy dissipating behavior in wood sheathed CFS shear walls, and provides bracing to the studs under gravity and out-of-plane loads. A simple testing rig is developed consisting of two CFS lipped channels facing toe-to-toe connected on the flanges by sheathing (oriented strand board, or gypsum board) and cycled such that the 8 connecting fasteners experience shear. Sheathing configuration, fastener spacing, load protocol (CUREE), steel thickness, and fastener type for OSB specimens were varied to determine connection performance. The dominant role of sheathing type and stud thickness is highlighted. The cyclic behavior of the experimental results is characterized for further use in analysis of shear walls and under gravity and lateral load. The work serves as an important supplement in North American efforts to advance seismic performance-based design of CFS structures and is part of a larger effort to better understand CFS lateral force resisting systems. Keywords: cold-formed steel, thin-walled structures, cyclic response, fastener response 1. INTRODUCTION Cold-formed steel is gaining momentum in the low-to-mid-rise construction industry as a lightweight yet strong material that is economically efficient. While there is a large body of research in cold- formed steel, this research is largely motivated by the specifics of the National Science Foundation funded Network for Earthquake Engineering Simulation (NEES) project: CFS-NEES (www.ce.jhu.edu/cfsnees). CFS-NEES aims to improve the performance-based seismic design of cold- formed steel structures and culminates in the construction and testing of a two-story full-scale cold- formed steel building (termed the CFS-NEES building), to be tested at the University of Buffalo in 2013. The project aims to better characterize and understand the behavior of cold-formed steel systems through computational models and experimental sub-system tests. The work presented herein is a component of these sub-system testing efforts. Test parameters are drawn from common North American construction methods but also from the shear wall construction in the fully detailed archetype CFS-NEES building (Madsen et al. 2011). In fact, the overarching goal of these local fastener-sheathing connection tests is to simulate and predict seismic behavior of these shear walls. Tests conducted at the University of North Texas (Liu et al., 2012) provide an experimental motivation for this work. The extension of connection behavior to shear wall behavior is investigated in this paper. 2. TEST METHODOLOGY 2.1. Specimen design Specimens were configured to represent two scenarios: common North American light steel framing construction and typical shear wall assemblies in the CFS-NEES model building. For these purposes, a
Transcript of Cyclic Behavior of Cold-Formed Steel Stud-to-Sheathing ... · Cyclic Behavior of Cold-Formed Steel...
Cyclic Behavior of Cold-Formed Steel
Stud-to-Sheathing Connections K.D. Peterman, N. Nakata, B.W. Schafer Johns Hopkins University, Baltimore, MD, USA
SUMMARY: This series of experiments aims to characterize the cyclic behavior of cold-formed steel (CFS) stud-to-sheathing connections. This connection provides the key energy dissipating behavior in wood sheathed CFS shear walls, and provides bracing to the studs under gravity and out-of-plane loads. A simple testing rig is developed consisting of two CFS lipped channels facing toe-to-toe connected on the flanges by sheathing (oriented strand board, or gypsum board) and cycled such that the 8 connecting fasteners experience shear. Sheathing configuration, fastener spacing, load protocol (CUREE), steel thickness, and fastener type for OSB specimens were varied to determine connection performance. The dominant role of sheathing type and stud thickness is highlighted. The cyclic behavior of the experimental results is characterized for further use in analysis of shear walls and under gravity and lateral load. The work serves as an important supplement in North American efforts to advance seismic performance-based design of CFS structures and is part of a larger effort to better understand CFS lateral force resisting systems. Keywords: cold-formed steel, thin-walled structures, cyclic response, fastener response 1. INTRODUCTION Cold-formed steel is gaining momentum in the low-to-mid-rise construction industry as a lightweight yet strong material that is economically efficient. While there is a large body of research in cold-formed steel, this research is largely motivated by the specifics of the National Science Foundation funded Network for Earthquake Engineering Simulation (NEES) project: CFS-NEES (www.ce.jhu.edu/cfsnees). CFS-NEES aims to improve the performance-based seismic design of cold-formed steel structures and culminates in the construction and testing of a two-story full-scale cold-formed steel building (termed the CFS-NEES building), to be tested at the University of Buffalo in 2013. The project aims to better characterize and understand the behavior of cold-formed steel systems through computational models and experimental sub-system tests. The work presented herein is a component of these sub-system testing efforts. Test parameters are drawn from common North American construction methods but also from the shear wall construction in the fully detailed archetype CFS-NEES building (Madsen et al. 2011). In fact, the overarching goal of these local fastener-sheathing connection tests is to simulate and predict seismic behavior of these shear walls. Tests conducted at the University of North Texas (Liu et al., 2012) provide an experimental motivation for this work. The extension of connection behavior to shear wall behavior is investigated in this paper. 2. TEST METHODOLOGY 2.1. Specimen design Specimens were configured to represent two scenarios: common North American light steel framing construction and typical shear wall assemblies in the CFS-NEES model building. For these purposes, a
15.2 cm (6 inch) deep cold-formed steel channel section was chosen as the standard dimensions (600S162 in AISI S200-07 notation). Three steel thicknesses were tested: 0.84mm, 1.37mm, and 2.46mm (33, 54, and 97 mil, respectively). To capture behaviour of both chord and field studs in a shear wall, two fastener spacings were also tested, 30.5cm (12 inch) to simulate a field stud, and 15.2cm (6 inch) to simulate a chord stud. Furthermore, sheathing type was varied between ~11mm thick (7/16 inch) oriented strand board (OSB) and 12.7mm thick (1/2 inch) gypsum. These parameters are listed in the test matrix in Table 2.1.1 along with load protocol, which will be discussed in the following section. Table 2.1.1 Test matrix
15.2 cm Spacing 30.5 cm SpacingOSB Gypsum OSB Gyspum
0.84mm Monotonic 2* 2 2 2CUREE 2 2 2 2
1.37mm Monotonic 2 2 2 2CUREE 2 2 2 2
2.46mm Monotonic 2 2 2 2CUREE 2 2 2 2
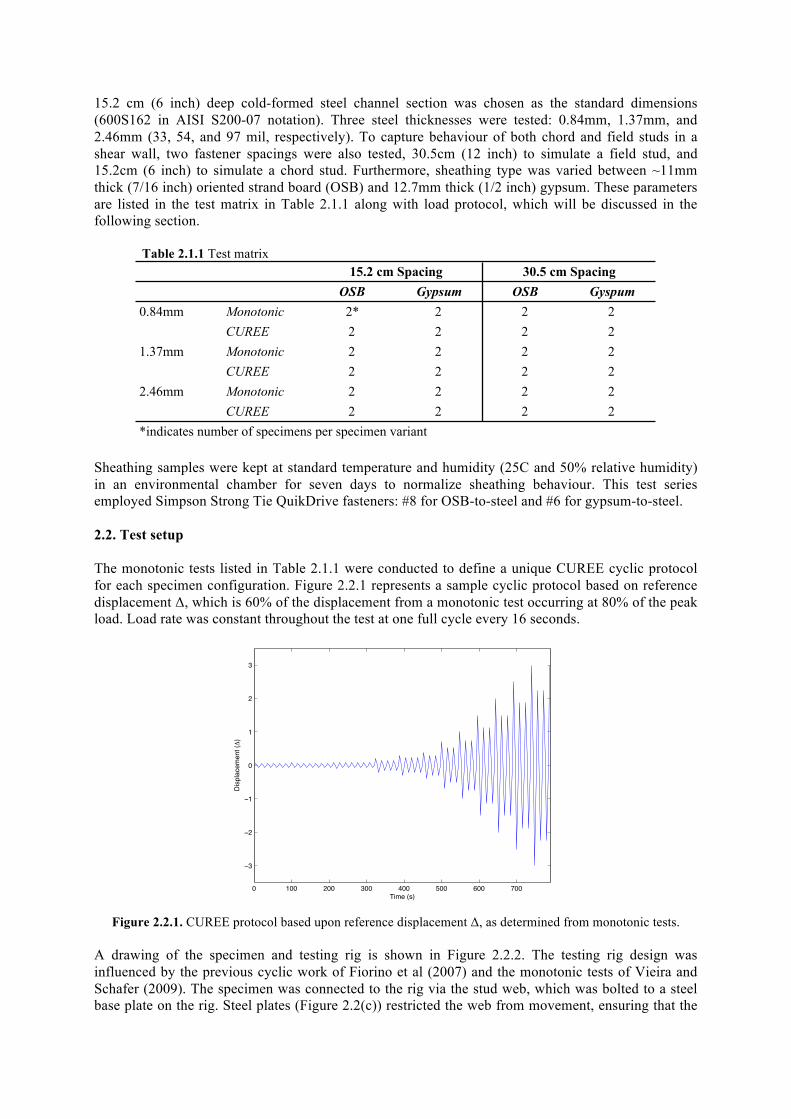
*indicates number of specimens per specimen variant Sheathing samples were kept at standard temperature and humidity (25C and 50% relative humidity) in an environmental chamber for seven days to normalize sheathing behaviour. This test series employed Simpson Strong Tie QuikDrive fasteners: #8 for OSB-to-steel and #6 for gypsum-to-steel. 2.2. Test setup The monotonic tests listed in Table 2.1.1 were conducted to define a unique CUREE cyclic protocol for each specimen configuration. Figure 2.2.1 represents a sample cyclic protocol based on reference displacement Δ, which is 60% of the displacement from a monotonic test occurring at 80% of the peak load. Load rate was constant throughout the test at one full cycle every 16 seconds.
0 100 200 300 400 500 600 700
3
2
1
0
1
2
3
Time (s)
Dis
plac
emen
t ()
Figure 2.2.1. CUREE protocol based upon reference displacement Δ, as determined from monotonic tests.
A drawing of the specimen and testing rig is shown in Figure 2.2.2. The testing rig design was influenced by the previous cyclic work of Fiorino et al (2007) and the monotonic tests of Vieira and Schafer (2009). The specimen was connected to the rig via the stud web, which was bolted to a steel base plate on the rig. Steel plates (Figure 2.2(c)) restricted the web from movement, ensuring that the
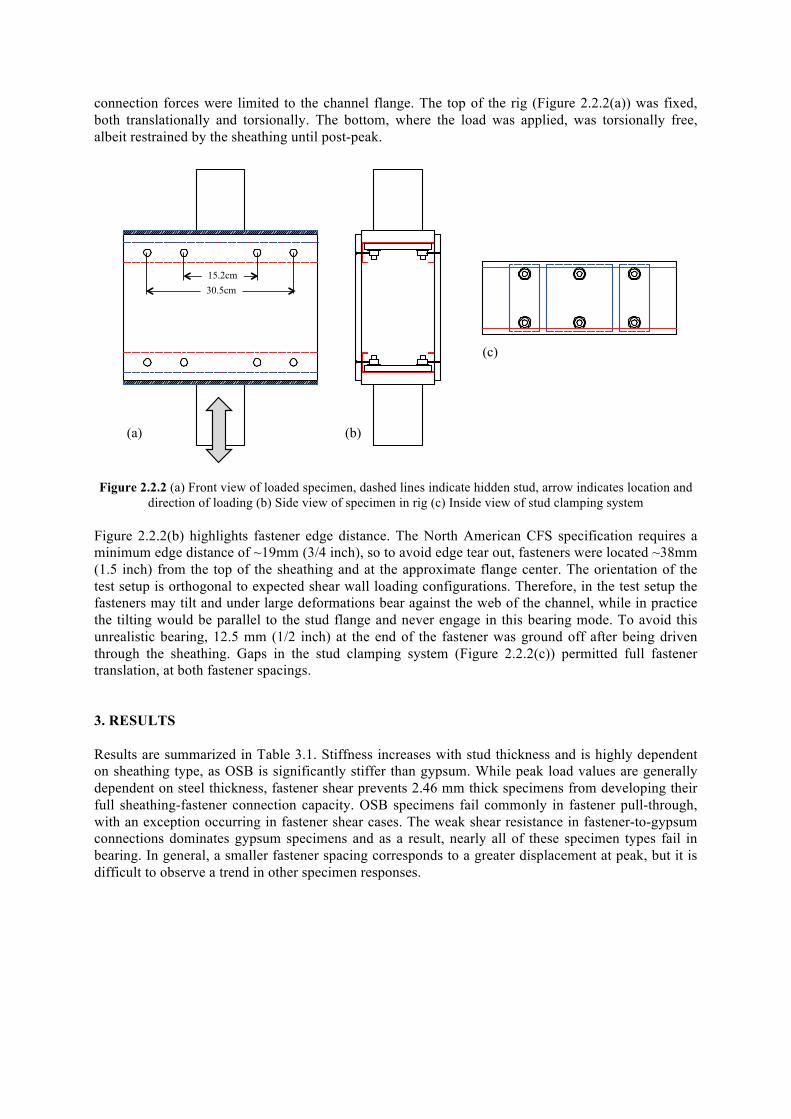
connection forces were limited to the channel flange. The top of the rig (Figure 2.2.2(a)) was fixed, both translationally and torsionally. The bottom, where the load was applied, was torsionally free, albeit restrained by the sheathing until post-peak.
(a) (b)
(c)
15.2cm 30.5cm
Figure 2.2.2 (a) Front view of loaded specimen, dashed lines indicate hidden stud, arrow indicates location and direction of loading (b) Side view of specimen in rig (c) Inside view of stud clamping system
Figure 2.2.2(b) highlights fastener edge distance. The North American CFS specification requires a minimum edge distance of ~19mm (3/4 inch), so to avoid edge tear out, fasteners were located ~38mm (1.5 inch) from the top of the sheathing and at the approximate flange center. The orientation of the test setup is orthogonal to expected shear wall loading configurations. Therefore, in the test setup the fasteners may tilt and under large deformations bear against the web of the channel, while in practice the tilting would be parallel to the stud flange and never engage in this bearing mode. To avoid this unrealistic bearing, 12.5 mm (1/2 inch) at the end of the fastener was ground off after being driven through the sheathing. Gaps in the stud clamping system (Figure 2.2.2(c)) permitted full fastener translation, at both fastener spacings. 3. RESULTS Results are summarized in Table 3.1. Stiffness increases with stud thickness and is highly dependent on sheathing type, as OSB is significantly stiffer than gypsum. While peak load values are generally dependent on steel thickness, fastener shear prevents 2.46 mm thick specimens from developing their full sheathing-fastener connection capacity. OSB specimens fail commonly in fastener pull-through, with an exception occurring in fastener shear cases. The weak shear resistance in fastener-to-gypsum connections dominates gypsum specimens and as a result, nearly all of these specimen types fail in bearing. In general, a smaller fastener spacing corresponds to a greater displacement at peak, but it is difficult to observe a trend in other specimen responses.
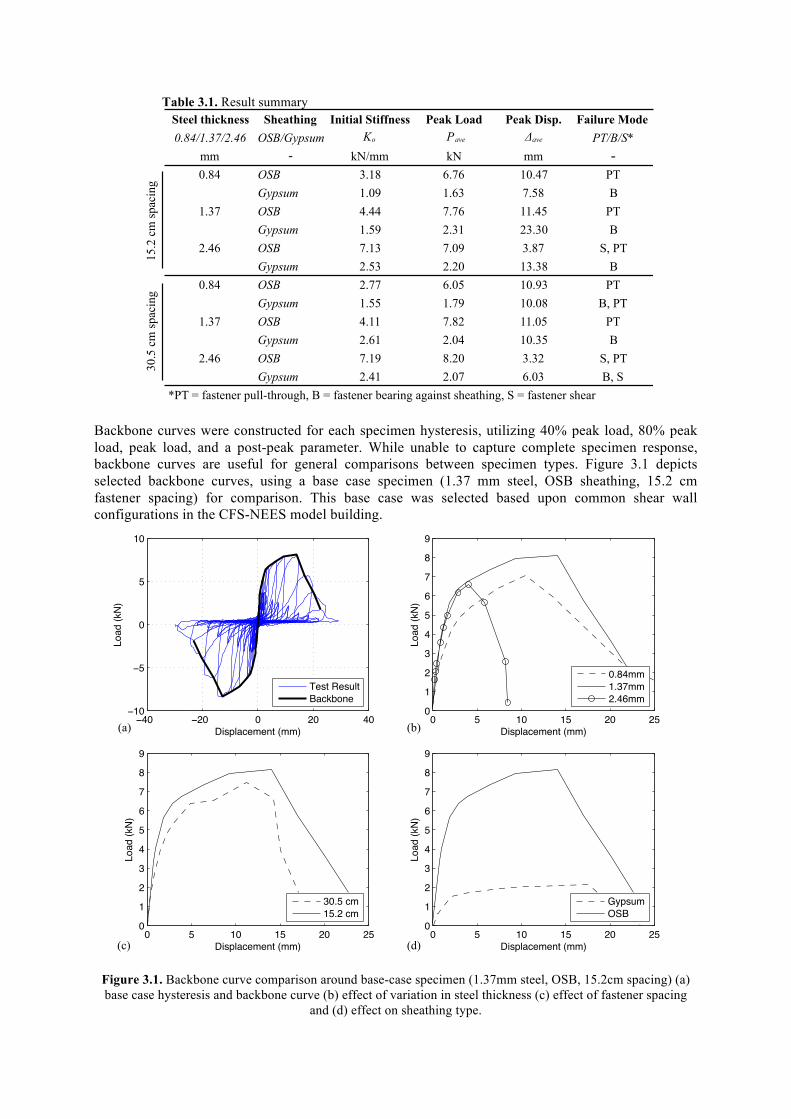
Table 3.1. Result summary
15.2
cm
spac
ing
30.5
cm
spac
ing
Steel thickness Sheathing Initial Stiffness Peak Load Peak Disp. Failure Mode0.84/1.37/2.46 OSB/Gypsum Ko Pave !ave PT/B/S*
mm ! kN/mm kN mm -0.84 OSB 3.18 6.76 10.47 PT
Gypsum 1.09 1.63 7.58 B1.37 OSB 4.44 7.76 11.45 PT
Gypsum 1.59 2.31 23.30 B2.46 OSB 7.13 7.09 3.87 S, PT
Gypsum 2.53 2.20 13.38 B0.84 OSB 2.77 6.05 10.93 PT
Gypsum 1.55 1.79 10.08 B, PT1.37 OSB 4.11 7.82 11.05 PT
Gypsum 2.61 2.04 10.35 B2.46 OSB 7.19 8.20 3.32 S, PT
Gypsum 2.41 2.07 6.03 B, S*PT = fastener pull-through, B = fastener bearing against sheathing, S = fastener shear
Backbone curves were constructed for each specimen hysteresis, utilizing 40% peak load, 80% peak load, peak load, and a post-peak parameter. While unable to capture complete specimen response, backbone curves are useful for general comparisons between specimen types. Figure 3.1 depicts selected backbone curves, using a base case specimen (1.37 mm steel, OSB sheathing, 15.2 cm fastener spacing) for comparison. This base case was selected based upon common shear wall configurations in the CFS-NEES model building.
0 5 10 15 20 250
1
2
3
4
5
6
7
8
9
Displacement (mm)
Load
(kN
)
0.84mm1.37mm2.46mm
0 5 10 15 20 250
1
2
3
4
5
6
7
8
9
Displacement (mm)
Load
(kN)
GypsumOSB
0 5 10 15 20 250
1
2
3
4
5
6
7
8
9
Displacement (mm)
Load
(kN
)
30.5 cm15.2 cm
40 20 0 20 4010
5
0
5
10
Displacement (mm)
Load
(kN
)
Test ResultBackbone
(a) (b)
(d) (c)
Figure 3.1. Backbone curve comparison around base-case specimen (1.37mm steel, OSB, 15.2cm spacing) (a) base case hysteresis and backbone curve (b) effect of variation in steel thickness (c) effect of fastener spacing
and (d) effect on sheathing type.
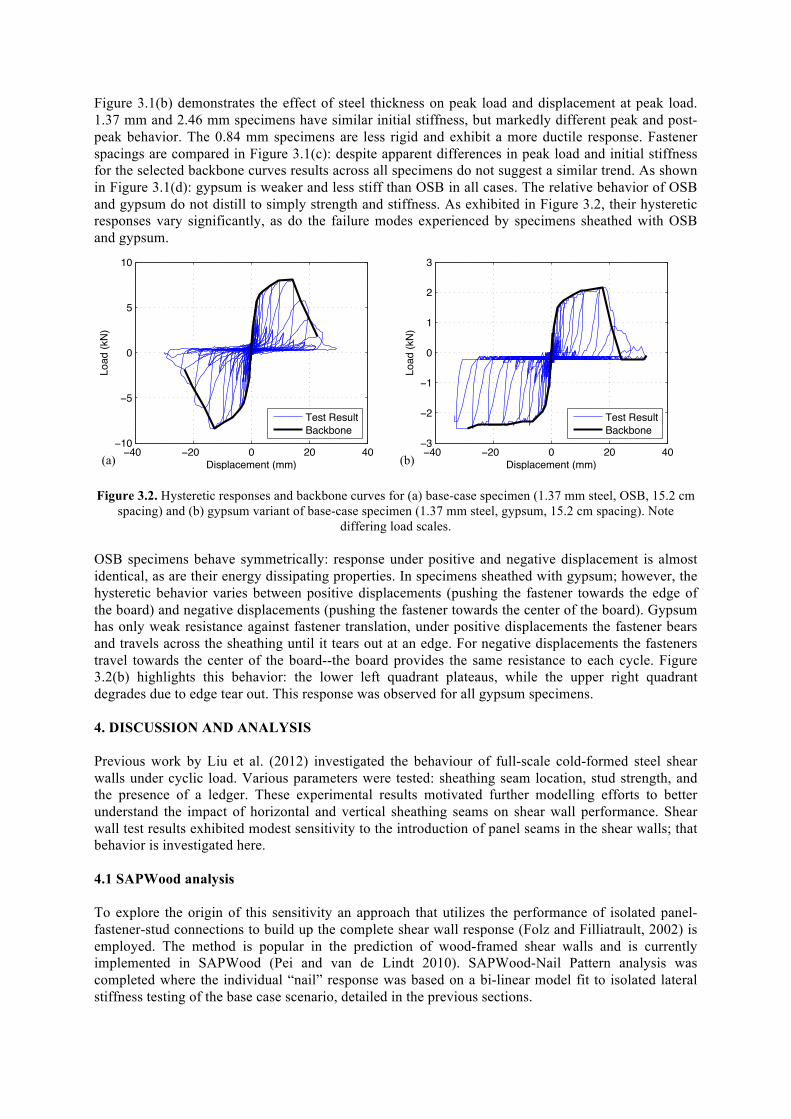
Figure 3.1(b) demonstrates the effect of steel thickness on peak load and displacement at peak load. 1.37 mm and 2.46 mm specimens have similar initial stiffness, but markedly different peak and post-peak behavior. The 0.84 mm specimens are less rigid and exhibit a more ductile response. Fastener spacings are compared in Figure 3.1(c): despite apparent differences in peak load and initial stiffness for the selected backbone curves results across all specimens do not suggest a similar trend. As shown in Figure 3.1(d): gypsum is weaker and less stiff than OSB in all cases. The relative behavior of OSB and gypsum do not distill to simply strength and stiffness. As exhibited in Figure 3.2, their hysteretic responses vary significantly, as do the failure modes experienced by specimens sheathed with OSB and gypsum.
40 20 0 20 403
2
1
0
1
2
3
Displacement (mm)
Load
(kN
)
Test ResultBackbone
40 20 0 20 4010
5
0
5
10
Displacement (mm)
Load
(kN
)
Test ResultBackbone
(a) (b) Figure 3.2. Hysteretic responses and backbone curves for (a) base-case specimen (1.37 mm steel, OSB, 15.2 cm
spacing) and (b) gypsum variant of base-case specimen (1.37 mm steel, gypsum, 15.2 cm spacing). Note differing load scales.
OSB specimens behave symmetrically: response under positive and negative displacement is almost identical, as are their energy dissipating properties. In specimens sheathed with gypsum; however, the hysteretic behavior varies between positive displacements (pushing the fastener towards the edge of the board) and negative displacements (pushing the fastener towards the center of the board). Gypsum has only weak resistance against fastener translation, under positive displacements the fastener bears and travels across the sheathing until it tears out at an edge. For negative displacements the fasteners travel towards the center of the board--the board provides the same resistance to each cycle. Figure 3.2(b) highlights this behavior: the lower left quadrant plateaus, while the upper right quadrant degrades due to edge tear out. This response was observed for all gypsum specimens. 4. DISCUSSION AND ANALYSIS Previous work by Liu et al. (2012) investigated the behaviour of full-scale cold-formed steel shear walls under cyclic load. Various parameters were tested: sheathing seam location, stud strength, and the presence of a ledger. These experimental results motivated further modelling efforts to better understand the impact of horizontal and vertical sheathing seams on shear wall performance. Shear wall test results exhibited modest sensitivity to the introduction of panel seams in the shear walls; that behavior is investigated here. 4.1 SAPWood analysis To explore the origin of this sensitivity an approach that utilizes the performance of isolated panel-fastener-stud connections to build up the complete shear wall response (Folz and Filliatrault, 2002) is employed. The method is popular in the prediction of wood-framed shear walls and is currently implemented in SAPWood (Pei and van de Lindt 2010). SAPWood-Nail Pattern analysis was completed where the individual “nail” response was based on a bi-linear model fit to isolated lateral stiffness testing of the base case scenario, detailed in the previous sections.
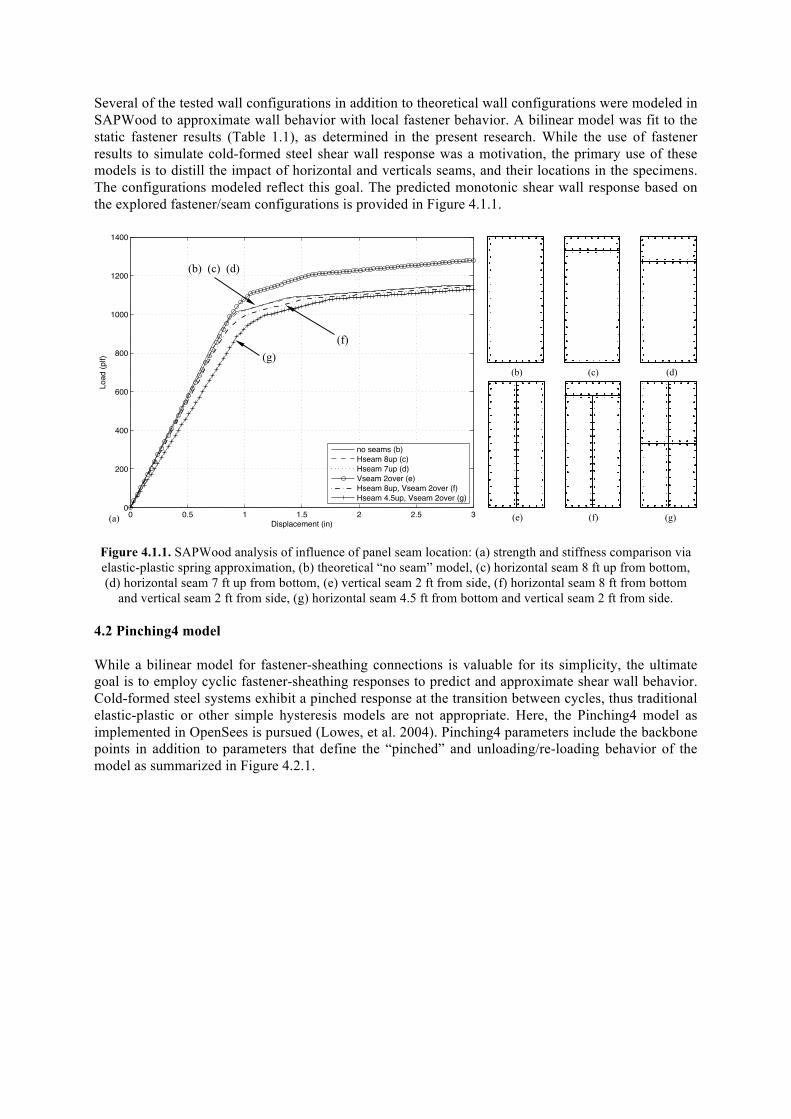
Several of the tested wall configurations in addition to theoretical wall configurations were modeled in SAPWood to approximate wall behavior with local fastener behavior. A bilinear model was fit to the static fastener results (Table 1.1), as determined in the present research. While the use of fastener results to simulate cold-formed steel shear wall response was a motivation, the primary use of these models is to distill the impact of horizontal and verticals seams, and their locations in the specimens. The configurations modeled reflect this goal. The predicted monotonic shear wall response based on the explored fastener/seam configurations is provided in Figure 4.1.1.
0 0.5 1 1.5 2 2.5 30
200
400
600
800
1000
1200
1400
Displacement (in)
Load
(plf)
no seams (b)Hseam 8up (c)Hseam 7up (d)Vseam 2over (e)Hseam 8up, Vseam 2over (f)Hseam 4.5up, Vseam 2over (g)
(a)!
(b) (c) (d)
(e) (f) (g)
(b) (c) (d)
(f) (g)
Figure 4.1.1. SAPWood analysis of influence of panel seam location: (a) strength and stiffness comparison via elastic-plastic spring approximation, (b) theoretical “no seam” model, (c) horizontal seam 8 ft up from bottom, (d) horizontal seam 7 ft up from bottom, (e) vertical seam 2 ft from side, (f) horizontal seam 8 ft from bottom
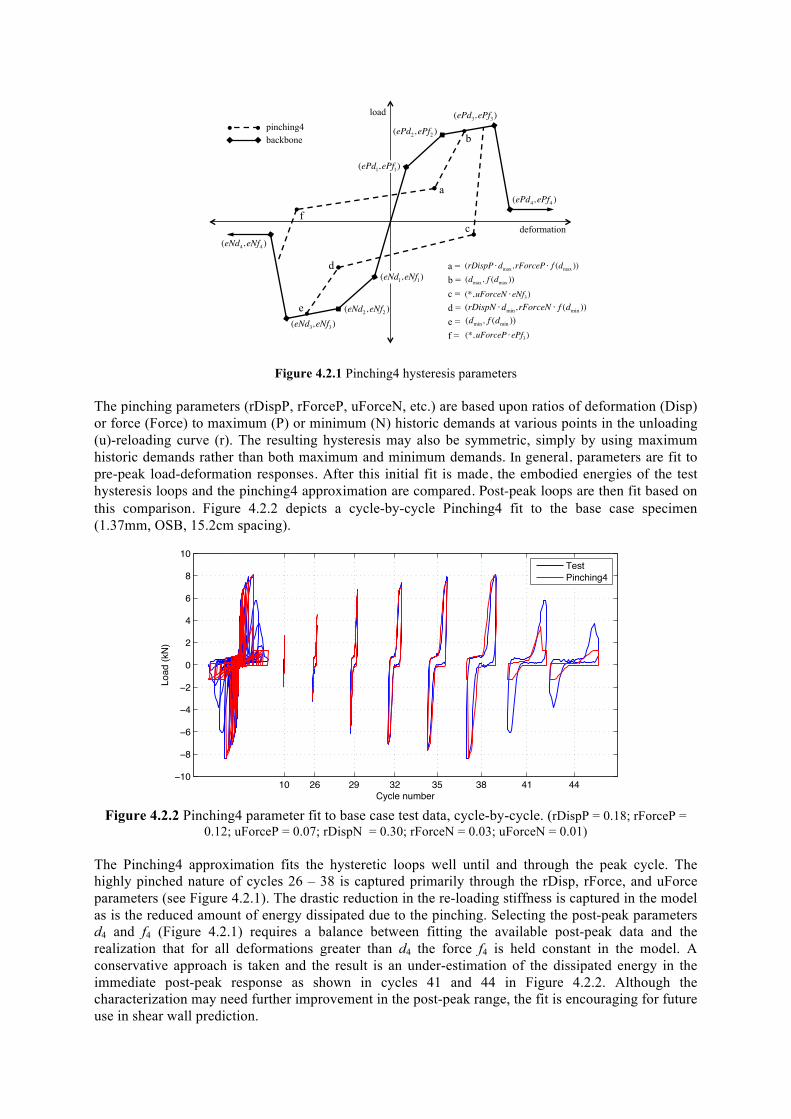
and vertical seam 2 ft from side, (g) horizontal seam 4.5 ft from bottom and vertical seam 2 ft from side. 4.2 Pinching4 model While a bilinear model for fastener-sheathing connections is valuable for its simplicity, the ultimate goal is to employ cyclic fastener-sheathing responses to predict and approximate shear wall behavior. Cold-formed steel systems exhibit a pinched response at the transition between cycles, thus traditional elastic-plastic or other simple hysteresis models are not appropriate. Here, the Pinching4 model as implemented in OpenSees is pursued (Lowes, et al. 2004). Pinching4 parameters include the backbone points in addition to parameters that define the “pinched” and unloading/re-loading behavior of the model as summarized in Figure 4.2.1.
pinching4 backbone
deformation
load
(ePd1,ePf1)
(ePd2,ePf2 )
(ePd3,ePf3)
(ePd4,ePf4 )
(eNd1,eNf1)
(eNd2,eNf2 )(eNd3,eNf3)
(eNd4,eNf4 )
a
b
c
d
e
f
(dmin, f (dmin ))
(dmax, f (dmax ))
(rDispN !dmin, rForceN ! f (dmin ))
(rDispP !dmax, rForceP ! f (dmax ))
(*,uForceP !ePf3)
(*,uForceN !eNf3)
a = b = c = d = e = f =
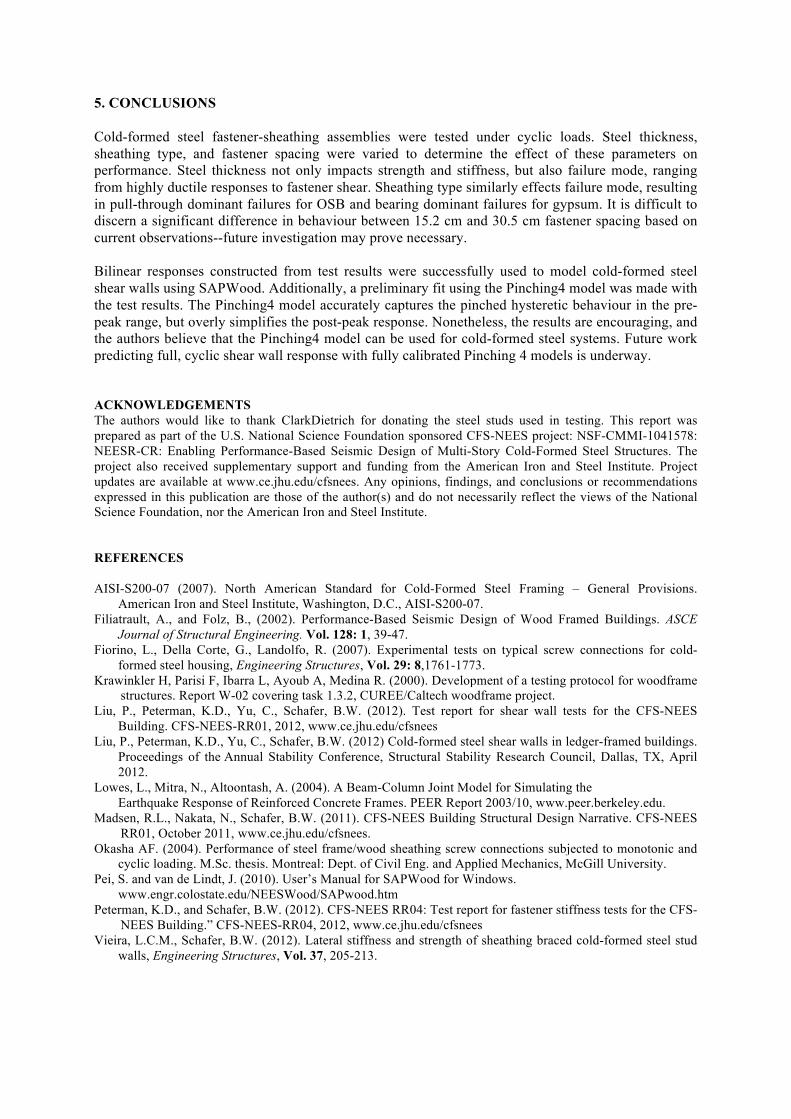
Figure 4.2.1 Pinching4 hysteresis parameters The pinching parameters (rDispP, rForceP, uForceN, etc.) are based upon ratios of deformation (Disp) or force (Force) to maximum (P) or minimum (N) historic demands at various points in the unloading (u)-reloading curve (r). The resulting hysteresis may also be symmetric, simply by using maximum historic demands rather than both maximum and minimum demands. In general, parameters are fit to pre-peak load-deformation responses. After this initial fit is made, the embodied energies of the test hysteresis loops and the pinching4 approximation are compared. Post-peak loops are then fit based on this comparison. Figure 4.2.2 depicts a cycle-by-cycle Pinching4 fit to the base case specimen (1.37mm, OSB, 15.2cm spacing).
10 26 29 32 35 38 41 4410
8
6
4
2
0
2
4
6
8
10
Cycle number
Load
(kN
)
TestPinching4
Figure 4.2.2 Pinching4 parameter fit to base case test data, cycle-by-cycle. (rDispP = 0.18; rForceP =
0.12; uForceP = 0.07; rDispN = 0.30; rForceN = 0.03; uForceN = 0.01) The Pinching4 approximation fits the hysteretic loops well until and through the peak cycle. The highly pinched nature of cycles 26 – 38 is captured primarily through the rDisp, rForce, and uForce parameters (see Figure 4.2.1). The drastic reduction in the re-loading stiffness is captured in the model as is the reduced amount of energy dissipated due to the pinching. Selecting the post-peak parameters d4 and f4 (Figure 4.2.1) requires a balance between fitting the available post-peak data and the realization that for all deformations greater than d4 the force f4 is held constant in the model. A conservative approach is taken and the result is an under-estimation of the dissipated energy in the immediate post-peak response as shown in cycles 41 and 44 in Figure 4.2.2. Although the characterization may need further improvement in the post-peak range, the fit is encouraging for future use in shear wall prediction.
5. CONCLUSIONS Cold-formed steel fastener-sheathing assemblies were tested under cyclic loads. Steel thickness, sheathing type, and fastener spacing were varied to determine the effect of these parameters on performance. Steel thickness not only impacts strength and stiffness, but also failure mode, ranging from highly ductile responses to fastener shear. Sheathing type similarly effects failure mode, resulting in pull-through dominant failures for OSB and bearing dominant failures for gypsum. It is difficult to discern a significant difference in behaviour between 15.2 cm and 30.5 cm fastener spacing based on current observations--future investigation may prove necessary. Bilinear responses constructed from test results were successfully used to model cold-formed steel shear walls using SAPWood. Additionally, a preliminary fit using the Pinching4 model was made with the test results. The Pinching4 model accurately captures the pinched hysteretic behaviour in the pre-peak range, but overly simplifies the post-peak response. Nonetheless, the results are encouraging, and the authors believe that the Pinching4 model can be used for cold-formed steel systems. Future work predicting full, cyclic shear wall response with fully calibrated Pinching 4 models is underway. ACKNOWLEDGEMENTS The authors would like to thank ClarkDietrich for donating the steel studs used in testing. This report was prepared as part of the U.S. National Science Foundation sponsored CFS-NEES project: NSF-CMMI-1041578: NEESR-CR: Enabling Performance-Based Seismic Design of Multi-Story Cold-Formed Steel Structures. The project also received supplementary support and funding from the American Iron and Steel Institute. Project updates are available at www.ce.jhu.edu/cfsnees. Any opinions, findings, and conclusions or recommendations expressed in this publication are those of the author(s) and do not necessarily reflect the views of the National Science Foundation, nor the American Iron and Steel Institute. REFERENCES AISI-S200-07 (2007). North American Standard for Cold-Formed Steel Framing – General Provisions.
American Iron and Steel Institute, Washington, D.C., AISI-S200-07. Filiatrault, A., and Folz, B., (2002). Performance-Based Seismic Design of Wood Framed Buildings. ASCE
Journal of Structural Engineering. Vol. 128: 1, 39-47. Fiorino, L., Della Corte, G., Landolfo, R. (2007). Experimental tests on typical screw connections for cold-
formed steel housing, Engineering Structures, Vol. 29: 8,1761-1773. Krawinkler H, Parisi F, Ibarra L, Ayoub A, Medina R. (2000). Development of a testing protocol for woodframe
structures. Report W-02 covering task 1.3.2, CUREE/Caltech woodframe project. Liu, P., Peterman, K.D., Yu, C., Schafer, B.W. (2012). Test report for shear wall tests for the CFS-NEES
Building. CFS-NEES-RR01, 2012, www.ce.jhu.edu/cfsnees Liu, P., Peterman, K.D., Yu, C., Schafer, B.W. (2012) Cold-formed steel shear walls in ledger-framed buildings.
Proceedings of the Annual Stability Conference, Structural Stability Research Council, Dallas, TX, April 2012.
Lowes, L., Mitra, N., Altoontash, A. (2004). A Beam-Column Joint Model for Simulating the Earthquake Response of Reinforced Concrete Frames. PEER Report 2003/10, www.peer.berkeley.edu. Madsen, R.L., Nakata, N., Schafer, B.W. (2011). CFS-NEES Building Structural Design Narrative. CFS-NEES
RR01, October 2011, www.ce.jhu.edu/cfsnees. Okasha AF. (2004). Performance of steel frame/wood sheathing screw connections subjected to monotonic and
cyclic loading. M.Sc. thesis. Montreal: Dept. of Civil Eng. and Applied Mechanics, McGill University. Pei, S. and van de Lindt, J. (2010). User’s Manual for SAPWood for Windows.
www.engr.colostate.edu/NEESWood/SAPwood.htm Peterman, K.D., and Schafer, B.W. (2012). CFS-NEES RR04: Test report for fastener stiffness tests for the CFS-
NEES Building.” CFS-NEES-RR04, 2012, www.ce.jhu.edu/cfsnees Vieira, L.C.M., Schafer, B.W. (2012). Lateral stiffness and strength of sheathing braced cold-formed steel stud
walls, Engineering Structures, Vol. 37, 205-213.