Cycle route network planning using GIS
25
Cycle route network planning using GIS Andrew G. Macbeth, BE, MEng, CPEng, FIPENZ (civil) ViaStrada Ltd, Christchurch [email protected] www.viastrada.co.nz Co-authors: Tricia Allen (formerly ARTA) and Tony Barton (VicRoads, Melbourne) Presentation to 6 th NZ Cycling Conference Napier, Friday 2 November 2007
Transcript of Cycle route network planning using GIS

Cycle route network planning using GIS
Andrew G. Macbeth, BE, MEng, CPEng, FIPENZ (civil)ViaStrada Ltd, Christchurch
Co-authors: Tricia Allen (formerly ARTA) and Tony Barton (VicRoads, Melbourne)
Presentation to 6th NZ Cycling ConferenceNapier, Friday 2 November 2007

Tricia Allen and Tony Barton
Auckland
Melbourne
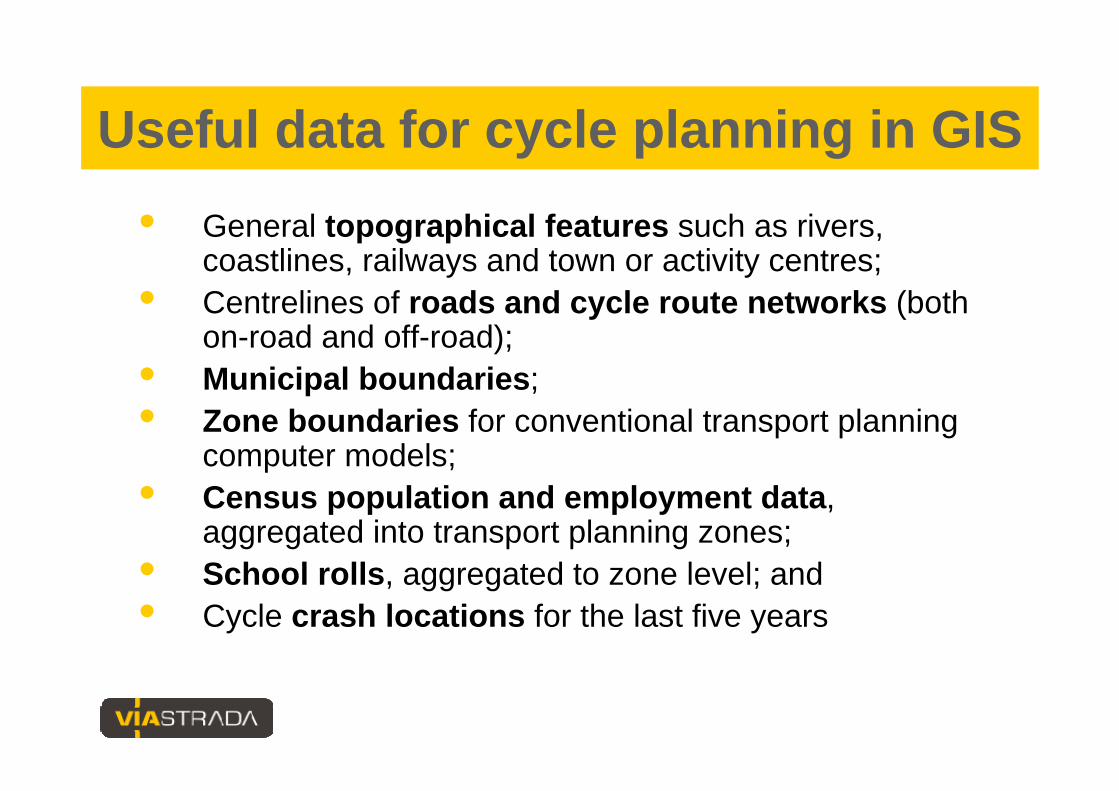
Useful data for cycle planning in GIS• General topographical features such as rivers,
coastlines, railways and town or activity centres;• Centrelines of roads and cycle route networks (both
on-road and off-road);• Municipal boundaries;• Zone boundaries for conventional transport planning
computer models;• Census population and employment data,
aggregated into transport planning zones;• School rolls, aggregated to zone level; and• Cycle crash locations for the last five years
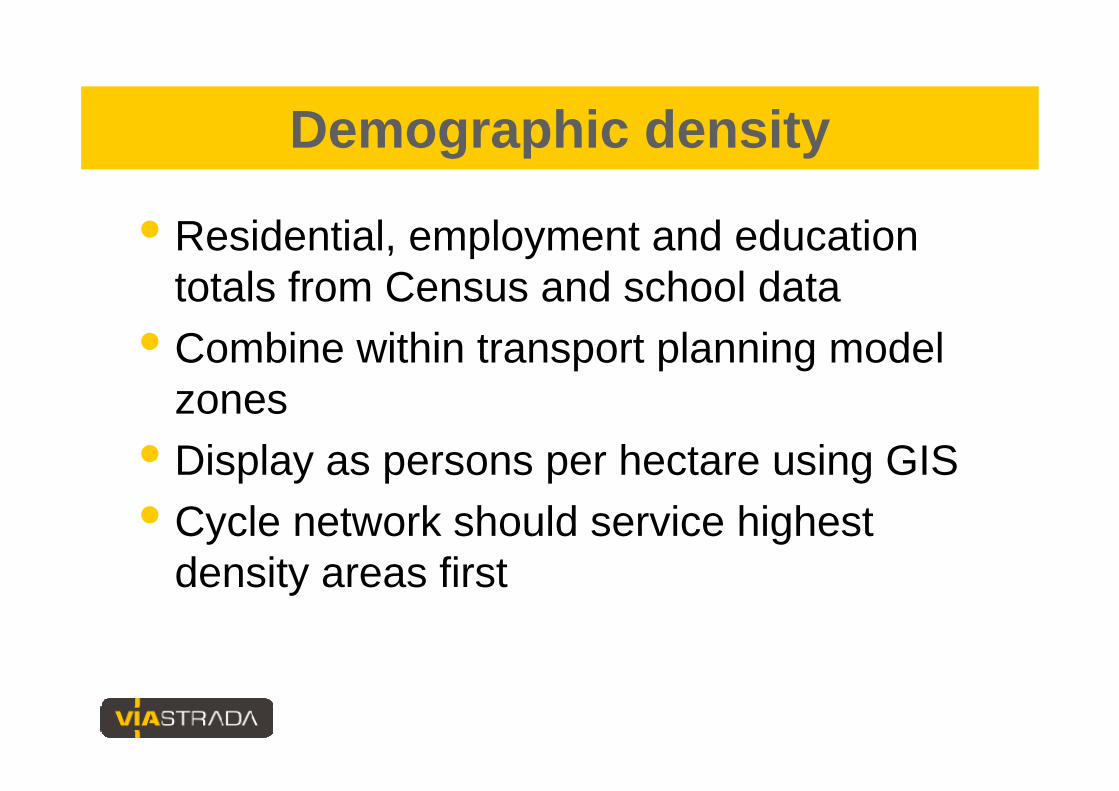
Demographic density
• Residential, employment and education totals from Census and school data
• Combine within transport planning model zones
• Display as persons per hectare using GIS• Cycle network should service highest
density areas first

Demographic density

Chch cycle to work Census data 2006
• Another useful spatial data set for planning cycle networks
• Density of trips (persons per ha) can be calculated at meshblock level and plotted
• Can help understanding of existing cycle use for journey to work in any city or district
• Chch data analysed by Canterbury DHB –not just TLAs who are interested in this

Christchurch Cycle to Work Origins Census 2006

Crash data and cycle network
• Crash data and cycle network can be mapped
• Often cycle crash data align with proposed cycle routes
• Intention is to render cycle routes safe so that crashes diminish

Auckland cycle network and crash data
Auckland network models
• Model 1: The sum of the parts• Model 2: Regionally strategic parts of
Model 1• Model 3: Town centres• Model 4: Town centres with regional
links


Network comparisons
0.11
1,420
154
80%
74%
Model 4
0.100.190.18Final Score (normal-ised by length)
1,192375854Cycle Network Length (km)
11571155Raw Score(out of 200)
60%24%74%Safety (crash coverage)
55%47%82%Demographic Coverage
Model 3Model 2Model 1

Model 2 network length, crashes
272
26
112
83
51
No.
Model 2 Cycle Crashes
24%
19%
65%
44%
8%
% of cycle
crashes
1138
135
173
188
642
2001-05
Total Cycle Crashes
9%
7%
11%
11%
6%
% of road length
4,395
937
804
1,300
1,354
km
Total Road Length
375
66
91
143
75
km
Model 2 Cycle Network Length
Waitakere City
Total
North Shore City
Manukau City
Auckland City
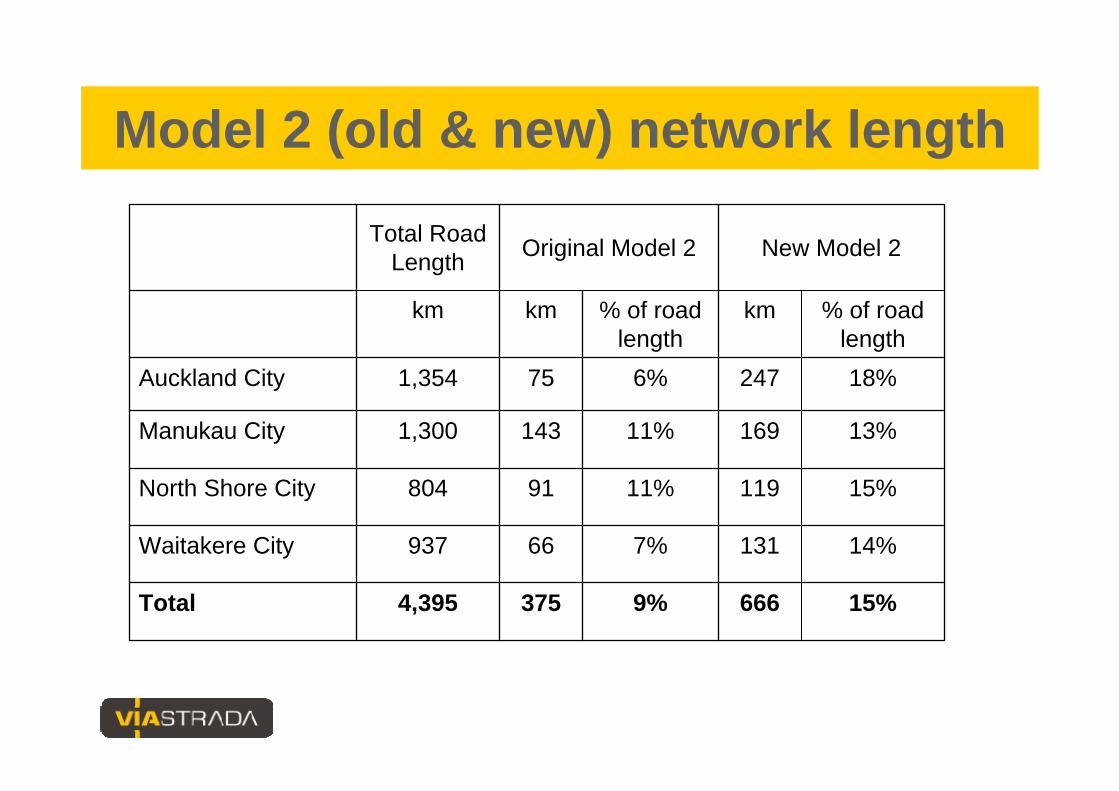
Model 2 (old & new) network length
14%1317%66937Waitakere City
375
91
143
75
km
Original Model 2
4,395
804
1,300
1,354
km
Total Road Length
15%6669%Total
15%11911%North Shore City
13%16911%Manukau City
18%2476%Auckland City
% of road length
km% of road length
New Model 2

Network comparisons
0.11
1,420
154
80%
74%
Model 4
0.260.100.190.18Final Score (normal-ised by length)
6661,192375854Cycle Network Length (km)
17311571155Raw Score (out of 200)
92%60%24%74%Safety (crash coverage)
82%55%47%82%Demographic Coverage
New Model 2
Model 3Model 2Model 1
Existing and proposed routes
• Buffers around cycle network show demographic coverage
• Can be superimposed on demographic densities to identify missing key links
• Visual inspection provides useful clues• Has been trialled in Melbourne• Further work needed to develop a tool to
optimise the technique
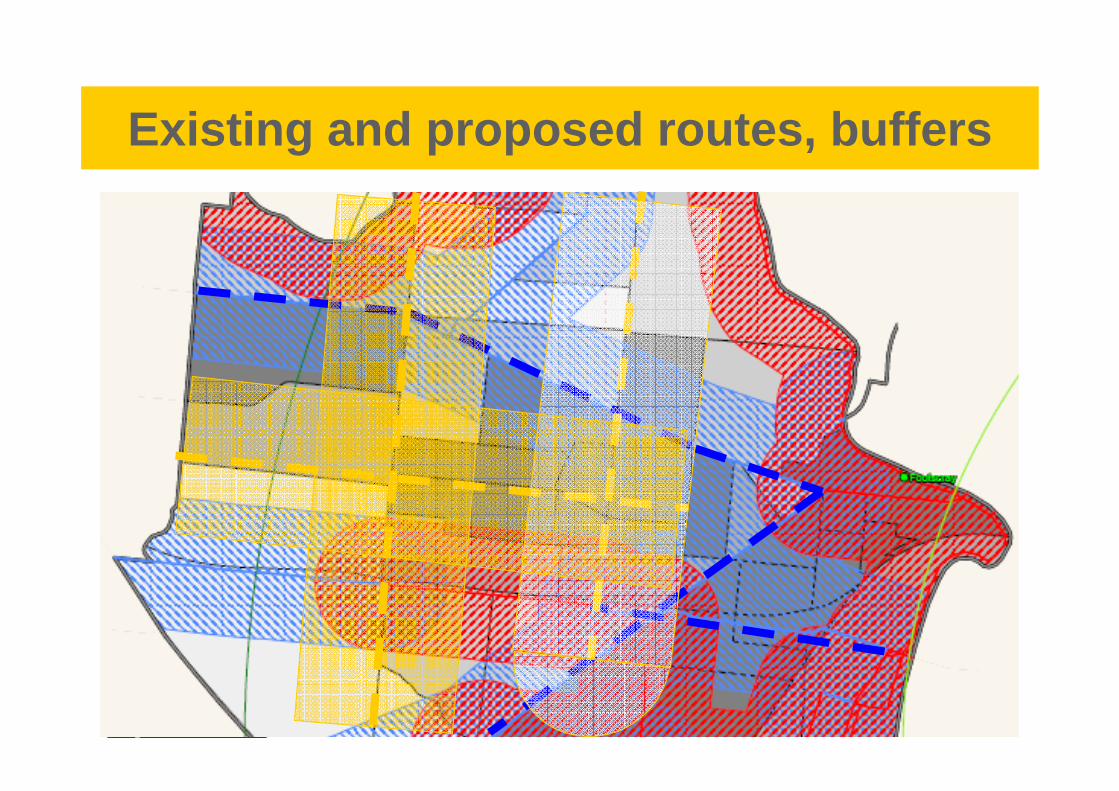
Existing and proposed routes, buffers
Coverage of different buffers
• Assume people living within 500 m of cycle network have access to it
• 500 m = 2 minutes at 15 km/h• Average time to access network = 1 min.• Can calculate demographic coverage for a
network for any given buffer• Can compare coverage of different networks
or existing and proposed networks

Coverage of 400 m, 800 m & 1.6 km buffers

Conclusions
• GIS helps analyse and visualise complex spatial data
• Improves objectivity of cycle route network planning
• Helps rationalise spending for most effective cycle network projects