![Mobile Touch-Free Interaction for Global Healtha depth camera to track 3D hand positions, while Pouke et al. [14] use a Bluetooth-connected sensor attached to the hand. Although the](https://static.fdocuments.in/doc/165x107/607da81d2caf6f7fd6666580/mobile-touch-free-interaction-for-global-a-depth-camera-to-track-3d-hand-positions.jpg)
Cybersickness in virtual realityjultika.oulu.fi/files/nbnfioulu-201802091218.pdfI want to thank...
49
Effect of Visual Realism on Cybersickness in Virtual Reality University of Oulu Faculty of Information Technology and Electrical Engineering / IS Master’s Thesis Arttu Tiiro Date 2.2.2018
Transcript of Cybersickness in virtual realityjultika.oulu.fi/files/nbnfioulu-201802091218.pdfI want to thank...

Effect of Visual Realism on Cybersickness in Virtual Reality
University of Oulu
Faculty of Information Technology and
Electrical Engineering / IS
Master’s Thesis
Arttu Tiiro
Date 2.2.2018

2
Abstract
Virtual reality has been developing rapidly and gaining popularity in the past years as
new devices and applications have been released. It is utilized in many fields like
entertainment, health and science. Virtual reality is characterized by head-mounted
devices that can immerse the user to the virtual environment, but it has been found out
to cause an undesirable side-effect called cybersickness. Cybersickness has been studied
vastly for many years and it has roots in simulators and motion sickness studies.
Cybersickness has many symptoms including nausea, headache, eye stress and
dizziness. There are many factors that can cause cybersickness, but the root cause is still
unclear whether it is caused by a mismatch between visual and vestibular system or by
instabilities in posture.
With modern devices and applications, visual realism has been developing far from the
first wave of virtual reality in the 1990s, but there are not many studies that have been
linking it to cybersickness. In this study, three graphical styles with different levels of
graphical realism are compared to find out if high visual realism causes cybersickness.
Cybersickness is measured with questionnaires that have become the standard in
cybersickness studies. Results have been analyzed with quantitative methods.
Results of the study indicate higher visual realism causes more cybersickness than lower
visual realism. Increased level of detail in high visual realism graphics causes more
visual flow and stronger sensory mismatches that causes cybersickness. Reduced details
also reduce depth cues in the graphics and does not cause as strong mismatches between
visual and vestibular systems.
Keywords Virtual reality, cybersickness, visual realism
Supervisors PhD, Postdoctoral Researcher, Matti Pouke
PhD, University lecturer, Mikko Rajanen

3
Foreword
I want to thank Matti Pouke from Oulu University for offering me the topic for the
thesis and helping me with the experiments and report through the whole thesis. Special
thanks for submitting a poster to IEEE VR 2018 conference based on the results from
the thesis.
I want to thank Mikko Rajanen for supervising the thesis and guiding the writing
process.
Arttu Tiiro
Oulu, February 2, 2018

4
Contents
Abstract ............................................................................................................................. 2
Foreword ........................................................................................................................... 3 Contents ............................................................................................................................ 4 1. Introduction .................................................................................................................. 5 2. Prior research ................................................................................................................ 7
2.1 Virtual reality ....................................................................................................... 7
2.2 Cybersickness ...................................................................................................... 9 2.2.1 Theories .................................................................................................. 10 2.2.2 Measuring ............................................................................................... 12
2.2.3 Causes and symptoms ............................................................................. 13 2.3 Immersion and presence .................................................................................... 17
3. Research problem ....................................................................................................... 19 3.1 Research questions ............................................................................................. 19 3.2 Research method ................................................................................................ 19
3.3 Scope and limitations ......................................................................................... 20
4. Experiments and data analysis ................................................................................... 22 4.1 Laboratory, application and system design ........................................................ 22
4.2 Pilot tests ............................................................................................................ 27 4.3 Data analysis and findings ................................................................................. 28
4.3.1 Simulator Sickness Questionnaire .......................................................... 28 4.3.2 Fast Motion Sickness .............................................................................. 30
4.3.3 Interviews ............................................................................................... 32 4.3.4 Presence Questionnaire........................................................................... 33 4.3.5 Immersive Tendencies Questionnaire .................................................... 35
4.3.6 Motion Sickness Susceptibility Questionnaire ....................................... 36 4.3.7 Other variables ........................................................................................ 36
5. Discussion .................................................................................................................. 37 6. Conclusions and future work ...................................................................................... 41 References ....................................................................................................................... 43
Appendix A. Interviews .................................................................................................. 49

5
1. Introduction
Virtual reality has gained popularity in recent years as technology has advanced and
new devices have emerged within the industry. Especially consumer versions of head-
mounted displays and their potential applications have provoked interest in the general
public. Video games have especially appealed the consumers, but virtual reality has also
been utilized in other domains as well, like healthcare, construction and architecture
(Berntsen, Palacios & Herranz, 2016). Head-mounted displays are the key technology in
virtual realities and they differ from traditional displays drastically as they immerse the
user totally in the virtual environment by blocking other visual inputs that might disturb
the experience. With such an immersive experience there has also emerged an
undesirable side effect called cybersickness.
Cybersickness is a set of unpleasant symptoms that are induced by exposure to a virtual
environment and can last from few minutes to even days (Rebenitsch and Owen, 2016).
Such symptoms are for example eyestrain, headache, nausea or even vomiting (Davis,
Nalivaiko & Nesbitt, 2015). It has been estimated that around 20% to 80% of the
population experiences cybersickness to some extent (Rebenitsch and Owen, 2016). As
virtual reality devices have been become more and more popular, reports of
cybersickness have been increasing as well, although the condition itself has been
known and studied for a long time already. In worst cases, people cannot use any
devices to experience virtual reality because the symptoms become too strong. In one
incident, game developers had to drop out the virtual reality features from their game,
because players reported getting too sick when playing it (Valve, 2017). In health care,
the cybersickness symptoms might disturb the treatment and have undesirable effects on
the patient. Even slight symptoms are uncomfortable and can disturb the user.
Cybersickness has been studied already quite much and especially lot if simulator and
motion sickness studies are considered since the roots of cybersickness studies are there.
Symptoms are similar across different modes of sickness although there are some
differences in symptom profiles (Rebenitsch and Owen, 2016; Stanney, Kennedy &
Drexler, 1997). The theories about motion and simulator sickness has been applied to
cybersickness studies but the root cause on why we experience it remains still unknown.
There are many reasons and inducers behind the symptoms ranging from hardware
issues to design issues in applications that are also affected by individual differences.
Improving hardware alone cannot solve problem of cybersickness, as long history of
improvements in head-mounted displays have shown (Rebenitsch and Owen, 2016).
With better hardware, the applications have become more robust as well and their role
in cybersickness has been emphasized. Unpredictable events and decreased control has
been found to cause sickness in simulators (Kolasinski, 1995). Navigational and control
issues are often studied and found out to cause sickness like Dorado and Figueroa
(2014) found out that smoother controls caused less sickness than stiff controls.
Accelerations have been argued inducing most cybersickness and limiting movement
has been recommended to reduce the symptoms (LaValle, 2017; Lloarch, Evans & Blat,
2014). Limiting the movement is however not desirable in driving or flying simulators
or games, for example, where the navigation is an essential part of the experience. This
means the visual aspects must be considered also.

6
This thesis studies the effect of visual realism on cybersickness by comparing three
different graphical styles on otherwise identical applications. The research problem is
described as: does higher visual realism causes more cybersickness than low visual
realism? Games and different applications have always been driving towards visual
realism but the effect of visual realism on cybersickness has not been studied broadly.
Davis et al. (2015) conducted an experiment between two roller coaster simulators
where the visual realism was altered, and they noticed that higher visual realism
increased cybersickness symptoms in participants due to increased details in graphics.
The roller coaster example was developed on purpose so that symptoms would occur, so
they could be studied but it shows also that cybersickness can be limiting the
possibilities in where virtual reality technology can be applied. Just like Davis et al.
(2015) found out that higher visual realism causes more sickness, this study aims to
either confirm or reject that argument by comparing three different levels of realism.
The study uses different questionnaires developed to measure cybersickness and
constructed interview to learn more on how and why the symptoms occurred. Presence
and immersion, as subjective experiences, are also measured to study if different
graphical styles affect them and if they can provide data to understand the sickness
scores. The results of this study can be applied to games and similar applications that
utilize similar graphical styles and locomotion. The study also validates similar research
problem presented in past literature but with consumer technology. At section 2 relevant
literature is presented where virtual reality and cybersickness are presented more
extensively as well as immersion and presence. At section 3, research questions and
hypotheses are presented. The setting of the experiments and analysis of the data are
presented at section 4. Section 5 discusses the findings of the study and answers the
research question and hypotheses. Section 6 concludes the study.

7
2. Prior research
This section provides the theoretical framework for the study. A literature review was
conducted first on virtual reality and then, more specifically, on cybersickness to give
an overall view of the past and current trends as well as studies on both topics. The
literature review has been conducted thematically, but also chronologically, to cover
important areas of virtual reality and cybersickness. This review helps to understand
what both virtual reality and cybersickness are and how they have been studied in the
past. Research papers were collected mainly from other papers to find the major
publications. Chapter 2.1 provides information on virtual reality and how it is used in
different domains and what techniques it has compared to traditional display systems. It
also covers the history and state of the art of different devices. Chapter 2.2 gives an in-
depth review on cybersickness in virtual reality. It introduces the most popular theories
that try to explain why people experience cybersickness, what are the symptoms and
causes behind cybersickness and how cybersickness can be measured.
2.1 Virtual reality
Virtual reality is a computer technology that produces realistic and interactive three-
dimensional environments that users can experience through head-mounted displays
(Kolasinski, 1995). In his paper Kolasinski says the definition is more of a future goal
than a representation of current systems. Nowadays these systems have developed much
further and Budhraja (2015) defines virtual reality also as capable of manipulating the
user’s senses to feel present in virtual environments. Similar to previous definitions,
LaValle (2017) defines virtual reality as “inducing targeted behavior in an organism by
using artificial sensory stimulation, while organism has little or no awareness of the
interference”. LaValle (2017) defined virtual reality to cover current and future
technologies so that basically any technology that can produce realistic virtual
environment that can fool senses of any living organism with some experience can be
called virtual reality.
Virtual reality is like augmented reality (AR) with a difference that in augmented reality
the graphics are rendered on top of real world instead of creating fully virtual
environment (Azuma, 1997). Davis, Nesbitt and Nalivaiko (2014) states in their paper
that virtual reality is often referred as virtual environment, but the term can be seen in
other contexts as well. Other similar technologies are the CAVE systems where the
rendered image or virtual environment is projected on the walls of a room size cubes
(Cruz-Neira, Sandin, DeFanti, Kenyon & Hart, 1992). Each of these terms fall under
Virtual Continuum (Figure 1) by Milgram and Kishino (1994) who uses the continuum
to describe the degree reality and virtuality in physical and computer environments. In
Virtual Continuum, these types of environments are called mixed reality. These are, for
example, augmented reality and augmented virtuality latter meaning a virtual
environment that has been augmented with real environment.

8
Figure 1. Milgram’s Virtual Continuum describes the transition from real environments
to virtual environments
Virtual reality has a long history of studies and devices. Ivan Sutherland described and
later developed an “ultimate display”, Sword of Damocles, that used computer to render
3D images with wireframe graphics and could rotate the view according to the user’s
head position (Sutherland, 1965; Sutherland 1968). It is the first head-mounted display
for virtual reality. The term virtual reality was popularized by Jaron Lanier at late 1980s
and the first commercial virtual reality devices started to emerge at the 1990s (VRS,
2017). The first modern day virtual reality device was the Oculus Rift Development Kit
1 that was published after a successful Kickstarter campaign at 2012. It was said to start
the second wave of virtual reality (Anthes, Garciá-Hernández, Wiedemann, and
Kranzmüller 2016).
Virtual reality has been adopted by consumers, developers and researchers in many
different domains and it has various use cases. Berntsen, Palacios & Herranz (2016)
conducted a systematic literature review on 116 scientific papers on commercial impact
and uses of virtual reality. They categorized the domains of virtual reality into health,
exploration/presentation and entertainment fields. Health field contains studies on usage
of virtual reality in psychology and therapy treatments and forensic studies, for
example. Exploration field contains studies on use of virtual reality in construction and
architecture and digital tourism. Presentation and entertainment field includes realistic
digitalized scenarios from real world and games but also studies that could not be
categorized in to health or exploration fields. They found out that presentation and
entertainment field is the most prominent field as it contains more studies than other
domains. They found out that most papers aim to enhance the user experience in virtual
reality rather than plan how to publish these applications to wider audience. Although,
they note that with better and cheaper technology, the development of applications is
expected to increase. (Berntsen et al. 2016.)
Virtual reality devices can be categorized into input and output devices. Input devices
refer to controllers that users can interact or navigate in the virtual environment, while
output devices, are often displays such as head-mounted displays or smartphones. Other
output devices include also haptic and multi-sensory devices which can provide
different stimulations like vibration, temperature changes and odors. For navigation and
interaction there are various input devices like body tracking suits and gloves or
treadmills. (Anthes, et al., 2016.)

9
Head-mounted displays are the key technology in virtual reality. Compared to
traditional display systems they have higher immersion as the gear blocks any outer
visual stimuli. They also have a wide field of view and better depth perception because
they typically use two different screens and lenses, one for both eye. According to
Youngblut et al. (1995) both human eyes have a 180 horizontal and over 120 vertical
field of view, and over 270 degrees horizontal field of view when rotating head. They
also claim 90 to 110 degrees field of view is necessary to create an immersive virtual
environment. Anthes et al. (2016) study on virtual reality technologies reveals that
current systems are well within these boundaries and some of them will exceed even
200 degrees. Regarding screen resolution, there is already announced a device called
Pimax 8K with 3840x2160 resolution for both eyes (Kickstarter, 2017). Goldstein
(2009) annotates stereoscopic perception is the primary visual mechanism for depth
perception among monocular cues like shadows and textures or relative size and height.
LaValle (2017) sums in his book that there are lot more monocular cues than
stereoscopic cues and depth and “3D” can be perceived effectively by monocular cues
alone. In virtual reality high latency and poor tracking may prevent user from perceiving
some depth cues (LaValle, 2017). Head-mounted displays track users head movement
and orientation six degrees of freedom (Anthes, et al., 2016). The six degrees of
freedom refer to lateral, vertical and forward-backward transformations and rotations
that are yaw, pitch and roll (LaValle, 2017). The tracking systems in modern head-
mounted displays use inertial measure units (IMU) that combine accelerometers and
magnetometers, and cameras to track movement of user’s different body parts and even
objects in the room (LaValle, 2017). There are also some sophisticated devices like
Varjo (2017) and Fovea (2017) that are developing devices with eye tracking to increase
the display performance and bring in new ways to interact in virtual environments.
Virtual reality has pushed the development of input devices as the technology offers
new ways to interact and navigate in virtual environments, but also because the head-
mounted displays block eye-contact to real world objects. Keyboards for example can
be difficult to use when you cannot see your hands and fingers. Anthes et al. (2016)
have categorized input devices into controllers, navigation devices and tracking
technology. Controllers include hand-held controllers that can be traditional game
controllers or developer specific virtual reality controllers with specialized tracking
systems (Anthes et al. 2016). Navigation devices are operated by walking or sitting in
specialized treadmills, platforms or chairs that lets users interact with their hand-held
devices freely (Anthes et al. 2016). Tracking systems have been further categorized into
body and hand tracking systems that may or may not require additional suits or gloves
for example (Anthes et al. 2016). LaValle (2017) has pointed out a Universal
Simulation Principle considering virtual reality interactions that “any interaction
mechanism from the real world can be simulated in VR”. Despite, or maybe because of,
highly developed technology of virtual reality devices and interactions there have been
reported unpleasant side-effects of cybersickness in these systems.
2.2 Cybersickness
Cybersickness is a condition that may occur during or after exposure to a virtual
environment and it can induce symptoms like headache, eye strain, nausea or in extreme
cases vomiting (LaViola Jr, 2000). It is estimated that around 30% to 80% of population
experiences some degree of cybersickness (Rebenitsch and Owen, 2016).

10
Cybersickness is sometimes referred as visually induced motion sickness because it has
a close relationship with motion sickness and simulator sickness. Unlike in motion
sickness or simulator sickness, cybersickness can occur without stimulation to
vestibular system and in contrast motion sickness and simulator sickness symptoms can
occur without stimulation to visual system which shows the distinction between these
conditions (LaViola Jr., 2000). The term simulator sickness was coined by Barrett and
Thornton (1968) as they wanted to point out that illness in military simulators could not
be caused by motion sickness as it was totally excluded, hence the term simulator
sickness. Stanney et al. (1997) has pointed out also that cybersickness has a different
sickness profile from simulator sickness as in cybersickness disorientation symptoms
tend to be highest and oculomotor symptoms lowest, but in simulator sickness
oculomotor symptoms tend to be highest and disorientation symptoms lowest. Stanney
et al. (1997) found also that cybersickness is three times more severe than simulator
sickness. In a recent study Davis et al. (2015) concluded that cybersickness, simulator
sickness and motion sickness have similar symptoms while they are induced in different
types of exposure and the theories behind the symptoms are still argued. The term
cybersickness has been expanding and used with smartphones and movies so the term
VR sickness can also be used for virtual reality exclusively (LaValle, 2017).
2.2.1 Theories
Cybersickness is often studied from biological point of view where the symptoms
studied are more often bodily functions like nausea and eyestrain, rather than emotions
or state of mind like stress or anxiety. There are few theories about origin of motion and
simulator sickness that have also been used to explain cybersickness. These theories
have been proposed to why cybersickness occurs but there is no consensus which theory
is right. Most common theories are sensory mismatch theory and postural instability
theories. (Rebenitsch and Owen, 2016.)
Sensory mismatch theory (sometimes referred as sensory conflict theory or cue conflict
theory) is most popular and relevant theory in cybersickness studies. Sensory mismatch
theory argues that sickness develops either because human brain is receiving incoherent
stimuli in visual and vestibular systems or some sensory system is not receiving the
stimuli and causing the conflict. Virtual environments can cause incoherent stimuli from
the real world as the resolution, colors, lighting or latency for example might not
correspond with the real world. The vestibular system that communicates motion, and is
responsible for balance, might not receive any inputs even when the visual system is
receiving information about motion, can also cause sickness. Strongly related to this
mismatch, there can be an illusion of self-movement where the user feels as if he or she
is moving without any motion. This phenomenon is called vection and has been argued
as root source for cybersickness. In simulator and motion sickness the sensory mismatch
works the other way around as one might feel motion but not see it. (LaValle, 2017).
Naturally, sensory mismatch theory has been argued as root source of sickness in
motion and simulator studies as well. Before the actual theory was formed, Barrett and
Thornton (1968) were one of the first to use the term simulator sickness as they noticed
similar symptoms to motion sickness in subjects that were testing fixed-base simulators
where motion was absent. In their study they thought sickness might occur because of
deep involvement. They had noticed sickness was induced only in simulators where
subjects were watching the scene from inside-outside perspective, similar to driving a
car, instead of outside-inside perspective, similar to driving a radio-controlled car. They

11
also noticed car passengers get motion sickness, but the driver does not, which indicated
again low involvement causes more sickness. To cure simulator sickness Barrett and
Thornton proposed simulators should move accordingly to the scene so the cue conflict
would not occur. However, Casali (1986) and Kolasinski (1995) did not found that
added motion, vestibular stimuli, decreased sickness in subjects but in a recent study by
D’Amour, Bos and Keshavarz (2017) added seat vibrations did not reduce the
symptoms but vibrations to head reduced symptoms slightly. McCauley and Sharkey
(1992) argued again that a lack in feedback to the vestibular system is causing sickness
in simulators and any improved visual display would not solve this problem as the lag
causes the conflict. Sensory mismatch theory is popular because it has lot of data to
back it up and wide exposure (Kolasinski, 1995; Rebenitsch and Owen, 2015).
Sensory mismatch theory has been criticized because it cannot predict when
cybersickness occurs or how severe the symptoms will be and the theory only states
sickness is preceded by a sensory conflict (Kolasinksi 1995; Riccio and Stoffregen
1991; LaViola Jr., 2000). It also does not explain individual differences or why conflict
causes sickness (Davis et al. 2015; LaViola Jr., 2000).
Riccio and Stoffregen (1991) have proposed another theory of postural instability for
motion sickness, where instabilities in posture causes the sickness. They argue that
interference of different senses does not cause sickness and that such conflict is easy to
withstand (Riccio and Stoffregen, 1991). Postural instability theory suggests there are
patterns of interactions between the user and environment that can predict the sickness
unlike in sensory mismatch theory (Riccio and Stoffregen, 1991). Stoffregen and Smart
(1998) found at their tests that motion sickness was indeed preceded by instability in
subject’s posture. As they measured postural sway they found out that increases in
range, velocity and variance of postural sway increased motion sickness (Stoffregen,
Smart 1998). Other studies have found out similar results where motion sickness is
preceded by increased postural sway (LaViola Jr, 2000; Smart, Stoffregen & Bardy
2002). Cobb (1999) has criticized the theory because it lacks standardized methods to
effectively measure the instability as she found out that postural instability was
produced only when using posturographic techniques instead of subjective measures.
Akiduki et al. (2003) also found out that there was a time lag in between the symptoms
and instability which implies that instability is an outcome of cybersickness.
Similar to postural instability theory, rest frame theory argues that mismatch in sensed
gravitation and perceived up-direction causes cybersickness (Rebenitsch and Owen,
2016). Chang et al. (2013) compared two virtual rollercoasters where one condition had
two vertical and two horizontal lines as a rest frame providing sense of direction and
other did not. They found out that rest frame condition caused less cybersickness. In a
similar study Duh, Parker and Furness (2001) also found out a superimposed grid on a
visual scene caused less sickness than no-grid condition when comparing different
levels of grid brightness and oscillation frequency.
Poison theory is often mentioned as one theory of onset of cybersickness. Treisman
(1977) argues that symptoms in motion sickness are a reaction that has been learned
through evolution as possibly dangerous ingested toxins have caused similar
disturbances in visual and vestibular systems. He argues that strong reaction like
vomiting should have some meaning in survival as the reaction is widespread among
animals even when it is highly uncomfortable sensation (Treisman, 1977). Poison
theory has been criticized and LaViola Jr. (2001) argues that the theory lacks predictive
power in why some individuals experience in motion sickness and other do not, or why
vomiting does not occur always with cybersickness. Vomiting is also occurring sparsely

12
and sometimes not even considered in cybersickness measurements (Kennedy, Lane,
Berbaum & Lilienthal, 1993).
2.2.2 Measuring
There are many ways to observe and measure cybersickness like questionnaires,
interviews, observing and physiological measures. Questionnaires are undoubtedly most
popular measure because they are easy and cheap to use and develop but they yield
highly subjective information about the symptoms. McCauley and Sharkey (1992) note
that it is hard to measure cybersickness objectively because there are lot of different
symptoms and they are usually subjective and non-observable with varying effects on
individuals and development time. Also, symptoms might appear instantly or hours after
the exposure (McCauley and Sharkey, 1992). Postural sway can produce objective data
if done by a computer but the swaying itself is not providing much information about
the state of the subject and symptoms. Some symptoms like sweating, raised heart rate,
EEG and blood pressure can be observed objectively but need specific equipment.
Simulator Sickness Questionnaire by Kennedy et al. (1993) is the most used
questionnaire in cybersickness (Rebenitsch and Owen, 2015). The questionnaire is
based on Penascola Motion Sickness Questionnaire which was originally developed for
assessing motion sickness but had some irrelevant and misleading symptoms that have
been removed (Kennedy, et al. 1993). In Simulator Sickness Questionnaire there are 16
symptoms that have been categorized in to nausea, oculomotor and disorientation (Table
1) and some symptoms belong to several categories like general discomfort or difficult
concentrating (Kennedy et al. 1993). The questionnaire has each symptom rated in a 4-
point scale from none to severe which can be calculated in to nausea, oculomotor,
disorientation and total scores for further analysis (Kennedy et al. 1993). Stanney,
Kingdon, Graeber and Kennedy (2002) have stated that total scores under 7,48 are
healthy and Kennedy, Drexler, Compton, Lanham and Harm (2003) think total score
under 10 is not significant and over 20 is problematic.
There are few similar questionnaires that have been developed for motion sickness or
sickness in virtual reality. Muth, Stern, Thayer and Koch (1996) have developed a
nausea profile questionnaire exclusively for measuring nausea and they categorized
their symptoms to somatic distress, gastrointestinal distress and emotional distress.
Gianaros et al. (2001) have made a similar questionnaire, Motion Sickness Assessment
Questionnaire, which has almost identical symptoms that have been categorized into
sopite, gastrointestinal, central and peripheral symptoms. Ames, Wolffsohn and
McBrien (2005) have categorized their symptoms in Virtual Reality Symptom
Questionnaire roughly to general body symptoms and eye-related symptoms. Unlike
aforementioned questionnaires, Keshavarz and Hecht (2011) have used a simple
approach with Fast Motion Sickness score where the sickness is measured during the
experience by asking generally how the subject is feeling and scoring the sickness from
zero to 20. To study the effects of motion sickness history to current tendencies to
experience motion sickness, Golding (1998) published a simplified form of Motion
Sickness Susceptibility Questionnaire that has also been used in simulator sickness and
cybersickness studies.
As questionnaires are very subjective measures that rely on the user’s skill and habit to
report their experiences, the results can vary quite much. Postural sway has been argued
as a contributing factor to cybersickness by Riccio and Stoffregen (1991) and they have

13
also used the swaying as measure to predict sickness. Swaying can be measured by
amplitude, magnitude and frequency of swaying where larger swaying has been seen to
cause more sickness (Riccio and Stoffregen, 1991). Stoffregen and Smart (1998)
observed postural sway on both lateral and anterior-posterior axes and measured
variability, range and gain, and found significant differences between the sick and well
groups in their study.
Physiological measures can unveil how cybersickness is experienced inside our bodies
in an objective manner without subjects reporting. Kim, Kim, Kim, Ko and Kim (2005)
have conducted an excessive study on several physiological measures like EEG, heart
rate, eyeblink rate, skin conductance and temperature and fingertip pulse. The study has
revealed some connection of the central and autonomic nervous systems connection to
cybersickness (Kim et. al 2005). Ohyama et al. (2007) measured heart rate variability
from microvascular blood flow and electrocardiogram during virtual reality exposure
and noticed increases in sympathetic nervous activity.
Difficulties in measuring and evaluating cybersickness are probably the reason why
there are no straight answers to why cybersickness is still emerging and why the root
cause is still hidden. Davis et al. (2015) have evaluated that questionnaires are popular
because they are easy and cheap to do and therefore have long history and validation
while physiological measures usually require some costly hardware and are harder to
analyze. While better methods are developed, and tested questionnaires and interviews
can provide a lot of information about what causes cybersickness and what does not.
2.2.3 Causes and symptoms
Cybersickness has a lot of different symptoms like eye strain, headache, disorientation
and even vomiting (LaViola Jr., 2000; Rebenitsch and Owen, 2016). These symptoms
can arise during or after exposure to virtual realities which can disturb the experience
but also affect life outside the virtual environment for example when driving a car after
the exposure (LaViola Jr. 2000). To add on that, LaViola Jr. (2000) has also stated that
there are no foolproof methods to erase cybersickness. Safety standards are also absent
as Rebenitsch and Owen (2016) has pointed out. The symptoms have been quite often
caused by poor hardware or devices but as technology has improved human factors have
been emphasized more (Rebenitsch and Owen, 2016). In this thesis the causes to
cybersickness have been categorized into issues in devices and technology, individual
differences and design in applications.
Devices and technology
Poor and old hardware or bad optimization can cause lag in head-mounted displays
where the virtual environment does not follow users head movement in real-time thus
causing some symptoms (LaViola Jr., 2000; Kolasinksi, 1995; DiZio and Lackner,
1997). Similar to time lag, flickering of the screen is usually an unwanted feature in any
device and in virtual reality devices it can cause eyestrain (Kolasinski, 1995).
Kolasinski (1995) also found out that flickering is increased as field of view is
increasing which again strains the peripheral vision which is even more sensitive to
flicker than rest of the eye.
Field of view has also been studied vastly in simulator sickness and cybersickness
studies. It has been strongly connected to cybersickness symptoms usually so that larger

14
field of view increases symptoms (LaViola Jr. 2000; Seay, Krum, Hodges & Ribarsky
2002). DiZio and Lackner (1997) found out that when field of view was halved from
126 degrees to 63 degrees symptoms were halved too. Lin, Duh, Parker, Abi-Rached
and Furness (2002) found constant increase in simulator sickness scores as field of view
was widening, especially between 60, 100 and 140 degrees but not significantly beyond
140 degrees. Harvey and Howarth (2007) have found that wider field of view increases
sickness even when using a projector instead of head-mounted display making the effect
of field of view even more apparent. Fernandes and Feiner (2016) developed a dynamic
field of view where the field of view was decreased when users accelerated or rotated in
the virtual environment and noticed decreases in symptoms compared to static field of
view.
Compared to traditional displays head-mounted displays are connected straight to the
user’s head and have wires hanging from them which can already make the user feel
uncomfortable. As the head-mounted displays are very close to the user’s eyes and use
stereoscopic view, a poor calibration can cause sickness in users (McCauley and
Sharkey, 1992). With stereoscopic view interpupillary distance can be calibrated and
Regan and Price (1993) found out that, if users have smaller interpupillary distance than
the display they can suffer eyestrain and headache (as cited in Kolasinski, 1995). DiZio
and Lackner (1997) tested the effect of time lag and field of view but also the effect of
weight in head-mounted display which surprisingly did not affect the amount of
sickness even when the device weighted 2,44 kilograms. Depending of the device or
application used, sometimes users are forced to sit down or stand. Standing, however, is
more prone to instabilities in posture that cause more sickness (Rebenitsch, 2014,
Kolasinksi, 1995). This, however, is also partially an individual issue since not all
people are able to stand and therefore suffer from instability while standing.
Individuality
With great diversity among humans there are various features like age and gender that
affect the susceptibility and the amount of cybersickness experienced in virtual reality.
As motion and simulator sickness has been studied vastly in military pilots McCauley
and Sharkey (1992) noted that pilots are less susceptible to sickness than general
audience due to excessive training and exposure to the simulators. Lampton et al. (1994)
found out that longer exposure duration was strengthening the symptoms on some
participants also indicating some participants are not as susceptible to cybersickness as
others. Among general audience, some are sensitive and others practically immune to
any symptoms but regular exposure to virtual environments helps to adapt to the
condition (McCauley and Sharkey, 1992; Rebenitsch and Owen 2014; Keshavarz,
2016). Reason and Brand (1975) had noticed that that younger people gets more easily
sick in simulators than older people because older people have more experience in real-
world tasks that can help them to adapt to events in virtual environment (as cited by
Kolasinski, 1995). Golding (1998) has also noticed that nausea-inducing conditions, in
this case chemotherapy and migraine, correlate with susceptibility to motion sickness.
Rebenitsch and Owen (2014) conducted a similar study to find out connections from
childhood experiences in cybersickness as adults and found out correlations between
carnival rides in amusement parks, corrected vision and game play. History of motion
sickness was predicting cybersickness effectively and that people with past motion
sickness history tend to avoid virtual reality devices (Rebenitsch and Owen, 2014).
However, the study was affected by some participants wearing glasses or contact lenses
and their impact was not fully understood (Rebenitsch and Owen, 2014).

15
Some studies have also found out that women get more easily nauseous than males and
it has been argued that it is caused by difference in hormones and wider field of view in
females (Kolasinski 1995; LaViola Jr. 2000; Jaeger and Mourant, 2001). Some issues
like hangover and illnesses like flu and fatigue has been proven to induce symptoms in
virtual reality (LaViola Jr. 2000; Chowdhury, Mohammad, Ferdous & Quarles, 2017).
Surprisingly, low amounts of alcohol have been shown to lessen cybersickness
symptoms (Iskenderova, Weidner & Broll, 2017).
Applications and design
Effect of applications vary a lot because virtual reality has been studied and applied in
different devices and contexts. Scene content, controls, tasks, navigation and graphics
have all been studied and found to produce cybersickness. Kolasinksi (1995) has
reported that unpredictable events and decreased control can cause simulator sickness.
Stanney et al. (2002) compared different degrees of freedom and noticed that six
degrees of freedom produced more sickness than three degrees as they were studying
the effect of user control on performance. Dorado and Figueroa (2014) compared
movement in stairs and ramps with different mapping in the controllers and first of all
noticed significant differences in favor of ramps as they provided smoother motion but
also, with small difference, less symptoms with smoother controls. Lloarch, Evans and
Blat (2014) conducted similar study where they compared two navigation systems with
game controller and IMU-based position estimation system where the user had to take
few steps in real world to navigate in the virtual environment. Results revealed
significant differences in SSQ-TS values with game controller causing more sickness
(Lloarch et al. 2014). High rates of rotational acceleration and unpredictable motion
have also been noticed to cause sickness in simulators and virtual reality (McCauley and
Sharkey, 1992; Pausch and Crea, 1992; Kolasinski, 1995; LaValle, 2017). LaValle
(2017) sums in his book that acceleration is the highest contributing factor to
cybersickness because it causes strong vection.
Vection is an illusion of self-motion where the user is getting visual feedback that
makes the user feel motion even when they are not physically moving. Vection is
caused by a mismatch between virtual and real environment in visual and vestibular
systems which has been argued as the root source of cybersickness in sensory mismatch
theory. It is said to be one of the most prominent cause of cybersickness in modern
virtual realities especially as the hardware and devices have been evolved and the
virtual environments are more realistic than ever. The human brain can be fooled even
better than with earlier technology. With six degrees of freedom vection can occur on
any axis or direction if the viewport is rotated or accelerated. Vection can be intensified
by exposure time, spatial velocity and lot of moving details in the scene (LaValle,
2017).
Spatial velocity is a metric that can be used to quantify the amount of scene complexity
and scene movement in visual scenes (So, 1999). So, Ho and Lo (2001) have described
thoroughly how the complexity and movement can be calculated from the pixels of a
visual scene and found out significant results between the spatial velocity and
cybersickness. It has been found out that cybersickness is affected strongly by duration
of exposure and it is used as a variable in calculating spatial velocity to estimate
cybersickness amounts in virtual environments with strong evidence supporting the
theory (Lo, So, 1999; So, Ho & Lo, 2001). So, Lo and Ho (2001) studied the effect of
navigation speed on vection and cybersickness by using different rates of speed
randomly on subjects and noticed both vection and cybersickness rising from 3m/s to
10m/s and stabilizing until speeds beyond 59m/s. The results are similar to Hue et al.

16
(1997) where they used a horizontally rotating drum with different frequencies of black
and white stripes and noticed significant rises in cybersickness and vection amounts at
24 pairs of stripes but not between 6 and 12 or 48 and 96 pairs. Nooji, et al. (2017) says
the rotating drum with painted black and white stripes is traditional way to induce
circular vection but in their own study they used a rotating city landscape while
measuring vection and cybersickness in the subjects. They had significant results in
cybersickness scores with vection gain but not with vection variability or head and eye
movement which supports the sensory mismatch theory. Stoffregen and Smart (1998)
again have noticed connection between postural instability and vection as they rotated a
textured sheet around the participants to induce motion sickness and vection and all the
sick participants in their tests reported vection but only few from the well group did.
As vection has been seen to cause cybersickness there has been lot of debate whether
vection is a necessary prerequisite for cybersickness or can vection occur without
cybersickness. Keshavarz, Riecke, Hettinger and Campos (2015) have conducted a
literature review on the topic and concluded that vection can occur without
cybersickness but it has high risk on inducing cybersickness. The challenge in vection is
that there are not appropriate measurements for vection as it is very subjective
experience (Keshavarz et al., 2015; Palmisano, Allison, Schira & Barry, 2015).
Graphical factors are often independent to the user’s actions and thereby can cause
uncontrollable symptoms. Especially the fidelity of graphics and level of detail have
been found out to cause sickness. Kennedy, Lilienthal and Hettinger (1990) found early
on that graphical fidelity is causing sickness in participants (as cited by Davis et al.
2015). Johnson (2005) who studied military jet pilots found out that flying in higher
altitudes in simulators did not cause as much sickness as flying low also due to the
graphical fidelity. McCauley and Sharkey (1992) has argued that global visual flow is
causing the sickness in pilots and it can be calculated by dividing observer’s velocity by
its eye height above the surface. Although it has not been widely seen in cybersickness
studies it could be used to calculate and prevent sickness. Jaeger and Mourant (2001)
compared two scenes with different textures where other had more details in it and
found out that level of detail increases cybersickness symptoms in subjects. In a more
recent study by Davis et al. (2015) the level of details and visual flow showed
significant differences between two rollercoaster applications where they compared
high and low realism styles. Oyamada et al. (2007) has compared three stereoscopic
videos with computer generated graphics and real-life scenery and noticed that
participants suffered less eye stress with the real-life scenery indicating more realistic
scenery can also be beneficial to the user.
Depth perception has also been studied and found to affect cybersickness. Liu and Uang
(2015) studied the effect of different types of monitors and graphical styles with 3D and
2D models on presence and cybersickness and found out that 3D models with better
depth cues caused less cybersickness than flat 2D images. The SSQ results indicated
that lower level depth cues are producing more oculomotor mismatches (Liu and Uang,
2015). With lot of depth cues focusing and switching fixation point with foreground and
background objects can cause eye stress like in real life situation (Mon-Williams and
Wann, 1998).
Effect of colors and contrast has not found to cause sickness in modern devices but in
old systems they were often dependent on resolution and flickering which have found to
cause sickness in simulators (Kolasinski, 1995). Like LaValle (2017) has pointed out
human eye sees most clearly at the center of the vision and is sensitive from the

17
peripheral fields, Budhiraja (2015) has found out that by adding blur effect to the sides
of the screens, the symptoms have decreased on most prone subjects.
2.3 Immersion and presence
Immersion and presence have been studied vastly in computer technology and virtual
reality. Studies about head-mounted displays usually refer immersion as the technical
properties like field of view and resolution. In some studies of cybersickness immersion
was referred as the exposure to the virtual environment. Generally, immersion might be
better known as a state of deep concentration and ignorance to stimulation outside the
virtual environment. Slater and Wilbur (1997) have defined immersion as objective
measurements of the technology capable creating realistic virtual environments and
presence as sense of being in some place.
One of the earliest studies on presence by Sheridan (1992) defined telepresence as sense
of being physically present with virtual objects at a remote site, and virtual presence as
sense of being physically present with virtual objects, experienced by visual, audial and
force displays generated by a computer. At the same time Held and Durlach (1992)
argued that there is a lack of adequate definition and measurements for presence, and
also that presence has not been proved to increase performance of the user. Witmer and
Singer (1998) has then claimed that presence has been often linked to the performance
of a virtual environment and is critical aspect of virtual environments. Johns et al.
(2000) have also argued that presence can be used to evaluate performance of virtual
environment with supporting results from Stanney et al. (2002) study on performance
and presence. Nichols, Haldane and Wilson (1999) have described presence as
multifactorial phenomena and a critical component for effective virtual environment.
Witmer and Singer (1998) have defined presence as subjective experience of feeling of
being another place while physically staying still. They define immersion as a
psychological state where the user perceives itself to be part of the virtual environment
that provides a constant and coherent stimulation (Witmer and Singer, 1998). Based on
the earlier work of Sheridan (1992), Witmer and Singer (1998) have categorized control
factors, sensory factors, distraction factors and realism factors as contributing elements
to forming of presence. Realism factor is said to improve presence if user is presented
with realistic graphics, consistency to real world objects and meaningful experiences in
the virtual environment (Witmer and Singer, 1998). However, high realism may result
in higher separation anxiety or disorientation when user exits the virtual environment to
the real world (Witmer and Singer, 1998).
As immersion and presence are highly subjective experiences they are studied mostly
with questionnaires and interviews (Nichols et al. 2000). Held and Durlach (1992) have
proposed that the amount humans react based on their reflexes, like dodging objects, on
virtual environment could measure presence. Based on their earlier work Witmer and
Singer (1998) have developed and validated a Presence Questionnaire and Immersive
Tendencies Questionnaire to measure presence and to understand individual differences
in sensing presence and in predicting presence. Both questionnaires use seven-point
scales to report experience from either the virtual environment experience or earlier
experiences on television, movies, sports and games which are used to measure the
tendency to experience immersion (Witmer and Singer, 1998). Johns et al. (2000) have
tried to confirm the results from Witmer and Singer (1998) study by comparing two
different applications where other application had realistic avatars and textures and

18
other application had simple box avatars and shaded objects without textures. In their
study they found that results from Immersive Tendencies Questionnaire and Presence
Questionnaire correlated only in the higher realism application and only small
difference in presence between the applications (Johns et al. 2000). The questionnaires
have been since revised by Witmer, Jerome and Singer (2005) and by Cyberpsychology
Lab of UQO (2017) with varying results and factors for measuring presence. Witmer et
al. (2005) have proposed four factors instead of the original six factors and dropping
items, questions, to 29 from original 32. Cyberpsychology Lab of UQO (2017) has
revised the questionnaires at 2004 and proposed seven factors and only 24 items. While
presence has been noticed to improve learning and performance, it has also been noticed
that presence and simulator sickness correlate negatively as sickness can disrupt the
feeling of presence (Witmer and Singer, 1998).
As in cybersickness studies, immersion and presence has been studied similarly from
device, individual and application perspectives. Seay et al. (2002) compared different
field of view (60 and 180 degrees), display type and user role (driver vs. passenger) on
simulator sickness and presence and found out higher field of view and driver role
increased presence in the participants. Contrary to Witmer and Singer (1998) study,
presence increased as nausea scores increased too (Seay et al. 2002). Fernandes and
Feiner (2016) measured also presence with same version of the questionnaire and
compared a dynamic field of view with static field of views of 70 and 80 degrees but
did not find significant differences between these conditions. Gamito et al. (2008)
conducted a study on a virtual classroom where they measured immersion, presence and
cybersickness and compared the results to some previous studies. They found higher
levels of presence and lower levels of cybersickness compared to previous studies but
also significant differences between men and women (Gamito et al. 2008). Presence was
measured with Cyberpsychology Lab of UQO version of the questionnaire (Gamito et
al. 2008). Stanney et al. (2002) have studied effects of presence and cybersickness on
performance by altering degrees of freedom on user controls, exposure time and scene
complexity. Higher degree of freedom resulted in higher overall performance and
presence but also on higher cybersickness (Stanney et al. 2002). Exposure duration also
raised overall performance and cybersickness but only slightly presence (Stanney et al.
2002). The study indicates presence does not necessarily increase with performance or
cybersickness but can correlate positively with both. In graphical studies Liu and Uang
(2015) found out 3D models increase presence on elderly people compared to 2D
images on a virtual store. Jonatan et al. (2017) has compared effect of geometry realism
to presence and found out higher realism causes more realism as participants reported a
sensation of “being there” and their pulse was increasing momentarily indicating higher
fear due to horror game played.

19
3. Research problem
Research questions and hypotheses, methods and scope of the study are presented in this
chapter. The research problem aims to answer if visually high realistic graphics cause
more cybersickness than lower realism. Another research question aims to answer if
cybersickness disturbs presence. Quantitative research methods have been chosen
because the questionnaires used are standard in cybersickness studies. Some qualitative
methods have been applied to elaborate the effects and differences between the
applications. As both quantitative and qualitative methods have been utilized the study
is a mixed method study. Scope of the study is limited to only head-mounted devices
and testing graphics only.
3.1 Research questions
Primary goal of the study is to answer if high visual realism causes more cybersickness
than low visual realism by comparing three graphical styles on a virtual reality
application with modern head-mounted devices. Effects of graphics and realism has
been studied in the past but many of the studies have been conducted with old
technology and it is justifiable to experiment with new modern technology. Some
studies also have altered only the level of detail in textures so a more comprehensive
perspective on visual realism can bring new insights to current literature. With three
different conditions we can confirm that high visual realism causes more cybersickness
than low visual realism if cybersickness increases as the realism increases between the
applications.
RQ1: Does high visual realism cause more cybersickness than low visual realism?
Secondary goal is to find out if cybersickness disturbs presence. Presence has been
studied in virtual reality and it has been argued to be one of the most important features
on immersing users. It also has been studied with cybersickness and some studies claim
cybersickness can disturb presence, but some studies have found users can withstand
cybersickness while maintaining sense of presence. To confirm that cybersickness
disturbs presence, presence should be lower when cybersickness increases.
RQ2: Does cybersickness disturb the sense of presence?
Both research questions are answered by measuring cybersickness and presence with
fitting questionnaires. Higher reported scores indicate higher cybersickness and
presence.
3.2 Research method
In the study there are three applications that have different graphical styles but are
otherwise almost completely identical. The applications are described in detail in
chapter 4.1.

20
The research is conducted as laboratory experiments, where all the variables can be
controlled. To compare the graphical style effectively other factors like controls and
navigation have been either eliminated or standardized between the applications.
Controls have been limited so that the participants are forced to walk the same route in
same pace and only head movement is allowed. Exposure time has been set to 15
minutes and sounds have been removed. Similar study has been conducted by Davis et
al. (2015) where two virtual roller coaster applications with different graphical styles
has been compared. Unlike in study by Davis et al. (2015) study, the navigation and
environment are same between the conditions in the current study. The level of
interaction is same across the applications and the aim of this study is not to provoke
any excessive amounts of sickness in participants but to provide similar experience that
could be used in games or virtual simulators. Current study aims to further study the
effect of visual realism by focusing on graphical factors solely.
The data is collected by different questionnaires, observations and interviews. As the
participants were contacted by email they were asked to enter their personal information
(age, gender) as well as previous experiences on virtual reality and cybersickness into
an online questionnaire. Participants also filled the Motion Sickness Susceptibility
Questionnaire (Golding, 1998). At the laboratory participants filled the Immersive
Tendencies Questionnaire (Cyberpsychology Lab of UQO, 2017) before running the
application. This also reduced the length of the online questionnaire and let the
participants cool down a bit before the test. During the test, Fast Motion Sickness
(Keshavarz and Hecht, 2011) questionnaire was utilized, asking the participants to
report their level of nausea from scale 0 to 20 every two minutes (0 means no symptoms
and 20 means the test must be stopped). If there were any symptoms, participants were
asked to elaborate with few words to get data on where and what symptoms occurred.
After the test, participants first filled out the Simulator Sickness Questionnaire
(Kennedy et al. 1993) because the symptoms can disappear if it was filled any later.
After Simulator Sickness Questionnaire, participants filled the Presence Questionnaire
(Cyberpsychology Lab of UQO, 2017). At the end of the session participants were
structurally interviewed about their experiences and opinions about the applications and
tests.
3.3 Scope and limitations
To study effectively the effect of visual realism and graphical styles on cybersickness
sound, interaction and haptics have been excluded completely from the study. To further
reduce the scope only two devices are used in the tests to reduce the effect of different
resolutions, field of views and overall performance. Due to the constraints of the
applications two different computers and versions of Oculus devices have been used in
the test sessions as in ideal situation only one system should have been used. The first
application has been tested with the Oculus Development Kit 1 and the second and third
applications with the Oculus Rift.
To measure graphics exclusively, visual flow, lighting, depth of field and quality of
textures have been altered. There are however factors like acceleration and rotation that
the participants experience during the test and that are heavily related to the graphics.
These factors have been controlled by developing an automatic route in the application
that the participants are forced to walk. This applies to the second and third applications
which run on the same system. The first application uses a different computer and a
manually controlled route, so the rotation and acceleration cannot be controlled as

21
accurately. However, the length and path of the route are the same. Rotation occurs in
the route only on horizontal axis to guide the participants and to avoid physical rotation
of the participants.
In this study, participants’ symptoms during and after exposure to virtual environment
are observed and any symptom that occur before the exposure are unwanted. Therefore,
participants that have any acute or long-term diseases or symptoms that might affect the
results have been asked not to take part in the study.
The data collection utilizes only subjective questionnaires where test participants report
their symptoms and experiences. Objective measures like physiological measures or
postural stability were not monitored or measured.

22
4. Experiments and data analysis
In this chapter, the laboratory environment, execution of the tests and analysis of the
data are described. First tests indicated there are differences between the applications,
but analysis revealed the differences were minor. Data amount was seen insufficient, so
more tests were conducted but results remained insignificant although some changes
appeared. Chapter 4.1 introduces the laboratory, methods, equipment and environment
that were chosen for the tests. Chapter 4.2 describes the pilot tests conducted and how
their results were implemented in the main study. Chapter 4.3 analyzes the data from the
main study. Each questionnaire is analyzed, and the results are described without
making any conclusions yet.
4.1 Laboratory, application and system design
Experiments were conducted in a demo room of Center for Ubiquitous Computing at
Oulu University. Participants were contacted by email lists found at Oulu University
web sites. Email contained introduction to the study and link to the pre-questionnaire
which included the Motion Sickness Susceptibility Questionnaire and link to Calendly
time appointment software. After participants had filled the questionnaire they could
reserve a time for the test and see the location of the demo room with contact details of
the moderator. Participants could reserve the time in a total span of three weeks from
8:30 to 16:00 during summer and fall 2017, which probably limited the number of
participants. Participants had a total of 45 minutes time to conduct all the questionnaires
and the test. The demo room (Figure 2) included two different computer systems where
the PC system was connected to a large television screen where moderator could see the
application running. Participants were standing in the middle of the room where they
had small area to walk and look around. Also, the video camera was adjusted so both
participant and TV screen could be recorded. On the MacBook system the application
could not been recorded as the TV screen was not connected to the laptop and test
moderator was standing between the camera and computer. The room was lit by lights
in the room so the light coming from outside was blocked and participants were exposed
to similar lighting both before and after the exposure to the virtual environment. Room
temperature was also measured and monitored with constant temperature at 21 Celsius
throughout the experiments.

23
Figure 2. The laboratory setting with Oculus CV and screen for observation
In total 53 participants answered to the pre-questionnaire and were selected to the
experiment. 35 participants were male and 17 females. Most of participants were active
Finnish students from various faculties but exact distribution of status, culture or
language was not collected. Youngest participants were 21 years old, while the oldest
was 41 years old, average age of participants 27 years. Most of the participants had used
some virtual reality device before (73%). Out of all participants majority had used it
from 1 to 5 times (53%). Only one participant had used virtual reality devices over 20
times. Figure 3 describes the devices that participants had used before the test session
(Oculus represents any device manufactured by Oculus). Out of all participants who had
used some virtual reality device (n = 39), 17 participants reported they had experienced
cybersickness before (44%). None of the participants reported any diseases or
conditions that could disturb the test.

24
Figure 3. Devices by Oculus has been most popular among participants.
Three different applications on two different computer systems were prepared for the
tests. Applications were almost identical except for the graphical style. The
environments were modeled after Kizhi Island at Karelia Russia and they were named
accordingly Kizhi1, Kizhi2 and Kizhi3. Applications contained four buildings from
which one could be entered. First computer system consisted of a MacBook pro and
Oculus Development Kit 1. The application was run on Rocket client on RealXtend
Meshmoon engine (Alatalo, 2011). Second system was a desktop computer with Oculus
Rift and it was run on Unreal 4 Editor. Table 1 sums up the computer system
specifications.
Table 1. Computer systems where applications were run.
System 1 System 2
Head-mounted device Oculus Development Kit
1
Oculus Rift
Environment RealXtend Meshmoon Unreal 4 Editor
Application Kizhi1 Kizhi2, Kizhi3
Computer MacBook pro PC
Operating System OS X El Capitan 10.11.3 Windows 10, 64-bit
Processor 2,6 GHz Intel Core i5 3,2 GHz Intel Core i5
Display Adapter Intel iris, 1563 Mt GeForce GTX 960
RAM 8 Gt, 1600 MHz DDR3 16 GB
25
Each application had a pre-defined route as it is drawn in Figure 4. During the test
participants automatically followed this route, so that the exposure to the environment
would be similar among conditions. Route begins from the isolated building (rightmost
building in Figure 4) and goes through the gate and inside the church in the middle.
After going through each room, the route returns outside and circulates the leftmost
church. After that, the route returns inside the church again and takes a final trip around
the rightmost house before returning the starting point. Pace of the navigation was kept
relatively slow, so that the navigation resembles walking like in games and virtual
tourism. This was also to control amount of cybersickness so that participants would
endure the whole 15 minutes of exposure and enough data could be acquired. Rotation
was also kept smooth to minimize the symptoms caused by the navigation. The route
contained both indoor and outdoor environments so there would be variety in graphical
fidelity and visual flow. The stairs at the church will also place some height differences
in he scene as well as the hills outside.
Figure 4. The route that participants were forced to walk with points of times for fast
motion sickness marked.
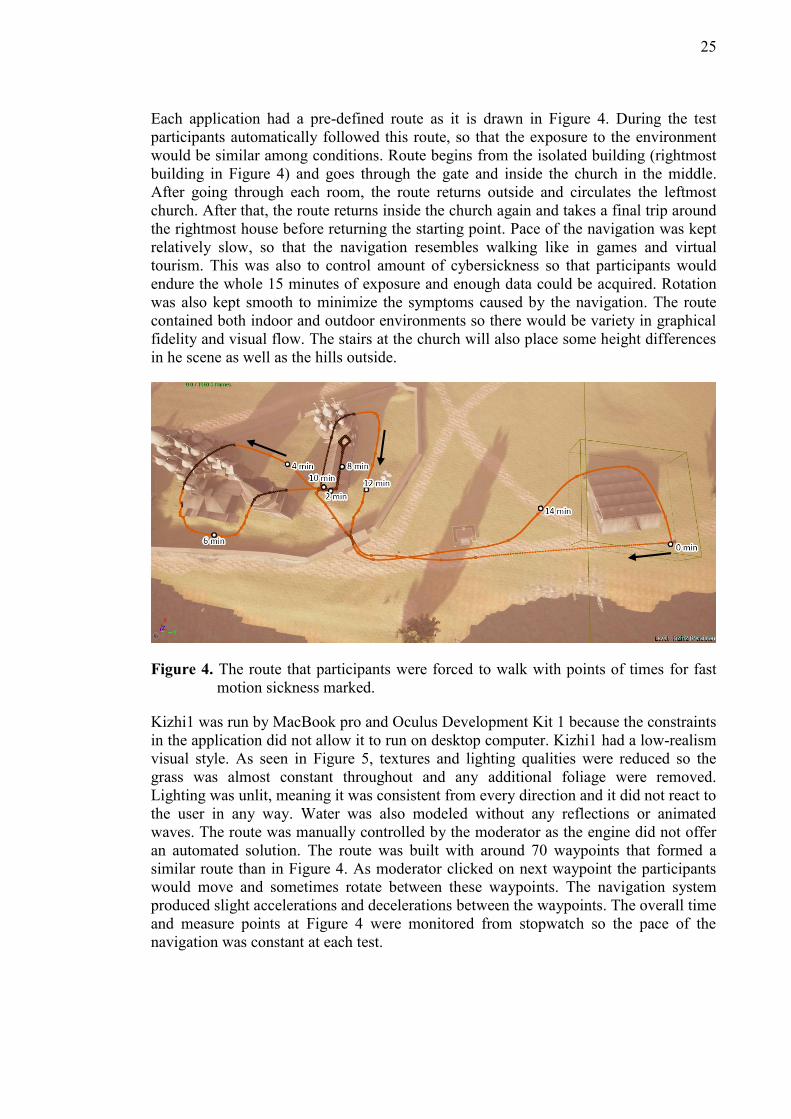
Kizhi1 was run by MacBook pro and Oculus Development Kit 1 because the constraints
in the application did not allow it to run on desktop computer. Kizhi1 had a low-realism
visual style. As seen in Figure 5, textures and lighting qualities were reduced so the
grass was almost constant throughout and any additional foliage were removed.
Lighting was unlit, meaning it was consistent from every direction and it did not react to
the user in any way. Water was also modeled without any reflections or animated
waves. The route was manually controlled by the moderator as the engine did not offer
an automated solution. The route was built with around 70 waypoints that formed a
similar route than in Figure 4. As moderator clicked on next waypoint the participants
would move and sometimes rotate between these waypoints. The navigation system
produced slight accelerations and decelerations between the waypoints. The overall time
and measure points at Figure 4 were monitored from stopwatch so the pace of the
navigation was constant at each test.
26
Figure 5. Kizhi1 low-graphical style has simple lighting and textures.
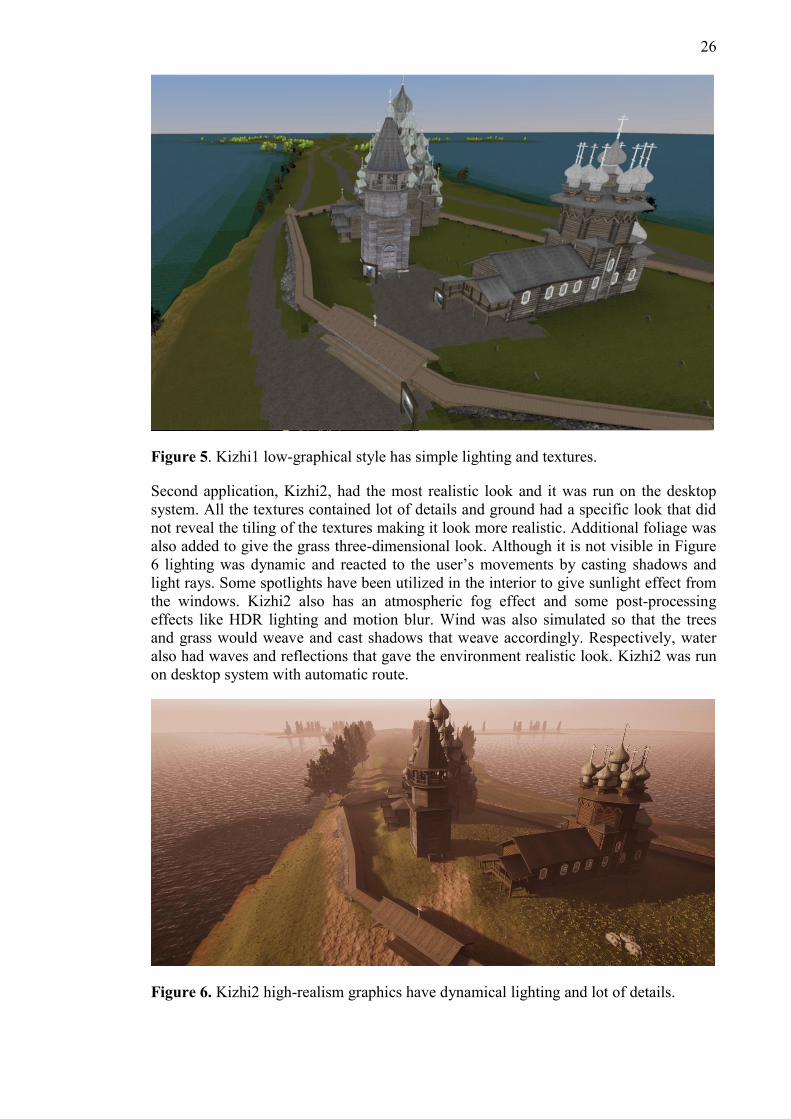
Second application, Kizhi2, had the most realistic look and it was run on the desktop
system. All the textures contained lot of details and ground had a specific look that did
not reveal the tiling of the textures making it look more realistic. Additional foliage was
also added to give the grass three-dimensional look. Although it is not visible in Figure
6 lighting was dynamic and reacted to the user’s movements by casting shadows and
light rays. Some spotlights have been utilized in the interior to give sunlight effect from
the windows. Kizhi2 also has an atmospheric fog effect and some post-processing
effects like HDR lighting and motion blur. Wind was also simulated so that the trees
and grass would weave and cast shadows that weave accordingly. Respectively, water
also had waves and reflections that gave the environment realistic look. Kizhi2 was run
on desktop system with automatic route.
Figure 6. Kizhi2 high-realism graphics have dynamical lighting and lot of details.

27
To further test the graphical styles the third application, Kizhi3, had all the textures
replaced by color constants and lighting was altered with a cel-shading effect to
minimize the three-dimensional look. Lighting was kept dynamic as some shadows
were cast. Shadows had hard edges unlike in Kizhi2 as Figure 7 shows. As a side effect,
the environment had a nocturnal look due to incompatibility of the skybox. Kizhi3 was
also run with a desktop system with automatic route.
Figure 7. Cel-shading effect on Kizhi3 has the lowest amount of details and simple
lighting.
Graphical realism was altered by changing the amount of details in textures and
reducing quality of lighting. As lighting affects all the textures and overall mood of the
application, the effects of a graphical style are a sum of many factors.
4.2 Pilot tests
Each application was tested in a pilot test before the actual tests to confirm the
feasibility of the method and find any bugs in the systems. Three participants filled the
online pre-questionnaire before coming to the laboratory. Each application was tested
for 15 minutes. After each run, the Simulator Sickness Questionnaire (Kennedy et al.
1993) and an interview were conducted. Fast Motion Sickness (Keshavarz and Hecht,
2011), Motion Sickness Susceptibility Questionnaire (Golding, 1998), Immersive
Tendencies Questionnaire (Cyberpsychology Lab Of UQO, 2017) and Presence
Questionnaire (Cyberpsychology Lab Of UQO, 2017) were not piloted.
Pre-questionnaire revealed every participant was a male between ages 25 and 30 and
had used some virtual reality device a few times. Only one participant remembered he
had used Oculus Rift. None of the participants had experienced any cybersickness
before or had any diseases or conditions that could disturb the test. Simulator Sickness
Questionnaire revealed some symptoms in each participant, so each application was
causing some cybersickness although the results were low. Interviews revealed many
symptoms including sweating, stomach awareness, headache and eye strain. One
participant reported some symptoms at Simulator Sickness Questionnaire but none at
interview. Flickering graphics, fast pace and eye strain were experienced as most
disturbing aspects in the applications. Navigation was felt mostly smooth and easy to
predict. Vection was reported but interviewer was not sure if all the participants

28
understood the concept of vection. Participants felt immersion during tests and all but
Kizhi3 were seen visually realistic. Distance between the buildings was easy to perceive
in all but Kizhi1.
Applications performed well and each questionnaire was seen appropriate to test the
effect of graphical realism and style in cybersickness. Cel-shading was not seen
sufficient in Kizhi3 so the textures were replaced with color constants at this point to
improve the effect and remove depth perception cues. To get data during the test run,
Fast Motion Sickness (Keshavarz and Hecht, 2011) questionnaire would be applied on
actual sessions. To study the effect of immersion participant felt during test, the
interview form was updated so the level of immersion was asked from 1 to 20. Asking
about vection was dropped out of the interview because explaining the concept behind it
and measuring it were not seen valid. To further study immersion and presence,
Immersive Tendencies Questionnaire and Presence Questionnaire were included. For
backup, actual tests were also decided to be video recorded.
4.3 Data analysis and findings
In total, 53 tests were run on the applications. Tests were conducted in two different
phases where the first phase included 33 tests and second phase additional 20 tests. In
total, 38 individuals participated in the tests because 15 participants from first phase
participated in the second phase also. Phases were conducted over two weeks apart from
each other.
4.3.1 Simulator Sickness Questionnaire
In first phase, each application was tested 11 times. SSQ values were scored and
weighted as in Kennedy et al. (1993) study. It was found that the minimum score of
SSQ-T was 0 and maximum 1554 with a mean of 316,08 which indicated a light-tailed
distribution and an additional test of normality was run. Shapiro-Wilk test revealed that
the distribution indeed was not distributed normally (p = 0,00 < 0,05). Total amounts of
SSQ-T indicated there are differences in cybersickness amounts between each
application as seen in Table 2. However, Kruskal-Wallis H test did not find such
differences in either SSQ-T (p = 0,936 > 0,05) or FMS (p = 0,649 > 0,05).
Table 2. SSQ-T results from 33 participants summed.
N SSQ-T
Kizhi1 11 3284
Kizhi2 11 4306
Kizhi3 11 2840
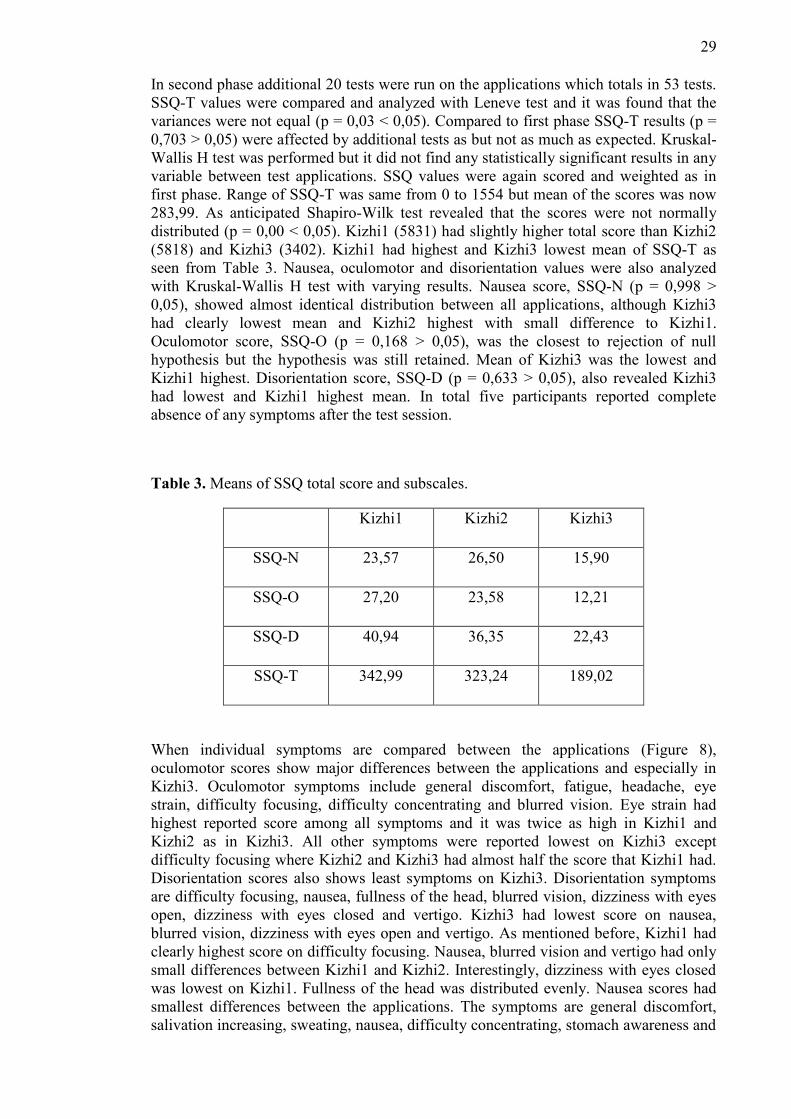
29
In second phase additional 20 tests were run on the applications which totals in 53 tests.
SSQ-T values were compared and analyzed with Leneve test and it was found that the
variances were not equal (p = 0,03 < 0,05). Compared to first phase SSQ-T results (p =
0,703 > 0,05) were affected by additional tests as but not as much as expected. Kruskal-
Wallis H test was performed but it did not find any statistically significant results in any
variable between test applications. SSQ values were again scored and weighted as in
first phase. Range of SSQ-T was same from 0 to 1554 but mean of the scores was now
283,99. As anticipated Shapiro-Wilk test revealed that the scores were not normally
distributed (p = 0,00 < 0,05). Kizhi1 (5831) had slightly higher total score than Kizhi2
(5818) and Kizhi3 (3402). Kizhi1 had highest and Kizhi3 lowest mean of SSQ-T as
seen from Table 3. Nausea, oculomotor and disorientation values were also analyzed
with Kruskal-Wallis H test with varying results. Nausea score, SSQ-N (p = 0,998 >
0,05), showed almost identical distribution between all applications, although Kizhi3
had clearly lowest mean and Kizhi2 highest with small difference to Kizhi1.
Oculomotor score, SSQ-O (p = 0,168 > 0,05), was the closest to rejection of null
hypothesis but the hypothesis was still retained. Mean of Kizhi3 was the lowest and
Kizhi1 highest. Disorientation score, SSQ-D (p = 0,633 > 0,05), also revealed Kizhi3
had lowest and Kizhi1 highest mean. In total five participants reported complete
absence of any symptoms after the test session.
Table 3. Means of SSQ total score and subscales.
Kizhi1 Kizhi2 Kizhi3
SSQ-N 23,57 26,50 15,90
SSQ-O 27,20 23,58 12,21
SSQ-D 40,94 36,35 22,43
SSQ-T 342,99 323,24 189,02
When individual symptoms are compared between the applications (Figure 8),
oculomotor scores show major differences between the applications and especially in
Kizhi3. Oculomotor symptoms include general discomfort, fatigue, headache, eye
strain, difficulty focusing, difficulty concentrating and blurred vision. Eye strain had
highest reported score among all symptoms and it was twice as high in Kizhi1 and
Kizhi2 as in Kizhi3. All other symptoms were reported lowest on Kizhi3 except
difficulty focusing where Kizhi2 and Kizhi3 had almost half the score that Kizhi1 had.
Disorientation scores also shows least symptoms on Kizhi3. Disorientation symptoms
are difficulty focusing, nausea, fullness of the head, blurred vision, dizziness with eyes
open, dizziness with eyes closed and vertigo. Kizhi3 had lowest score on nausea,
blurred vision, dizziness with eyes open and vertigo. As mentioned before, Kizhi1 had
clearly highest score on difficulty focusing. Nausea, blurred vision and vertigo had only
small differences between Kizhi1 and Kizhi2. Interestingly, dizziness with eyes closed
was lowest on Kizhi1. Fullness of the head was distributed evenly. Nausea scores had
smallest differences between the applications. The symptoms are general discomfort,
salivation increasing, sweating, nausea, difficulty concentrating, stomach awareness and

30
burping. Only notable differences are high score on general discomfort on Kizhi2, high
score on salivation increasing on Kizhi1 and low scores on nausea and difficulty
concentrating on Kizhi3.
Figure 8. Total scores of individual items from SSQ.
Inspecting individual participants non-weighted SSQ-T, there are in total 5 participants
with over 20 score. Three of them tested Kizhi1 and two Kizhi2 applications. There are
in total 25 participants that have SSQ-T less than 5 and 38 that have SSQ-T less than 8.
Kizhi3 has majority of the participants under these scores in both cases. With Kizhi1
and Kizhi2, majority has over 5 SSQ-T but less than half under 8.
4.3.2 Fast Motion Sickness
Fast Motion Sickness (Keshavarz, and Hecht, 2011) scores were measured and analyzed
from each participant and the total amount (FMS-T) as well as the amount from the last
minute (FMS) were compared between the applications. Further analyses were done
also on mean values of
For effective comparison to SSQ data Kruskal-Wallis test was performed also. Kruskal-
Wallis H test did not find anything significant in either FMS-T (p = 0,472 > 0,05) nor
FMS (p = 0,223 > 0,05). Total amounts of fast motion sickness, FMS-T, was calculated
by summing the all the FMS scores from each participant and they indicate Kizhi2 (348)
caused the most sickness, Kizhi1 (279) clearly less and Kizhi3 (199) the least. Last
minute FMS scores show Kizhi2 (57) scores were also the highest, Kizhi1 (46) scores
slightly lower and Kizhi3 (23) lowest. Mean FMS data was tested with Leneve test and
it was found that the variances were similar (p= 0,07 > 0,05), and enough for ANOVA
test. The differences between the applications were significant (p = 0,01 < 0,05) and eta-
square revealed the effect size was large at 0,33. Comparing the mean values of peak
FMS, highest amounts of sickness reported, Kizhi2 (5,1) had the highest mean
compared to Kizhi1 (3,8) and Kizhi3 (2,7) means.

31
As participants were evaluating their condition in more general level than in Simulator
Sickness Questionnaire (Kennedy et al, 1993), increased amount of zero scores (n = 11)
were reported. One participant felt too nauseous to continue at 12 minutes and had to
stop the test.
Figure 9. FMS scores combined between the applications at 2-minute intervals.
Inspecting combined FMS data from each application it can be seen the amount of
cybersickness was not constantly increasing. Figure 9 shows two spikes at 2 and 10-
minute points and when compared to Figure 1 these points fall on next to the building
near the stairs when participants where entering and exiting the building. The highest
point is when the participants exited the building for the second time. At this point
participants had been exposed to the interiors of the building before coming to the stairs
unlike in the first time when going the stairs up.
Figure 10. Reported FMS scores from each application at 2-minute intervals.

32
Figure 10 shows FMS scores from each application. Kizhi2 had highest sickness scores
throughout the test run. Kizhi3 had higher score than kizhi1 at beginning before
dropping at 4-minute point. The first 2 minutes included participants walking long path
from the remote building to the gate and a small uphill before entering the building.
Between 4- and 8 minute-points, Kizhi3 is decreasing and stabilizing as both Kizhi1 and
Kizhi2 keep rising. When compared to the map at Figure 1 participants were travelling
outside around the big church. It cannot be seen from the map but there is a small
downhill where participants were also rotating slightly at the corner of the building. In
the end scores of Kizhi1 are rising unlike in other applications. Kizhi1 scores were
increasing slightly at the end which can be explained with the manual navigation system
because the moderator had to speed up the pace towards end to reach same point as in
other applications.
4.3.3 Interviews
Participants were interviewed after last questionnaire and they were asked about the
virtual reality experience on a general level with open-ended specific questions with
closed-ended questions. When asked “what was the worst part in the application
(causing most sickness)?” 24 participants reported height differences like walking on
the stairs of the church or at the hills outside. Results were distributed evenly among the
applications with 7 to 9 reports for each application. Height differences were the highest
reported worst part on each application as Table 4 shows. Inside house and rotation
were reported several times and they were often reported together as ‘rotation inside
building’. At analysis these cases have been analyzed as rotation. In total, four
participants reported nothing as the worst part indicating they did not feel any
symptoms during the test. The applications had some performance issues and they have
been reported several times. Flickering is second most reported worst part in Kizhi2
where low fps and flickering of the graphics was reported in total three times. Flickering
was reported inside the church as the textures were bugging at some points. Colors
changing in Kizhi3 was an unwanted effect caused by compatibility issues of cel
shading and light shafts from directional lighting. In Kizhi1 poor performance is caused
either by the Oculus DK1 or MacBook lagging.

33
Table 4. Frequencies of reported worst cybersickness inducers during the test
Kizhi1 Kizhi2 Kizhi3
7 = height differences 8 = height differences 9 = height differences
4 = inside house 3 = flickering 3 = rotation
2 = nothing 1 = inside house 2 = colors changing
1 = poor performance 1 = nothing 1 = inside house
1 = focusing 1 = pass close objects 1 = nothing
1 = pass through objects 1 = pass through objects 1 = beginning
1 = rotation 1 = sunlight, realism 1 = motion
1 = exiting building
1 = time
As the applications graphical realism and styles varied, participants were also asked
“were the graphics realistic?” to see how they perceive the graphics. Predictably Kizhi2
was seen mostly realistic (n=17) while Kizhi1 (n=7) and Kizhi3 (n=4) were not. When
asked to rate from 1 to 20 how immersed participants felt during the test Kizhi2 had the
highest score of 185 followed by Kizhi1 with 174 score and Kizhi3 with 157.
Immersion was also tested with Kruskal Wallis H test, but the test did not show any
significant differences between the immersion felt by the participants (p = 0,483 <
0,05). To see how participants experienced the navigation they were asked “was the
navigation smooth or stiff?” and “was it easy or hard to predict where you were
going?”. Most participants (n=50) felt that the route was easy predict and the navigation
was smooth (n=40). Only Kizhi1 navigation was reported stiffer (n=9) than smooth
(n=8). As cel-shading was flatting the surfaces on the Kizhi3 application participants,
were asked “was it hard to tell the distances between the buildings or objects”. Only one
participant from Kizhi1 and three from Kizhi3 reported it was hard. Participants were
also explained shortly that vection is an illusion of self-movement when vision is
strongly stimulated but when body stays still. Feeling of vection was reported 8 times in
Kizhi1 and Kizhi3 and 10 times in Kizhi2. Participants were asked where they felt the
vection and they reported frequently stairs, hills, doors and other objects getting close.
Also, nervousness, instability in balance and feeling of an invisible force were reported
so the reports of vection are not considered valid.
4.3.4 Presence Questionnaire
Presence Questionnaire (Cyberpsychology Lab of UQO, 2017), measures the amount of
presence in participants in terms of realism, controls, interface and self-evaluation.
Sounds and haptics were left out from the questionnaire as the applications did not have
neither. The questionnaire was conducted after the test session, so the results are
dependent on the graphical realism and style of the applications. There were not any

34
significant differences in presence total scores, PQ-T (p = 0,173 > 0,05), but the test
indicates the Kizhi2 group felt the most presence as seen in Table 6. Especially when
inspecting the realism factor, PQ-R, (p = 0,146 > 0,05) Kizhi2 was felt the most realistic
and surprisingly Kizhi1 least realistic. Interestingly, possibility to act, PQ-PA (p = 0,346
> 0,05), was slightly lower in Kizhi1 and Oculus DK1 which did not react to
participants movements in the room but used only head tracking. Possibility to examine,
PQ-PE (p = 0,579 > 0,05), quality of interface, PQ-QI (p = 0,64 > 0,05), and self-
evaluation of performance, PQ-SP (p = 0,824) showed least differences of all the factors
analyzed.
Table 6. Means of PQ total scores and subscales.
Kizhi1 Kizhi2 Kizhi3
PQ-R 22,88 28,06 24,00
PQ-PA 14,12 16,44 16,11
PQ-QI 10,12 10,72 10,39
PQ-PE 14,18 14,56 14,00
PQ-SP 10,12 10,28 10,67
PQ-T 71,41 80,06 75,17
Realism factor had clearly highest score on Kizhi2. Realism factor consist of seven
different items that measure involvement to visual aspects, consistency to real world,
overall involvement of the experience, moving in the virtual environment and
interacting with the objects. Kizhi1 had lowest score on each item and Kizhi2 highest
except on involvement of the experience on the virtual environment where Kizhi3 had
same score. Differences were quite small between Kizhi1 and Kizhi3. Possibility to act
has four items that measures how much participants could control the events or survey
the environment in the application. It also measures the responsiveness of participants
actions and if they could anticipate the outcomes of their actions. Kizhi1 had slightly
lower score on possibility to act and reported lowest scores no each item. Differences
between Kizhi2 and Kizhi3 were non-existent. Self-evaluation of performance measures
adaptation time and feeling of proficiency in moving and interacting inside the
application. Adaption time is measured on a scale of not at all to less than a minute.
Every participant reported they could adapt to the virtual environment but Kizhi1
participant reported slightly slower adaptation time than Kizhi2 and Kizhi3 participants.
Quality of interface and possibility to examine had smallest differences between the
applications and did not yield any notable differences. Quality of interface consists of
three items that measure if there were any interferes between the actions and outcomes.
Two of the items measure if controls or visual display interfered with the actions and
last one if there was any delay between the actions and outcomes. Possibility to examine
has three items that focus on the ability to examine the virtual environment. First two
items measure how closely the participants could examine the objects and if they could
examine them from multiple viewpoints. Last item measures how well they could
concentrate on the task rather than the controls.

35
4.3.5 Immersive Tendencies Questionnaire
Immersive Tendencies Questionnaire measures the tendency to get immersed in various
medias and factors of focus, involvement, emotion and games can be calculated. As it
was measured before the test, the score does not represent the graphical realism or style
but the participants. Kruskal-Wallis H test indicates (p = 0,102 < 0,05) that participants
were not distributed evenly to the applications based on their tendency to get immersed.
Especially participants from Kizhi2 seemed to have the lowest mean score when
comparing the total scores of ITQ (Table 5). Results from involvement, ITQ-I (p =
0,053 > 0,05), games, ITQ-G (p = 0,077 > 0,05), and focus, ITQ-F (p = 0,133 > 0,05),
revealed similar scores where Kizhi2 participants had lowest scores. Only scores from
emotions, ITQ-E (p = 0,588 > 0,05), showed more even distribution where Kizhi1
participants scored highest and Kizhi3 participant lowest with small differences.
Table 5. Means of ITQ total scores and subscales.
Kizhi1 Kizhi2 Kizhi3
ITQ-F 24,94 22,50 25,17
ITQ-I 21,76 17,22 20,83
ITQ-E 16,94 16,33 15,67
ITQ-G 12 9,5 11,39
ITQ 80,18 70,44 77,56
Involvement and games were closest to rejection of the null hypothesis. Involvement
and game categories had lowest scores on Kizhi2 indicating participants have not high
tendencies to feel presence. Involvement has five items that measures losing track of
time in playing sports or doing any mundane task. It also measures how easily
participants lose awareness of their surroundings when watching movies or
daydreaming and if they usually identify with characters in movies for example.
Comparing individual items, questions, from the ITQ involvement factor Kizhi2 had
lowest score on each item. Losing track of time when playing sports showed least
differences between the applications. Games has three items that measures how often
participants play games and if they feel like playing inside the game not aware of the
controller or the screen. It also measures if participants watch sports and have reactions
to the players and events in the game. Again, comparing scores on individual items from
games factor shows Kizhi2 had lowest scores on watching and reacting to sports and
losing themselves inside the game. Although differences were small in sport item.
Frequency of gaming was highest on Kizhi1 with small differences between Kizhi2 and
Kizhi3 participants. Emotions has four items that measures how often participants feel
excitement or fear when watching television or movies. It also measures hog long the
sense of fear can last and if the participants ever have so realistic dreams they feel
disoriented for a while. Kizhi1 participants has reported slightly higher rates of
excitement when watching television or movies. Kizhi3 participants has reported lowest
scores on each item. Focus has five items that measure depth of involvement in tv or

36
movies and ability to block external distractions while watching tv or doing any activity.
Other items measure how well participants can concentrate on enjoyable activities or
how mentally alert they are currently. Kizhi3 participants reported highest scores on
every other item but not on mental alertness. Kizhi2 participants felt most alert when
coming to the test session. On other items Kizhi2 participants reported lowest scores.
4.3.6 Motion Sickness Susceptibility Questionnaire
Analysis of Motion Sickness Susceptibility Questionnaire did not reveal any statistical
significances. MSSQ-R, the total amount of sickness and travelling experienced,
indicates some differences (p = 0,284 > 0,05) between the groups that tested the
applications. Kizhi2 group had the least susceptibility to feel sickness (Table 7).
Especially experiences as an adult, MSSQ-B, (p = 0,075 > 0,05) indicates Kizhi2 group
had least susceptibility to experience sickness. Differences were smallest in MSSQ-A (P
= 0,284 > 0,05), childhood experiences.
Table 7. Means of MSSQ total scores and subscales.
Kizhi1 Kizhi2 Kizhi3
MSSQ-A 20,78 12,85 18,90
MSSQ-B 8,62 4,10 7,72
MSSQ-R 29,40 16,96 26,62
When comparing the means of MSSQ results in Table 7, participants in Kizhi1 and
Kizhi3 had very small differences in their results. Kizhi2 participants had lowest results
in each category indicating least susceptibility to motion sickness.
4.3.7 Other variables
Analysis on other variables than graphics revealed few significant differences and null
hypothesis was rejected in some cases. Comparing males and females SSQ-N was
significantly higher in female group (p = 0,016 < 0,05) as well as PQ-R (p = 0,04 <
0,05). Participants were also arranged to age groups in 5-year intervals from 20 to 40
years. PQ score in 20 to 25 group was significantly lower (p = 0, 011 < 0,05) than in
younger or older groups. Same group also had lower score on PQ-R (p = 0,017 < 0,05)
Since two different devices were tested they were also compared although null
hypothesis was not rejected. FMS total score was same across devices (p = 1 > 0,05).
SSQ-T (p = 0,64 > 0,05) was slightly lower in Oculus Rift than DK1. Further analysis
revealed almost same score in SSQ-N but increased score in SSQ-D and SSQ-O in
DK1. Participants were also grouped by their experience in virtual reality in intervals of
5 from 0 times to over 20 times. Groups of 15 to 20 and over 20 were removed due to
low sample size (n=1). IMMERSION descended as experience on virtual reality was
growing (p = 0,02 < 0,05). MSSQ scores were highest in the 1 to 5 times-group (p =
0,014 < 0,05) indicating people with high susceptibility to motion sickness and
experience in virtual reality did not participate in the experiment.

37
5. Discussion
Results from data analysis revealed controversial results concerning the amount of
cybersickness between high and low realism graphics but also interesting details on why
– and why not - symptoms occurred. Some findings confirmed results from earlier
studies while some are arguable. To answer the research question does higher visual
realism cause more cybersickness than low visual realism the findings from the data are
discussed and reflected on previous literature.
Most important findings were found from Fast Motion Sickness (Keshavarz and Hecht,
2011) data. Sickness scores were constantly highest on the high realism graphics and
most of time lowest on cel shading graphics that is considered least realistic. The last-
minute scores and summed FMS data produced similar results. Differences between the
three graphical styles produced statistically significant results when mean FMS scores
were compared. Even though ANOVA test cannot tell where the differences are,
looking at other analyzes it can be said with high confidence that higher visual realism
causes more cybersickness than low visual realism.
Data from Simulator Sickness Questionnaire (Kennedy et al., 1993) showed major
differences between the high realism graphics and cel-shading graphics strongly
indicating higher visual realism do cause more cybersickness than low visual realism.
However, as three graphical styles were compared, the low realism style on MacBook
and Oculus DK1 did not fall in between the high realism and cel-shading graphics as it
did in FMS data. The low realism graphics had slightly higher total score and mean
scores on some subscales than high visual realism. The SSQ data, however, was
collected only after the test sessions, as it should have been collected also before the test
to provide a baseline for the post score. The current SSQ data is also vulnerable to
possible symptoms that have occurred before the test session. That said, the SSQ data is
not completely valid.
The effect from older hardware and different navigation system have affected the results
also. Poor and old hardware have been found out to cause sickness, especially if there is
lag (LaViola Jr., 2000; Kolasinksi, 1995; DiZio and Lackner, 1997). Although the
studies are already over 10 years old and conducted with devices that probably are not
used anymore, especially not in the current study. The navigation system produced
slight accelerations also which has been found out to cause sickness (LaValle, 2017).
The navigation was felt stiffer in low realism application than in others according to
interview results. It is also known that smoother controls and navigation produce less
cybersickness (Dorado and Figueroa, 2014).
Oculomotor symptoms from SSQ showed least sickness in cel-shading graphics.
Interestingly differences were small between low-realism and high-realism graphics
even though they used different systems and had clearly different graphical style.
Difficulty focusing was clearly higher in low-realism graphics which could be because
of the older device and focusing was mentioned once as a worst part at the interviews.
Oyamada et al. (2007) had noticed that real-life scenery caused less eye stress than
computer generated graphics when they compared stereoscopic videos although the
study did not use any virtual reality devices. Considering their results, higher realism
should cause less eye stress. Mon-Williams and Wann (1998) also found out 3D glasses

38
can cause eye stress, but only when the participants had to shift their focus back and
forth. This could explain low oculomotor scores on cel-shading as depth cues had been
reduced alongside details in textures. Symptoms of nausea measured by SSQ were
identical between the graphical styles indicating graphical realism does not affect
cybersickness but Davis et al. (2015) found significant difference in nausea ratings in
their virtual roller coaster study although they did not use the SSQ, but a subjective
rating from 0 to 10 and FMS. The results from current study SSQ-N scores are not in
line with results in Davis et al. (2015) results.
Literature has many examples of graphical factors causing cybersickness but only few
that have studied the effect of realism in graphics. Realism is sum of many features like
textures, models and lighting and level of detail and visual flow caused by textures have
been popular subject. Study on military pilot simulators by Johnson (2005) had found
that increased visual flow increases simulator sickness as well and it occurred when
pilots were flying lower, closer to the ground. As to current study, the height of the
camera was not altered although some subjects felt they were short. The details in
textures were altered and they caused more visual flow in high realism graphics. Jaeger
and Mourant (2001) had also compared two different texture mapping in their early
virtual reality headset and found out increased details increased symptoms. In current
study major differences were found in between the high realism and cel shading
graphics.
SSQ does not provide any data on when symptoms occurred but FMS results from
current study indicates indoors cause more cybersickness than outdoors which is
probably because of higher visual flow as walls, floor and roof were close to the
participant and produced constant stimulation from each direction. Also, interviews
revealed participants experienced most symptoms on stairs that were producing height
differences in the applications. Comparing to the Fast Motion Sickness (Keshavarz, and
Hecht, 2011) scores the two spikes at 2-minuta and 10-minute points are where
participant were either ascending or descending the stairs which is in line with findings
from the interviews. At 10-minute point the difference between high realism graphics to
other graphical styles was larger than in the first spike, which could be because
participants were exposed to the indoor visual flow before descending the stairs and
thus accumulating the symptoms caused by the higher visual flow caused by more
details. It could also be that the sensory mismatch was more intense with high realism
graphics. Another point of interest can be seen between 4 and 6-minute points, where
scores are increasing at high and low realism applications but decreasing at cel-shading
application. Comparing these points to the map it can be seen participants were walking
outside behind the big church, but what can’t be seen from the map are the small hills
that participants were descending and slightly rotating. High reduction of details in the
ground could explain this as participants at cel-shading application did not perceive the
height difference as strongly, or at all, as in other applications where the ground had
some texture and moving grass. Dorado and Figueroa (2014) had compared different
stairs and ramps with different control mappings and found out smoother motion in
ramps was causing less cybersickness. Poor depth cues have also been reported to cause
cybersickness by Liu and Uang (2015) but also causing less presence.
Presence has been presented as a measure for effectiveness of virtual environment
performance on immersing users in it. There have been studies that have found out
presence being disturbed by cybersickness and studies where both presence and
cybersickness are both increasing. To answer does cybersickness disturb the sense of
presence results from PQ, ITQ and interviews are discussed.

39
Results from PQ in the current study indicated high-realism group felt most presence
and evaluated the realism of the application higher than other groups. Presence is in line
with results from Fast Motion Sickness questionnaire and immersion from interviews as
high-realism graphics scored highest in each measure which indicates presence
correlates positively with cybersickness and immersion. It can be said cybersickness
does not disturb presence. PQ was also used to measure perceived and sensed realism
between the graphical styles. Realism in PQ is measured the visual aspects, interaction
and movement in the virtual environment. High realism application was rated highest
almost on every question, but interestingly low realism was rated lower than cel-shading
application. Interview results argue that participants perceived the graphics at cel-
shading least realistic. Immersion was measured at interview by asking subjective
opinion how immersed participants felt during the test session. Results indicate similar
scores than in SSQ: low-realism and high-realism graphics were felt more immersive
than cel-shading graphics. Clearly, immersion or presence are not disturbed by
cybersickness like Seay et al. (2002) had found out.
Results from ITQ shows almost significant results where high-realism group reported
clearly lower tendencies to get immersed. Uneven distribution might have affected the
results as the groups did not have similar tendencies to get immersed, but it could also
be deduced that the questionnaire does not measure these tendencies very well or the
high-realism application simply induced high amounts of immersion. To effectively
compare the immersion score from interviews participants should have been asked to
elaborate why and how they felt the immersion for example did they lose track of time.
Results from ITQ do not seem to correlate with either cybersickness or immersion
results like Witmer and Singer (1998) or Johns et al. (2000) have found out.
To exclude other factors than graphics, the participants were asked about navigation and
predictability. Navigation was reported mostly smooth expect in low-realism graphics
where most participants felt the navigation was stiff. Comparing to previous sickness
scores low-realism did not induce more sickness than other applications. Predictability
and depth perception were also similar between the applications as participants reported
the route mostly easy to predict and nothing wrong with depth perception. Immersion
was reported least in cel-shading graphics and most in high-realism graphics with only
small difference to low-realism. Scores are in line with SSQ total score but also show
similar direction than FMS total scores.
Motion Sickness Susceptibility Questionnaire measures childhood and adulthood
experiences on travelling to motion sickness. Results from the questionnaire indicate the
group of high-realism graphics was least susceptible to motion sickness when
considering both childhood and adulthood experiences. Comparing the results to SSQ
and FMS questionnaires, high-realism was causing most sickness. It could be that high-
realism graphics were causing lot more sickness than was reported but the high
tolerance of the participants prevented more symptoms from developing. It could also
be that susceptibility to motion sickness does not predict susceptibility to cybersickness
especially when studying graphical realism.
As data was gathered vastly other factors besides graphics were analyzed as well.
Analyzes between SSQ and gender produced some significant results. Females
experienced significantly more nauseous symptoms than males when analyzing
Simulator Sickness Questionnaire (Kennedy et al. 1993). Contrary, in study by
D’Amour et al. (2017) females reported higher score on Fast Motion Sickness but not in
Simulator Sickness Questionnaire. Comparison of FMS and SSQ-N items revealed high
correlation in nausea and stomach awareness with FMS score (D’Amour et al. 2017). It
40
indicates again that females do experience or report nausea more than males. Some
studies have also found out that women get more easily nauseous than males and it has
been argued that it is caused by difference in hormones and wider field of view in
females (Kolasinski 1995; LaViola Jr. 2000; Jaeger, Mourant, 2001). Males and females
were assigned to the experiment conditions randomly and low realism graphics had
slightly less females than males, but it did not show in the SSQ-N results.

41
6. Conclusions and future work
Cybersickness is an undesired side-effect of exposure to virtual reality that can be
induced by different factors between individuals, applications and devices and appear in
different forms. As cybersickness has roots in motion and simulator sickness studies it
has been studied vastly but the root cause of the symptoms is still unknown. Most
popular theories explain cybersickness is caused either by a conflict between visual and
vestibular systems or postural instability. There are still lot of studies that has identified
causes behind the condition and already help researchers and developers to understand
it. Current studies are concentrating in minimizing cybersickness as it has been widely
accepted that it cannot be eradicated completely. Issue of cybersickness can be seen
spreading as the current wave of virtual reality has probably come here to stay as
consumer versions of the devices has been published and many products have been
aimed straight to the consumers like video games. As the prices are still quite high and
most people have not experienced them yet the total impact of virtual reality and
cybersickness are unknown. As the prices tend to lower quite fast when the technologies
develop, and new devices are introduced, the issue of cybersickness will be more
important than ever. With better hardware, visual realism can be expected to increase
which has been proven to cause cybersickness.
Current study aimed to answer if higher visual realism causes more cybersickness than
low visual realism and compared three graphical styles on a virtual environment based
on Kizhi Island in Karelia, Russia, with two different virtual reality devices. Graphical
styles were high realism, low realism and cel shading graphics. High realism style was
most detailed with high quality textures and most realistic lightning with added
animations in trees, grass and water. It was found to produce most sickness when
measured by Fast Motion Sickness (Keshavarz, Hecht, 2011) scores. Cel shading had
the least amount of visual details as textures were removed and replaced with colors and
constantly produced least amount of cybersickness. Scores showed significant
differences in mean FMS scores between the graphical styles proving higher visual
realism causes more symptoms than lower visual realism.
Simulator Sickness Questionnaire (Kennedy et al. 1993) was used to measure symptoms
after the exposure. High and low realism styles had identical score but cel shading
lowest score indicating least cybersickness. Differences between FMS and SSQ scores
can be explained with different focus on symptoms as FMS measures sickness in
general level whereas SSQ measures various symptoms. Also, SSQ was not measured
before the test to give baseline for the post measurement and possibly detecting any
symptoms that occurred before the test. Identical score between high and low realism in
SSQ results can be explained partially with different head-mounted displays and
navigation systems used, which may have resulted in high scores on difficulty focusing
and dizziness with eyes open. Fast Motion Sickness (Keshavarz and Hecht, 2011) was
measured during the exposure and it measured the sickness in a general, nauseous, level
which has been found out to correlate positively with SSQ-D and SSQ-T scores
(Keshavarz and Hecht, 2011).
Results from Presence Questionnaire (Cyberpsychology Lab of UQO) indicate
participants from high realism graphics experienced highest amounts of presence when
compared to other groups. Even though the differences were small, it can be said
42
cybersickness does not disturb presence. It is still proven that both cybersickness and
presence can be induced simultaneously.
The study had a major limitation as it used two different computer system where
especially older Oculus DK1 and slightly accelerating navigation system have affected
the results. The graphical styles also had differences in their mood, contrast and colors
caused by the different lightning and cel shading post processing. Although it can be
still said that the overall visual realism was altered accordingly from highest to lowest.
With stricter control of variables, the exact differences and effect of visual realism could
have been studied and pinpointed better. Some participants also reported that they felt
short inside the application which reminds that the height between the camera and
ground was not measured or standardized between the two computer systems which also
may have been affected the results, although smaller difference between the camera and
ground should have resulted in higher visual flow and symptoms in high realism and cel
shading applications which was not apparent at the SSQ results. The devices were also
not calibrated or the interpupillary distance corrected which may have affected the depth
perception between the participants. The questionnaires were also only in English which
may have caused misunderstandings as participants came from different cultures with
different languages. SSQ was also gathered only after the exposure and any symptom
that occurred before the exposure may have affected the post-exposure results. There
also were some participants that were tested two times so the data is a mix of between
and within subject’s data. The experiments were conducted at the end of summer and
beginning of fall on weekdays between 8:30 and 16:00 excluding lot of people who
were working or studying and could not participate in the tests. The participants were
assigned to the applications randomly but also in order of arrival. ITQ and MSSQ
results could have been used to group participants in equal groups based on
susceptibility to motion sickness and tendency to get immersed. Literature review could
also have used some systematical method especially for graphical studies on
cybersickness.
For future, the video material from current study was not utilized fully and they could
be used to detect any postural instabilities that indicate points where the sickness
occurred but also points of high presence as Held and Durlach (1992) suggested high
presence can be seen if participants try to duck the virtual objects. With proper method,
the video material could explain the current data and even reveal something the
questionnaires did not capture. Measuring spatial velocity could also help in gathering
objective data between the applications. Especially vection as it was not measured
accurately. For similar studies of visual realism on cybersickness lightning and texture
should be separated as different variables and studies should be conducted on same
devices and navigation systems. Other graphical variables could be colors, contrast and
number of polygons in the scene for example. Literature claims that amount of
cybersickness is increasing as the devices are getting more popular and better devices
are not solving this problem. A literature review on average scores of SSQ throughout
the cybersickness studies, for example, could help arguing this claim. Especially on
visual realism or some specific field like video games or virtual tourism.
43
References
Akiduki, H., Nishiike, S., Watanabe, H., Matsuoka, K., Kubo, T., Takeda, N. (2003).
Visual-vestibular conflict induced by virtual reality in humans. Neuroscience Letters
340(2003), 197-200.
Alatalo, T. (2011). An Entity-Component Model for Extensible Virtual Worlds. IEEE
Internet Computing 15(5), 30-37.
Ames, S., Wolffsohn, J. McBrien, N. 2005. The Development of a Symptom
Questionnaire for Assessing Virtual Reality Viewing Using a Head-Mounted Display.
Optometry and Vision Science 82(3), 168-176.
Anthes, C., Garciá-Hernández, R., Wiedemann, M., Kranzmüller, D. (2016). State of
the Art of Virtual reality Technology. IEEE Aerospace Conference, 1-19.
Azuma, R. (1997). A Survey of Augmented Reality. In Presence: Teleoperators and
Virtual Environments 6(4), 355-385.
Barrett, G., Thornton, C. (1968). Relationship Between Perceptual Style and Simulator
Sickness. Journal of Applied Psychology 52(4), 304-308.
Budhraja, P. (2015). Software Techniques for Improving Head Mounted Displays to
Create Comfortable User Experiences in Virtual Reality. University of Illinnois.
Casali, J. (1986). Vehicular Simulation-Induced Sickness, Volume 1: An Overview.
Virginia Polytechnic Institute and State University.
Chang, E., Hwang, I., Jeon, H., Chun, Y., Kim, H., Park, C. (2013). Effects of Rest
Frames on Cybersickness and oscillatory Brain Activity. International Winter
Workshop of Brain-Computer Interface, Gangwo, South Korea. 62-64.
Cobb, S., (1999). Measurement of postural stability before and after immersion in a
virtual environment. Applied Ergonomics 20(1999), 47-57.
Cruz-Neira, C., Sandin, D., DeFanti, T., Kenyon, R., Hart, R. (1992). The CAVE,
Audio Visual Experience Automatic Virtual Environment. Communications of the
ACM 35(6), 64-72.
Cyberpsychology Lab of UQO (2017). Productions from the lab. Retrieved January 23,
2018, from http://w3.uqo.ca/cyberpsy/en/docm_en.htm
D’Amos, S., Campos, L., Keshavarz, B. (2017). The efficacy of airflow and seat
vibration on reducing visually induced motion sickness. Experimental Brain research
235 (9), 2811-2820.
Davis, S., Nesbitt, K., Nalivaiko, E. (2014). A Systematic Review of Cybersickness.
IE2014 Proceedings of the 2014 Conference on Interactive Entertainment, 1-9.

44
Davis, S., Nesbitt, K., Nalivaiko, E. (2015). Comparing the onset of cybersickness using
the Oculus Rift and two virtual roller coasters. Proceedings of the 11th Australasian
Conference on Interactive Entertainment, 3-14.
DiZio, P., Lackner, J. (1997). Circumventing Side Effects of Immersive Virtual
Environments. Design of Computing Systems: Social and Ergonomic Considerations,
Proceedings of the Seventh International Conference on Human-Computer Interaction
(2), 893-896.
Duh, H., Parker, D., Furness, T. (2001). An “Independent Visual Background” Reduced
Balance Disturbance Evoked by Visual scene Motion: Implication for Alleviating
Simulator Sickness. CHI ’01 Proceedings of the SIGHCI Conference on Human
Factors in Computing Systems, 85-89.
Dorado, J., Figuerora, P. (2014). Ramps are Better than Stairs to Reduce Cybersickness
in Applications based on a HMD and a Gamepad. IEEE Symposium on 3D User
Interfaces 2014, 47-50.
Fernandes, A., Feiner, S. (2016). Combating VE Sickness through Subtle Dynamic
Field-Of-View Modification. IEEE Symposium on 3D User Interfaces 2016, 201-210.
Fove. (2018). FOVE Eye tracking Virtual Reality Headset. Retrieved January, 18 2018,
from https://www.getfove.com/
Gamito, P., Oliveira, J., Santos, P., Morais, D., Saraiva, T., Pombal, M., Mota, B.
(2008). Presence, Immersion and Cybersickness Assessment through a Test Anxiety
Virtual Environment. Annual Review of CyberTherapy and Telemedicine 6. 83-90.
Gianaros, P. Muth, E., Mordkoff, J. Levine, M. Stern, R. 2001. A Questionnaire for the
Assessment of the Multiple Dimensions of Motion Sickness. Aviat Space Environ Med
2001 72(2), 115-119.
Golding, J. 1996. Motion sickness susceptibility questionnaire revised and its
relationship to other forms of sickness. Brain Research Bulletin 47(5), 507-516.
Goldstein, B. (2009). Sensation and Perception. Belemont, CA, USA: Wadsworth
Cengage learning
Harvey, C., Howarth, P. (2007). The Effect of Display Size on Visually-Induced Motion
Sickness (VIMS) and Skin Temperature. Proceedings of VIMS2017, 96-103.
Held, R., Durlach, N. (1992). Telepresence. Presence: Teleoperators and Virtual
Environments. 1(1), 109-112.
Hu, S., Davis, M., Klose, A., Zabisnky, E., Meux, S., Jacobsen, H., Westfall, J., Gruber,
M. (1997). Effects of spatial frequency of a vertically striped rotating drum on vection-
induced motion sickness. Aviat Space Environ Med. 68(4), 306-311.
Iskenderova, A., Weidner, F., Broll, W. (2017). Drunk Virtual Reality Gaming:
Exploring the Influence of Alcohol on Cybersickness. CHI PLAY ‘17 Proceedings of
the Annual Symposium on Computer Human Interaction in Play, 561-572.
Johns, C., Nunez, D., Daya, M., Sellars, D., Casanueva, J., Blake, E. (2000). The
Interaction Between individual’s Immersive Tendencies and the Sensation of Presence

45
in a Virtual Environment. Proceeding EG VE’00 Proceedings of the 6th Eurographics
conference on Virtual Environments, 65-74.
Johnson, D. (2005). Introduction to and Review of Simulator Sickness Research. U.S.
Army Research Institute for the Behavioral and Social Sciences 1832.
Jonatan, H., Larsen O., Vendelbo, K., Nilsson, N., Nordahl, R., Serafin, S. (2017). The
Effect of Geometric Realism on Presence in a Virtual Reality Game. 2017 IIIE Virtual
reality (VR), 339-340.
Kennedy, R., Berbaum, K., Lilienthal, M. (1993). Simulator Sickness Questionnaire: An
Enhanced Method for Quantifying Simulator Sickness. The International Journal of
Aviation Psychology 3(3), 203-220.
Kennedy, r., Drexler, J., Compton, D., Stanney, K., Harms, D. (2001). Configural
Scoring of Simulator Sickness, Cybersickness and Space Adaptation Syndrome:
Similarities and Differences? Nasa Johnson Space Center
Keshavarz, B., Hecht, H. 2011. Validating an Efficient Method to Quantify Motion
Sickness. Human Factors and Ergonomics Society 53(4), 415-426.
Keshavarz, B. (2016). Exploring Behavioral Methods to reduce Visually Induced
Motion Sickness in Virtual Environments. VAMR 2016: Virtual, Augmented and Mixed
reality, 147-155.
Keshavarz, B., Riecke, B., Hettinger, L., Campos, J. (2017). Vection and visually
induced motion sickness: how are they related? Frontiers in Psychology 6(472), 1-11.
Kickstarter. (2017). Pimax: The World’s First 8k VR Headset. Retrieved September 28,
2017, from https://www.kickstarter.com/projects/pimax8kvr/pimax-the-worlds-first-8k-
vr-headset/description
Kim, Y., Kim, H., Kim, E., Ko, H., Kim, H. 2005.Characetristic changes in the
physiological components of cybersickness. Psychophysiology42(2005), 616-625.
Kolasinski, E. (1995). Simulator Sickness in Virtual Environment. U.S. Army Research
Institute for the Behavioral and Social Sciences 4(1027).
Lampton, D., Kolasinksi, E., Knerr, B., Bliss, J., Bailey, J., Witmer, B. (1994). Side
effects and aftereffects of immersive in virtual environments. Proceedings of the Human
Factors Society 38th Annual Meeting, 1154-1157.
LaValle, S. (2017). Virtual Reality. Cambridge University Press.
LaViola Jr., J. (2000). A Discussion of Cybersickness in Virtual Environments. SIGCHI
Bulletin 32(1), 47-56
Lin, J., Duh, H., Parker, D., Abi-Rached, H., Furness, T. (2002). Effects of Field of
View on Presence, Enjoyment, Memory and Simulator Sickness in a Virtual
Environment. Proceedings of the IEEE Virtual reality. 164-172.
Liu, C., Uang, S. (2015). Effects of depth-perception cues and display types on presence
and cybersickness in the elderly within a 3D virtual store. Journal of Ambient
Intelligence Humanized Computing 7(6), 763-755.

46
Lloarch, G., Evans, A., Blat, E. 2014. Simulator sickness and Presence using HMDs:
comparing use of a game controller and a position estimation system. VRST’14
Proceedings of the 20th ACM Symposium on Virtual Reality Software. 137-140.
Lo, W., So, R. (1999). Quantifying Scene Movement With ‘Spatial Velocity’ And Its
Effects On Cybersickness. Proceedings of the Human Factors Ergonomics Society 43rd
Annual Meeting, 1219-1222.
McCauley, M., Sharkey, T. (1992). Cybersickness: Perception of Self-Motion in Virtual
Environments. Presence 1 (3), 311-318.
Mon-Williams, M., Wann, J. (1998). Binocular Virtual Reality Displays: When
Problems Do and Don’t Occur. Human Factors 40(1), 42-49.
Nichols, S., Haldane, C., Wilson, J. (2000). Measurement of presence and its
consequences in virtual environments. International Journal of Human-Computer
Studies 52, 471-491.
Nooji, S., Pretto, P., Oberfeld, D., Hecht, H., Bülthoff, H. (2017). Vection is the main
contributor to motion sickness induced by yaw rotation: Implications for conflict and
eye theories. PLoS ONE 12(4), 1-19.
Milgram, P., Kishino, F. (1994). Taxonomy of Mixed Reality Visual Displays. IEICE
Transactions on Information Systems 77(12), 1324-1329.
Muth, E., Stern, J., Koch, K. 1995. Assessment of the multiple dimensions of nausea:
the nausea profile (np). Journal of Psychosomatic Research 40(5), 511-520.
Ohyama, S., Nishiike, S., Watanabe, H., Matsuoka, K., Akizuki, H., Takeda, N.,
Harada, T. 2007. Autonomic responses during motion sickness induced by virtual
reality. Auris Nsus Larynx 34 (2007), 303-306.
Oyamada, H., Iijima, A., Tanaka, A., Ukais, K., Toda, H., Sugita, N., Yoshizawa, M.,
Bando, T. (2007). A pilot study on pupillary and cardiovascular changes induced by
stereoscopic video movies. Journal of NeuroEngineering and Rehabilitation, 4(37), 1-7.
Palmisano, S., Allison, R., Schira, M., Barry, Robert. (2015). Future challenges for
Vection research: definitions, functional significance, measures, and neural bases.
Frontiers in Psychology 6(193), 1-15.
Pausch, R., Crea, T. (1992). A Literature Survey for Virtual Environments: military
Flight Simulator Visual Systems and Simulator Sickness. University of Virginia Dept.
of Computer Science tech report. Retrieved from: http://libra.virginia.edu/catalog/libra-
oa:2456
Reason, J., Brand, J. (1975). Motion Sickness. London Academic Press.
Riccio G., Stoffregen, T. (1991). An Ecological Theory of motion Sickness and postural
Instability. Ecological Psychology 3(3), 195-240.
Seay, F., Krum, D., Hodges, L., Ribarsky, W. (2002). Simulator Sickness and Presence
in a High Field-Of-View Virtual Environment. CHI EA ’02 Extended Abstracts on
Human Factors in Computing Systems, 784-785.

47
Sheridan, T. (1992). Musings on Telepresence and Virtual Presence. Presence:
Teleoperators and virtual Environments 1(1), 120-126.
Slater, M., Usoh, M., Steed, A. (1994). Depth of presence in virtual environments.
Presence: Teleoperators and Virtual Environments 3(2), 130-144.
Slater, M., Wilbur, S., (1997). A Framework for Immersive Virtual Environments
(FIVE): Speculations on the Role of Presence in Virtual Environments. Presence:
Teleoperators and Virtual Environments 6(6) ,603-616.
Smart Jr., J., Stoffregen, T., Bardy, B. (2002). Visually Induced Motion Sickness
Predicted by Postural Instability. Human Factors 44(3), 451-465.
So, R., Ho, A., Lo, W. (2001). A Metric to Quantify Virtual Scene Movement for the
Study of Cybersickness: Definition, Implementation, and Verification. Presence, 10(2),
193-215.
So, R., Lo, W., Ho, A. (2001). Effects of Navigation Speed on Motion Sickness Caused
by an Immersive Virtual Environment. Human Factors, 43(3), 452-461.
Stanney, K., Kennedy, R., Drexler, J. (1997). Cybersickness is Not Simulator Sickness.
Proceedings of the Human Factors and Ergonomics Society Annual Meeting 41(2),
1138-1142.
Stanney, K., Kingdon, K., Graeber, D., Kennedy, R. (2009). Human performance in
Immersive Virtual environments: Effects of Exposure Duration, User Control and Scene
Complexity. Human Performance 15(4), 339-366.
Stoffregen, T., Smart, J. (1998). Postural instability precedes motion sickness. Brain
Research Bulletin 47(5), 437-448.
Sutherland, I. (1965). The Ultimate Display. Proceedings of IFIP Congress, 506-508.
Sutherland, I. (1968). A head-mounted three dimensional display. AFIPS ’68 (Fall,
part I) Proceedings of the December 9-11,1968, fall joint computer conference, part I
757-764.
Treisman, M. (1977). Motion sickness: An evolutionary hypothesis. Science 197, 493-
495.
VRS. (2017). History of Virtual Reality. Retrieved September 12, .2017, from
https://www.vrs.org.uk/virtual-reality/history.html
Valve. (2017). Routine. Retrieved September 27, 2017, from
http://steamcommunity.com/sharedfiles/filedetails/updates/92985806/1408024959
Varjo Technologies. (2017). Bionic Display. Retrieved January 18, 2018, from
https://varjo.com/bionic-display/
Virre, E. (1996). Virtual Reality and the Vestibular Apparatus. IEEE Engineering in
Medicine and Biology Magazine 15(2), 41-43, 69.
Witmer, B., Singer, M., (1998). Measuring Presence in Virtual Environments: A
Presence Questionnaire. Presence 7(3), 225-240.

48
Witmer, B., Jerome, C., Singer, M., (2005). The Factor Structure of the Presence
Questionnaire. Presence 14(3), 298-312.
Youngblut, C., Johnston, R., Nash, S., Wienclaw, R., Will, C. (1996). Review of Virtual
Environment Interface Technology. Institute for Defense Analyses.

49
Appendix A. Interviews
Finnish and English versions of the questions used in interviews.
How was the test session?
How do you feel right now?
What part of the application caused most symptoms?
Did the navigation feel smooth or stiff?
Was it easy or hard to predict where you were going?
Did you feel that you were physically moving (vection) at any point?
• If yes, did you feel it before or after the symptoms?
On scale from 1 to 20, how immersed you felt?
Did the graphics look realistic?
Was it hard to tell the distances between different objects (buildings, graves, bushes)?
Miltä testaus tuntui?
Minkälainen olo sinulla on nyt?
Mikä kohta sovelluksesta aiheutti eniten oireita?
Tuntuiko navigaatio sujuvalta vai jäykältä?
Oliko helppo vai hankala ennustaa mihin suuntaan olit menossa?
Tuntuiko sinusta, että liikut fyysisesti (vection) missään kohtaan?
• Jos kyllä, niin tuliko sinulle oireita ennen sitä vai sen jälkeen?
Arvioi yhdestä kahteenkymmeneen kuinka uppoutunut tai immersoitunut olit testin
aikana?
Näyttivätkö grafiikat realistisilta?
Oliko sovelluksessa olevien rakennusten ja esineiden väliset etäisyydet vaikea tulkita?