
Cyanobacterial Diversity in Microbial Mats from the ... · PDF filethat do not share a common...
16
ORIGINAL RESEARCH published: 30 June 2017 doi: 10.3389/fmicb.2017.01233 Frontiers in Microbiology | www.frontiersin.org 1 June 2017 | Volume 8 | Article 1233 Edited by: Jesse G. Dillon, California State University, Long Beach, United States Reviewed by: Jamie S. Foster, University of Florida, United States Scott Miller, University of Montana, United States Lucas Stal, Royal Netherlands Institute for Sea Research (NWO), Netherlands *Correspondence: Vitor M. Vasconcelos [email protected] † These authors have contributed equally to this work. Specialty section: This article was submitted to Extreme Microbiology, a section of the journal Frontiers in Microbiology Received: 05 December 2016 Accepted: 19 June 2017 Published: 30 June 2017 Citation: Ramos VMC, Castelo-Branco R, Leão PN, Martins J, Carvalhal-Gomes S, Sobrinho da Silva F, Mendonça Filho JG and Vasconcelos VM (2017) Cyanobacterial Diversity in Microbial Mats from the Hypersaline Lagoon System of Araruama, Brazil: An In-depth Polyphasic Study. Front. Microbiol. 8:1233. doi: 10.3389/fmicb.2017.01233 Cyanobacterial Diversity in Microbial Mats from the Hypersaline Lagoon System of Araruama, Brazil: An In-depth Polyphasic Study Vitor M. C. Ramos 1, 2 † , Raquel Castelo-Branco 2† , Pedro N. Leão 2 , Joana Martins 1, 2 , Sinda Carvalhal-Gomes 3 , Frederico Sobrinho da Silva 3 , João G. Mendonça Filho 3 and Vitor M. Vasconcelos 1, 2 * 1 Faculty of Sciences, University of Porto, Porto, Portugal, 2 Interdisciplinary Centre of Marine and Environmental Research (CIIMAR/CIMAR), University of Porto, Matosinhos, Portugal, 3 Palynofacies and Organic Facies Laboratory, Department of Geology, Federal University of Rio de Janeiro, Rio de Janeiro, Brazil Microbial mats are complex, micro-scale ecosystems that can be found in a wide range of environments. In the top layer of photosynthetic mats from hypersaline environments, a large diversity of cyanobacteria typically predominates. With the aim of strengthening the knowledge on the cyanobacterial diversity present in the coastal lagoon system of Araruama (state of Rio de Janeiro, Brazil), we have characterized three mat samples by means of a polyphasic approach. We have used morphological and molecular data obtained by culture-dependent and -independent methods. Moreover, we have compared different classification methodologies and discussed the outcomes, challenges, and pitfalls of these methods. Overall, we show that Araruama’s lagoons harbor a high cyanobacterial diversity. Thirty-six unique morphospecies could be differentiated, which increases by more than 15% the number of morphospecies and genera already reported for the entire Araruama system. Morphology-based data were compared with the 16S rRNA gene phylogeny derived from isolate sequences and environmental sequences obtained by PCR-DGGE and pyrosequencing. Most of the 48 phylotypes could be associated with the observed morphospecies at the order level. More than one third of the sequences demonstrated to be closely affiliated (best BLAST hit results of ≥99%) with cyanobacteria from ecologically similar habitats. Some sequences had no close relatives in the public databases, including one from an isolate, being placed as “loner” sequences within different orders. This hints at hidden cyanobacterial diversity in the mats of the Araruama system, while reinforcing the relevance of using complementary approaches to study cyanobacterial diversity. Keywords: cyanobacteria, microbial mats, hypersaline, diversity, morphological characterization, 16S rRNA gene, phylogeny, next-generation sequencing INTRODUCTION Photosynthetic microbial mats are complex, micro-scale ecosystems that can be found globally in a wide range of environments and are a major driving force in the formation of some modern microbialites, i.e., biologically-induced mineralization driven by microbial growth (Dupraz et al., 2009; Decho, 2010; Stal, 2012). Photosynthetic mats usually have an upper green layer where
Transcript of Cyanobacterial Diversity in Microbial Mats from the ... · PDF filethat do not share a common...

ORIGINAL RESEARCHpublished: 30 June 2017
doi: 10.3389/fmicb.2017.01233
Frontiers in Microbiology | www.frontiersin.org 1 June 2017 | Volume 8 | Article 1233
Edited by:
Jesse G. Dillon,
California State University, Long
Beach, United States
Reviewed by:
Jamie S. Foster,
University of Florida, United States
Scott Miller,
University of Montana, United States
Lucas Stal,
Royal Netherlands Institute for Sea
Research (NWO), Netherlands
*Correspondence:
Vitor M. Vasconcelos
†These authors have contributed
equally to this work.
Specialty section:
This article was submitted to
Extreme Microbiology,
a section of the journal
Frontiers in Microbiology
Received: 05 December 2016
Accepted: 19 June 2017
Published: 30 June 2017
Citation:
Ramos VMC, Castelo-Branco R,
Leão PN, Martins J,
Carvalhal-Gomes S, Sobrinho da
Silva F, Mendonça Filho JG and
Vasconcelos VM (2017)
Cyanobacterial Diversity in Microbial
Mats from the Hypersaline Lagoon
System of Araruama, Brazil: An
In-depth Polyphasic Study.
Front. Microbiol. 8:1233.
doi: 10.3389/fmicb.2017.01233
Cyanobacterial Diversity in MicrobialMats from the Hypersaline LagoonSystem of Araruama, Brazil: AnIn-depth Polyphasic StudyVitor M. C. Ramos 1, 2 †, Raquel Castelo-Branco 2†, Pedro N. Leão 2, Joana Martins 1, 2,
Sinda Carvalhal-Gomes 3, Frederico Sobrinho da Silva 3, João G. Mendonça Filho 3 and
Vitor M. Vasconcelos 1, 2*
1 Faculty of Sciences, University of Porto, Porto, Portugal, 2 Interdisciplinary Centre of Marine and Environmental Research
(CIIMAR/CIMAR), University of Porto, Matosinhos, Portugal, 3 Palynofacies and Organic Facies Laboratory, Department of
Geology, Federal University of Rio de Janeiro, Rio de Janeiro, Brazil
Microbial mats are complex, micro-scale ecosystems that can be found in a wide
range of environments. In the top layer of photosynthetic mats from hypersaline
environments, a large diversity of cyanobacteria typically predominates. With the aim
of strengthening the knowledge on the cyanobacterial diversity present in the coastal
lagoon system of Araruama (state of Rio de Janeiro, Brazil), we have characterized three
mat samples by means of a polyphasic approach. We have used morphological and
molecular data obtained by culture-dependent and -independent methods. Moreover,
we have compared different classification methodologies and discussed the outcomes,
challenges, and pitfalls of these methods. Overall, we show that Araruama’s lagoons
harbor a high cyanobacterial diversity. Thirty-six unique morphospecies could be
differentiated, which increases by more than 15% the number of morphospecies and
genera already reported for the entire Araruama system. Morphology-based data were
compared with the 16S rRNA gene phylogeny derived from isolate sequences and
environmental sequences obtained by PCR-DGGE and pyrosequencing. Most of the
48 phylotypes could be associated with the observed morphospecies at the order
level. More than one third of the sequences demonstrated to be closely affiliated
(best BLAST hit results of ≥99%) with cyanobacteria from ecologically similar habitats.
Some sequences had no close relatives in the public databases, including one from
an isolate, being placed as “loner” sequences within different orders. This hints at
hidden cyanobacterial diversity in the mats of the Araruama system, while reinforcing
the relevance of using complementary approaches to study cyanobacterial diversity.
Keywords: cyanobacteria, microbial mats, hypersaline, diversity, morphological characterization, 16S rRNA gene,
phylogeny, next-generation sequencing
INTRODUCTION
Photosynthetic microbial mats are complex, micro-scale ecosystems that can be found globally ina wide range of environments and are a major driving force in the formation of some modernmicrobialites, i.e., biologically-induced mineralization driven by microbial growth (Dupraz et al.,2009; Decho, 2010; Stal, 2012). Photosynthetic mats usually have an upper green layer where
Ramos et al. Cyanobacterial Diversity in Brazilian Hypersaline Mats
cyanobacteria predominate (Ward et al., 2006; Dupraz et al.,2009; Stal, 2012). This layer is the most exposed in terms ofenvironmental changes and disturbances, with cyanobacteriaacting as primary producers (Ley et al., 2006; Stal, 2012; Harriset al., 2013) and atmospheric nitrogen fixers (Díez et al., 2007;Bauersachs et al., 2011; Stal, 2012), while being responsible forthe production of a matrix of extracellular polymeric substancesthat provide physical protection and resistance to desiccation forthe microbial mat community (Dupraz et al., 2009; Franks andStolz, 2009; Stal, 2012).
In saline aquatic systems, these photosynthetic mats can beobserved in flat, undisturbed, sheltered marine or estuarinecoasts, in salterns or salt evaporation ponds, or in hypersalinelagoons (Oren, 2012; Stal, 2012). In hypersaline lagoonmargins, where photosynthetic mats develop, high salinity,seasonal desiccation, and high solar irradiance are the mainenvironmental stressors influencing microbial mat communityadaptation processes (Stal, 2012). For instance, salinity levelsdetermine that only halophilic or halotolerant cyanobacteria areable to inhabit and appropriately develop in these environments.Some studies have listed taxa commonly occurring at high saltconcentrations (e.g., see Oren, 2012). However, due to taxonomy-related issues, obtaining an accurate and comprehensive listof cyanobacterial species is challenging (Oren, 2012; Dvoráket al., 2015; Komárek, 2016). Traditional systems of classificationand identification keys of cyanobacteria are based mainly onmorphological criteria (for a review, see Komárek et al., 2014),something that is now recognized as not only lacking taxonomicresolution when applying the more recent cyanobacterial speciesconcepts, but also to completely ignore cryptic species (Dvoráket al., 2015). The latter, of which numerous examples are known,correspond to morphologically indistinguishable cyanobacteriathat do not share a common evolutionary history (Komáreket al., 2014; Dvorák et al., 2015; Komárek, 2016). On the otherhand, public databases (e.g., GenBank, SILVA, Greengenes, RDP)feature a large number of misidentified cyanobacterial sequences(Komárek, 2016). Also, sequences from reference strains thatcover all known cyanobacterial diversity are still missing in suchdatabases (Garcia-Etxebarria et al., 2014; Tuzhikov et al., 2014;Komárek, 2016). Therefore, a polyphasic approach that includesmolecular, morphological and ecophysiological traits is nowmandatory for the taxonomy and identification of cyanobacteria(Komárek et al., 2014; Komárek, 2016).
The east coastline region of the State of Rio de Janeiro inBrazil harbors a series of shallow coastal lagoons, forming one ofthe major hypersaline systems of the world (Clementino et al.,2008). The main waterbody is the Araruama lagoon, whichlends its name to the system and has a remarkably high saltcontent (average of 5.2% total salts, Clementino et al., 2008).This region has a typical tropical climate with wet and dryseasons, where low levels of annual rainfall and high evaporationrates favor the development of several salty ponds aroundthe lagoons (Kjerfve et al., 1996; Clementino et al., 2008).The cyanobacterial species present in microbial mats and/orwater samples from several lagoons of the Araruama systemhave been extensively studied through culture-independent,morphological-based identifications (e.g., Iespa and Silva, 2005;
Silva et al., 2006, 2007a,b, 2011). These studies show thatAraruama’s lagoons harbor a high diversity of cyanobacteria. Bycontrast, a single molecular-based study of the total microbialdiversity has been performed by Clementino et al. (2008), usingwater samples from the Araruama lagoon. These authors haveonly detected three cyanobacterial phylotypes, Coleofasciculuschthonoplastes, Halothece sp., and Synechococcus sp.
With the aim of strengthening the knowledge on thecyanobacterial diversity present in the Araruama’s complexby (1) considering the existing morphological-based speciesinventories, (2) taking into account the findings from Mobberleyet al. (2012) and Harris et al. (2013), who demonstrate the powerof 454 sequencing technology for the study of the microbialdiversity in very complex samples such as photosynthetichypersaline mats, (3) realizing that an accurate identificationmay be hampered by low resolution of classification methods(Dvorák et al., 2015; Nguyen et al., 2016), and (4) followingthe more recent principles and recommendations for studyingcyanobacterial taxa (Dvorák et al., 2015; Komárek, 2016), wehave characterized the cyanobacteria present in three mats fromthree lagoons of the Araruma system. For this purpose, we havefollowed a polyphasic approach combining culture-dependentand -independent techniques, and in order to understand howdistinct definitions of “units of diversity”may shape the perceivedcyanobacterial community structure of the mats (composition,richness, and diversity), we have compared different classificationmethods for the sequences.
MATERIALS AND METHODS
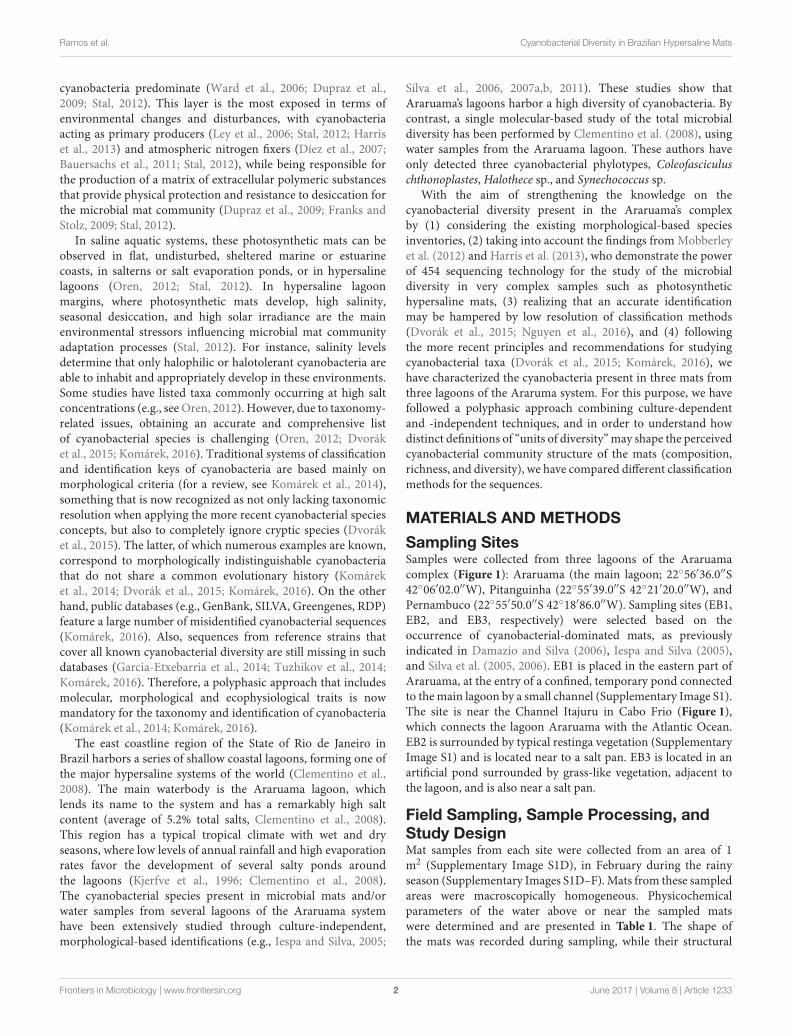
Sampling SitesSamples were collected from three lagoons of the Araruamacomplex (Figure 1): Araruama (the main lagoon; 22◦56′36.0′′S42◦06′02.0′′W), Pitanguinha (22◦55′39.0′′S 42◦21′20.0′′W), andPernambuco (22◦55′50.0′′S 42◦18′86.0′′W). Sampling sites (EB1,EB2, and EB3, respectively) were selected based on theoccurrence of cyanobacterial-dominated mats, as previouslyindicated in Damazio and Silva (2006), Iespa and Silva (2005),and Silva et al. (2005, 2006). EB1 is placed in the eastern part ofAraruama, at the entry of a confined, temporary pond connectedto themain lagoon by a small channel (Supplementary Image S1).The site is near the Channel Itajuru in Cabo Frio (Figure 1),which connects the lagoon Araruama with the Atlantic Ocean.EB2 is surrounded by typical restinga vegetation (SupplementaryImage S1) and is located near to a salt pan. EB3 is located in anartificial pond surrounded by grass-like vegetation, adjacent tothe lagoon, and is also near a salt pan.
Field Sampling, Sample Processing, andStudy DesignMat samples from each site were collected from an area of 1m2 (Supplementary Image S1D), in February during the rainyseason (Supplementary Images S1D–F).Mats from these sampledareas were macroscopically homogeneous. Physicochemicalparameters of the water above or near the sampled matswere determined and are presented in Table 1. The shape ofthe mats was recorded during sampling, while their structural
Frontiers in Microbiology | www.frontiersin.org 2 June 2017 | Volume 8 | Article 1233

Ramos et al. Cyanobacterial Diversity in Brazilian Hypersaline Mats
FIGURE 1 | Araruama complex and sampling sites. EB1 is located in the main lagoon (Araruama), EB2 in lagoon Pitanguinha, and EB3 in lagoon Pernambuco.
TABLE 1 | Physicochemical parameters* of the three studied sites located in the Araruama lagoon complex.
Sampling site Lagoon pH Conductivity (µS/cm) Salinity (psu) Water temperature (◦C) Air temperature (◦C)
EB1 Araruama 8.3 (8.5) 24.2 (35.3) 24 (30.1) 27 (27.5)
EB2 Pitanguinha 8.4 (8.6) 9.2 (56.9) 34 (32.1) 31 (28.9)
EB3 Pernambuco 7.7 (8.8) 11.2 (59.8) 28 (31.5) 27 (28.8)
*At the time of sampling. Within parentheses are average values for the 13 months prior to sampling.
characteristics were examined at the laboratory. For thispurpose, mat sections of about 10 × 10 cm (SupplementaryImages S1G–I) were collected, stored into polypropylene bagsand transported to the lab. Mats were then characterized bycolor and carbonate lamination under a light stereoscopicmicroscope.
Subsamples used for isolation and morphological andmolecular characterizations of cyanobacteria present in the matswere separated just after sample collection. Sections of 2-cmdiameter from the top layers of the mats were haphazardlycollected within the sampled area using a polypropylene samplerand distributed into 50 ml falcon sterile tubes. Subsamples weretransported and preserved in the dark at 4◦C. Soon arrivingat the laboratory, they were processed aseptically and carefullyrestricted to their top photosynthetic layer (<3.5 mm; see theResults Section), using sterile scalpel blades. All subsamples werescreened for the presence of cyanobacteria by observing a pieceof the mat under a light microscope (Leica DMLB, Bensheim,Germany).
A workflow diagram illustrating the experimental proceduresused in this polyphasic study is shown in Figure 2. For eachmat sample, three subsamples were independently used ineach methodological approach. For instance, three independentslide preparations were observed for the microscope-based
characterization of each environmental sample. The same appliesfor the isolation of cyanobacteria and of environmental DNA.
Isolation, Culturing, andMorphological-Based Characterization ofCyanobacteriaFor the isolation of cyanobacteria, subsamples were subjectedto liquid culture enrichment, streaking in agar plates ormicromanipulation (Rippka, 1988; Waterbury, 2006; see alsoBrito et al., 2012), or to a combination thereof, using differentcultures media and salinities. Whenever feasible (i.e., fordominant species) single cells, colonies, or filaments were isolatedunder the microscope with the help of a stretched Pasteurpipette, and transferred directly from raw biological materialto different liquid or solid media (Ramos et al., 2010). Whengrowth was evident, aliquots from the enriched cultures or agarplates were transferred and streaked again into fresh agar plates,or isolated by micromanipulation. The process was repeateduntil unicyanobacterial cultures were obtained. The non-axenicisolates were then transferred and grown in the correspondentliquid medium. The different media used during isolation wereMN, BG110, and Z8, at NaCl concentrations of 25, 40, or55 h (Rippka, 1988; Waterbury, 2006) and were supplementedwith B12 vitamin and cycloheximide (Rippka, 1988). During
Frontiers in Microbiology | www.frontiersin.org 3 June 2017 | Volume 8 | Article 1233

Ramos et al. Cyanobacterial Diversity in Brazilian Hypersaline Mats
FIGURE 2 | Schematic overview of the experimental design. See text for methodological details.
the isolation process, cultures were kept under a light/darkregime of 14:10 h, irradiance of 10–30 µmol photons m−2 s−1,and temperature of 25◦C. Isolates were deposited at the BlueBiotechnology and Ecotoxicology Culture Collection (acronymLEGE), at CIIMAR, Matosinhos, Portugal.
Microphotographs of environmental samples and isolates(either bright field or fluorescence) were obtained usinga microscope (Model BX41, Olympus, Hamburg, Germany)coupled to an image analysis system (Model DP72 microscopedigital camera, Olympus). Filament and/or cell dimensions weremeasured using the software Cell B (Olympus), with the sameequipment. Dominant or abundant species (qualitative measure)present in each mat sample were recorded.
Survey of Cyanobacterial Taxa fromPrevious PublicationsA primary literature search was performed to assess thecyanobacterial species richness previously recorded in theAraruama’s complex. As a consequence, a checklist of taxa wascreated, which also includes the cyanobacterial taxa recorded inthis study (Supplementary Table S1).
DNA Isolation and 16S rRNA GeneAmplificationFor each sample, three microbial mat subsamples (Figure 2) werehomogenized using sterile mortars and pestles. Approximately400mg (wet weight) of material was used for each DNAextraction. Total environmental DNA (eDNA) was extractedfrom samples using the Zymo Research Soil Microbe DNAkit (Zymo Research Corp, Irvine, CA, USA), according tothe manufacturer’s instructions. DNA integrity was checked byagarose gel electrophoresis with ethidium bromide staining.DNA concentration was determined and normalized betweensamples (and subsamples) as described in Leão et al. (2012),and then the triplicates were pooled (Figure 2). With respectto isolates, genomic DNA (gDNA) was extracted from freshbiomass samples, harvested from log-phase cultures, using the
commercial kit PureLinkTM Genomic DNAMini Kit (Invitrogen,Carlsbad, USA).
In the case of gDNA from isolates, PCRs were performedusing the conditions and the primer sets previously describedin Brito et al. (2012). Regarding eDNA samples, a fragment of422 bp length was amplified using the cyanobacteria-specificprimer pair CYA-359F/CYA-781R (Nübel et al., 1997). In PCRsfor denaturing gradient gel electrophoresis (DGGE) analysis, theforward primer (CYA-359F-GC) had a 40-nucleotide GC-richsequence (GC clamp) attached to its 5′-end. The PCR reactionsfor DGGE were prepared in a volume of 20 µl containing 1×Reaction Buffer, 2.5 mMMgCl2, 200µMof each deoxynucleotidetriphosphate, 20.0 pmol of each primer, 0.5 U of GoTaq R©
Flexi DNA Polymerase (Promega, Madison, WI, USA), 20mgml−1 of bovine serum albumin (BSA), and 5–10 ng of DNAtemplate. Thermal cycling was carried out in a T-ProfessionalStandard thermocycler (Biometra, Goettingen, Germany) underthe following conditions: initial denaturation at 94◦C for 2 min,followed by 11 cycles at 94◦C for 1 min, 65◦C for 1 min, and 72◦Cfor 1 min. This first step was followed by 32 cycles at 94◦C for 1min, 55◦C for 1 min, and 72◦C for 4 min and a final extensionstep at 72◦C for 4 min. PCR products were separated by 1.5%(w/v) agarose gel in 1× TAE buffer (40 mM Tris, 20 mM aceticacid, 1mMEDTA). Gels were stained with ethidium bromide andphotographed under UV transillumination.
Denaturing Gradient Gel Electrophoresis,and CloningAfter gel visualization, PCR products from the same mat samplewere pooled. Twenty microliters of each pooled sample wereloaded onto 6% polyacrylamide 1 mm gels, using a 40–60%denaturing gradient (100% denaturing conditions correspondto 7 M urea and 40% formamide). The electrophoresis wasperformed using a DCode system (Bio-Rad, CA, USA) at 60V for 16 h, in 1× TAE buffer. The gel was stained with 1×SYBR Gold nucleic acid stain (Invitrogen, San Diego, CA). Smallpieces of visible DGGE bands (Supplementary Image S2) were
Frontiers in Microbiology | www.frontiersin.org 4 June 2017 | Volume 8 | Article 1233

Ramos et al. Cyanobacterial Diversity in Brazilian Hypersaline Mats
punched from the gel with sterile pipette tips. Each piece wasthen transferred into PCR tubes containing 30 µl of sterile waterand incubated at 37◦C for 30 min to allow diffusion of the DNA.Two microliters of the eluted DNA were used as template forthe re-amplification of the 16S rRNA gene, as described above.In this case, CYA-359F (i.e., without the GC clamp) was theforward primer used, as described by Nübel et al. (1997). PCRproducts were then extracted from the agarose gel and purified byusing the spin columns Cut & Spin Gel Extraction (GRiSP, Porto,Portugal). Purified PCR products from each DGGE band werecloned using a pGEM R©—T Easy Vector System Kit (Promega,Madison, WI, USA), and transformed into Escherichia coli ONESHOT R© TOP10 chemically competent cells (Invitrogen, SanDiego, CA), following the instructions of the manufacturers.Colonies were selected by blue-white screening, and the presenceof the appropriate insert was evaluated by colony PCR, usingthe primers pUCF/pUCR. Colonies with the insert were grownovernight at 37◦C, in liquid LB medium supplemented with 100µg ml−1 of ampicillin, with shaking at 200 rpm and plasmidswere isolated from the overnight cultures using the GenElutePlasmid Miniprep Kit (Sigma, USA).
Sanger SequencingPurified plasmids and PCR products obtained from isolates(purified with the same spin columns mentioned above) weresent for sequencing at Macrogen (Amsterdam, Netherlands).All sequences were checked for chimera formation using thesoftware DECIPHER (Wright et al., 2012).
High-Throughput Amplicon SequencingPCR amplifications from eDNA were obtained using thesame primers used for PCR-DGGE, but without the GCclamp in the forward primer. They were originally designed(Nübel et al., 1997) to target the V3–V4 region of the 16SrRNA gene for cyanobacteria (including chloroplasts). Thisregion is suitable for studying cyanobacterial diversity by NGSmethodologies (Mizrahi-Man et al., 2013; Nguyen et al., 2016).The amplification of PCR products was carried out usinga barcode-tagged PCR primer approach, following the sameconditions, adaptors and reagents as described in Pinto et al.(2014). Pre-sequencing processing such as amplicon librarygeneration, barcoding and emulsification are described elsewhere(Pinto et al., 2014). Massive parallel sequencing was performedusing the Genome Sequencer FLX System Instrument (454Life Sciences, Roche) at Biocant, Portugal. Raw sequence readswere then analyzed and processed using an in-house, automaticpipeline from Biocant, Portugal. Processing steps performedincluded sorting of sequences by sample, dereplication, filteringof low-quality sequences, detection and removing of DNAchimeras, Operational Taxonomic Units (OTUs) clustering(sequence similarity cutoff value of 97%), and generation ofOTUs consensus sequences, as described in Pinto et al. (2014).Steps of quality control included the exclusion from furtherprocessing of putative contaminations and artifacts, of reads<100 aligned nucleotides or with a low alignment quality, ofreads withmore than 2% of ambiguities, or 2% of homopolymers,
and of singleton reads (i.e., a read with a sequence that is presentexactly once).
In order to compare between OTU delineation methods,raw reads obtained were additionally analyzed in the SILVAngspipeline (Quast et al., 2013). After removing primers and barcodetags, reads were dereplicated and unique reads with a sequencesimilarity value of 98% were clustered into OTUs. The sameabove mentioned steps of quality were followed. The referenceread of each OTU (i.e., the longest read in each cluster) wasclassified by a local BLASTn search against the non-redundantversion of the SILVA SSU Ref dataset (release 123; http://www.arb-silva.de) with standard settings (Camacho et al., 2009).
Nucleotide Sequence Accession NumbersNovel PCR-based sequences associated with this study areavailable in GenBank under the accession numbers KT730170-KT730215. Sequence reads obtained in this study were depositedin NCBI’s Sequence Read Archive (SRA) with the project numberPRJNA294527 (SRA identifier: SRP063335); for correspondingaccession numbers and further details on sequences seeSupplementary Table S2.
Phylogenetic AnalysisThe cyanobacterial 16S rRNA gene sequences from isolates (9),DGGE bands (38), and consensus sequences of pyrosequencingderived “97% cutoff” OTUs (105) were analyzed phylogenetically(Table 2 and Supplementary Table S2). OTUs consensussequences with <300 nucleotides length were removed fromphylogenetic and downstream analyses. A second round ofidentification and removal of chimeras was performed forpyrosequencing sequences using DECIPHER (Wright et al.,2012). In order to include the most similar sequences andto attain a reliable and robust backbone representation ofthe cyanobacterial diversity, the best BLAST hits for oursequences (and the closest known relative, if the best hit wasan unidentified organism) were also included in the phylogeny(see Supplementary Table S2), together with all the availablesequences from reference strains included in the Bergey’sManual of Systematic Bacteriology (Castenholz et al., 2001). The
TABLE 2 | Number of cyanobacterial 16S rRNA gene sequences used in or
discarded from phylogeny, by sample.
Sequences from EB1 EB2 EB3 Total
Included (145)
Isolates 4 3 2 9
DGGE bands 8 13 17 38
Pyrosequencing OTUs# 64 24 10 98
Not included (67)
Singlets 27 18 9 54
Sequences <300 bp§ 4 1 2 7
Chimeras* 0 2 4 6
#Sequence similarity threshold of 97%; generated by the Biocant pipeline.§But included in further analyses (e.g., see Table 6).
*Detected in a second round of screening, using DECIPHER.
Frontiers in Microbiology | www.frontiersin.org 5 June 2017 | Volume 8 | Article 1233
Ramos et al. Cyanobacterial Diversity in Brazilian Hypersaline Mats
sequences from the unidentified melainabacterium strain YS2and Chloroflexus auranticus J-10-fl were used as outgroups.
Multiple sequence alignment, evolutionary analyses andphylogenetic tree reconstructions were carried out using thesoftware package MEGA6 (Tamura et al., 2013). Kimura 2-parameter was the model of nucleotide substitution used toinfer the Maximum Likelihood (ML) tree (1,000 replicates), aschosen by the corrected Akaike’s Information Criterion (AICc).A discrete Gamma distribution was used to model evolutionaryrate differences among sites [5 categories (+G, parameter =
0.3556)]. The rate variation model allowed for some sites to beevolutionarily invariable ([+I], 31.8460% sites). The final analysisinvolved 402 nucleotide sequences with a total of 345 positions inthe dataset.
Taxonomic Assignments andCyanobacterial Diversity ComparisonCyanobacteria were identified based on morphology (hereafterreferred to as morphospecies) following taxonomic identificationkeys from Komárek and Anagnostidis (1998, 2005). All taxa werethen brought to their most recent taxonomic synonyms (Guiryand Guiry, 2016), following the recent system of classificationat the genus and order level (Komárek et al., 2014). This listof morphospecies was compared with the list of morphospeciesacquired from the survey (Supplementary Table S1), which werealso brought to the most recent synonyms (Guiry and Guiry,2016).
Cyanobacterial 16S rRNA gene sequences obtained in thisstudy were classified bymeans of different automatic, hierarchicaltaxonomies such as Greengenes v13.8 (McDonald et al., 2012),RDP II classifier v11.4 (Wang et al., 2007), NCBI Taxonomy(Federhen, 2012), and SILVA Taxonomy v123 (Quast et al.,2013) using standard settings. Furthermore, using a phylogeny-guided clustering approach as recommended by Nguyen et al.(2016), we have manually curated and categorized the sequencesinto phylotypes according to their phylogenetic placement andbootstrap support of clades (Supplementary Image S3). Thus, inthis study, a phylotype should be taken as a taxon sensu lato,which may embrace diversity corresponding to more than onetraditional, taxonomic rank.
The number of taxa (“species” richness, S) determinedby morphological- (i.e., morphospecies) and DNA-basedapproaches (i.e., phylotypes and OTUs defined by a 97% ora 98% identity threshold) were compared between samplesand among methods. Furthermore, using the number of readsencompassed in each OTU (97%) or phylotype, i.e., their relativeabundance (Supplementary Tables S2, S3), other diversity indiceswere calculated (according to Morris et al., 2014) and comparedbetween samples: Shannon’s diversity (H’), Simpson’s diversity(1/D), and Shannon’s evenness (EH).
RESULTS
Characterization of Microbial MatsMorphologically, the cyanobacterial mats found at the samplingsites belonged to the smooth (EB1) or polygonal (EB2 andEB3) types, while structurally they were layered (Supplementary
Table S1 and Supplementary Image S1). At the time of sampling,smooth mats from EB1 presented a carpet-like form, covering alarge area of the pond bottom. The sampled mat had a thin greenlayer on top (about 3.5 mm), followed by a purple (5.5 mm),and a dark (5.48 mm) layer (Supplementary Image S1G). Themats found in EB2 and EB3 consisted of large, irregularly shaped(due to border wear) polygonal plates (Supplementary ImagesS1B,C). Sampled mats (Supplementary Images S1H,I) showed athin yellow-greenish layer on top (2.4 and 2.7 mm in EB2 andEB3, respectively), followed by a purple-brown layer (2.9 and 3.4mm) and then a dark layer (24.6 and 27.9 mm). Some thin anddiscontinuous calcium carbonate layers were found below thecyanobacterial layer (data not shown).
Morphological Characterization ofCyanobacterial DiversityThirty-six morphospecies belonging to 22 genera weredistinguished by microscopic observations of the three matsamples (Table 3, Figure 3, and Supplementary Images S4–S6).In the mat collected at EB1 we observed 21 species, 18 inEB2 and 12 in EB3, belonging to the orders Chroococcales,Oscillatoriales, Spirulinales, and Synechococcales. Members ofthe Nostocales, Pleurocapsales, or Chroococcidiopsidales werenot observed in any of the samples. The most represented generawere Aphanothece, Oscillatoria, Spirulina (only from the EB3sample), and Pseudanabaena.
Four morphospecies were common to all three samples(Table 3): the colonial, rod-shaped Aphanothece cf. stagnina(Figure 3H), the spherical, unicellular Geminocystis sp.(Figure 3I), the very thin, filamentous Halomicronemaexcentricum (Figures 3A,E), and the highly motile, filamentousGeitlerinema cf. lemmermannii (Figure 3B). This latter speciesdominated the mat sample from EB1 and was abundant at EB3.Microcoleus aff. steenstrupii (Figure 3C), with trichomes denselypacked in fascicles, was abundant at EB1, and present at EB2.The wide sheathed, bundle-forming species C. chthonoplastes(Figure 3D) dominated the mats collected at EB2 and EB3, butwas not observed in EB1. Other abundant taxa were Leptolyngbyaminuta (EB2) and Oxynema cf. lloydianum (Figures 3F,G) atEB3. O. lloydianum was also detected at EB2. Although, visiblydominated by cyanobacteria, the microscopic examinationindicated the presence of other organisms in the top layer of themats (Supplementary Image S6).
Nine cyanobacterial strains belonging to five different taxawere isolated (Table 4 and Figure 4). One taxon is from the orderOscillatoriales (Geitlerinema cf. lemmermannii) and the otherfour from the order Synechococcales (Leptolyngbya aff. ectocarpi,Leptolyngbya sp., Nodosilinea sp., and Synechococcus sp.).
Molecular and PhylogeneticCharacterizationThe pyrosequencing generated 10,836 high quality reads in total,for the three mat samples. The number of reads was decreasedto 10,487 after removing singletons (54 were from cyanobacteria;see Table 2). The number of OTUs obtained showed a similarpattern for the three samples in rarefaction curves with a
Frontiers in Microbiology | www.frontiersin.org 6 June 2017 | Volume 8 | Article 1233

Ramos et al. Cyanobacterial Diversity in Brazilian Hypersaline Mats
TABLE 3 | Species composition and morphological-based characterization of cyanobacteria observed in the upper layer of the microbial mats collected at Araruama
(EB1), Pitanguinha (EB2), and Pernambuco (EB3) lagoons.
Taxa (Order/Morphospecies) Samplea Cell sizeb(Ø or length
× width; in µm)
Figures/panels
EB1 EB2 EB3
CHROOCOCCALES
Aphanothece cf. conglomerata Rich • 1.3 ± 0.1 × 0.9 ± 0.1 S4C
Aphanothece aff. salina Elenkin & Danilov • 6.0 ± 1.2 × 3.5 ± 1.0 S4D
Aphanothece cf. stagnina (Sprengel) A.Braum • ◦ ◦ 9.5 ± 1.9 × 4.6 ± 0.6 3H and S4E
Chroococcus aff. turgidus (Kützing) Nägeli • 22.9 ± 3.2 × 33.2 ± 5.1 S4F
Cyanosarcina aff. thalassia Anagnostidis & Pantazidou ◦ 1.3 ± 0.2 S4H
Geminocystis sp. Korelusová, Kastovský & Komárek • • • 4.1 ± 0.8 3I and S4I
Gloeocapsopsis cf. crepidinum (Thuret) Geitler ex Komárek • ◦ 4.3 ± 1.3 S4J
Gloeothece cf. subtilis Skuja • 1.5 ± 0.1 × 0.8 ± 0.1 S4K
OSCILLATORIALES
Coleofasciculus chthonoplastes (Thuret ex Gomont) Siegesmund,
Johansen & Friedl
� � 8.0 ± 2.0 × 6.5 ± 0.7 3D and S5A
Geitlerinema aff. amphibium (Agardh ex Gomont) Anagnostidis • 5.2 ± 0.7 × 2.8 ± 0.5 S5B
Geitlerinema cf. lemmermannii (Woloszynska) Anagnostidis � • � 5.2 ± 1.3 × 2.1 ± 0.3 3B and S5C
Microcoleus aff. steenstrupii Petersen � • 6.3 ± 1.3 × 3.9 ± 0.6 3C and S5I
Oscillatoria limosa Agardh ex Gomont • ◦ 4.4 ± 0.7 × 9.7 ± 0.3 S5L
Oscillatoria margaritifera Kützing ex Gomont • 6.2 ± 0.7 × 27.6 ± 1.9 S5M
Oscillatoria subbrevis Schmidle • 2.5 ± 0.4 × 7.3 ± 0.3 S5N
Oxynema cf. lloydianum (Gomont) Chatchawan, Komárek, Strunecky,
Smarda & Peerapornpisal
• � 3.4 ± 0.7 × 8.5 ± 0.8 3F–G and S5O
Phormidium nigroviride (Thwaites ex Gomont) Anagnostidis & Komárek • 4.5 ± 0.8 × 14.3 ± 0.7 S5P
SPIRULINALES
Spirulina labyrinthiformis Gomont • 0.7 ± 0.1 wide, spirals
width: 1.9 ± 0.5
S6B,C
Spirulina subsalsa Oerstedt ex Gomont ◦ 1.3 ± 0.3 wide, spirals
width: 3.4 ± 0.3
S6D
Spirulina tenerrima Kützing ex Gomont • 0.4 ± 0.1 wide, spirals
width: 1.4 ± 0.1
S6E
SYNECHOCOCCALES
Aphanocapsa litoralis (Hansgirg) Komárek & Anagnostidis • 3.0 ± 0.5 S4A
Aphanocapsa cf. salina Woronichin • • 1.2 ± 0.2 S4B
Coelosphaeriopsis cf. halophila Lemmermann • 2.8 ± 0.2 S4G
Halomicronema excentricum Abed, Garcia-Pichel & Hernández-Mariné • � • 2.8 ± 0.6 × 0.8 ± 0.1 3E and S5H
Komvophoron breve (Carter) Anagnostidis • 1.1 ± 0.1 × 2.0 ± 0.2 S5D
Komvophoron cf. minutum (Skuja) Anagnostidis & Komárek • 2.0 ± 0.3 × 2.2 ± 0.3 S5E
Lemmermanniella sp. Geitler in Engler & Prantl • 1.0 ± 0.1 × 0.6 ± 0.1 S4L
Leptolyngbya crosbyana (Tilden) Anagnostidis & Komárek • • 1.9 ± 0.6 × 1.3 ± 0.1 S5F
Leptolyngbya cf. ectocarpi (Gomont) Anagnostidis & Komárek • 3.0 ± 1.0 × 1.5 ± 0.4 S5G
Nodosilinea sp. Perkerson & Casamatta • 1.7 ± 0.5 × 2.5 ± 0.5 S5J
Nodosilinea nodulosa (Li & Brand) Perkerson & Casamatta • 1.0 ± 0.2 × 1.1 ± 0.2 S5K
Pseudanabaena aff. amphigranulata (Goor) Anagnostidis • 3.8 ± 0.9 × 1.3 ± 0.1 S5Q
Pseudanabaena cf. limnetica (Lemmermann) Komárek • 3.5 ± 1.1 × 0.8 ± 0.3 S5R
Pseudanabaena cf. minima (G.S.An) Anagnostidis • 1.5 ± 0.5 × 1.4 ± 0.2 S6A
Synechococcus sp. Nägeli • 2.1 ± 0.6 × 0.8 ± 0.1 S4M
Synechocystis salina Wislouch • 2.1 ± 0.2 S4N
aUnderlined symbols refer to first reported observations for the entire lagoons complex. Black circles or squares denote first reported observations of a species for that water body.
White circles or squares indicate that the species was also observed in previous studies (see also the full checklist available in Supplementary Table S1). Squares mean that the taxon
was found to dominate or was abundant in samples from this study.bMean ± standard deviation values (n = 20).
Frontiers in Microbiology | www.frontiersin.org 7 June 2017 | Volume 8 | Article 1233

Ramos et al. Cyanobacterial Diversity in Brazilian Hypersaline Mats
FIGURE 3 | Epifluorescence (A) and bright field micrographs (B–I) showing ubiquitous, abundant, or dominant cyanobacteria in the environmental samples. (A) Tuft
of filaments from Halomicronema excentricum, a thin cyanobacterium common to the three samples and abundant in the mat from EB2; (B) Geitlerinema cf.
lemmermannii, present in the three samples and being dominant at EB1 and abundant at EB3; (C) Microcoleus aff. steenstrupii, abundant in EB1; (D) Coleofasciculus
chthonoplastes, a dominant species in mats collected at EB2 and EB3; (E) Halomicronema excentricum; (F,G) Oxynema cf. lloydianum abundant at EB3; (H)
Aphanothece cf. stagnina and (I) Geminocystis sp. both common to all three samples. Scale bar: 10 µm.
good coverage (Supplementary Image S8). Cyanobacterial 16SrRNA gene sequences accounted for >85% of total reads inany of the samples, while plastid sequences only accountedfor ≤0.8% in any of the mats (see also Supplementary ImagesS7, S9). A circular ML tree (Figure 5) with 145 16S rRNAgene sequences obtained in this study (Table 2) was generated,along with sequences from reference strains (Castenholz et al.,2001) and from BLAST search results. Additional visualizationsof the same tree are provided in Supplementary Images S3,S10. The sequences obtained in this study are distributedacross the entire tree with the exception of the Nostocalesand Gloeobacterales clades (Figure 5A). The same holds truewhen looking at sequences from each mat (Figures 5C–E). Forthe EB1 sample (Figure 5C), the most abundant 97% OTU,(20.6% relative abundance) is placed in the clade of phylotypeC in the Oscillatoriales (see also Supplementary Image S3).Six other OTU sequences, placed in phylotypes from differentlineages of Synechococcales, Pleurocapsales, or Oscillatoriales,had over 4% relative abundance. These observations contrast
with the pyrosequencing data for mats collected at the othertwo sites. The mat from EB2 (Figure 5D) was clearly dominatedby a single OTU (84.7% relative abundance). This sequenceis placed in phylotype A, which includes the reference strainsColeofasciculus (ex-Microcoleus) chthonoplastes CCY9606 andPCC 7420 (Siegesmund et al., 2008; Supplementary ImageS3). The mat from EB3 (Figure 5E) was also dominated bya single sequence (85.9% relative abundance). It was includedin phylotype J, which also encompasses the second mostabundant sequence in the sample (>4% relative abundance)(Supplementary Image S3).
Regarding the sequences from excised DGGE bands, thosefrom the EB1 and EB3 mats were placed among different lineagesof the tree (see also Supplementary Image S3 and SupplementaryTable S2). The DGGE band sequences from EB2 were all placedin the clade of phylotype J.
The isolate-derived sequences were found to belong todifferent lineages of the order Synechococcales or to the samelineage within the Oscillatoriales (phylotype E), as shown
Frontiers in Microbiology | www.frontiersin.org 8 June 2017 | Volume 8 | Article 1233

Ramos et al. Cyanobacterial Diversity in Brazilian Hypersaline Mats
TABLE 4 | List of cyanobacterial strains isolated from hypersaline microbial mats
collected at the Araruama lagoon system (RJ, Brazil).
Strain Order Sampling
site
Figure
Leptolyngbya aff. ectocarpi LEGE
11389
Synechococcales EB1 4B
Geitlerinema cf. lemmermannii
LEGE 11390
Oscillatoriales EB1 4E
Geitlerinema cf. lemmermannii
LEGE 11391
Oscillatoriales EB1 4G
Leptolyngbya sp. LEGE 11392 Synechococcales EB3 4D
Geitlerinema cf. lemmermannii
LEGE 11393
Oscillatoriales EB2 4F
Synechococcus sp. LEGE 11394 Synechococcales EB3 4A
Nodosilinea sp. LEGE 11395 Synechococcales EB2 4C
Geitlerinema cf. lemmermannii
LEGE 11396
Oscillatoriales EB1 4H
Geitlerinema cf. lemmermannii
LEGE 11401
Oscillatoriales EB2 #
#This strain was lost.
Figure 5. The clade of this latter phylotype contains thereference strain Geitlerinema sp. PCC 7105. These findingsare in accordance with the morphological-based identification(Table 4).
Seventy-five sequences (51.7% of total) obtained in this studyhad a best BLAST hit result of ≥99% (Supplementary Table S2).From these, 51 sequences had as best hit a sequence from asaline environment. Themajority of these homologous sequences(42 out of 51) were obtained from hypersaline microbial matscollected at a single location—Guerrero Negro, Baja CaliforniaSur, Mexico (Harris et al., 2013). The Araruama’s and the highlysimilar Guerrero Negro’s hypersaline cyanobacterial sequencesgrouped into nine distinct lineages (phylotypes A, B, D, J, L, W,X, AD, AH, and AM; Figure 5; see also Supplementary Table S2and Supplementary Image S3).
The metagenomic data obtained using the SILVAngs pipeline,(98% OTUs cutoff) can be visualized as Krona charts (Ondovet al., 2011) in a permalink that was archived by WebCite athttp://www.webcitation.org/6kiUALfVA (see also SupplementaryImage S9).
Richness, Diversity, and SpeciesComposition ComparisonsTaxon richness (S) values obtained by the different approachesis illustrated by Venn diagrams (Figure 6). Regardless of themethod used, EB1 was invariably the mat that showed a highernumber of taxa (Figure 6). In contrast, EB3 was the mat withthe lowest number of taxa (the only exception was with the RDPclassifier, for which EB3 had same taxon richness as EB2). Thenumber of common taxa present in all three mats varied fromfour (morphological-based identification) to seven. There weremore taxa shared by EB1 and EB2 than by EB1 and EB3, or byEB2 and EB3. With regard to classification methods, the numberof unique taxa recognized in all samples was higher when looking
at phylotypes (48 taxa), morphospecies (36) or at sequencesclassified using the NCBI Taxonomy database (33). The RDPclassifier had the lowest performance in differentiating thecyanobacterial diversity (9) present on the mats from Araruama’slagoons. With the exception of the NCBI Taxonomy database, aconsiderable number of unclassified sequences was obtained bythe classifiers (see Supplementary Table S2). The most stringentdefinition of OTU (98%) increased the number of distinct taxaobtained (25 vs. 16 for the 97% threshold).
Table 5 shows the species richness by cyanobacterial orderand compares values obtained in this study for morhospeciesand phylotypes, with the number of morphospecies previouslyreported for the Araruama lagoon system, as recovered from oursurvey (Supplementary Table S1). With 21 new cyanobacterialspecies records and eight new genera records, this study hasincreased by 16.3 and 20% the number of (morpho-) species andgenera reported for the Araruama system, respectively (Table 3).Similar results were obtained for taxonomic assignments ofmorphospecies and phylotypes at the order level (Table 5). Themain differences were the identification of Spirulinales speciesby the morphological-based approach, an order not detectedin the 16S rRNA-based phylogeny of Araruama’s sequences,and the detection of phylotypes within the Pleurocapsales,Chroococcidiopsidales, and Halothece-related lineages, taxa thatwe were unable to identify by microscopic examination.
The cyanobacterial species richness estimates for the samples,obtained after applying morphological- or phylogenetically-based, manually curated classifications, or just after clusteringof OTUs directly derived from metagenomic data are depictedin Table 6. This table also shows other diversity measures forthe cyanobacteria present in the mat samples for a 97% OTUcutoff. The value of S was higher for unclassified OTUs thanfor morphospecies or phylotypes, and was also higher for themore stringent 98% OTU cutoff. Irrespectively of the type of taxacategorization, S was consistently higher for the EB1 and lowerfor the EB3 mat samples. In general, H’ and 1/D values wereconsistent with these observations among samples and betweenthe two types of taxa categorization. EH estimates were alsohigher for the EB1 sample and lower for EB3 (phylotypes) or forEB2 (97%-level OTUs).
DISCUSSION
In this work, we have attempted to uncover the cyanobacterialdiversity present in hypersaline mats from three lagoonsof the Araruama system, while exploring the impact ofdifferent classification methods or procedures to evaluatesuch diversity. The polyphasic approach used confirmed andextended the high cyanobacterial diversity reported previouslyin morphological-based studies, for the entire Araruama system(see Supplementary Table S1). The differences in terms ofdiversity observed between EB2/EB3 and EB1 (Table 6 andFigure 6) may have been caused by the lower salinity observedfor EB1 when compared to the other two sites. However, it is alsopossible that a bigger sampling effort (i.e., larger sampled area)could have resulted inmore taxa overlap among the studiedmats.
Frontiers in Microbiology | www.frontiersin.org 9 June 2017 | Volume 8 | Article 1233

Ramos et al. Cyanobacterial Diversity in Brazilian Hypersaline Mats
FIGURE 4 | Cyanobacterial isolates obtained in this study. (A) The small, unicellular Synechococcus sp. LEGE 11394; (B) the brownish, filamentous Leptolyngbya aff.
ectocarpi LEGE 11389; (C) the sheathed filamentous Nodosilinea sp. LEGE 11395; (D) the thin, filamentous Leptolyngbya sp. LEGE 11392; (E) Geitlerinema cf.
lemmermannii LEGE 11390, at 400× magnification; (F–H) the same non-sheathed filamentous species as in (E), at 1,000× magnification; strains LEGE 11393,
11391, and LEGE 11396, respectively. The short filaments in (F) are hormogonia. Scale bar: 10 µm.
Molecular-Based ApproachAs expected, pyrosequencing allowed a deeper coverage of thediversity present in the samples, particularly when compared toPCR-DGGE (Table 2). In fact, PCR-DGGE revealed less diversitythan we had anticipated—which might be partially explained byour inability to excise many of the abundant faint bands that wereobserved (Supplementary Image S2; see also Sánchez et al., 2009).Amplification bias is also a known issue in PCR-DGGE (Neilsonet al., 2013) and may explain underrepresentation of certaintaxa in our data. Curiously, the DGGE-detected phylotypes J
(EB2 sample) and A (EB1 sample) could not be detected bypyrosequencing (Figure 5) despite the same pool of DNA havingbeen used for both techniques (Figure 2). Like other PCR-based approaches (von Wintzingerode et al., 1997; Speksnijderet al., 2001), the two culture-independent molecular techniquesemployed in this study are prone to bias, artifacts, pitfalls, andhave limitations, whose discussion and explanation falls beyondthe scope of this study (for details on these issues see Mühlinget al., 2008; Green et al., 2010; Berry et al., 2011; Scholz et al.,2012; Bragg and Tyson, 2014). It is possible that by removing
Frontiers in Microbiology | www.frontiersin.org 10 June 2017 | Volume 8 | Article 1233

Ramos et al. Cyanobacterial Diversity in Brazilian Hypersaline Mats
FIGURE 5 | Circular phylogenetic ML trees (log-likelihood of −15279.7163)
based on cyanobacterial 16S rRNA gene sequences. Sequences obtained in
this study are marked with colored diamond squares (see below), while white
circles denote sequences from reference strains. The phylogram tree in (A)
shows the taxonomic classification for the sequences, at the order level, and
their assigned phylotypes (capital letters); highlighted in red are phylotypes that
also include sequences obtained from hypersaline microbial mats from
Guerrero Negro (see Harris et al., 2013 and text for details). Black asterisks
indicate phylotypes consisting in single sequences that have no close relatives
(i.e., loner sequences sensu Wilmotte and Herdman, 2001). The trees in (B–E)
are the cladogram version of the tree in (A); tree branches in orange represent
values of bootstrap support >50%, and in red >75% (1,000 replicates). In (B)
are highlighted the reference strains sequences; in (C) the sequences from the
mat collected at EB1 (Araruama lagoon); in (D) those from EB2 (Pitanguinha);
and in (E) the sequences from EB3 (Pernambuco). Bluish diamonds indicate
sequences from EB1, greenish are from EB2, and brownish are from EB3.
Darker colors refer to 454-OTUs, lighter to isolates and normal colors are for
DGGE-derived sequences. Numbers in (C–E) highlight the
(Continued)
FIGURE 5 | Continued
isolates obtained from each mat: 1 Leptolyngbya aff. ectocarpi LEGE 11389;
2, 3, and 4 Geitlerinema cf. lemmermannii strains LEGE 11390, 11391, and
11396; 5 Nodosilinea sp. LEGE 11395; 6 and 7 Geitlerinema cf. lemmermannii
strains LEGE 11393 and 11401; 8 Synechococcus sp. LEGE 11394; 9
Leptolyngbya sp. LEGE 11392. Arrows point out all OTUs encompassing
more than 4% of the total pyrosequencing reads from a sample. In addition,
filled arrows indicate the most abundant OTU of each sample. Tree was rooted
with the unidentified melainabacterium strain YS2 (AF544207) and
Chloroflexus aurantiacus J-10-f (CP000909) as outgroups.
singletons and small sequences from the pyrosequencing data(Table 2), we may have missed sequences phylogenetically closeto the unique DGGE-derived sequences. Still, because the DGGEand pyrosequencing datasets were not entirely redundant, usingboth techniques proved a fruitful strategy.
Culture-Dependent ApproachFive of the nine isolates corresponded to a single species,Geitlerinema cf. lemmermannii (Table 4 and Figure 5).Geitlerinema spp. are common in hypersaline microbial mats(Richert et al., 2006; Goh et al., 2009). Hence, obtaining isolatesfrom this genus facilitates future studies on the ecophysiologyof these organisms in hypersaline mats. Quite surprisingly, theclade of this phylotype does not include any sequence obtainedby the culture-independent approaches (Supplementary ImageS3), even though this same morphospecies was detected bymicroscopy in all samples and shown to be abundant in EB1and EB3 (Table 3 and Figure 3B). One possible explanationis bias in the DNA extraction from this cyanobacterium fromenvironmental samples (gDNA extraction from cultured isolateswas not problematic). Nevertheless, this finding reinforcesthe relevance of using complementary methodologies. Theusefulness of culturing due to its capacity to unveil novelmicrobial diversity, undetected by current metagenomicstechniques is well-known (Lagier et al., 2015). In line with theseobservations, the phylogenetic position of Leptolyngbya sp.LEGE 11392 (Figure 5 and Supplementary Image S3) indicatesthat its 16S rRNA gene qualifies as a loner sequence (sensuWilmotte and Herdman, 2001). Hence, this isolate represents inall likelihood a cryptic taxon within the recognized polyphyleticgenus Leptolyngbya (Komárek, 2016). This strain, very likelyunderrepresented in the original sample, will have been highlycompetitive during the isolation process.
The difficulty in bringing the observed diversity into culture,as portrayed by both the low number and low diversityof the isolates, suggests that improvements will have to bemade in isolation strategies (e.g., circumscribe rapidly growingand mobile species, such as Geitlerinema cf. lemmermannii,by phototaxis), and cultivation (e.g., change culture mediaand/or make adjustments to their compositions to better mimicnutritional requirements of the cyanobacteria from hypersalinemats, or use culture medium specifically developed for somespecies, e.g., as for Aphanothece halophytica in Yopp et al., 1978).In fact, the most similar GenBank sequences (≥99%) for thesequences that we obtained were predominantly from saline
Frontiers in Microbiology | www.frontiersin.org 11 June 2017 | Volume 8 | Article 1233

Ramos et al. Cyanobacterial Diversity in Brazilian Hypersaline Mats
FIGURE 6 | Venn diagrams showing the number of distinct cyanobacterial taxa distinguished in each mat sample, by different approaches (including a
morphological-based identification, a phylogenetic-guided categorization or an automatic taxonomic classification using different classifiers). If not explicitly specified,
OTU consensus sequences were defined as a cluster of reads with 97% similarity. In parentheses are the number of unique taxa identified in all samples.
TABLE 5 | Taxon richness comparison, by taxonomic order, of morphospecies and phylotypes identified in this study and morphospecies previously reported for lagoons
from the Araruama’s entire complex, as retrieved from the literature survey (see Supplementary Table S1 for the full checklist).
Order Number of morphospecies
(this study)#Number of unique
phylotypes (this study)
Number of morphospecies
(other studies)#Total number of morphospecies,
including this study#
Chroococcales 8 (6), 1 new record& 8 [including 1 loner
sequence]
46 (14) 47 (15)
Chroococcidiopsidales 0 1 1 (1) 1 (1)
Gloeobacterales 0 0 0 0
Nostocales 0 0 4 (3) 4 (3)
Oscillatoriales 9 (6), 6 new 12 [2 loner sequences] 27 (9) 33 (10)
Pleurocapsales 0 4 [1 loner sequence] 1 (1) 1 (1)
Rudibacter/Halothece group* 0 1 0 0
Spirulinales 3 (1), 2 new 0 5 (1) 7 (1)
Synechococcales 16 (10), 12 new 22 [5 loner sequences] 24 (11) 36 (17)
Total 36 (22), 21 new records 48 [9 loner sequences] 108 (40) 129 (48)
#Number of genera shown in parentheses.&New species records for Araruama’s entire system.*This is a cyanobacterial lineage that will probably give origin to a separate order, as stated in Komárek et al. (2014). For now, these genera are placed within the order Chroococcales
(Komárek et al., 2014). Some OTUs belonging to this lineage were previously detected by Clementino et al. (2008), in water samples from Araruama’s main lagoon. Moreover, the genus
Halothece may actually contain some species of Aphanothece (order Synechococcales), including A. halophytica, a halophilic species common in hypersaline environments (see Oren,
2012 for taxonomic details).
environments (91%), evidencing a likely ecological specificity(e.g., salts or other nutrients) of the cyanobacteria living in thisecosystems, an issue that deserves further investigation.
Comparison between Molecular- andMorphological-Based ApproachesFor the first time, a molecular study was performed in orderto characterize and classify the cyanobacterial diversity presentin microbial mats from the Araruama’s lagoons. The onlyavailable molecular sequences for cyanobacteria from this lagooncomplex were from water samples, obtained from 16S rRNAgene and nifH clone libraries targeting the whole prokaryotic
diversity (Clementino et al., 2008; see Supplementary ImageS11 for a comparative phylogenetic tree). The 16S rRNAgene cyanobacterial sequences in Clementino et al. (2008)were phylogenetically placed within three different clades, oneincluding C. chthonoplastes PCC 7420 (X70770), other withHalothece sp. PCC 7418 (AJ000708), and the third containingSynechococcus sp. WH8101 (AF001480), which, in turn, areincluded in the clades of phylotypes A, L, and AC, respectively,in our study (Figure 5 and Supplementary Image S3). Thestrains PCC 7420 and PCC 7418 belong to well-knownhalophilic or extremely halotolerant species (Garcia-Pichelet al., 1996; Oren, 2012). PCC 7420 was previously known as
Frontiers in Microbiology | www.frontiersin.org 12 June 2017 | Volume 8 | Article 1233

Ramos et al. Cyanobacterial Diversity in Brazilian Hypersaline Mats
TABLE 6 | Diversity estimates, considering different categorizations of taxa and/or molecular data processing.
Mat sample “Species” richness (S) Shannon’s diversity (H’) Simpson’s diversity (1/D) Shannon’s evenness (EH)
Morphospecies& Phylotypes& 97%
OTUs#98%
OTUs#Phylotypes$ 97%
OTU$
Phylotypes$ 97%
OTU$
Phylotypes$ 97%
OTU$
EB1 21 37 68 258 2.57 3.12 8.87 12.41 0.71 0.74
EB2 18 20 25 128 0.65 0.72 1.39 1.39 0.22 0.22
EB3 12 14 12 68 0.42 0.59 1.23 1.35 0.16 0.24
&See also Figure 6.#Unclassified pyrosequencing OTUs; directly derived from Biocant or SILVAngs metagenomic pipelines according to a 97 or 98% identity threshold for clustering, respectively.$Abundances from 454 pyrosequencing-derived data (see Supplementary Table S2); based on the total number of reads that gave rise to each OTU (i.e., consensus) sequence.
Microcoleus chthonoplastes but the taxonomy of this species waslater revised to C. chthonoplastes (Siegesmund et al., 2008; seealso nomenclatural comments in Oren, 2012). Halothece sp.PCC 7418 was firstly identified as A. halophytica, and is alsoknown as Cyanothece sp. (Garcia-Pichel et al., 1998) due toconfusing nomenclatural issues regarding related forms of A.halophytica, and which are better explained in Oren (2012).Clades of phylotypes A and L also harbor Araruama’s closely-related sequences (>99% similarity) from Guerrero Negro(Harris et al., 2013; Figure 5). This location in Baja California,Mexico, contains one of the most well-studied hypersalinemicrobial mats, dominated by C. chthonoplastes (Garcia-Pichelet al., 1996; Stal, 2012). The close identity between the 16S rRNAgene sequences from several Araruama phylotypes and GuerreroNegro sequences suggests that these cyanobacterial lineages areubiquitous in hypersaline environments.
Some congruence between phylogenetic placement andmorphology-based identification could be observed. Forinstance, C. chthonoplastes was observed to dominate thesamples from EB2 and EB3, but was not observed in EB1(Table 3). Three Aphanothece spp. were detected, although nonecould be assigned to A. halophytica. The only Aphanothecespecies observed to be present in the three mats was A. cf.stagnina (Table 3), which could correspond to sequences inphylotype L (clade of Halothece), also observed in all studiedmats. The picocyanobacterium Synechococcus sp. was detectedby microscopy only in EB3 (Table 3), from the same sample fromwhich Synechococcus sp. LEGE 11394 was successfully isolated(Table 4). Other good examples where the findings from bothphylogeny and microscopy were similar include phylotype E, aclade with the reference strain Geitlerinema sp. PCC 7105 and allour Geitlerinema isolates (Figure 5, Table 4, and SupplementaryImage S3), and phylotype AE, a clade with the Type strainH. excentricum TFEP1 (Figure 5 and Supplementary ImagesS3, S11), a very thin, filamentous Synechococcales that wasalso detected in all three samples by morphology and shownto be abundant in EB2 (Table 4 and Figure 3). The speciesH. excentricum was firstly described from microbial mats, inman-made solar ponds at Eilat, Israel (Abed et al., 2002). Theclade of phylotype J, which is represented in EB2 and EB3 andvery abundant in the latter (Figure 5 and Supplementary TableS3) contains a sub-clade with Oscillatoria acuminata PCC 6304that very likely includes Oxynema lloydianum CCALA 960(Chatchawan et al., 2012) (see Supplementary Images S3, S11).
Oxynema cf. lloydianum is a morphospecies abundant in EB3(Table 3), and characterized by having cylindrical filaments,narrowed and bent at their ends (Figures 3F,G), as described inChatchawan et al. (2012). Despite these examples, most oftena correspondence between morphospecies and phylotypes wasnot straightforward at the species/genus level (see, respectively,Table 3 and Supplementary Image S3). Still, at the orderlevel, there was a good taxonomic correlation between themorphological identification and phylogeny, with several of thephylotypes being associated with the observed morphospecies(Table 5, see also Table 3 and Figure 5).
Classification and Identification IssuesThe assignment of taxa to sequences is often a challenge inmolecular-based classification methods, chiefly in the analysisof metagenomic data directly retrieved from environmentalsamples (Mobberley et al., 2012; Garcia-Etxebarria et al., 2014;Tuzhikov et al., 2014). In order to define units of diversity,microbial ecologists very often rely on clustering of 16S rRNAsequences into OTUs. However, there is not a single satisfactorydefinition, and it is therefore common to observe the use ofmore flexible (>97% sequence identity) or more stringent (>98–99%) OTU delineations (Youngblut et al., 2013; Schmidt et al.,2015). Of course, this issue may have an impact on estimatingspecies richness. This was the case for our dataset with amuch higher diversity estimate when using the 98% OTU cutoff(Table 6).
In addition, cyanobacterial taxonomy is currently underrevision and deals with several problematic issues (in particular,the recognition of the existence of cryptic species; Dvorák et al.,2015; Komárek, 2016) making it difficult to obtain a reliableidentification at the species or genus level for some of theseorganisms. For instance, one of the reasons why the numberof taxa generated by the automatic classifiers was smaller thanthat obtained by the two manually curated, i.e., morphospeciesand phylotypes, classifications (Figure 6) is linked to the sizeof the classifier databases, namely an underrepresentation ofthe cyanobacteria phylum. Thus, due to the absence of properreference sequences covering the cyanobacterial diversity, thesedatabases may be unable to classify a significant part of agiven data set (Garcia-Etxebarria et al., 2014; Tuzhikov et al.,2014) and lead to an underestimation of the number ofunique taxa by comparison with other classification methods(Figure 6). Naturally, our manual curation process for classifying
Frontiers in Microbiology | www.frontiersin.org 13 June 2017 | Volume 8 | Article 1233

Ramos et al. Cyanobacterial Diversity in Brazilian Hypersaline Mats
phylotypes, although quite laborious, was possible because arelatively small number of 454-read sequences were obtained(Table 2). The classification was based on a simple criterion, thebootstrap support of clades (Supplementary Image S3). This isstill a broad, inexact demarcation of “taxa,” since clades mayinclude lineages more or less divergent (i.e., sequences moreor less similar), but ensures that phylogenetically close relatedsequences are grouped together.
In conclusion, it was shown that the three hypersalinemats studied harbor a high cyanobacterial diversity. Ourmorphological-based results increase by more than 15% thenumber of morphospecies and genera reported for all thelagoons of the Araruama coastal system. This fact is of particularrelevance because an exhaustive examination of single samples,collected at each mat, was followed instead of studying diversesamples from each mat. The taxonomic/classification assignmentmethods and the different approaches used (namely culture-dependent and -independent methods) varied substantially intheir ability to capture the diversity present in the samples.In our understanding, such approaches need to be regardedas complementary, and together enable a better understandingof cyanobacterial diversity in complex environmental samples.The phylogeny-guided sequence classification generated thehighest number of unique taxa, although several could not beidentified, at least at the genus level. In fact, only with themorphological-based approach was it possible to identify most ofthe recognized cyanobacteria present in the mat samples at lowertaxonomic levels. At the order level, however, the taxonomicinferences were generally congruent between phylogeny andmorphology.
AUTHOR CONTRIBUTIONS
Conceived and designed experiments: VR, RC, PL, JM, VV.Performed the experiments: VR, RC, PL, JM, SC, FS. Wrote thepaper: VR, RC, PL, SC, FS. All authors read and approved thefinal manuscript.
FUNDING
This work was supported by the Biogeochemical Project(AMPETRO 14777—Cooperation term 0050.0023165.06.4)of the GSE (Sedimentology Management) Network ofPETROBRAS, by the Brazilian National Research Agency—CNPq and by the Research Agency of Rio de JaneiroState—FAPERJ. It was also funded by Portuguese NationalFunds through FCT—Fundação para a Ciência e a Tecnologia,grants SFRH/BD/80153/2011 to VR, IF/01358/2014 to PL,and UID/Multi/04423/2013 and by the Structured Program ofR&D&I INNOVMAR—Innovation and Sustainability in theManagement and Exploitation of Marine Resources (referenceNORTE-01-0145-FEDER-000035, Research Line NOVELMAR),funded by the Northern Regional Operational Program(NORTE2020) through the European Regional DevelopmentFund (ERDF).
SUPPLEMENTARY MATERIAL
The Supplementary Material for this article can be foundonline at: http://journal.frontiersin.org/article/10.3389/fmicb.2017.01233/full#supplementary-material
REFERENCES
Abed, R. M., Garcia-Pichel, F., and Hernández-Mariné, M. (2002).Polyphasic characterization of benthic, moderately halophilic, moderatelythermophilic cyanobacteria with very thin trichomes and the proposal ofHalomicronema excentricum gen. nov., sp. nov. Arch. Microbiol. 177, 361–370.doi: 10.1007/s00203-001-0390-2
Bauersachs, T., Compaore, J., Severin, I., Hopmans, E. C., Schouten, S.,Stal, L. J., et al. (2011). Diazotrophic microbial community of coastalmicrobial mats of the southern North Sea. Geobiology 9, 349–359.doi: 10.1111/j.1472-4669.2011.00280.x
Berry, D., Ben Mahfoudh, K., Wagner, M., and Loy, A. (2011). Barcoded primersused in multiplex amplicon pyrosequencing bias amplification. Appl. Environ.Microbiol. 77, 7846–7849. doi: 10.1128/AEM.05220-11
Bragg, L., and Tyson, G. W. (2014). Metagenomics using next-generation sequencing. Methods Mol. Biol. 1096, 183–201.doi: 10.1007/978-1-62703-712-9_15
Brito, A., Ramos, V., Seabra, R., Santos, A., Santos, C. L., Lopo, M.,et al. (2012). Culture-dependent characterization of cyanobacterialdiversity in the intertidal zones of the Portuguese coast: a polyphasicstudy. Syst. Appl. Microbiol. 35, 110–119. doi: 10.1016/j.syapm.2011.07.003
Camacho, C., Coulouris, G., Avagyan, V., Ma, N., Papadopoulos, J., Bealer, K., et al.(2009). BLAST+: architecture and applications. BMC Bioinformatics 10:421.doi: 10.1186/1471-2105-10-421
Castenholz, R. W., Wilmotte, A., Herdman, M., Rippka, R., Waterbury, J. B.,Iteman, I., et al. (2001). “Phylum BX. cyanobacteria,” in Bergey’s Manual of
Systematic Bacteriology: Volume One: The Archaea and the Deeply Branching
and Phototrophic Bacteria, eds D. R. Boone, R. W. Castenholz, and G. M.Garrity (New York, NY: Springer), 473–599.
Chatchawan, T., Komárek, J., Strunecký, O., Šmarda, J., andPeerapornpisal, Y. (2012). Oxynema, a new genus separated fromthe genus Phormidium (Cyanophyta). Cryptogamie Algol. 33, 41–59.doi: 10.7872/crya.v33.iss1.2011.041
Clementino, M. M., Vieira, R. P., Cardoso, A. M., Nascimento, A. P., Silveira,C. B., Riva, T. C., et al. (2008). Prokaryotic diversity in one of thelargest hypersaline coastal lagoons in the world. Extremophiles 12, 595–604.doi: 10.1007/s00792-008-0162-x
Damazio, C. M., and Silva, L. H. (2006). Cianobactérias em esteiras microbianascoloformes da lagoa Pitanguinha, Rio de Janeiro, Brasil. Rev. Bras. Paleontol. 9,165–170. doi: 10.4072/rbp.2006.1.17
Decho, A. W. (2010). Overview of biopolymer-induced mineralization: what goeson in biofilms? Ecol. Eng. 36, 137–144. doi: 10.1016/j.ecoleng.2009.01.003
Díez, B., Bauer, K., and Bergman, B. (2007). Epilithic cyanobacterial communitiesof a marine tropical beach rock (Heron Island, Great Barrier Reef):diversity and diazotrophy. Appl. Environ. Microbiol. 73, 3656–3668.doi: 10.1128/AEM.02067-06
Dupraz, C., Reid, R. P., Braissant, O., Decho, A. W., Norman, R. S., and Visscher,P. T. (2009). Processes of carbonate precipitation in modern microbial mats.Earth-Sci. Rev. 96, 141–162. doi: 10.1016/j.earscirev.2008.10.005
Dvorák, P., Poulícková, A., Hašler, P., Belli, M., Casamatta, D. A., and Papini,A. (2015). Species concepts and speciation factors in cyanobacteria, withconnection to the problems of diversity and classification. Biodiver. Conserv.24, 739–757. doi: 10.1007/s10531-015-0888-6
Federhen, S. (2012). The NCBI taxonomy database. Nucleic Acids Res. 40, D136–D143. doi: 10.1093/nar/gkr1178
Franks, J., and Stolz, J. F. (2009). Flat laminated microbial mat communities.Earth-Sci. Rev. 96, 163–172. doi: 10.1016/j.earscirev.2008.10.004
Garcia-Etxebarria, K., Garcia-Garcerà, M., and Calafell, F. (2014).Consistency of metagenomic assignment programs in simulated
Frontiers in Microbiology | www.frontiersin.org 14 June 2017 | Volume 8 | Article 1233

Ramos et al. Cyanobacterial Diversity in Brazilian Hypersaline Mats
and real data. BMC Bioinformatics 15:90. doi: 10.1186/1471-2105-15-90
Garcia-Pichel, F., Nübel, U., and Muyzer, G. (1998). The phylogeny ofunicellular, extremely halotolerant cyanobacteria. Arch. Microbiol. 169,469–482. doi: 10.1007/s002030050599
Garcia-Pichel, F., Prufert-Bebout, L., and Muyzer, G. (1996). Phenotypic andphylogenetic analyses show Microcoleus chthonoplastes to be a cosmopolitancyanobacterium. Appl. Environ. Microbiol. 62, 3284–3291.
Goh, F., Allen, M. A., Leuko, S., Kawaguchi, T., Decho, A. W., Burns, B. P.,et al. (2009). Determining the specific microbial populations and their spatialdistribution within the stromatolite ecosystem of Shark Bay. ISME J. 3, 383–396.doi: 10.1038/ismej.2008.114
Green, S. J., Leigh, M. B., and Neufeld, J. D. (2010). “Denaturing Gradient GelElectrophoresis (DGGE) for microbial community analysis,” in Handbook of
Hydrocarbon and Lipid Microbiology, ed. K. N. Timmis (Berlin; Heidelberg:Springer), 4137–4158.
Guiry, M. D., and Guiry, G. M. (2016). AlgaeBase. Galway: World-wideElectronic Publication; National University of Ireland. Available online at:http://www.algaebase.org (Accessed July 2, 2016).
Harris, J. K., Caporaso, J. G., Walker, J. J., Spear, J. R., Gold, N. J., Robertson, C.E., et al. (2013). Phylogenetic stratigraphy in the Guerrero Negro hypersalinemicrobial mat. ISME J. 7, 50–60. doi: 10.1038/ismej.2012.79
Iespa, A. A. C., and Silva, L. H. (2005). Laminitos microbianos e cianobactérias nalagoa Pernambuco, Neogeno do Rio de Janeiro, Brasil. Geociências 10, 5–10.
Kjerfve, B., Schettini, C. A. F., Knoppers, B., Lessa, G., and Ferreira,H. O. (1996). Hydrology and salt balance in a large, hypersaline coastallagoon: Lagoa de Araruama, Brazil. Estuar. Coast. Shelf Sci. 42, 701–725.doi: 10.1006/ecss.1996.0045
Komárek, J. (2016). A polyphasic approach for the taxonomy ofcyanobacteria: principles and applications. Eur. J. Phycol. 51, 346–353.doi: 10.1080/09670262.2016.1163738
Komárek, J., and Anagnostidis, K. (1998). “Cyanoprokaryota 1. Teil:chroococcales,” in Süsswasserflora von Mitteleuropa 19/1, eds H. Ettl,G. Gärtner, H. Heynig, and D. Mollenhauer (Jena: Gustav Fischer), 1–548.
Komárek, J., and Anagnostidis, K. (2005). “Cyanoprokaryota 2. Teil:oscillatoriales,” in Süsswasserflora von Mitteleuropa 19/2, eds B. Büdel,L. Krienitz, G. Gärtner, and M. Schagerl (Heidelberg: Elsevier/Spektrum),1–759.
Komárek, J., Kaštovský, J., Mareš, J., and Johansen, J. (2014). Taxonomicclassification of cyanoprokaryotes (cyanobacterial genera) 2014, using apolyphasic approach. Preslia 86, 295–335.
Lagier, J.-C., Hugon, P., Khelaifia, S., Fournier, P.-E., La Scola, B., and Raoult,D. (2015). The rebirth of culture in microbiology through the example ofculturomics to study Human gut microbiota. Clin. Microbiol. Rev. 28, 237–264.doi: 10.1128/CMR.00014-14
Leão, P. N., Ramos, V., Vale, M., Machado, J. P., and Vasconcelos, V. M.(2012). Microbial community changes elicited by exposure to cyanobacterialallelochemicals.Microb. Ecol. 63, 85–95. doi: 10.1007/s00248-011-9939-z
Ley, R. E., Harris, J. K., Wilcox, J., Spear, J. R., Miller, S. R., Bebout, B.M., et al. (2006). Unexpected diversity and complexity of the GuerreroNegro hypersaline microbial mat. Appl. Environ. Microbiol. 72, 3685–3695.doi: 10.1128/AEM.72.5.3685-3695.2006
McDonald, D., Price, M. N., Goodrich, J., Nawrocki, E. P., DeSantis, T. Z., Probst,A., et al. (2012). An improved Greengenes taxonomy with explicit ranksfor ecological and evolutionary analyses of bacteria and archaea. ISME J. 6,610–618. doi: 10.1038/ismej.2011.139
Mizrahi-Man, O., Davenport, E. R., and Gilad, Y. (2013). Taxonomic classificationof bacterial 16S rRNA genes using short sequencing reads: evaluation ofeffective study designs. PLoS ONE 8:e53608. doi: 10.1371/journal.pone.0053608
Mobberley, J. M., Ortega, M. C., and Foster, J. S. (2012). Comparativemicrobial diversity analyses of modern marine thrombolitic matsby barcoded pyrosequencing. Environ. Microbiol. 14, 82–100.doi: 10.1111/j.1462-2920.2011.02509.x
Morris, E. K., Caruso, T., Buscot, F., Fischer, M., Hancock, C., Maier, T. S.,et al. (2014). Choosing and using diversity indices: insights for ecologicalapplications from the German Biodiversity Exploratories. Ecol. Evol. 4,3514–3524. doi: 10.1002/ece3.1155
Mühling, M., Woolven-Allen, J., Murrell, J. C., and Joint, I. (2008). Improvedgroup-specific PCR primers for denaturing gradient gel electrophoresis analysisof the genetic diversity of complex microbial communities. ISME J. 2, 379–392.doi: 10.1038/ismej.2007.97
Neilson, J. W., Jordan, F. L., and Maier, R. M. (2013). Analysis of artifacts suggestsDGGE should not be used for quantitative diversity analysis. J. Microbiol.
Methods 92, 256–263. doi: 10.1016/j.mimet.2012.12.021Nguyen, N.-P., Warnow, T., Pop, M., and White, B. (2016). A perspective on
16S rRNA operational taxonomic unit clustering using sequence similarity.NPJBiofilms Microbiomes 2:16004. doi: 10.1038/npjbiofilms.2016.4
Nübel, U., Garcia-Pichel, F., and Muyzer, G. (1997). PCR primers to amplify 16SrRNA genes from cyanobacteria. Appl. Environ. Microbiol. 63, 3327–3332.
Ondov, B. D., Bergman, N. H., and Phillippy, A. M. (2011). Interactivemetagenomic visualization in a Web browser. BMC Bioinformatics 12:385.doi: 10.1186/1471-2105-12-385
Oren, A. (2012). “Salts and brines,” in Ecology of Cyanobacteria II: Their
Diversity in Space and Time, ed A. B. Whitton (Dordrecht: Springer), 401–426.doi: 10.1007/978-94-007-3855-3_15
Pinto, C., Pinho, D., Sousa, S., Pinheiro, M., Egas, C., and Gomes, A. C. (2014).Unravelling the diversity of grapevine microbiome. PLoS ONE 9:e85622.doi: 10.1371/journal.pone.0085622
Quast, C., Pruesse, E., Yilmaz, P., Gerken, J., Schweer, T., Yarza, P., et al. (2013). TheSILVA ribosomal RNA gene database project: improved data processing andweb-based tools. Nucleic Acids Res. 41, D590–D596. doi: 10.1093/nar/gks1219
Ramos, V., Seabra, R., Brito, Â., Santos, A., Santos, C. L., Lopo, M., et al.(2010). Characterization of an intertidal cyanobacterium that constitutes aseparate clade together with thermophilic strains. Eur. J. Phycol. 45, 394–403.doi: 10.1080/09670262.2010.496495
Richert, L., Golubic, S., Le Guédès, R., Hervé, A., and Payri, C. (2006).Cyanobacterial populations that build ‘kopara’ microbial mats in Rangiroa,Tuamotu Archipelago, French Polynesia. Eur. J. Phycol. 41, 259–279.doi: 10.1080/09670260600804868
Rippka, R. (1988). Isolation and purification of cyanobacteria. Methods Enzymol.
167, 3–27. doi: 10.1016/0076-6879(88)67004-2Sánchez, O., Gasol, J. M., Balagué, V., Massana, R., Mas, J., and Pedrós-
Alió, C. (2009). Influence of primer mismatch and microdiversity onDGGE results: a case study with SAR11. Aquat. Microb. Ecol. 54, 211–216.doi: 10.3354/ame01267
Schmidt, T. S., Matias Rodrigues, J. F., and von Mering, C. (2015). Limitsto robustness and reproducibility in the demarcation of operationaltaxonomic units. Environ. Microbiol. 17, 1689–1706. doi: 10.1111/1462-2920.12610
Scholz, M. B., Lo, C. C., and Chain, P. S. (2012). Next generation sequencing andbioinformatic bottlenecks: the current state of metagenomic data analysis.Curr.Opin. Biotechnol. 23, 9–15. doi: 10.1016/j.copbio.2011.11.013
Siegesmund, M. A., Johansen, J. R., Karsten, U., and Friedl, T. (2008).Coleofasciculus gen. nov. (Cyanobacteria): morphological and molecular criteria
for revision of the genus Microcoleus Gomont. J. Phycol. 44, 1572–1585.doi: 10.1111/j.1529-8817.2008.00604.x
Silva, L. H., Alves, S. A., Magina, F. C., Gomes, S. B., Delfino, D., and Lopes, F.A. (2011). Determinação das cianobactérias de subsuperfície de sedimentosmarginais do brejo do pau fincado do complexo lagunar de araruama, RJ, Brasil.Anuário Instit. Geociências 34, 14–23.
Silva, L. H., Damazio, C. M., and Iespa, A. A. C. (2005). Identificação decianobactéricas em sedimentos da lagoa Pitanguinha, Estado do Rio de Janeiro,Brasil. Anuário Instit. Geociências 28, 92–100.
Silva, L. H., Feder, F., Delfino, D. O., and Lopes, F. A. S. (2007a). Análise dacomposição cianobacteriana das esteiras pustulares em salina, Araruama, Riode Janeiro. Anuário Instit. Geociências 31, 169–174.
Silva, L. H., Iespa, A. A. C., and Damazio, C. M. (2006). Trombólitos ecianobactérias da lagoa Pernambuco, Holoceno do Rio de Janeiro, Brasil. Rev.Biol. Ciências Terra 6, 243–250.
Silva, L. H., Santos, R. C., Iespa, A. A. C., Damazio, C. M., Delfino, D. O., andLopes, F. A. S. (2007b). Cianobactérias planctônicas da lagoa Pitanguinha, RJ,Brasil. Rev. Biociências 13, 63–70.
Speksnijder, A. G., Kowalchuk, G. A., De Jong, S., Kline, E., Stephen, J. R.,and Laanbroek, H. J. (2001). Microvariation artifacts introduced by PCR and
Frontiers in Microbiology | www.frontiersin.org 15 June 2017 | Volume 8 | Article 1233

Ramos et al. Cyanobacterial Diversity in Brazilian Hypersaline Mats
cloning of closely related 16S rRNA gene sequences. Appl. Environ. Microbiol.
67, 469–472. doi: 10.1128/AEM.67.1.469-472.2001Stal, L. J. (2012). “Cyanobacterial mats and stromatolites,” in Ecology of
Cyanobacteria II: Their Diversity in Space and Time, ed A. B. Whitton(Dordrecht: Springer), 65–125. doi: 10.1007/978-94-007-3855-3_4
Tamura, K., Stecher, G., Peterson, D., Filipski, A., and Kumar, S. (2013). MEGA6:Molecular Evolutionary Genetics Analysis version 6.0. Mol. Biol. Evol. 30,2725–2729. doi: 10.1093/molbev/mst197
Tuzhikov, A., Panchin, A., and Shestopalov, V. I. (2014). TUIT, a BLAST-based toolfor taxonomic classification of nucleotide sequences. Biotechniques 56, 78–84.doi: 10.2144/000114135
von Wintzingerode, F., Gobel, U. B., and Stackebrandt, E. (1997).Determination of microbial diversity in environmental samples: pitfallsof PCR-based rRNA analysis. FEMS Microbiol. Rev. 21, 213–229.doi: 10.1111/j.1574-6976.1997.tb00351.x
Wang, Q., Garrity, G. M., Tiedje, J. M., and Cole, J. R. (2007). NaiveBayesian classifier for rapid assignment of rRNA sequences into thenew bacterial taxonomy. Appl. Environ. Microbiol. 73, 5261–5267.doi: 10.1128/AEM.00062-07
Ward, D.M., Bateson,M.M., Ferris, M. J., Kuhl, M.,Wieland, A., Koeppel, A., et al.(2006). Cyanobacterial ecotypes in themicrobial mat community ofMushroomSpring (Yellowstone National Park, Wyoming) as species-like units linkingmicrobial community composition, structure and function. Philos. Trans. R.Soc. Lond. B Biol. Sci. 361, 1997–2008. doi: 10.1098/rstb.2006.1919
Waterbury, J. B. (2006). “The cyanobacteria—isolation, purification andidentification,” in The Prokaryotes: Volume 4: Bacteria: Firmicutes,
Cyanobacteria, eds M. Dworkin, S. Falkow, E. Rosenberg, K.-H.Schleifer, and E. Stackebrandt (New York, NY: Springer), 1053–1073.doi: 10.1007/0-387-30744-3_38
Wilmotte, A., and Herdman, M. (2001). “Phylogenetic relationships amongthe cyanobacteria based on 16S rRNA sequences,” in Bergey’s Manual of
Systematic Bacteriology: Volume One: The Archaea and the Deeply Branching
and Phototrophic Bacteria, eds D. R. Boone, R. W. Castenholz, and G. M.Garrity (New York, NY: Springer), 487–493.
Wright, E. S., Yilmaz, L. S., and Noguera, D. R. (2012). DECIPHER, a search-basedapproach to chimera identification for 16S rRNA sequences. Appl. Environ.Microbiol. 78, 717–725. doi: 10.1128/AEM.06516-11
Yopp, J. H., Tindall, D. R., Miller, D. M., and Schmid, W. E. (1978). Isolation,purification and evidence for a halophilic nature of the blue-green algaAphanothece halophytica Fremy (Chroococcales). Phycologia 17, 172–178.doi: 10.2216/i0031-8884-17-2-172.1
Youngblut, N. D., Shade, A., Read, J. S., McMahon, K. D., and Whitaker,R. J. (2013). Lineage-specific responses of microbial communities toenvironmental change. Appl. Environ. Microbiol. 79, 39–47. doi: 10.1128/AEM.02226-12
Conflict of Interest Statement: The authors declare that the research wasconducted in the absence of any commercial or financial relationships that couldbe construed as a potential conflict of interest.
Copyright © 2017 Ramos, Castelo-Branco, Leão, Martins, Carvalhal-Gomes,
Sobrinho da Silva, Mendonça Filho and Vasconcelos. This is an open-access
article distributed under the terms of the Creative Commons Attribution License
(CC BY). The use, distribution or reproduction in other forums is permitted,
provided the original author(s) or licensor are credited and that the original
publication in this journal is cited, in accordance with accepted academic practice.
No use, distribution or reproduction is permitted which does not comply with these
terms.
Frontiers in Microbiology | www.frontiersin.org 16 June 2017 | Volume 8 | Article 1233


