CY15 Annual Report Nestle India - Motilal · PDF file · 2016-04-13Key takeaways...
14
12 April 2016 CY15 Annual Report Update | Sector: Consumer Nestle India BSE SENSEX S&P CNX CMP: INR6,136 TP: INR5,850 (-5%) Neutral 25,146 7,709 Stock Info Bloomberg NEST IN Equity Shares (m) 96.4 52-Week Range (INR) 7,327/4,990 1, 6, 12 Rel. Per (%) 17/5/-1 M.Cap. (INR b)/(USD b) 591.6/8.9 Avg Val ( INR m) 448 Free float (%) 37.2 Financials Snapshot (INR b) Y/E Dec 2015 2016E 2017E Net Sales 81.2 94.9 110.1 EBITDA 15.9 17.6 21.0 PAT 11.6 10.3 12.2 EPS (INR) 119.9 107.1 126.8 Gr. (%) -7.3 -10.7 18.4 BV/Sh (INR) 292.3 324.8 364.4 RoE (%) 40.9 34.7 36.8 RoCE (%) 43.8 46.1 49.4 P/E (x) 51.2 57.3 48.4 P/BV (x) 21.0 18.9 16.8 Stock Performance (1-year) Volume decline presents near term challenges Key takeaways from Nestle’s (NEST) CY15 annual report are as follows: Volumes decline in non-Maggi portfolio disconcerting. Blended realization growth high given benign RM costs A&P increase likely to sustain Medium term challenges remain, new strategy will take time to pay off but growth opportunity is significant. Valuations fair. Volumes decline in non-Maggi portfolio disconcerting: Nestle India does not disclose segmental details in quarterly results and these disclosures shared in the annual report feature disappointments particularly on volumes. While prepared dishes and Cooking aids (primarily Maggi noodles) sales declined by 55.6% YoY in CY15 to INR13.1b (15.6% of sales in CY15) due to the Maggi issue, the largest segment, milk and nutrition (55.4% of sales in CY15) grew by only 2.1% YoY in value terms, the lowest level of growth since the turn of the millennium. Even this growth in the segment was mainly led by realization growth of 4.9% with volumes declining 2.7% YoY, the fourth consecutive year of volume decline in what is Nestle India’s largest segment. The other two non- Maggi segments, Chocolate and Confectionary as well as beverages also reported disappointing numbers in CY15 with volumes for both segments actually declining in double digits by 19.5% and 10.3% respectively. Volumes for both these segments show a worsening trend in recent years. Blended realization growth high given benign RM costs: Realization growth in both beverages and Chocolates and confectionary was surprisingly in double digits at 11.2% and 10.1% respectively. In fact Nestle India’s weighted average realization growth of 7.3% YoY in CY15 was highly surprising in a benign material cost environment. Even in Prepared dishes and cooking aids despite the Maggi crisis, realization growth was 9.5% (volumes declined by nearly 60% YoY), the second highest in any year since CY06. Overt emphasis on price led growth as well as inordinately high focus on profitability, in our view, has led to slowdown in overall volume growth for Nestle. Blended volumes declined by 36.3% in CY16, the fourth consecutive year of below 2% growth for the company. Even the Non-Maggi portfolio volumes declined by 7% YoY in CY15. Just to give an idea of how much Nestle has slipped on the volume front can be gauged by the fact that Non Maggi volumes in Metric tonnes was the lowest in the past 7 years, only marginally higher than the tonnage sold in CY08. 4,400 5,400 6,400 7,400 8,400 Apr-15 Jul-15 Oct-15 Jan-16 Apr-16 Nestle India Sensex - Rebased Krishnan Sambamoorthy ([email protected]) / Gautam Duggad ([email protected]) Vishal Punmiya ([email protected]) Investors are advised to refer through important disclosures made at the last page of the Research Report. Motilal Oswal research is available on www.motilaloswal.com/Institutional-Equities, Bloomberg, Thomson Reuters, Factset and S&P Capital.
Transcript of CY15 Annual Report Nestle India - Motilal · PDF file · 2016-04-13Key takeaways...

12 April 2016
CY15 Annual Report Update | Sector: Consumer
Nestle India
BSE SENSEX S&P CNX CMP: INR6,136 TP: INR5,850 (-5%) Neutral 25,146 7,709
Stock Info Bloomberg NEST IN Equity Shares (m) 96.4 52-Week Range (INR) 7,327/4,990 1, 6, 12 Rel. Per (%) 17/5/-1 M.Cap. (INR b)/(USD b) 591.6/8.9 Avg Val ( INR m) 448 Free float (%) 37.2 Financials Snapshot (INR b) Y/E Dec 2015 2016E 2017E Net Sales 81.2 94.9 110.1 EBITDA 15.9 17.6 21.0 PAT 11.6 10.3 12.2 EPS (INR) 119.9 107.1 126.8 Gr. (%) -7.3 -10.7 18.4 BV/Sh (INR) 292.3 324.8 364.4 RoE (%) 40.9 34.7 36.8 RoCE (%) 43.8 46.1 49.4 P/E (x) 51.2 57.3 48.4 P/BV (x) 21.0 18.9 16.8 Stock Performance (1-year)
Volume decline presents near term challenges
Key takeaways from Nestle’s (NEST) CY15 annual report are as follows: Volumes decline in non-Maggi portfolio disconcerting. Blended realization growth high given benign RM costs A&P increase likely to sustain Medium term challenges remain, new strategy will take time to pay off but growth
opportunity is significant. Valuations fair. Volumes decline in non-Maggi portfolio disconcerting: Nestle India does not
disclose segmental details in quarterly results and these disclosures shared in the annual report feature disappointments particularly on volumes. While prepared dishes and Cooking aids (primarily Maggi noodles) sales declined by 55.6% YoY in CY15 to INR13.1b (15.6% of sales in CY15) due to the Maggi issue, the largest segment, milk and nutrition (55.4% of sales in CY15) grew by only 2.1% YoY in value terms, the lowest level of growth since the turn of the millennium. Even this growth in the segment was mainly led by realization growth of 4.9% with volumes declining 2.7% YoY, the fourth consecutive year of volume decline in what is Nestle India’s largest segment. The other two non-Maggi segments, Chocolate and Confectionary as well as beverages also reported disappointing numbers in CY15 with volumes for both segments actually declining in double digits by 19.5% and 10.3% respectively. Volumes for both these segments show a worsening trend in recent years.
Blended realization growth high given benign RM costs: Realization growth in both beverages and Chocolates and confectionary was surprisingly in double digits at 11.2% and 10.1% respectively. In fact Nestle India’s weighted average realization growth of 7.3% YoY in CY15 was highly surprising in a benign material cost environment. Even in Prepared dishes and cooking aids despite the Maggi crisis, realization growth was 9.5% (volumes declined by nearly 60% YoY), the second highest in any year since CY06. Overt emphasis on price led growth as well as inordinately high focus on profitability, in our view, has led to slowdown in overall volume growth for Nestle. Blended volumes declined by 36.3% in CY16, the fourth consecutive year of below 2% growth for the company. Even the Non-Maggi portfolio volumes declined by 7% YoY in CY15. Just to give an idea of how much Nestle has slipped on the volume front can be gauged by the fact that Non Maggi volumes in Metric tonnes was the lowest in the past 7 years, only marginally higher than the tonnage sold in CY08.
4,400
5,400
6,400
7,400
8,400
Apr-
15
Jul-1
5
Oct
-15
Jan-
16
Apr-
16
Nestle IndiaSensex - Rebased
Krishnan Sambamoorthy ([email protected]) / Gautam Duggad ([email protected]) Vishal Punmiya ([email protected]) Investors are advised to refer through important disclosures made at the last page of the Research Report. Motilal Oswal research is available on www.motilaloswal.com/Institutional-Equities, Bloomberg, Thomson Reuters, Factset and S&P Capital.

Nestle India
12 April 2016 2
A&P increase likely to sustain: Advertisement and Sales promotion costs were up by 17.9% YoY to INR 5,252 mn. The 17.9% A&P growth in CY15 was the highest in the past six years and A&P to sales at 6.4% in CY15 (compared to the past 5 year range of 4.3% to 4.8% of sales and also aided by decline in absolute sales for the year), while much lower than consumer peers, was still the highest for Nestle India as a percentage of sales since CY02. The absolute increase is encouraging and in our view much required as well. A large part of the reason for the increase in absolute amount of A&P is likely to have been due to both advertising and promotion on the Maggi re-launch but we think that higher A&P to sales compared to the historical average is likely to be a feature going forward given the new CEO’s commitment towards product launches.
Valuation and View: We are highly encouraged by new CEO’s statements in the past few months regarding (1) Nestle India gradually getting back to double-digit sales growth, mainly led by volumes, (2) Willingness to go for price cuts wherever it is appropriate, and (3) Likely higher spending on advertising and promotion (A&P) expenses, already a feature in CY15. Acknowledging what went wrong in Nestle’s strategy and taking the right steps will help make the company a much bigger business over the long term. However it needs to be noted that: (a) Volume and sales growth rates even in non-noodle segments declined by 7% in CY15 and blended average realizations across all segments grew by a disconcertingly high 7% despite benign raw material costs and all time high gross margins which indicate significant non Maggi issues as well on the sales front (b) with gradual ramp up in distribution of Maggi, increased intensity of competition in the segment and loss of market share in the category compared to earlier levels, we expect Prepared Dishes and Cooking aid revenues of CY14 to be matched only in CY17E and (c) Positive earnings impact of strategic initiatives stated above will take time. In fact, with possibly lower price hikes going forward, gradual pace of economic recovery and medium-term high spending on advertisements and innovation/ renovation, EPS growth is likely to be muted for the next 2 years. However the long term opportunity in the packaged food space in India is immense and Nestle has the distribution, the brands, parent support in terms of R&D as well as buy in towards the revised strategy, balance sheet strength and now the right strategy to take advantage of the opportunity despite medium term challenges. Valuations are fair at 48.4x at CY17 EPS. Maintain Neutral.

Nestle India
12 April 2016 3
Domestic Sales decline due to Maggi issue; Exports flattish Net sales stood at INR81.2b in CY15 compared to INR98.1b (decline by 17.2%
YoY). Sales of INR3.03b were reversed in CY15 in relation to Maggi noodles stockwithdrawn from trade partners and market.
Exports declined marginally by 1.3% YoY to INR6.36b in CY15. This was the firstyear of absolute decline in exports since CY09. CY14 had witnessed tepid 2.9%increase in exports. Export proportion of gross sales however increased withdomestic sales declining by 17.8% YoY (mainly due to Maggi issue) in CY15 toINR77.9b. Exports were 7.5% of sales in CY15, the highest level since CY08.Exports are carried out to 35 markets with the top 5 being Turkey, Bangladesh,Nepal, Bhutan and Taiwan. Lower coffee as well as Maggi noodles exports werepartly offset by higher exports in infant nutrition sales.
Excise duty to gross sales was 3.6% of sales in CY15 inching up marginally from3.2% of sales in CY14. Excise to sales has been increasing gradually from 1.8% ofsales in CY09.
Exhibit 1: Excise duty as a % of gross sales inched up marginally to 3.6%
Source: Company, MOSL
Exhibit 2: Overall volumes declined; mainly due to Maggi issue…
Source: Company, MOSL
Exhibit 3: ...leading to gross sales decline of 16.8% YoY
Source: Company, MOSL
19.2 20.5 22.8 23.7 26.4 29.4 36.5 44.7 52.2 63.8 76.7 85.8 93.8 101.3 84.3
5.2 5.4 6.1 6.1 6.3
4.4 3.9 3.3
1.8 1.9 2.4
3.3 3.4 3.2 3.6
CY01
CY02
CY03
CY04
CY05
CY06
CY07
CY08
CY09
CY10
CY11
CY12
CY13
CY14
CY15
Gross Sales (INR b) Excise duty
16.0 12.2 10.2 5.1 4.9 8.3
13.8 16.9 14.9 17.0
6.8 0.8 1.9
(0.6)
(36.3)
CY01
CY02
CY03
CY04
CY05
CY06
CY07
CY08
CY09
CY10
CY11
CY12
CY13
CY14
CY15
Volume Growth (%)
14.5 6.6
11.4 4.1
11.4 11.4
23.9 22.6 16.8
22.1 20.3 11.8 9.3 8.0
(16.8)
CY01
CY02
CY03
CY04
CY05
CY06
CY07
CY08
CY09
CY10
CY11
CY12
CY13
CY14
CY15
Price Growth (%) Sales Growth (%)
Nestle India
12 April 2016 4
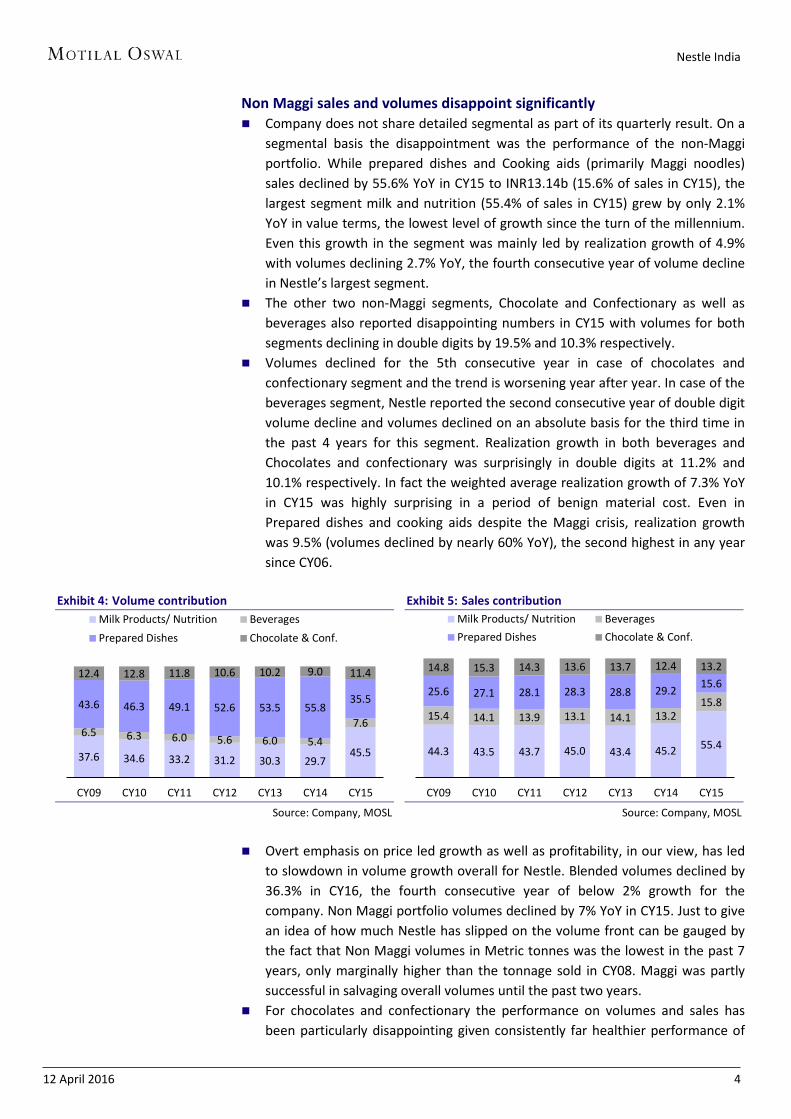
Non Maggi sales and volumes disappoint significantly Company does not share detailed segmental as part of its quarterly result. On a
segmental basis the disappointment was the performance of the non-Maggiportfolio. While prepared dishes and Cooking aids (primarily Maggi noodles)sales declined by 55.6% YoY in CY15 to INR13.14b (15.6% of sales in CY15), thelargest segment milk and nutrition (55.4% of sales in CY15) grew by only 2.1%YoY in value terms, the lowest level of growth since the turn of the millennium.Even this growth in the segment was mainly led by realization growth of 4.9%with volumes declining 2.7% YoY, the fourth consecutive year of volume declinein Nestle’s largest segment.
The other two non-Maggi segments, Chocolate and Confectionary as well asbeverages also reported disappointing numbers in CY15 with volumes for bothsegments declining in double digits by 19.5% and 10.3% respectively.
Volumes declined for the 5th consecutive year in case of chocolates andconfectionary segment and the trend is worsening year after year. In case of thebeverages segment, Nestle reported the second consecutive year of double digitvolume decline and volumes declined on an absolute basis for the third time inthe past 4 years for this segment. Realization growth in both beverages andChocolates and confectionary was surprisingly in double digits at 11.2% and10.1% respectively. In fact the weighted average realization growth of 7.3% YoYin CY15 was highly surprising in a period of benign material cost. Even inPrepared dishes and cooking aids despite the Maggi crisis, realization growthwas 9.5% (volumes declined by nearly 60% YoY), the second highest in any yearsince CY06.
Exhibit 4: Volume contribution
Source: Company, MOSL
Exhibit 5: Sales contribution
Source: Company, MOSL
Overt emphasis on price led growth as well as profitability, in our view, has ledto slowdown in volume growth overall for Nestle. Blended volumes declined by36.3% in CY16, the fourth consecutive year of below 2% growth for thecompany. Non Maggi portfolio volumes declined by 7% YoY in CY15. Just to givean idea of how much Nestle has slipped on the volume front can be gauged bythe fact that Non Maggi volumes in Metric tonnes was the lowest in the past 7years, only marginally higher than the tonnage sold in CY08. Maggi was partlysuccessful in salvaging overall volumes until the past two years.
For chocolates and confectionary the performance on volumes and sales hasbeen particularly disappointing given consistently far healthier performance of
37.6 34.6 33.2 31.2 30.3 29.7 45.5
6.5 6.3 6.0 5.6 6.0 5.4 7.6
43.6 46.3 49.1 52.6 53.5 55.8 35.5
12.4 12.8 11.8 10.6 10.2 9.0 11.4
CY09 CY10 CY11 CY12 CY13 CY14 CY15
Milk Products/ Nutrition BeveragesPrepared Dishes Chocolate & Conf.
44.3 43.5 43.7 45.0 43.4 45.2 55.4
15.4 14.1 13.9 13.1 14.1 13.2 15.8
25.6 27.1 28.1 28.3 28.8 29.2 15.6 14.8 15.3 14.3 13.6 13.7 12.4 13.2
CY09 CY10 CY11 CY12 CY13 CY14 CY15
Milk Products/ Nutrition BeveragesPrepared Dishes Chocolate & Conf.

Nestle India
12 April 2016 5
both Mondelez (erstwhile Cadbury’s) and Perfetti despite the latter two having much higher revenues in the chocolates and confectionary segments respectively. The category has also witnessed strong growth from Ferrero Rocher India which was a third of Nestle’s revenues in this segment but has now nearly reached Nestle in terms of comparable sales in this segment.
Exhibit 6: Nestle’s segment-wise performance 2005 2006 2007 2008 2009 2010 2011 2012 2013 2014 2015
Volume (in MT) Milk Products 99,371 102,243 107,736 118,651 134,142 144,397 147,984 140,386 138,772 135,591 131,980 Beverages 24,606 22,342 24,107 24,114 23,369 26,458 26,692 25,353 27,717 24,673 22,130 Prepared Dishes & Cooking Aids 65,603 78,706 98,259 127,835 155,555 193,494 219,041 236,554 245,443 254,553 103,138 Chocolate & Confectionery 26,246 30,402 35,752 40,200 44,116 53,483 52,678 47,745 46,718 41,080 33,083 Total 215,826 233,693 265,854 310,800 357,182 417,832 446,395 450,038 458,650 455,897 290,331 Volume Growth Milk Products 2.7% 2.9% 5.4% 10.1% 13.1% 7.6% 2.5% -5.1% -1.1% -2.3% -2.7%Beverages -1.6% -9.2% 7.9% 0.0% -3.1% 13.2% 0.9% -5.0% 9.3% -11.0% -10.3%Prepared Dishes & Cooking Aids 8.5% 20.0% 24.8% 30.1% 21.7% 24.4% 13.2% 8.0% 3.8% 3.7% -59.5%Chocolate & Confectionery 11.3% 15.8% 17.6% 12.4% 9.7% 21.2% -1.5% -9.4% -2.2% -12.1% -19.5%Total 4.9% 8.3% 13.8% 16.9% 14.9% 17.0% 6.8% 0.8% 1.9% -0.6% -36.3%Price (INR ‘000) Milk Products 118 126 146 163 172 192 226 275 293 337 354 Beverages 237 271 299 332 344 340 400 443 478 543 604 Prepared Dishes & Cooking Aids 76 76 79 82 86 89 98 103 110 116 127 Chocolate & Confectionery 147 150 159 169 175 182 209 245 275 305 336
Price Growth Milk Products 6.1% 6.3% 16.3% 11.7% 5.4% 11.6% 17.8% 21.4% 6.7% 15.0% 4.9% Beverages 12.1% 14.4% 10.6% 10.9% 3.6% -1.2% 17.8% 10.6% 7.9% 13.7% 11.2% Prepared Dishes & Cooking Aids 9.9% -0.7% 4.6% 3.5% 4.3% 3.9% 10.3% 4.4% 7.0% 5.8% 9.5% Chocolate & Confectionery -0.3% 2.3% 6.1% 6.3% 3.5% 4.3% 14.4% 17.3% 12.4% 10.8% 10.1% Total 7.2% 5.9% 11.1% 8.8% 4.6% 6.6% 15.2% 14.6% 7.7% 11.6% 7.3% Sales (INR m) Milk Products 11,752 12,857 15,756 19,388 23,113 27,763 33,510 38,594 40,712 45,752 46,694 Beverages 5,822 6,048 7,219 8,009 8,042 8,994 10,684 11,227 13,241 13,398 13,360 Prepared Dishes & Cooking Aids 5,017 5,980 7,811 10,519 13,350 17,250 21,545 24,302 26,982 29,613 13,141 Chocolate & Confectionery 3,845 4,557 5,686 6,795 7,719 9,759 10,997 11,696 12,864 12,532 11,109 Total 26,439 29,442 36,472 44,711 52,224 63,766 76,736 85,819 93,799 101,295 84,304 Sales Growth Milk Products 9.0% 9.4% 22.6% 23.0% 19.2% 20.1% 20.7% 15.2% 5.5% 12.4% 2.1% Beverages 10.4% 3.9% 19.4% 10.9% 0.4% 11.8% 18.8% 5.1% 17.9% 1.2% -0.3%Prepared Dishes & Cooking Aids 19.3% 19.2% 30.6% 34.7% 26.9% 29.2% 24.9% 12.8% 11.0% 9.7% -55.6%Chocolate & Confectionery 11.0% 18.5% 24.8% 19.5% 13.6% 26.4% 12.7% 6.4% 10.0% -2.6% -11.4%Total 11.4% 11.4% 23.9% 22.6% 16.8% 22.1% 20.3% 11.8% 9.3% 8.0% -16.8%
Source: Company, MOSL

Nestle India
12 April 2016 6
Exhibit 7: Financial Overview of Nestle India CY10 % CY11 % CY12 % CY13 % CY14 % CY15 %
Total Revenues 62,547 100.0 74,908 100.0 83,023 100.0 90,619 100.0 98,063 100.0 81,233 100.0 Raw Material Consumed
Milk/SMP 10,830 17.3 9,044 12.0 9,215 11.1 8,281 9.1 11,202 11.4 9,309 11.4 Raw coffee/Green Coffee 2,277 3.6 3,091 4.1 3,257 3.9 3,714 4.1 3,783 3.8 3,718 4.5 Sugar 2,062 3.3 1,863 2.5 2,067 2.5 1,961 2.2 1,778 1.8 1,387 1.7
Wheat flour 2,613 4.2 3,106 4.1 3,698 4.4 4,306 4.7 4,468 4.5 1,914 2.3 Vegetable Oils 2,003 3.2 3,235 4.3 3,261 3.9 3,373 3.7 3,509 3.6 1,997 2.4 Packaging Material 4,827 7.7 5,907 7.9 6,300 7.6 7,034 7.7 7,582 7.7 5,483 6.7 Others 5,942 9.5 9,705 12.9 9,964 12.0 12,556 13.8 12,918 13.1 10,882 13.3
Gross Profit 31,992 51.0 38,957 51.8 45,259 54.3 49,396 54.3 52,823 53.6 46,544 56.9 Employee Benefit Expense 4,585 7.3 5,717 7.6 6,877 8.3 7,672 8.4 8,706 8.8 9,516 11.6 Other Expenses Power and Fuel 2,192 3.5 2,958 3.9 3,709 4.5 3,854 4.2 3,843 3.9 2,220 2.7 Repairs 712 1.1 754 1.0 930 1.1 962 1.1 1,031 1.0 1,056 1.3 Advertising and Sales Promotion 3,026 4.8 3,226 4.3 3,559 4.3 3,955 4.3 4,455 4.5 5,252 6.4 Freight and Transport 2,996 4.8 3,525 4.7 3,842 4.6 4,374 4.8 4,795 4.9 3,889 4.8 Royalty 2,491 4.0 2,832 3.8 3,173 3.8 3,396 3.7 3,863 3.9 3,342 4.1 Others 3,493 5.6 4,416 5.9 4,912 5.9 5,379 5.9 5,603 5.7 5,323 6.5 EBITDA 12,497 19.9 15,528 20.7 18,257 21.9 19,804 21.8 20,527 20.8 15,946 19.5 Less: Interest Expense 11 51 266 365 142 33 Less: Depreciation 1,278 1,533 2,772 3,300 3,375 3,473 Add: Other Income 427 509 633 1,222 1,359 1,621 Profit before Tax (PBT) 11,635 18.5 14,452 19.2 15,852 19.0 17,362 19.1 18,368 18.6 14,062 17.2 Tax 3,264 4,264 4,847 5,609 5,897 2,504 Profit after Tax (PAT) 8,370 13.3 10,189 13.6 11,006 13.2 11,753 12.9 12,472 12.7 11,558 14.1
Source: Company, MOSL
Exhibit 8: Milk and Nutrition
Source: Company, MOSL
Exhibit 9: Beverages
Source: Company, MOSL
9.4
22.6 23.0 19.2 20.1 20.7
15.2
5.5
12.4
2.1 2.9 5.4 10.1 13.1
7.6 2.5
(5.1) (1.1) (2.3) (2.7)
CY06 CY07 CY08 CY09 CY10 CY11 CY12 CY13 CY14 CY15
Volume Growth (%) Price Growth (%)
3.9
19.4
10.9
0.4
11.8
18.8
5.1
17.9
1.2 (0.3)
(9.2)
7.9 0.0 (3.1)
13.2
0.9 (5.0)
9.3
(11.0) (10.3)
CY06 CY07 CY08 CY09 CY10 CY11 CY12 CY13 CY14 CY15
Volume Growth (%) Price Growth (%)

Nestle India
12 April 2016 7
Exhibit 10: Prepared Dishes slowing down
Source: Company, MOSL
Exhibit 11: Chocolates & Confectionaries
Source: Company, MOSL
Brand extensions/ product launches Chocolates and confectionary- ‘Munch Nuts’ a new extension of ‘Munch’, the
chocolate wafer brand, was launched towards the end of the year. The producthas crunchy wafer, roasted peanuts and peanut crème.
Beverages- Revamped packaging of ‘Nescafe Sunrise’ and strengthened its corecoffee credentials with ‘slow roasted for richer aroma’ credentials
Milk and Nutrition- Launched ‘Cerelac Stage 5’ to address the 18-24 monthchildren age group with features including 5 grains and fruits.
Gross and operating margins Net sales stood at INR 81.8 b in CY15 compared to INR 98.6bn in the previous
year declining by ~17% YoY. Material costs on the other hand declined evenmore steeply by 23.3% YoY leading to gross margins at the highest level sinceCY2000 and perhaps even the highest ever. Decline in material costs waswitnessed in raw materials (down 24.5% YoY) and well as packing materials(down 27.7% YoY).
Exhibit 12: Material costs were benign
Source: Company, MOSL
Among the key materials fresh milk costs declined by 17% YoY in line withoverall sales decline. Milk derivatives declined by a relatively lower proportionby 15.8% YoY. These products are mainly used in the milk and nutrition segmentand to a smaller extent in chocolates. Given that milk and nutrition salesincreased by 2.1% in value terms in CY15, the profitability of this segment islikely to have increased as the key material costs indicated above declined
19.2 30.6
34.7
26.9 29.2 24.9 12.8 11.0 9.7
(55.6)
20.0 24.8 30.1 21.7 24.4 13.2 8.0 3.8 3.7
(59.5)
CY06 CY07 CY08 CY09 CY10 CY11 CY12 CY13 CY14 CY15
Volume Growth (%) Price Growth (%) Sales Growth (%)
18.5 24.8
19.5 13.6
26.4
12.7 6.4 10.0
(2.6)
(11.4)
15.8 17.6 12.4 9.7 21.2
(1.5) (9.4)
(2.2) (12.1)
(19.5)
2.3 6.1
6.3 3.5
4.3
14.4 17.3 12.4 10.8 10.1
CY06 CY07 CY08 CY09 CY10 CY11 CY12 CY13 CY14 CY15
Volume Growth (%) Price Growth (%) Sales Growth (%)
34.9 37.6 36.2 38.5 40.0 40.6 40.3 41.1 40.0 37.8 37.7 38.4 35.9
9.9 8.8 8.8 8.5 7.9 8.2 7.5 7.7 7.9 7.6 7.8 7.7 6.8
CY03 CY04 CY05 CY06 CY07 CY08 CY09 CY10 CY11 CY12 CY13 CY14 CY15
RMC Packing Material Consumption

Nestle India
12 April 2016 8
between 15.8%-17%. Green coffee material costs declined by 1.7% YoY compared to beverages segmental sales decline of 0.3%. Vegetable oil and wheat flour costs declined by 43.1% YoY and 57.2% YoY respectively, being used largely in Prepared Dishes and Cooking aids, a segment for which sales declined by 55.6% in CY15 due to the Maggi issue. Sugar costs declined by 22% YoY in CY15. Sugar is mostly used in chocolates and confectionary segment where sales declined by 11.4% YoY in CY15.
Staff costs (including employee benefit expense due to passage of time)increased by 9.3% YoY to INR9.5b (up 270bp to 11.3% of sales) in CY15 mainlydue to 17% Net sales decline YoY.
Advertisement and Sales promotion costs were up by 17.9% YoY to INR5.3b. The17.9% A&P growth in CY15 was the highest in the past 6 years and A&P to salesat 6.7% in CY15 (compared to the past 5 year range of 4.4% to 5% of sales andalso aided by decline in absolute sales for the year), while much lower thanconsumer peers, was still the highest by Nestle India as a percentage of salessince CY02. The absolute increase is encouraging and in our view much requiredas well. A large part of the reason for the increase in absolute amount of A&P islikely to have been due to both advertising and promotion on the Maggi re-launch but we think that higher A&P to sales compared to the historical averageis likely to be a feature going forward given the new CEO’s commitment towardsproduct launches.
As was indicated by the company earlier Royalty or general license fees(including withholding tax on general license fees) increased by 20 bps to salesin CY15 as well, a process that is likely to continue every year until CY18. ForCY15, royalty increased to 4% of sales but reduced by 13.5% in absolute termsdue to sales decline of 17%.
The company did well to control other expenses (excluding A&P and royalty). Inabsolute amount these costs declined by 18.4% YoY which is creditable in a yearwhere sales declined. Key costs where there were substantial savings both onabsolute basis as well as on a percentage to sales were power and fuel, contractmanufacturing charges.
EBITDA margin was down 130 bp YoY to 19.6% in CY15 with absolute EBITDA atINR 15.9b declining by 22.3%. Absolute EBITDA was at the lowest level sinceCY11.
Due to 15.1% in decline in raw/ packing material imported compared to only1.4% decline in exports net forex expenses to sale declined from 4.2% of sales inCY14 to 3.5% in CY15. Indigenous RM and spare parts to total RM and spareparts remained high at 86-87%.
The exceptional items charge of INR 5bn was due to loss on Maggi noodlesstocks withdrawn and incidental expenses thereto.

Nestle India
12 April 2016 9
Exhibit 13: Gross margin for CY15 were at an all time high
Source: Company, MOSL
Exhibit 14: However sales decline, A&P to sales and staff costs affected EBITDA margins for the year
Source: Company, MOSL
Capex, fixed assets, working capital and cash flows Capex was INR 1.5b in CY15, the lowest in absolute terms for any year since
CY06. Yet fixed asset turns on net block declined from 2.9x in CY14 to 2.6x inCY15 due to the sales decline. Fixed asset turns on gross block declined from1.9x to 1.5x respectively for these years.
While debtor days remained at the historical average of 3-4 days, inventory daysincreased by 8 days YoY to 37 days in CY15. Finished good days increased by 4days YoY, raw material days by 3 days YoY and WIP days by 1 day YoY. Finishedgoods were close to half of total inventory and raw materials around 33%.However Creditor days also increased by 8 days YoY to 33 days which meantthat positive net working capital of ~8 days was maintained. Nestle India’s NWCdays remain inferior to FMCG peers, particularly MNC peers like HUL, Colgateand GSK Consumer.
Other assets were under control increasing by 15.7% YoY. These assets are only3.8% of total assets.
Operating cash flow was INR 11b in CY15, down from INR 16.44 b. Free cashflow was INR 9.5b compared to INR 14.5 b in the preceding two years
Exhibit 15: Cash Conversion Cycle stable Particulars CY09 CY10 CY11 CY12 CY13 CY14 CY15 Inventory 4,987 5,760 7,340 7,456 7,359 8,441 8,208 Account Receivables 642 633 1,154 876 843 991 784 Account Payables 5,817 7,454 4,808 5,394 6,330 7,287 7,435 Days Inventory days 33 31 32 33 30 29 37 Debtor days 4 4 4 4 3 3 4 Creditor days 39 39 30 22 24 25 33 Cash conversion cycle -1 -4 6 15 10 7 8
Source: Company, MOSL
53.0 51.8
51.2 52.1
51.0 51.8
54.3 54.3 53.6
56.9
CY06 CY07 CY08 CY09 CY10 CY11 CY12 CY13 CY14 CY15
Gross Margin (%)
19.5 20.1 20.2 20.5 20.2
21.0
22.3 22.2
21.3
20.1
CY06 CY07 CY08 CY09 CY10 CY11 CY12 CY13 CY14 CY15
EBITDA Margin (%)

Nestle India
12 April 2016 10
Exhibit 16: Capex spends likely to increase in next two years
Source: Company, MOSL
Exhibit 17: Asset turnover declined YoY
Source: Company, MOSL
Exhibit 18: FCF to sales up YoY
Source: Company, MOSL
Exhibit 19: Payout ratio
Source: Company, MOSL
Encouraging comments by the management statements over the past few months Anywhere between 20-25 projects are on in the company, looking at new
products, restaging, re-launching and getting into new categories. Theseproducts are likely to be launched in the next 12-18 months in a phased manner.So, there is a level of energy and enthusiasm getting built up in the organization.All of it of course started with the comeback of Maggi.
There will be 30% to 40% higher investments in sharper channel strategies,geography strategies and therefore greater activation and investment.
Nestle India is targeting to gradually get back to double-digit sales growth,mainly led by volume growth. There is unprecedented willingness to go for pricecuts wherever it is appropriate.
Likely higher spending on advertising and promotion (A&P) as well as oninnovation/renovation.
Desire to become more proactive in dealing with stakeholders, a process off to agood start in recent months.
Reiteration of the belief in India opportunity, Parent company as well as Nestle India board’s support to strategies which pave
the way to double-digit sales growth led by volumes. The management has stated earlier and in the annual report that there has been
hardly any attrition at the channel partner level or employee level due to therecent crisis and there seems to have been a considerable buy in towards therecent change in strategy, all of which is encouraging.
2.5%
2.1%
1.7%
3.1%
4.0%
4.4%
4.5%
6.0%
4.0%
7.7%
23.0
%
10.2
%
4.7%
0.6%
1.2%
CY01
CY02
CY03
CY04
CY05
CY06
CY07
CY08
CY09
CY10
CY11
CY12
CY13
CY14
CY15
Capex/Sales
4.3
4.9
5.3
5.2
5.0
4.9
5.2
5.0
5.3
4.6
2.5
2.3
2.5
2.9
2.6
CY01
CY02
CY03
CY04
CY05
CY06
CY07
CY08
CY09
CY10
CY11
CY12
CY13
CY14
CY15
Sales/Net Fixed Assets (including CWIP)
11.7
%
14.3
%
14.7
%
13.9
%
12.2
%
18.5
%
11.2
%
10.9
%
14.2
%
10.4
%
-4.7
%
8.8%
14.6
%
15.8
%
20.0
%
CY01
CY02
CY03
CY04
CY05
CY06
CY07
CY08
CY09
CY10
CY11
CY12
CY13
CY14
CY15
FCF/Sales
46
42
40
49
40
2011 2012 2013 2014 2015
Payout (%)

Nestle India
12 April 2016 11
Financials and valuations
Income Statement 20.9% (INR Million) Y/E December 2011 2012 2013 2014 2015 2016E 2017E Net Sales 74,908 83,023 90,619 98,063 81,233 94,929 110,074 Change (%) 19.8 10.8 9.1 8.2 -17.2 16.9 16.0
Total Expenditure 59,381 64,766 70,815 77,536 65,287 77,341 89,077 EBITDA 15,528 18,257 19,804 20,527 15,946 17,588 20,997 Change (%) 24.3 17.6 8.5 3.7 -22.3 10.3 19.4 Margin (%) 20.7 22.0 21.9 20.9 19.6 18.5 19.1 Depreciation 1,533 2,772 3,300 3,375 3,473 3,813 4,517 Int. and Fin. Ch. 51 266 365 142 33 18 17 Other Inc.- Rec. 509 633 1,222 1,359 1,621 1,769 1,917 PBT 14,452 15,852 17,362 18,368 14,062 15,526 18,381 Change (%) 24.2 9.7 9.5 5.8 -23.4 10.4 18.4 Margin (%) 19.3 19.1 19.2 18.7 17.3 16.4 16.7 Tax 4,264 4,847 5,609 5,897 2,504 5,201 6,158 Tax Rate (%) 29.5 30.6 32.3 32.1 17.8 33.5 33.5 Adjusted PAT 10,189 11,006 11,753 12,472 11,558 10,325 12,223 Change (%) 21.7 8.0 6.8 6.1 -7.3 -10.7 18.4 Margin (%) 13.6 13.3 13.0 12.7 14.2 10.9 11.1 Non-rec. (Exp)/Inc. 573 327 582 625 5,925 1,008 1,109 Reported PAT 9,616 10,679 11,171 11,847 5,633 9,316 11,114
Balance Sheet (INR Million) Y/E December 2011 2012 2013 2014 2015 2016E 2017E Share Capital 964 964 964 964 964 964 964 Reserves 11,775 17,020 22,723 27,408 27,214 30,353 34,165 Net Worth 12,740 17,984 23,687 28,372 28,178 31,317 35,130 Loans 9,709 10,502 11,872 196 177 150 150 Capital Employed 22,448 28,486 35,559 28,568 28,356 31,467 35,280
Gross Block 25,522 44,276 49,032 50,090 51,174 57,781 67,692 Less: Accum. Depn. 9,765 12,233 15,339 18,323 22,195 26,009 30,526 Net Fixed Assets 15,758 32,043 33,693 31,766 28,979 31,772 37,166 Capital WIP 13,718 3,441 2,947 2,448 2,308 2,308 2,308 Investments 1,344 3,649 8,511 8,118 13,249 13,249 13,249 Current 1,344 3,649 6,270 5,074 9,831 9,831 9,831 Non-current 0 0 2,241 3,045 3,418 3,418 3,418 Curr. Assets, L&A 13,199 12,507 17,992 15,863 16,269 20,089 25,235 Inventory 7,340 7,456 7,359 8,441 8,208 10,392 12,090 Account Receivables 1,154 876 843 991 784 1,352 1,567 Cash and Bank Balance 2,272 2,370 7,494 4,458 4,996 6,196 9,306 Others 2,432 1,806 2,296 1,972 2,281 2,150 2,272 Curr. Liab. and Prov. 21,067 21,532 25,429 27,400 30,720 34,067 40,609 Account Payables 4,808 5,394 6,330 7,287 7,435 9,236 11,466 Other Liabilities 5,287 5,580 5,026 4,096 4,659 4,934 5,721 Provisions 10,972 10,558 14,073 16,017 18,625 19,897 23,422 Net Curr. Assets -7,869 -9,025 -7,437 -11,537 -14,451 -13,978 -15,374Def. Tax Liability -502 -1,621 -2,155 -2,227 -1,729 -1,885 -2,070Appl. of Funds 22,448 28,486 35,559 28,568 28,356 31,466 35,280 E: MOSL Estimates

Nestle India
12 April 2016 12
Financials and valuations
Ratios Y/E December 2011 2012 2013 2014 2015 2016E 2017E
Basic (INR)
EPS 105.7 114.1 121.9 129.4 119.9 107.1 126.8 Cash EPS 121.6 142.9 156.1 164.4 155.9 146.6 173.6 BV/Share 132.1 186.5 245.7 294.3 292.3 324.8 364.4 DPS 48.5 48.5 48.5 63.0 48.5 55.0 65.0 Payout (%) 45.9 42.5 39.8 48.7 40.5 51.4 51.3 Valuation (x)
P/E 58.1 53.8 50.3 47.4 51.2 57.3 48.4 Cash P/E 50.5 42.9 39.3 37.3 39.4 41.8 35.3 EV/Sales 8.0 7.2 6.5 5.9 7.1 6.0 5.2 EV/EBITDA 38.5 32.7 29.7 28.2 36.0 32.5 27.1 P/BV 46.4 32.9 25.0 20.9 21.0 18.9 16.8 Dividend Yield (%) 0.8 0.8 0.8 1.0 0.8 0.9 1.1 Return Ratios (%)
RoE 95.7 71.6 56.4 47.9 40.9 34.7 36.8 RoCE 90.3 60.8 51.5 53.5 43.8 46.1 49.4 Working Capital Ratios
Debtor (Days) 5.5 3.7 3.3 3.6 3.4 5.0 5.0 Asset Turnover (x) 4.7 3.1 2.7 2.9 2.7 3.0 3.1 Leverage Ratio
Debt/Equity (x) 0.8 0.6 0.5 0.0 0.0 0.0 0.0
Cash Flow Statement
(INR Million) Y/E December 2011 2012 2013 2014 2015 2016E 2017E OP/(loss) before Tax 13,994 15,485 16,505 17,152 12,473 13,775 16,480 Int./Div. Received 509 633 1,222 1,359 1,621 1,769 1,917 Depn. and Amort. 1,345 2,468 3,106 2,985 3,872 3,813 4,517 Interest Paid 51 266 365 142 33 18 17 Direct Taxes Paid 4,161 3,728 5,075 5,824 2,899 5,045 5,973 Incr in WC 1,351 1,254 3,536 1,065 3,451 727 4,507 CF from Operations 12,071 15,113 17,214 14,161 15,308 11,519 17,630
Extraordinary Items 0 0 0 0 0 0 0 Incr in FA 17,204 8,476 4,262 559 944 6,607 9,911 Free Cash Flow -5,132 6,636 12,952 13,602 14,364 4,912 7,719 Pur of Investments -163 2,305 4,862 -393 5,131 0 0 CF from Invest. -17,041 -10,781 -9,125 -166 -6,075 -6,607 -9,911
Issue of Shares 0 0 0 0 0 0 0 Incr in Debt 9,709 793 1,370 -11,676 -18 -27 0 Dividend Paid 5,435 5,435 5,471 7,166 5,633 6,178 7,301 Others 415 408 1,136 1,812 -3,045 2,494 2,692 CF from Fin. Activity 4,689 -4,234 -2,965 -17,030 -8,696 -3,711 -4,609
Incr/Decr of Cash -281 98 5,124 -3,035 537 1,201 3,110 Add: Opening Balance 2,553 2,272 2,370 7,494 4,458 4,996 6,196 Closing Balance 2,272 2,370 7,494 4,458 4,995 6,196 9,306 E: MOSL Estimates

NEST
COMPANIES
SECTOR UPDATES
NESTLE GALLERY

Nestle India
12 April 2016 14
Disclosures This document has been prepared by Motilal Oswal Securities Limited (hereinafter referred to as Most) to provide information about the company (ies) and/sector(s), if any, covered in the report and may be distributed by it and/or its affiliated company(ies). This report is for personal information of the selected recipient/s and does not construe to be any investment, legal or taxation advice to you. This research report does not constitute an offer, invitation or inducement to invest in securities or other investments and Motilal Oswal Securities Limited (hereinafter referred as MOSt) is not soliciting any action based upon it. This report is not for public distribution and has been furnished to you solely for your general information and should not be reproduced or redistributed to any other person in any form. This report does not constitute a personal recommendation or take into account the particular investment objectives, financial situations, or needs of individual clients. Before acting on any advice or recommendation in this material, investors should consider whether it is suitable for their particular circumstances and, if necessary, seek professional advice. The price and value of the investments referred to in this material and the income from them may go down as well as up, and investors may realize losses on any investments. Past performance is not a guide for future performance, future returns are not guaranteed and a loss of original capital may occur.
MOSt and its affiliates are a full-service, integrated investment banking, investment management, brokerage and financing group. We and our affiliates have investment banking and other business relationships with a some companies covered by our Research Department. Our research professionals may provide input into our investment banking and other business selection processes. Investors should assume that MOSt and/or its affiliates are seeking or will seek investment banking or other business from the company or companies that are the subject of this material and that the research professionals who were involved in preparing this material may educate investors on investments in such business . The research professionals responsible for the preparation of this document may interact with trading desk personnel, sales personnel and other parties for the purpose of gathering, applying and interpreting information. Our research professionals are paid on twin parameters of performance & profitability of MOSt. MOSt generally prohibits its analysts, persons reporting to analysts, and members of their households from maintaining a financial interest in the securities or derivatives of any companies that the analysts cover. Additionally, MOSt generally prohibits its analysts and persons reporting to analysts from serving as an officer, director, or advisory board member of any companies that the analysts cover. Our salespeople, traders, and other professionals or affiliates may provide oral or written market commentary or trading strategies to our clients that reflect opinions that are contrary to the opinions expressed herein, and our proprietary trading and investing businesses may make investment decisions that are inconsistent with the recommendations expressed herein. In reviewing these materials, you should be aware that any or all of the foregoing among other things, may give rise to real or potential conflicts of interest. MOSt and its affiliated company(ies), their directors and employees and their relatives may; (a) from time to time, have a long or short position in, act as principal in, and buy or sell the securities or derivatives thereof of companies mentioned herein. (b) be engaged in any other transaction involving such securities and earn brokerage or other compensation or act as a market maker in the financial instruments of the company(ies) discussed herein or act as an advisor or lender/borrower to such company(ies) or may have any other potential conflict of interests with respect to any recommendation and other related information and opinions.; however the same shall have no bearing whatsoever on the specific recommendations made by the analyst(s), as the recommendations made by the analyst(s) are completely independent of the views of the affiliates of MOSt even though there might exist an inherent conflict of interest in some of the stocks mentioned in the research report Reports based on technical and derivative analysis center on studying charts company's price movement, outstanding positions and trading volume, as opposed to focusing on a company's fundamentals and, as such, may not match with a report on a company's fundamental analysis. In addition MOST has different business segments / Divisions with independent research separated by Chinese walls catering to different set of customers having various objectives, risk profiles, investment horizon, etc, and therefore may at times have different contrary views on stocks sectors and markets.
Unauthorized disclosure, use, dissemination or copying (either whole or partial) of this information, is prohibited. The person accessing this information specifically agrees to exempt MOSt or any of its affiliates or employees from, any and all responsibility/liability arising from such misuse and agrees not to hold MOSt or any of its affiliates or employees responsible for any such misuse and further agrees to hold MOSt or any of its affiliates or employees free and harmless from all losses, costs, damages, expenses that may be suffered by the person accessing this information due to any errors and delays. The information contained herein is based on publicly available data or other sources believed to be reliable. Any statements contained in this report attributed to a third party represent MOSt’s interpretation of the data, information and/or opinions provided by that third party either publicly or through a subscription service, and such use and interpretation have not been reviewed by the third party. This Report is not intended to be a complete statement or summary of the securities, markets or developments referred to in the document. While we would endeavor to update the information herein on reasonable basis, MOSt and/or its affiliates are under no obligation to update the information. Also there may be regulatory, compliance, or other reasons that may prevent MOSt and/or its affiliates from doing so. MOSt or any of its affiliates or employees shall not be in any way responsible and liable for any loss or damage that may arise to any person from any inadvertent error in the information contained in this report. MOSt or any of its affiliates or employees do not provide, at any time, any express or implied warranty of any kind, regarding any matter pertaining to this report, including without limitation the implied warranties of merchantability, fitness for a particular purpose, and non-infringement. The recipients of this report should rely on their own investigations. This report is intended for distribution to institutional investors. Recipients who are not institutional investors should seek advice of their independent financial advisor prior to taking any investment decision based on this report or for any necessary explanation of its contents. Most and it’s associates may have managed or co-managed public offering of securities, may have received compensation for investment banking or merchant banking or brokerage services, may have received any compensation for products or services other than investment banking or merchant banking or brokerage services from the subject company in the past 12 months. Most and it’s associates have not received any compensation or other benefits from the subject company or third party in connection with the research report. Subject Company may have been a client of Most or its associates during twelve months preceding the date of distribution of the research report MOSt and/or its affiliates and/or employees may have interests/positions, financial or otherwise of over 1 % at the end of the month immediately preceding the date of publication of the research in the securities mentioned in this report. To enhance transparency, MOSt has incorporated a Disclosure of Interest Statement in this document. This should, however, not be treated as endorsement of the views expressed in the report. Motilal Oswal Securities Limited is registered as a Research Analyst under SEBI (Research Analyst) Regulations, 2014. SEBI Reg. No. INH000000412
Pending Regulatory inspections against Motilal Oswal Securities Limited: SEBI pursuant to a complaint from client Shri C.R. Mohanraj alleging unauthorized trading, issued a letter dated 29th April 2014 to MOSL notifying appointment of an Adjudicating Officer as per SEBI regulations to hold inquiry and adjudge violation of SEBI Regulations; MOSL replied to the Show Cause Notice whereby SEBI granted us an opportunity of Inspection of Documents. Since all the documents requested by us were not covered we have requested to SEBI vide our letter dated June 23, 2015 to provide pending list of documents for inspection. List of associate companies of Motilal Oswal Securities Limited -Click here to access detailed report Analyst Certification The views expressed in this research report accurately reflect the personal views of the analyst(s) about the subject securities or issues, and no part of the compensation of the research analyst(s) was, is, or will be directly or indirectly related to the specific recommendations and views expressed by research analyst(s) in this report. The research analysts, strategists, or research associates principally responsible for preparation of MOSt research receive compensation based upon various factors, including quality of research, investor client feedback, stock picking, competitive factors and firm revenues
Disclosure of Interest Statement NESTLE INDIA Analyst ownership of the stock No Served as an officer, director or employee No
A graph of daily closing prices of securities is available at www.nseindia.com and http://economictimes.indiatimes.com/markets/stocks/stock-quotes Regional Disclosures (outside India) This report is not directed or intended for distribution to or use by any person or entity resident in a state, country or any jurisdiction, where such distribution, publication, availability or use would be contrary to law, regulation or which would subject MOSt & its group companies to registration or licensing requirements within such jurisdictions.
For U.S. Motilal Oswal Securities Limited (MOSL) is not a registered broker - dealer under the U.S. Securities Exchange Act of 1934, as amended (the"1934 act") and under applicable state laws in the United States. In addition MOSL is not a registered investment adviser under the U.S. Investment Advisers Act of 1940, as amended (the "Advisers Act" and together with the 1934 Act, the "Acts), and under applicable state laws in the United States. Accordingly, in the absence of specific exemption under the Acts, any brokerage and investment services provided by MOSL, including the products and services described herein are not available to or intended for U.S. persons.
This report is intended for distribution only to "Major Institutional Investors" as defined by Rule 15a-6(b)(4) of the Exchange Act and interpretations thereof by SEC (henceforth referred to as "major institutional investors"). This document must not be acted on or relied on by persons who are not major institutional investors. Any investment or investment activity to which this document relates is only available to major institutional investors and will be engaged in only with major institutional investors. In reliance on the exemption from registration provided by Rule 15a-6 of the U.S. Securities Exchange Act of 1934, as amended (the "Exchange Act") and interpretations thereof by the U.S. Securities and Exchange Commission ("SEC") in order to conduct business with Institutional Investors based in the U.S., MOSL has entered into a chaperoning agreement with a U.S. registered broker-dealer, Motilal Oswal Securities International Private Limited. ("MOSIPL"). Any business interaction pursuant to this report will have to be executed within the provisions of this chaperoning agreement.
The Research Analysts contributing to the report may not be registered /qualified as research analyst with FINRA. Such research analyst may not be associated persons of the U.S. registered broker-dealer, MOSIPL, and therefore, may not be subject to NASD rule 2711 and NYSE Rule 472 restrictions on communication with a subject company, public appearances and trading securities held by a research analyst account. For Singapore Motilal Oswal Capital Markets Singapore Pte Limited is acting as an exempt financial advisor under section 23(1)(f) of the Financial Advisers Act(FAA) read with regulation 17(1)(d) of the Financial Advisors Regulations and is a subsidiary of Motilal Oswal Securities Limited in India. This research is distributed in Singapore by Motilal Oswal Capital Markets Singapore Pte Limited and it is only directed in Singapore to accredited investors, as defined in the Financial Advisers Regulations and the Securities and Futures Act (Chapter 289), as amended from time to time. In respect of any matter arising from or in connection with the research you could contact the following representatives of Motilal Oswal Capital Markets Singapore Pte Limited:
Kadambari Balachandran Email : [email protected] Contact : (+65) 68189233 / 65249115 Office Address : 21 (Suite 31),16 Collyer Quay,Singapore 04931
Motilal Oswal Securities Ltd
Motilal Oswal Tower, Level 9, Sayani Road, Prabhadevi, Mumbai 400 025 Phone: +91 22 3982 5500 E-mail: [email protected]