cxjCh2kghk
26
37 Morphologic Changes in P, QRS, ST, and T Chapter 2 You have recorded rate, rhythm, intervals, and the QRS axis. The next step in reading the ECG is to evaluate the P wave, QRS complex, ST segment, and T wave for abnor- malities, and then give a final interpretation. This is an exercise in pattern recognition. Yet ECG changes logically reflect what is happening with the heart’s anatomy and physiology. All of it makes more sense if you think of mechanism while learning diag- nostic criteria. Atrial (P Wave) Abnormalities Left Atrial Abnormality There are two possible patterns of left atrial abnormality (LAA). The most common is a biphasic P wave in lead V 1 (Fig 2.1). For it to be significant, the negative deflection has to be deep enough and wide enough to contain a small box (1 ¥ 1 mm). The biphasic P is CLINICAL INSIGHT Left atrial abnormality (LAA) occurs when there is pressure or volume overload of the atrium. Patients with hypertension and left ventricular hypertrophy have elevation of the LV diastolic pressure, and this is transmitted to the left atrium since the mitral valve is open during diastole. The left atrium must contract against the stiff LV. LAA has been identified as the most consistent, early ECG abnormality in hypertension, appearing well before other features of left ven- tricular hypertrophy. Before this discovery I often read ECGs with isolated LAA as borderline rather than abnormal. Now I call such ECGs abnormal, as LAA indicates an end-organ effect of elevated pressure—hypertensive heart disease— and a need for more aggressive antihypertensive therapy. LAA can be a transient finding. It may be present during acute pulmonary edema, and gone on the next day’s tracing after diuresis, which lowers left atrial pressure.
-
Upload
egn-njeba -
Category
Investor Relations
-
view
68 -
download
0
Transcript of cxjCh2kghk

37
Morphologic Changes in P, QRS, ST, and T
Chapter 2
You have recorded rate, rhythm, intervals, and the QRS axis. The next step in reading the ECG is to evaluate the P wave, QRS complex, ST segment, and T wave for abnor-malities, and then give a final interpretation. This is an exercise in pattern recognition. Yet ECG changes logically reflect what is happening with the heart’s anatomy and physiology. All of it makes more sense if you think of mechanism while learning diag-nostic criteria.
Atrial (P Wave) AbnormalitiesLeft Atrial AbnormalityThere are two possible patterns of left atrial abnormality (LAA). The most common is a biphasic P wave in lead V1 (Fig 2.1). For it to be significant, the negative deflection has to be deep enough and wide enough to contain a small box (1 ¥ 1 mm). The biphasic P is
CLINICAL INSIGHT
Left atrial abnormality (LAA) occurs when there is pressure or volume overload of the atrium. Patients with hypertension and left ventricular hypertrophy have elevation of the LV diastolic pressure, and this is transmitted to the left atrium since the mitral valve is open during diastole. The left atrium must contract against the stiff LV. LAA has been identified as the most consistent, early ECG abnormality in hypertension, appearing well before other features of left ven-tricular hypertrophy. Before this discovery I often read ECGs with isolated LAA as borderline rather than abnormal. Now I call such ECGs abnormal, as LAA indicates an end-organ effect of elevated pressure—hypertensive heart disease—and a need for more aggressive antihypertensive therapy.
LAA can be a transient finding. It may be present during acute pulmonary edema, and gone on the next day’s tracing after diuresis, which lowers left atrial pressure.

38 150PracticeECGs:InterpretationandReview
most common in conditions that increase left ventricular diastolic pressure—and there-fore left atrial pressure—including congestive heart failure and left ventricular hypertrophy.
A second LAA pattern is a broad, notched P wave in lead II, III, or aVF (Fig 2.1). It may be present only in lead II. The notched P wave is most common in patients with marked dilatation of the left atrium, as may be seen with mitral stenosis or regurgita-tion, and is referred to as “P mitrale.”
Right Atrial AbnormalityNormally, P waves are less than 2.5 mm tall (in any lead). In right atrial abnormality (RAA), the P waves are tall and narrow, and they appear peaked (Fig 2.2). P amplitude ≥ 2.5 mm in those leads oriented along the P wave axis (the inferior limb leads, II, III, and aVF) usually indicates RAA. This often is referred to as “P pulmonale” because it may be caused by advanced lung disease with associated pulmonary artery hyperten-sion. It is seen with pulmonary hypertension caused by congenital heart disease as well.
Intraventricular Conduction AbnormalitiesNormally, the wave of depolarization exits the bundle of His, moves through the two bundle branches, and activates the two ventricles simultaneously (see Fig 1.3). When one of the bundle branches, or one of their major divisions, is injured and conduction is blocked, the affected ventricular region is stimulated late by current that has spread from an adjacent ventricular region. Late activation creates a deflection at the terminal end of the QRS complex, making the overall QRS complex wider. A QRS duration of 0.12 second or more (3 mm) is the first diagnostic criterion for bundle branch block.
Right Bundle Branch BlockWhen the right bundle branch is blocked (RBBB), the interventricular septum and the left ventricle are activated normally (Fig 2.3). Current then spreads from the left to the right ventricle, which is depolarized late. Electrical events that occur early—septal and
FIGURE 2.1 Leftatrialabnormality(LAA).TwoECGfindingsmaybeusedtomakethediagnosis.A:BiphasicPwaveinleadV1;thenegativedeflectionshouldbe1mmdeepandwide.B:Broad,notchedPwaveinoneofthelimbleads,mostcommonlyII,III,oraVF,asthePwavevectorisaimedattheinferiorleads.

CHApTER 2:MorphologicChangesinP,QRS,ST,andT 39
FIGURE 2.2 Rightatrialabnormality(RAA).Tall,peakedPwavesininferiorleads(atleast2.5mminoneoftheleads).
left ventricular activation—are thus unchanged. What is different is an extra deflection at the end of the QRS caused by late, right ventricular depolarization.
I will restate this with reference to specific changes on the ECG. But first, recall a basic principle of electrocardiography regarding the polarity of leads. Each lead has spatial orientation and polarity (see Fig 1.2). A wave of depolarization that moves toward the positive pole of a lead produces a positive (upright) deflection, an R wave. If the wave of depolarization moves away from the positive and toward the negative pole of a lead, it still is detected, but it produces a negative (downward) deflection, an S wave.
Back to RBBB (see Fig 2.3): Lead V1, on the right side of the chest, sits just over the right ventricle (RV) and is a sensitive detector of right ventricular events. In RBBB, lead V1 first records normal septal activation, a positive deflection, or R wave, because the septum depolarizes from left to right. The left ventricle (LV) is activated normally, and in lead V1 this produces a negative deflection, or S wave, as the wave of depolar-ization moves posteriorly and to the left. Finally, current works its way from the LV to the RV—remember, it could not get there directly because of the blocked right bundle. The vector of RV depolarization is aimed at V1; thus, the terminal deflection in V1 is positive (upright), another R wave. RBBB thus produces an RSR¢ pattern in V1. In other leads, terminal forces (the RV vector) also are oriented toward the right. Thus, terminal QRS forces in the left-side leads, such as I, aVL, and V6, would be negative (an S wave).
RBBB diagnosis: RSR’ pattern in V1, and QRS ≥ 0.12 second.

40 150PracticeECGs:InterpretationandReview
FIGURE 2.3 Rightbundlebranchblock(RBBB).Followthesequenceofventricularactivation,anditseffectonleadsIandV1,which,inthefigure,areappropriatelypositioned.(1)Thereisnormalseptalactivationfromlefttoright.(2)Leftventricularactivationisnormal.(3)Becausetherightbundlebranchisblocked,currentmustmovefromtheleftventricletotheright,andthisoccurslate.ThetailendoftheQRSisslurredbecauseoflatedepolarizationoftherightside.Patternrecognition:RSRinV1+wideQRS.

CHApTER 2:MorphologicChangesinP,QRS,ST,andT 41
Incomplete Right Bundle Branch BlockIncomplete right bundle branch block (IRBBB) is usually a normal variant, but in some cases it reflects RV hypertrophy or dilatation. Our ECG computer program interprets it as “RV volume overload.” IRBBB is a common, almost invariable, finding with atrial septal defect (ASD), in which the RV may pump two or three times as much blood as the LV. ASD may cause no symptoms until a person reaches age 50. Thus, the diagnosis of ASD may be suggested by a routine ECG in an otherwise healthy young adult.
IRBBB diagnosis: RSR’ pattern in V1, and QRS duration < 0.12 second.
CLINICAL INSIGHT
When I ask students how to exclude atrial septal defect (ASD) in a young person with incomplete right bundle branch block (IRBBB), the usual answer is an echocardiogram. However, ASD is a rare finding in people with IRBBB, so you would order many normal echocardiograms before finding an ASD. A more rea-sonable approach would be a physical exam looking for fixed splitting of the second heart sound. It is not a subtle finding, and its absence excludes ASD. If there is uncertainty a relatively inexpensive chest x-ray can also exclude the diagnosis; the radiologist easily recognizes pulmonary plethora. Finally, the more expensive echocardiogram is indicated if these screening studies are abnormal. ASD is a common congenital heart abnormality, and for this reason it is com-monly encountered on board exams. If you suspect ASD expect to see IRBBB on the ECG. Without it the diagnosis is unlikely.
Left Bundle Branch Block (LBBB)In LBBB, the sequence of ventricular activation is almost the opposite of that described with RBBB. The left bundle innervates the interventricular septum, so initial septal depolarization, normally from left to right, is lost (Fig 2.4). The initial small negative deflection in left-side leads (I, aVL, V6) is lost—the so-called septal Q wave. The septum is instead activated from right to left, causing an initial positive deflection in left-side leads. Because the right ventricle is thin walled, little current is produced by RV excitation. Septal and early left ventricular activation predominate, and current gener-ated by RV discharge (which would be oriented anterior and to the right) is buried within the LV complex. LV activation is slow because of the blocked left bundle, and the QRS complex is wide. The terminal forces are aimed at the blocked side, to the left; therefore, the terminal portion of the QRS is positive in left-side leads such as I, aVL, and V6 (see Fig 2.4).

42 150PracticeECGs:InterpretationandReview
FIGURE 2.4 Leftbundlebranchblock(LBBB).Followthesequenceofventricularactivation.(1)Thenor-malleft-to-rightdepolarizationoftheseptumisinterruptedbytheblockedleftbundlebranch.Theseptumisactivatedfromrighttoleft.(2)Activationofthethin-walledrightventricleproduceslittlecurrent.(3)Theleftventricleisdepolarizedlatebycurrentworkingitswayoverfromtherightside,andterminalQRSforcesareorientedtowardtheleft.
Patternrecognition:broadpositivecomplex—oftennotched—inleft-sideleads(I,aVL).SmallQwavesintheseleadswouldexcludeLBBBbecausetheywouldindicatenormal,left-to-rightactivationofthesep-tum.ThispatientalsohadmarkedLAD.TwavechangesandprolongationoftheQTintervalmayaccom-panyLBBB.ItisnotpossibletodiagnoseeitherleftventricularhypertrophyorMIinthepresenceofLBBB.
chapter 2:MorphologicChangesinP,QRS,ST,andT 43
Left Anterior and Posterior Fascicular BlockThe fascicular blocks, or hemiblocks, cause changes in the QRS axis. The left bundle divides into anterior and posterior branches, or fascicles. The anterior fascicle is a thin nerve that runs through the septum close to the right bundle branch. It is relatively susceptible to injury, possibly because of its size and location, and left anterior fascicular block (LAFB) is common. The left posterior fascicle is a broad group of nerves that fans out through the posterior region of the interventricular septum. Possibly because of the space it occupies, it is less susceptible to injury than the anterior branch, and left posterior fascicular block (LPFB) is less common than LAFB.
Diagnostic criteria: The QRS complex is not necessarily wider than normal; the diag-nosis of fascicular block is made when there is a shift in axis.
1. LAFB: Extreme left axis deviation, at least -45°, not caused by inferior myocardial infarction (MI).
2. LPFB: Right axis deviation (RAD) > 90° (some have suggested more extreme RAD, as much as 110° or 120°).
This is a bit oversimplified, as other conditions may cause a shift in QRS axis. The most common of these is inferior MI with deep Q waves in inferior leads causing extreme left axis deviation. Inferior infarction does not alter conduction through the left ante-rior fascicle. When there are inferior Q waves (reviewed later in this chapter), the diag-nosis is left axis deviation rather than LAFB.
Bifascicular BlockThink of the infranodal system as having three branches, or fascicles: the right bundle and the two branches of the left bundle. LBBB, or block of both branches of the left bundle, could be considered bifascicular block. However, the term is usually reserved for RBBB plus block of one of the two branches of the left bundle (RBBB plus LAFB, or RBBB plus LPFB).
cLINIcaL INSIGht
The ECG computer will occasionally describe an “intraventricular conduction defect” when the pattern looks like left bundle branch block (LBBB). Look more closely at leads I and aVL. The computer probably has detected a tiny Q wave, indicating normal left-right depolarization of the interventricular septum. LBBB interrupts this, so the presence of a “septal Q” excludes LBBB.
The left bundle is a broad complex of nerves in the interventricular septum, occupying a lot of space. For this reason LBBB usually indicates heart disease, with an abnormal echocardiogram. In contrast, the right bundle is a long, thin nerve that can be blocked by a small amount of fibrosis. The echocardiogram may show no structural or functional abnormality.
LBBB diagnosis: QRS duration ≥ 0.12 second plus a broad, positive complex in left-side leads (I, aVL, and V6).

44 150PracticeECGs:InterpretationandReview
Because of the anatomic proximity of the right bundle and left anterior fascicle, con-ditions that injure one often affect the other; the combination of RBBB plus LAFB is observed in as many as 1 in 25 hospitalized patients. The diagnosis is simple: there is RBBB plus extreme left axis deviation (LAD). This condition does not necessarily reflect advanced, serious heart disease. A small amount of fibrosis may block the two nerves. Many patients with RBBB plus LAFB have normal LV function and no other structural cardiac abnormalities.
By contrast, patients with other forms of bifascicular block—RBBB plus LPFB, or LBBB—usually have detectable, structural problems, such as poor LV function, isch-emic injury, or hypertrophy.
CLINICAL INSIGHT
AV nodal block and infranodal block are both common, so it is no surprise that they are occasionally seen together. Earlier, there was concern about the patient with first-degree AV block who also has bifascicular block (right bundle branch block [RBBB] plus left anterior fascicular block [LAFB]). If the long PR interval is from conduction delay in the one remaining infranodal nerve, the left posterior fascicle, then the patient might be at risk for complete heart block. This was the subject of the first clinical studies using His bundle recording (see Fig 1.8). The result: virtually all patients with long PR + RBBB + LAFB have a long A-H inter-val, e.g., block in the AV node. The H-V interval—infranodal conduction—is normal. Prophylactic pacemaker therapy is unnecessary.
Ventricular Hypertrophy, QRS Amplitude, and R Wave ProgressionFirst, the big picture; then we will get to the specifics. Pressure overload of a ventricle may be caused by increased vascular resistance downstream, or ventricular outflow tract obstruction. The ventricle responds to pressure overload by adding muscle, just as you add muscle to your arms with weight lifting. Increased muscle thickness on one side of the heart or the other may cause a shift in QRS axis toward the hypertrophied side and an increase in voltage (more muscle, more voltage).
The large coronary artery branches are located on the epicardial surface of the heart, and they send blood to underlying muscle through small perforating branches. An increase in ventricular thickness means an increase in the distance from the epicardial artery to the endocardium. Blood supply to the subendocardial region—farthest from the epicardial source—may be compromised, causing changes in the ST segment and T wave that look ischemic. It is commonly referred to as a strain pattern. In a sense, the ventricle outgrows its blood supply. Most coronary blood flow occurs during diastole. The relative reduction in flow to subendocardial regions with hypertrophy is aggra-vated by high ventricular diastolic pressures.
Finally, high ventricular diastolic pressures are reflected back to the atria, causing atrial (P wave) abnormalities on the ECG.

CHApTER 2:MorphologicChangesinP,QRS,ST,andT 45
FIGURE 2.5 Leftventricularhypertrophy(LVH).ThispatientwithaorticstenosishadLAA,highQRSvolt-age(V2),ST-Tchangesinlateralleads(thetypicalLVstrainpattern),andwideQRS.HedidnothaveLAD,andtheintrinsicoiddeflectionwasborderline(seeTable2.1).
Table 2.1 TheEstesPointSystemforLeftVentricularHypertrophy(LVH)1. Amplitude 3points Anyofthefollowing (a) LargestRorSwaveinthelimbleads≥20mm (b) SwaveinV1orV2≥30mm (c) RwaveinV5orV6≥30mm2. ST-Tchanges(typicalpatternofleftventricularstrainwiththeSTsegmentvector
shiftedindirectionoppositetothemeanQRSvector,usuallySTdepression) Withoutdigitalis 3points Withdigitalis 1point3. Leftatrialabnormality 3points4. Leftaxisdeviation(-30°ormore) 2points5. QRSduration≥0.09second 1point6. IntrinsicoiddeflectioninV5andV6≥0.05second 1pointLVH=5ormorepointsProbableLVH=4points
Left Ventricular HypertrophyPredictably, left ventricular hypertrophy (LVH) causes an increase in LV voltage plus ST segment depression and T wave changes in these leads with high voltage (the LV strain pattern), a shift in axis to the left, and LAA (Fig 2.5). In addition, there may be slight widening of the QRS to more than 0.09 second, and some patients develop LBBB. However, LBBB changes the QRS complex enough that LVH cannot be diagnosed when LBBB is present. The initial upstroke of the R wave in V5 and V6, from baseline to its peak—called the intrinsicoid deflection—may be prolonged to over 0.04 second. This is the time that it takes the LV to be activated, and it is longer when the ventricle is thickened.
A patient with LVH may not have all these ECG findings, especially early in its development (Fig 2.5). The diagnosis can be made when just some of these features are present, but with fewer findings the certainty of the diagnosis is lower. The Estes scoring system is provided in Table 2.1. A point total of 5 makes the diagnosis of LVH, and with 4 points, the patient has probable LVH. Use of multiple diagnostic criteria rather than QRS voltage alone gives good specificity (fewer false positives, less overdiagnosis).

46 150PracticeECGs:InterpretationandReview
On the other hand, the sensitivity of the ECG in detecting LVH is poor; it tends to underdiagnose. Using an ECG point system, both anatomic and echocardiographic cor-relation studies have shown that just half the cases of true LVH meet rigid ECG criteria. Relaxing the diagnostic criteria, by using voltage alone for example, increases sensitiv-ity but also increases the number of false positives. This choice between sensitivity and specificity is a common dilemma when reading ECGs.
FIGURE 2.6 Rightventricularhypertrophy(RVH).Thisyoungwomanwithprimarypulmonaryhyperten-sionhadrightwardaxis,atallRinV1,deepSinV6,andST-Tchangesintherightprecordialleads(theRVstrainpattern).ShedidnothaveRAA(seeTable2.2).
CLINICAL INSIGHT
In general, avoid overdiagnosis. Left ventricular hypertrophy (LVH) demonstrates the importance of this principle. Young people often have high QRS voltage, particularly if thin or athletic. Using voltage alone to diagnose LVH could mean assigning that diagnosis to a healthy person. LVH is considered bad heart disease, and carrying that diagnosis would be a problem for anyone applying for a job or for insurance. It seems better to stick with strict ECG diagnostic criteria for LVH, recognizing the insensitivity of the ECG.
A counter argument is that LVH is a serious heart condition. For example, a person with coronary artery disease has a worse prognosis with the addition of LVH. Any ECG finding that would lead to earlier diagnosis and treatment might justify the risks of overdiagnosis.
In most cases, I place my vote for specificity (first, do no harm). When there is doubt, it can be sorted out with an echocardiogram.
Right Ventricular HypertrophyMost of the voltage in the QRS complex is generated by the LV, which is much thicker than the RV. This makes the QRS complex in the right-side precordial leads (V1 and V2) negative, and that in the left-side precordial leads (V4–V6) positive. The transition from negative to positive complexes usually occurs around V3–V4. That changes with right ventricular hypertrophy (RVH). As you would expect, RVH causes an increase in RV voltage over the right chest leads and an associated shift in QRS axis toward the right. There is often a strain pattern in leads reflecting high RV voltage (Fig 2.6). Specific diagnostic criteria are outlined in Table 2.2.
CHApTER 2:MorphologicChangesinP,QRS,ST,andT 47
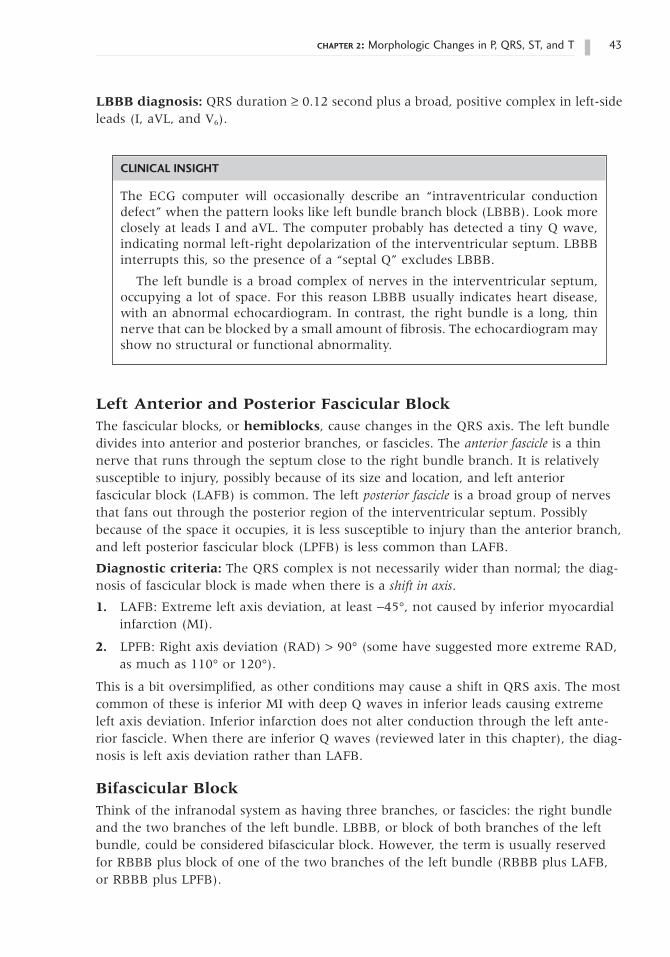
Table 2.2 DiagnosisofRightVentricularHypertrophyCriteria R/SinV1≥1,or RinV1≥7mm,or RinV1+SinV5orV6>10.5mmSupportivefindings Rightaxisdeviation≥110° Rightatrialabnormality(RAA) STdepression+TwaveinversioninV1orV2(RVstrain)
CLINICAL INSIGHT
Cor pulmonale is common, but it is diagnosed infrequently. Consider it when a patient with chronic lung disease has peripheral edema. The ECG may or may not show evidence for right ventricular hypertrophy (RVH), but the echocardio-gram should demonstrate RV and right atrial enlargement. Low oxygen satura-tion on room air is common. The treatment is continuous oxygen therapy, which allows the midsize pulmonary arteries to relax. When oxygen saturation is bor-derline for home oxygen, the presence of cor pulmonale (edema) is an indication for treatment.
RVH may not cause all these changes. The voltage changes alone may be used to make the diagnosis. I feel more confident when there is also ST-T change or axis shift. The possibility of false positives is enough that I usually hedge when reading ECGs with no clinical history. On the other hand, in the presence of a condition that may cause RVH (e.g., lung disease with probable cor pulmonale, mitral valve, or congenital heart disease, which can cause pulmonary hypertension, or primary pulmonary hyper-tension), the typical ECG pattern indicates RV pressure overload, most commonly from elevated pulmonary artery pressure.
Delayed, or Poor, R Wave Progression in Precordial LeadsTo this point, each section has considered a cardiac diagnosis. This and a number of fol-lowing sections will consider ECG findings that do not clearly indicate anatomic or functional abnormalities, and that must be recognized in the interpretation as nonspecific.
As noted previously, negative (S wave) forces predominate over right chest (precor-dial) leads. There is transition in the midprecordial leads, and the QRS should be iso-electric by lead V3, with positive and negative forces equal. In leads V4–V6 the R wave amplitude should exceed negative forces. Delay in transition, or poor R wave progres-sion, simply means that this transition point is further to the left (Fig 2.7), and that more of the precordial leads have (net) negative voltage.

48 150PracticeECGs:InterpretationandReview
Low QRS VoltageDiagnostic criterion: The QRS amplitude is less than 5 mm in all of the limb leads. When this is the case, the amplitude in each of the precordial (V) leads is usually less than 10 mm, but that is not necessary for the diagnosis.
As with delayed R wave transition, low voltage should be considered a description, not a diagnosis. It may be a normal variant. Among the cardiac conditions associated
FIGUre 2.7 PoorRwaveprogression(PRWP).TransitionfromanegativetopositiveQRScomplexnor-mallyhappensbyleadV4.Thispatient’sQRSisstillnegativeinV4andV5.
cLINIcaL INSIGht
Because there are a number of causes of delayed R wave transition, it is not a diagnosis but rather a description of the ECG changes. It frequently accompanies left anterior fascicular block. Other causes are anterior myocardial infarction with a loss of positive forces in anterior leads, or marked dilatation of the left ventricle (LV) with displacement of the apical impulse—and with it the position over the LV where QRS voltage becomes positive.
A noteworthy cause is chronic obstructive pulmonary disease (COPD). Think for a moment of COPD with its barrel-chest deformity. On chest x-ray, the heart may appear to be hanging more vertically in the hyperexpanded chest cavity, and on physical exam the apical impulse is best felt in the subxiphoid region. There is a ligament attaching the pericardium to the diaphragm, and flattening of the dia-phragm pulls it down, altering the heart’s position. This has two effects: (1) rota-tion of the heart counter-clockwise, causing delayed R wave progression; and (2) a change in left atrial position causing a negative deflection in the P wave in lead a VL (less frequently observed than PRWP, but more specific for emphysema).
On the other hand, COPD can cause cor pulmonale and right ventricular hypertrophy (RVH). This may cause deep S waves in V5–6 creating a delay in R wave transition. But remember that RVH also causes tall R waves in V1, which I think of as the right ventricle lead. Studies correlating ECG and anatomic find-ings have shown that a deep S wave in V5–6 but no tall R wave in V1 may lead to a false positive diagnosis of RVH.

CHApTER 2:MorphologicChangesinP,QRS,ST,andT 49
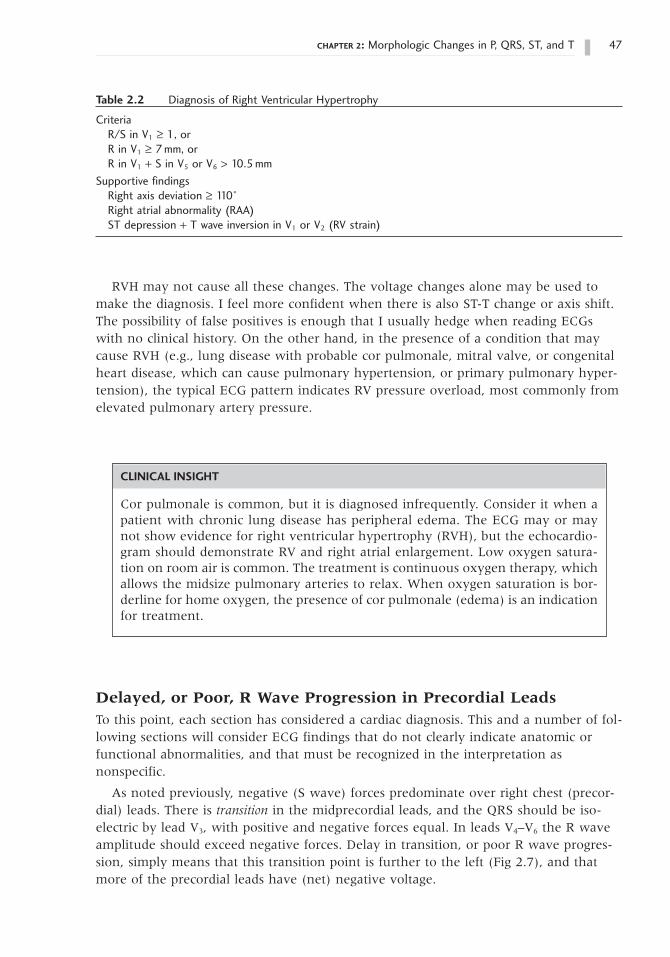
ST Segment and T Wave Changes and Q Waves: Patterns of Ischemia and InfarctionMyocardial ischemia tends to be a regional event (Fig 2.8). Only one of the major cor-onaries is likely to cause ischemia or infarction at a time. To have multiple branches develop stenoses that cause active ischemia simultaneously would be a rare coincidence. Thus, an ischemic event is limited to the anterior wall (the anterior descending artery, the precordial V leads), the inferior wall (usually the right coronary artery, ECG leads II, III, and aVF), or the lateral wall (the circumflex artery, leads I, aVL, and V6).
There can be some overlap in vascular distributions, as there is considerable ana-tomic variation. Thus, occlusion of an especially large right coronary artery that loops around to the lateral wall might cause inferolateral infarction with ECG changes in infe-rior leads, plus changes in one or more of the lateral leads. A large anterior descending artery might have branches that supply part of the lateral wall, and anterolateral MI would mean changes in anterior precordial leads plus one or more of the lateral leads (see Fig 2.8).
ECG changes that are global, involving all the vascular regions, are rarely caused by ischemia. Pericarditis, for example, affects the entire heart and causes ST segment and T wave changes that are global, present in anterior, inferior, and lateral leads.
Ischemic injury can cause a variety of changes in ST segments, T waves, and the QRS complex. The following section is organized around the ECG changes. While reading this, you may find it useful to refer to Table 2.3, which organizes the same ECG findings according to cardiac diagnoses—the same information, just a different way of looking at it.
ST Segment DepressionDuring the short time from the end of the QRS complex to the beginning of the T wave, no voltage is recorded on the ECG; the ST segment is isoelectric (see Fig 1.2). This is another use of the term isoelectric. Here it means that there is no voltage—as is the case with the ST segment that rests on the baseline; it can also mean that positive
CLINICAL INSIGHT
An exception to a lack of diagnostic specificity using low QRS voltage is cardiac amyloidosis. The combination of low QRS voltage plus a thick left ventricle on the echocardiogram strongly suggests that diagnosis. The increased thickness is the amyloid. It is not muscle (not true hypertrophy), does not depolarize, and therefore adds nothing to QRS voltage.
with low QRS voltage are dilated cardiomyopathy, infiltrative cardiomyopathy, pericar-dial effusion, and constrictive pericarditis. Noncardiac causes include hypothyroidism, emphysema, and obesity. Low voltage is such a nonspecific finding that it is not consid-ered a diagnostic criterion for any of these illnesses.
50 150PracticeECGs:InterpretationandReview
Table 2.3 ECGChangeswithSyndromesofMyocardialIschemiaCondition ECG changes Timing pathophysiologyAnginapectoris STdepression Coincidental Stenosedartery,butwithsome withchestpain antegradeflow;O2demandexceeds supply;subendocardialischemiaCoronaryartery STelevation Coincidentalwith Spasmmayoccurinanormalarteryspasm(angina chestpain oratthesiteofplaque;usuallytotalpectoris) occlusion;transmuralischemia, temporaryNon-QMI STdepression Duringpainbut Stenosedartery,butwithsome Twaveinversion maybe antegradeflow;subendocardial permanent ischemia,thennecrosisQwaveMI STelevation Coincidental Totalocclusion,transmuralischemia, withpain thennecrosis Twaveinversion Minutestohours later,whileST elevationpersists Qwave Minutestohours afteronsetofMI; permanent
FIGURE 2.8 Coronaryarteryanatomy.ThecircumflexandrightcoronaryarteriescircletheheartintheAVgroove;branchesofthecircumflexleavethegroovetosupplythelateralwall.Themajorrightcoronarybranch(theposteriordescendingartery)suppliestheinferiorwall.Theanteriordescendingarteryislocatedjustovertheinterventricularseptum(theinterventricular groove);itsendsperforatingbranchesintotheseptum,anddiagonalbranchestotheanteriorLVsurface.ThespatialorientationoftheECGleadsallowsgroupsofleadstoreflecteventsinagivenregionoftheheart(seeFig1.2aswell).

CHApTER 2:MorphologicChangesinP,QRS,ST,andT 51
FIGURE 2.9 Patternsofmyocardialischemia.Theepicardiumistheoutsidesurfaceoftheheart,andtheendocardiumisthesurfacenexttotheventricularcavity.Thecoronaryarteriesarelocatedontheepicardialsurface.Subendocardial(nontransmural)ischemiacausesSTsegmentdepression.Ifischemiapersistsandthereismyocardialinjury,theremaybeTwaveinversion(apatternnowcallednon-STelevationMI,butalsoreferredtoassubendocardialornontransmuralornon-Qwaveinfarction).Transmuralischemiaiscausedbytotalocclusionoftheartery.Duringacuteischemia,thereisSTsegmentelevation.Resolutionofspasmordissolutionofthrombusmayopentheoccludedarterybeforethereisinjury.Inthiscase,theepi-sodeofischemiarepresentsanginapectoris.Ifocclusionand,therefore,ischemiapersistsandthereismyo-cardialinjury,thepatterniscalledSTelevationMI(alsoreferredtoastransmuralorQwaveinfarction).
and negative forces are equal, canceling each other with a net sum of zero voltage. At times it is difficult to identify the baseline. The segment just before the P wave is gen-erally accepted as the baseline. Note that the PR segment or ST segment can shift up or down with disease.
A shift in the ST segment from the baseline may indicate ischemia. ST depression occurs with subendocardial ischemia (Fig 2.9). Cardiac catheterization during subendocar-dial ischemia usually reveals that the coronary artery supplying the ischemic zone is tightly stenosed but not (totally) occluded. There is a mismatch between blood supply
52 150PracticeECGs:InterpretationandReview
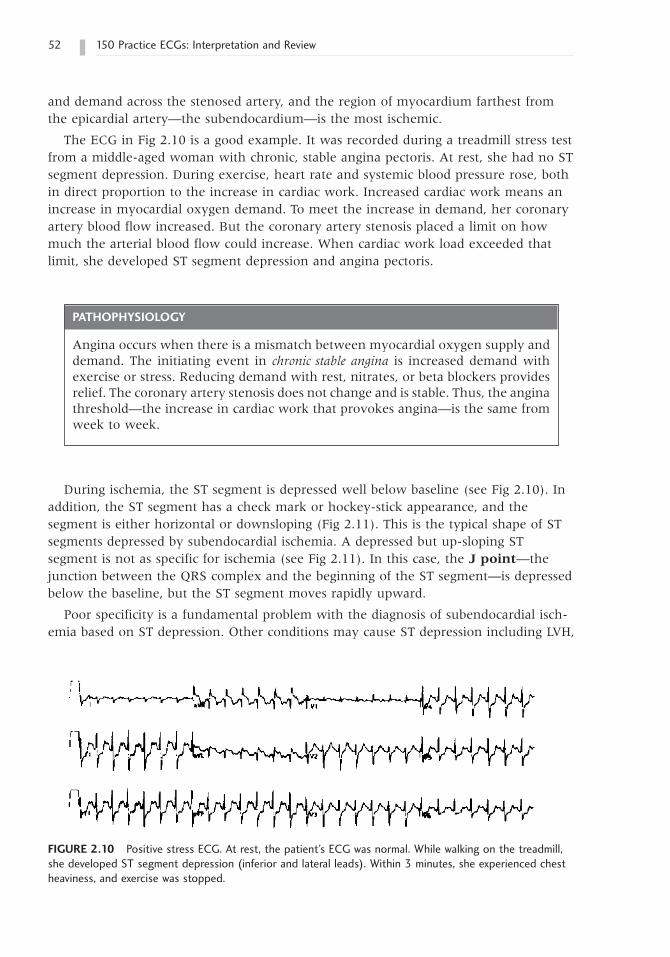
FIGURE 2.10 PositivestressECG.Atrest,thepatient’sECGwasnormal.Whilewalkingonthetreadmill,shedevelopedSTsegmentdepression(inferiorandlateralleads).Within3minutes,sheexperiencedchestheaviness,andexercisewasstopped.
pATHOpHYSIOLOGY
Angina occurs when there is a mismatch between myocardial oxygen supply and demand. The initiating event in chronic stable angina is increased demand with exercise or stress. Reducing demand with rest, nitrates, or beta blockers provides relief. The coronary artery stenosis does not change and is stable. Thus, the angina threshold—the increase in cardiac work that provokes angina—is the same from week to week.
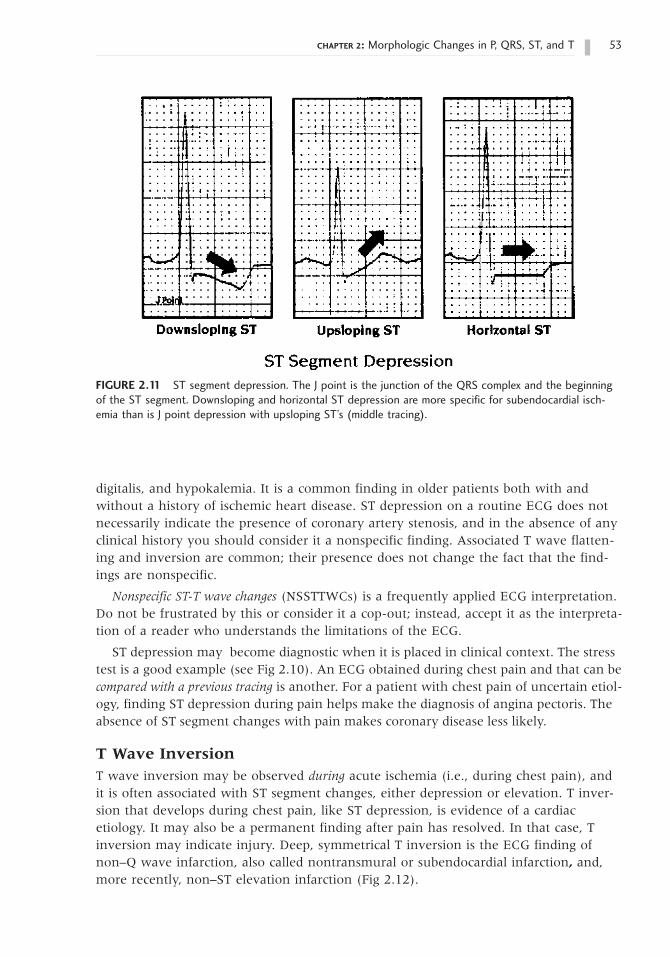
During ischemia, the ST segment is depressed well below baseline (see Fig 2.10). In addition, the ST segment has a check mark or hockey-stick appearance, and the segment is either horizontal or downsloping (Fig 2.11). This is the typical shape of ST segments depressed by subendocardial ischemia. A depressed but up-sloping ST segment is not as specific for ischemia (see Fig 2.11). In this case, the J point—the junction between the QRS complex and the beginning of the ST segment—is depressed below the baseline, but the ST segment moves rapidly upward.
Poor specificity is a fundamental problem with the diagnosis of subendocardial isch-emia based on ST depression. Other conditions may cause ST depression including LVH,
and demand across the stenosed artery, and the region of myocardium farthest from the epicardial artery—the subendocardium—is the most ischemic.
The ECG in Fig 2.10 is a good example. It was recorded during a treadmill stress test from a middle-aged woman with chronic, stable angina pectoris. At rest, she had no ST segment depression. During exercise, heart rate and systemic blood pressure rose, both in direct proportion to the increase in cardiac work. Increased cardiac work means an increase in myocardial oxygen demand. To meet the increase in demand, her coronary artery blood flow increased. But the coronary artery stenosis placed a limit on how much the arterial blood flow could increase. When cardiac work load exceeded that limit, she developed ST segment depression and angina pectoris.
CHApTER 2:MorphologicChangesinP,QRS,ST,andT 53
digitalis, and hypokalemia. It is a common finding in older patients both with and without a history of ischemic heart disease. ST depression on a routine ECG does not necessarily indicate the presence of coronary artery stenosis, and in the absence of any clinical history you should consider it a nonspecific finding. Associated T wave flatten-ing and inversion are common; their presence does not change the fact that the find-ings are nonspecific.
Nonspecific ST-T wave changes (NSSTTWCs) is a frequently applied ECG interpretation. Do not be frustrated by this or consider it a cop-out; instead, accept it as the interpreta-tion of a reader who understands the limitations of the ECG.
ST depression may become diagnostic when it is placed in clinical context. The stress test is a good example (see Fig 2.10). An ECG obtained during chest pain and that can be compared with a previous tracing is another. For a patient with chest pain of uncertain etiol-ogy, finding ST depression during pain helps make the diagnosis of angina pectoris. The absence of ST segment changes with pain makes coronary disease less likely.
T Wave InversionT wave inversion may be observed during acute ischemia (i.e., during chest pain), and it is often associated with ST segment changes, either depression or elevation. T inver-sion that develops during chest pain, like ST depression, is evidence of a cardiac etiology. It may also be a permanent finding after pain has resolved. In that case, T inversion may indicate injury. Deep, symmetrical T inversion is the ECG finding of non–Q wave infarction, also called nontransmural or subendocardial infarction, and, more recently, non–ST elevation infarction (Fig 2.12).
FIGURE 2.11 STsegmentdepression.TheJpointisthejunctionoftheQRScomplexandthebeginningoftheSTsegment.DownslopingandhorizontalSTdepressionaremorespecificforsubendocardialisch-emiathanisJpointdepressionwithupslopingST’s(middletracing).

54 150PracticeECGs:InterpretationandReview
FIGURE 2.12 Anterior,non-STelevationMI.Thismaybecalledsubendocardial,nontransmural,ornon-QMI.ThereisdeepandsymmetricalTwaveinversionintheanteriorleads.TheQTintervalislong;thisisnotacriterionfornon-QMI,butmayaccompanyit.
CLINICAL INSIGHT
The traditional distinction between subendocardial and transmural infarction provides a tidy explanation but is not completely accurate (Fig 2.9). Recent studies indicate that the main difference between the two is the size of the MI and not necessarily the location of injury within the myocardium. The non-Q wave MI is smaller. Less injury is good, as myocardium is irreplaceable. On the other hand, the smaller MI may be “incomplete.” Early angiography usually shows a tightly stenosed artery with unstable appearing plaque surface, indicating a risk of occlusion and “completion” of the MI. Non-ST elevation MI is therefore an indication for cardiac catheterization and possible revascularization.
Let us backtrack a moment and be sure that we understand the sequence of events with ischemia (see Table 2.3 and Fig 2.9). It is the direction of ST segment shift that dis-tinguishes subendocardial from transmural ischemia. The combination of chest pain and ST depression indicates ongoing, subendocardial ischemia. If pain is prolonged and there is myocardial injury, T wave inversion develops and may be permanent. Deep and sym-metrical T wave inversion is the non–Q wave infarct pattern, and ST depression may resolve when the pain (active ischemia) is over. With non–Q wave infarction, injury is limited to the subendocardium, not the full thickness of the ventricle (see Fig 2.9). Cardiac catheterization during the acute phase of non–Q wave MI (during pain) shows that the infarct artery is tightly stenosed but that there is still some antegrade flow.
Nonischemic cardiac conditions, including pericarditis and virtually any disease that affects the myocardium, may cause T wave inversion. Children and young adults without heart disease may have T inversion, the so-called juvenile pattern.
Intracranial bleeding may cause deep T wave inversion; look for this on Board exams. The ECG recording in Figure 2.12 could be the result of intracranial hemor-rhage. Pathologic studies have shown that most of these patients suffer subendocardial myolysis at the time of the bleed—the T wave changes come from the heart, not the brain. Sympathetic discharge at the onset of bleeding may be the mechanism.

CHApTER 2:MorphologicChangesinP,QRS,ST,andT 55
pATHOpHYSIOLOGY
Note the basic differences between chronic stable angina and the acute coronary syndromes including unstable angina, non-ST and ST elevation MI. With stable angina, the lesion is fixed and angina is caused by an increase in oxygen demand. With the acute coronary syndromes, the lesion is variable, and it is a drop in supply that initiates chest pain. It often occurs at rest. In most cases this is due to unstable plaque surface that has attracted platelets.
Nonischemic heart disease, such as pericarditis or myocarditis, generally produces global changes, altering ST segments and T waves in anterior, inferior, and lateral leads. Remember that changes resulting from ischemia are usually limited to one vascular region.
ST Segment ElevationThe most common cause of ST segment elevation is transmural MI, now called ST- elevation MI. Catheterization during chest pain and ST elevation shows a coronary artery that is totally occluded. ST elevation is the primary ECG indication for emer-gency angioplasty or thrombolytic therapy. Compared with ST segment depression, ST elevation is a more specific indication of acute ischemia. Most patients with new ST elevation are in the emergency room with chest pain.
Acute MI with ST segment elevation is a dramatic finding on the ECG (Figs 2.13 and 2.14). Review these tracings from seven patients with inferior or anterior MI. The ST elevation is limited to leads that reflect a single vascular distribution (see Fig 2.8). Patients with large transmural infarction who have ST segment elevation may also have ST depression in leads reflecting nonischemic myocardial regions (see Fig 2.13). The ST depression is called reciprocal ST depression, and it does not indicate ischemia in the noninfarct zone.
Not all ischemic ST elevation leads to injury. Vasospastic, or Prinzmetal’s, angina pectoris also causes ST elevation. An angiogram obtained during a spontaneous episode, or with provocative testing with ergonovine infusion, usually shows total cor-onary occlusion. This would induce full thickness—transmural—ischemia in that vascu-lar distribution. The ST elevation and chest pain are usually self-limited, or respond to nitrates and calcium channel blockers. MI is an uncommon complication of spontane-ous coronary vasospasm. However, cocaine-induced spasm may cause infarction or sudden cardiac death.
Although more reliable than ST segment depression, ST elevation is not specific for ischemia, and it must be interpreted in clinical context. Two nonischemic causes of ST elevation deserve special attention.
1. Acute pericarditis may cause ST elevation and chest pain, raising the possibility of acute MI (Figs 2.15 and 2.16). Features that may help you distinguish the ST elevation of pericarditis from that caused by ischemia are reviewed in Table 2.4. Although these features are helpful when found, they may also be subtle or missing. There may be uncertainty about the diagnosis, and the ECG is just one piece of the puzzle. The clinical presentation is just as important as the ECG.

56 150PracticeECGs:InterpretationandReview
FIGURE 2.13 FourpatientswithacuteinferiorMI.ThesizeofinferiorMIisproportionaltothesumofSTelevationinthethreeinferiorleads.Inaddition,thosewithreciprocalSTdepressioninanteriororlateralleadstendtohavelargerinfarctions.Usingthesecriteria,patientAwashavingthelargestMI,patientsBandCmoderate-sizedMIs,andpatientDasmallinfarct.PatientBalsohadSTelevationinV5andV6;thismaybecalledaninferolateralMI.Inthiscase,thedistalrightcoronaryarteryintheAVgroovewaslarge,anditterminatedinabranchtothelateralwall(seeFig2.8).
PatientDisanarguablecaseofinfarction,astheSTsegmentelevationisminimal.IamtemptedtosaythatthemildJpointdepressioninV2throughV4representsreciprocalSTdepression;typicalchestpainandasubsequentriseincardiacenzymeswouldbeneededtomakethediagnosisofMIwithcertaintyinthiscase.TheECGchangesofSTsegmentelevationinfarctionareusuallyobvious,butthereareborderlinecaseslikethisone.Asarule,suchborderlinecasesinvolvesmallMIs;withbigonesthereislittledoubt.
A
B
C
D

CHApTER 2:MorphologicChangesinP,QRS,ST,andT 57
FIGURE 2.14 ThreepatientswithacuteanteriorMIandSTelevation.PatientAhasupwardlyconvexSTsegments.PatientBhassimilarlyshapedSTsinV3throughV5,butstillhassomeupwardconcavityinV1andV2.ThispatienthasdevelopedTinversioninadditiontoSTelevation(seeTable2.1).PatientChasSTele-vationplustall,peakedTwaves.TheseTwavechangesmaybecalledhyperacute,andtheywouldindicateischemiaintheabsenceofSTelevation.
ThesizeofanteriorMIisproportionaltothenumberofleadswithSTelevation.EachofthesepatientshasSTelevationinfivedifferentleadsandishavinglargeinfarction.
A
B
C
2. Early repolarization is a common cause of ST elevation. The cause is not certain, but the name suggests that some portion of the ventricle repolarizes before the obvious onset of the T wave, raising the ST segment. As with pericarditis, ST segment elevation may be global rather than regional (although it may be limited to just one or two leads), and the ST segment usually has normal upward concav-ity. It is often difficult to distinguish early repolarization and acute pericarditis. Depression of the PR segment is a specific finding for pericarditis (see Fig 2.15). Early repolarization is a benign condition, common in young people. There is little day-to-day variation in this pattern, so comparison of the ECG with previous trac-ings should help make the diagnosis.

58 150PracticeECGs:InterpretationandReview
FIGURE 2.15 Acutepericarditis.This19-year-oldmanhada2-weekhistoryoftheflu.Therewasmildfever.OnthemorningofthisECG,hedevelopedchestpainthatworsenedwithdeepbreathing(e.g.,pleu-riticpain).Onexam,therewasapericardialfrictionrub.TheECGshowsSTelevationinmultipleleads,andthereisnoreciprocalSTdepression.TheSTsareupwardlyconcave.ThereisdepressionofthePRsegmentinleadsIIandaVF,andprobablyinIII;PRdepressionmakesthediagnosisofpericarditismorecertain.
FIGURE 2.16 STsegmentelevation.PatientAstillhasthenormalupwardconcavityoftheSTsegment.Thisisusuallythecasewithpericarditis,althoughwehaveseensimilarSTchangeswithacute,transmuralischemia(seeFig2.14).PatientBhassimultaneousSTelevationandTinversion.Thiscombinationindicatesischemia.TheTwavesmayinvertwithpericarditis,buttheST’susuallybecomeisoelectricbeforetheT’sturnover.PatientChasanupwardlyconvexSTsegment;thisusuallyindicatesischemia.
CLINICAL INSIGHT
ST segment elevation resolves over a day or two after acute MI. But an occasional patient with anterior MI has chronic ST segment elevation. This ECG finding suggests left ventricular aneurysm.
Q Waves and Evolution of Myocardial InfarctionAn initial negative deflection of the QRS complex is labeled a Q wave. A significant Q wave is deep and broad, at least 1 mm deep and 1 mm wide. Isolated Q waves may be normal in leads III or V1; in other leads, Q waves are abnormal and indicate transmural myocardial injury (see Fig 2.9).

CHApTER 2:MorphologicChangesinP,QRS,ST,andT 59
FIGURE 2.17 TypicalevolutionoftransmuralMI.A:LimbleadsfromapatientwithacuteMIwhohadinfe-riorSTelevationplusreciprocalSTdepressioninlateralleads.B:ThenextdaytherewaslessSTelevation,thereciprocalSTdepressionhadresolved,andtheTwaveswereinvertedintheinferiorleads.DeeperQwavesdevelopedintheinferiorleads.

60 150PracticeECGs:InterpretationandReview
CLINICAL INSIGHT
The concept of complete versus incomplete MI is useful. A patient who has had a Q wave infarction but who develops postinfarction angina may have viable muscle in the infarct zone (the source of angina). The usual mechanism for this is spon-taneous thrombolysis early in the course of MI. As with thrombolytic therapy, an hour or two of ischemia is enough to cause Q waves, even though injury is incomplete and there is residual, viable muscle. As noted, early reperfusion seems to hasten the evolution of Q waves.
This is the mechanism for what used to be called extension of MI. Recurrent pain, more ST elevation, and another increase in cardiac enzyme during the week after a Q wave infarction may indicate that the initial infarction was incomplete, possibly because of spontaneous thrombolysis. Reocclusion of the infarct artery is responsible for recurrence, or “extension,” of the MI.
In the absence of acute reperfusion therapy, the ECG pattern of MI evolves over a couple of days (Fig 2.17 and Table 2.3). The earliest change is ST segment elevation, and this develops immediately with coronary occlusion. It may be associated with tall, peaked T waves, also called hyperacute T waves (see Fig 2.14D). Within hours, the T waves may become inverted while there is persistence of ST elevation. Hours to days after the onset of MI, Q waves appear. The diagnosis of MI is most secure when these evolutionary changes are recorded on serial ECGs. ST elevation without evolutionary changes suggests a nonischemic etiology.
Table 2.4 STSegmentElevation:PericarditisversusIschemia pericarditis IschemiaDistribution Global(multiplevascular Regional(onevascular distributions) distribution)ReciprocalSTdepression Absent MaybepresentSTsegmentshape Normal(upwardlyconcave) Ischemic(upwardlyconvex)PRdepression Present(seeFig2.15) AbsentTimingofTinversion T’sinvertafterST’sbecome T’sinvertwhiletheST’sarestill isoelectric elevated
While ST elevation and T wave inversion may resolve during the 2 weeks after acute MI, Q waves persist in 70% to 90% of patients. They may disappear after a small inferior MI, but Q’s tend to be permanent after a large MI.
Reperfusion therapy for MI has changed some of this. The evolution of ECG changes is more rapid. When the occluded infarct artery is opened, the ST segment elevation either resolves or improves. That is not always the case, and persistent elevation of ST segments may indicate microvascular injury, even though the large coronary artery is open. Prompt resolution of ST elevation is the best indicator of successful reperfusion and myocardial salvage.

CHApTER 2:MorphologicChangesinP,QRS,ST,andT 61
FIGURE 2.18 AcutelateralMI.STelevationislimitedtothelateralleads,I,andaVL.ItispossibletohaveSTchangesinjustV6,orinV5andV6.Anditisalsopossibletohavelateral,transmuralischemiawithnoECGchangesatall.
Q waves develop rapidly with reperfusion, possibly within minutes. Our experience with reperfusion also has provided new insights into the significance of Q waves. In the old days, I was taught that Q waves meant transmural scar with loss of all muscle (and, therefore, a loss of contractility). Now we know that deep Q waves may develop even when there is early reperfusion and only partial injury to muscle in the infarct zone. Thus Q waves do not reliably define an LV segment as irreversibly damaged—or the infarction as completed.
FIGURE 2.19 Pseudoinfarctionpatterncausedbypre-excitation(Wolff-Parkinson-Whitesyndrome).TheinferiorQsare,infact,deltawaves.Thetip-offistheshortPRintervalplusthemoreobviousdeltawaveinthelateralprecordialleads.
Lateral Wall MIThe ECG criterion for transmural MI is pathologic Q waves. Occlusion of the circum-flex artery may cause ST segment elevation in lateral leads (Figs 2.8 and 2.18). However, it is possible to have transmural injury involving the lateral wall of the LV with few ST segment or T wave changes and without Q waves. The lateral wall seems to be an electrocardiographically silent region of the heart (see Fig 2.8). The patient may have typical chest pain and a subsequent rise in cardiac enzymes and may even be left with akinesis (no contractility) of the lateral wall. Yet the ECG may be unchanged throughout the course of MI. This is the rationale for extended observation and cardiac enzyme measurement when there is typical, ischemic chest pain but a normal ECG, or one that does not provide the usual evidence for acute MI.

62 150PracticeECGs:InterpretationandReview
Silent MI, pseudo MIThe opposite side of the coin is the patient with no symptoms who has significant Q waves, and an akinetic LV segment involving the same vascular region (i.e., anterior Q waves and anterior akinesis on the echocardiogram). Taking a careful history, you may get the patient to remember vague symptoms that could have been the infarction, but in many cases there are no symptoms at all. This is the case with at least 20% of MIs, and it may be more common in patients with diabetes and diabetic neuropathy. It is important to recognize silent ischemic heart disease because it is associated with a poor prognosis.
Poor R wave progression may begin with Q waves in V1–V2, raising the possibility of prior anterior MI. This is easily sorted out with an echocardiogram which identifies an anterior and septal wall motion abnormality after infarction.
A couple of conditions may produce false-positive Q waves. The delta wave of pre-excitation may appear to be a Q wave (Fig 2.19). Recognition of the short PR interval, the absence of a clinical history of MI, and a normal echocardiogram are tip-offs. Q waves may be seen in patients with hypertrophic cardiomyopathy; the physical exami-nation suggests the diagnosis and it is confirmed by echocardiography.