Michelle Coutcher MSW, LISW Danielle Marie Van Fleet, MSW, LSW.
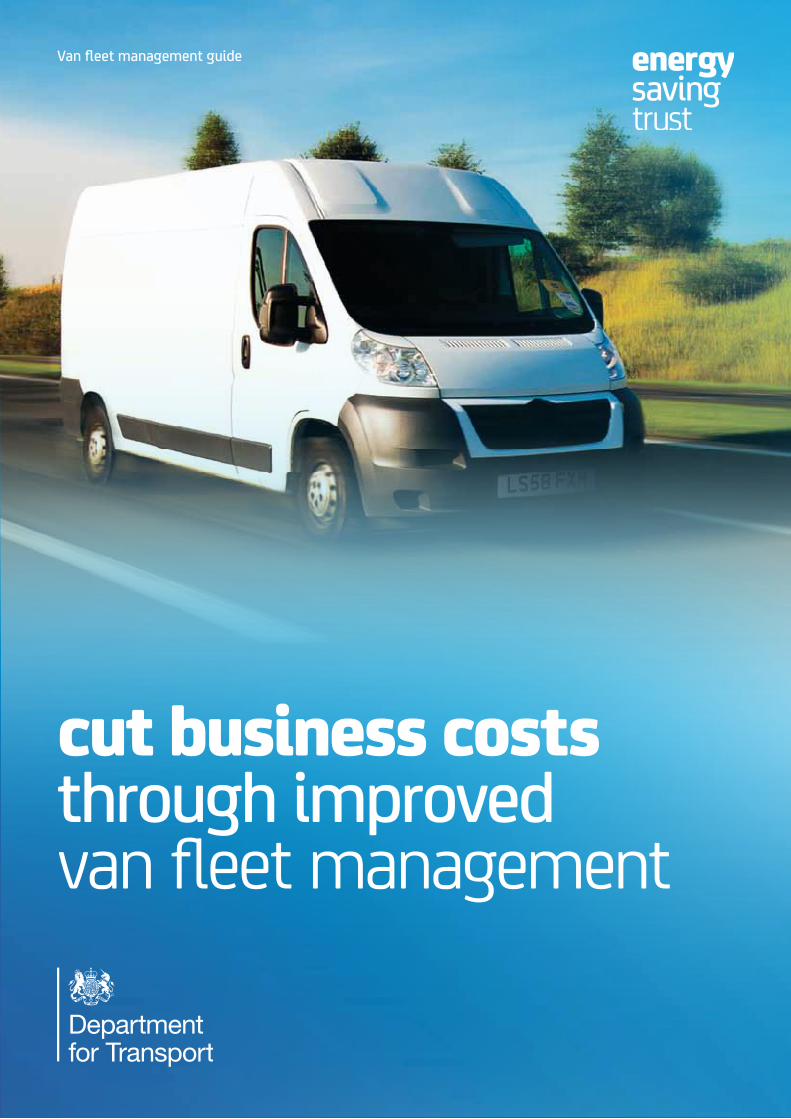
Van fleet management guide
van fleet management
cut business coststhrough improved
Energy Saving TrustVan fleet management guide
01
Introduction Vans are the workhorse of our economy. The data suggests this is the case:
• The number of vans registered to drive in the UK increased from 2.5 million in 2001 to 3.2 million by 2011, an increase of almost 30 per cent1.
• Annual van use increased 25 per cent to 41.4 billion miles in the same time frame.
In comparison, over the same period, the HGV population declined by two per cent. The Government forecasts van traffic to rise by 88 per cent between 2010 and 20352. Equally, numbers of cars and HGVs are forecast to grow by around 40 per cent over the same period.
Assuming an average cost of 50 pence per mile, then the UK’s vans cost around £20 billion a year. In 1990, vans contributed 10.7 per cent of road traffic carbon dioxide emissions, whereas today they are responsible for approximately 15 per cent1. This shows the importance of managing your running costs and cutting your carbon emissions.
This guide aims to help you cut costs and emissions through:
• procuring cost-effective vans• maximising fuel economy • minimising mileage.
ContentsBusiness case 02Getting started: setting benchmarks 03Van choice 04Van management 07
1 Transport Statistics Great Britain. Department for Transport.2 Road Transport Forecasts 2011. Results from the Department for Transport’s National Transport Model.
January 2012.
Energy Saving TrustVan fleet management guide
02
Fuel costs are increasing the burden on budgets, but fleet running costs are controllable and should be carefully managed. It is crucial for fleet managers to know how much they spend on fuel for each van and driver. Without this essential starting point, achieving cost and carbon savings will be difficult.
The table below shows typical fuel costs for different fleets and the potential savings solely from reducing fuel consumption:
1. Based on a Ford Transit Connect with real world fuel economy of 40 mpg, covering 15,000 miles/yr and fuel at £1.17 per litre ex VAT.
2. Assumes a 10 per cent reduction in fuel consumption.
Additionally, costs may be reduced by downsizing vehicles and reducing mileage: savings could be as much as 30 per cent of total costs. This may seem unrealistic at first glance, but implementing several measures could deliver a sizeable saving, for example:
• Downsizing vehicles where possible could cut total costs by 20 per cent over the replacement cycle (see graph on page 3).
• Improving driver performance could achieve a 10 per cent reduction in fuel costs (three to four per cent of fleet costs).
• Using telematics could result in a 5 to 10 per cent reduction in costs, partly by making drivers aware they are being monitored.
• Cutting operational mileage could reduce vehicle numbers, and therefore fleet costs.
There are other benefits:
• Employee safety. Improving driver performance and reducing mileage will reduce accident levels and improve employee well-being.
• Environment. Reducing fuel consumption and costs goes hand-in-hand with cutting carbon emissions and local air pollutants.
• Company image. Consumer demand for corporate social responsibility and sustainability is increasing. Reducing emissions and improving driver performance can enhance customer perception and win more business.
Fleet Size Fuel Costs/yr1 Potential Fuel savings/yr2
5 Vans £9,950 £995
50 Vans £99,500 £9,950
200 Vans £398,000 £39,800
Business case

Energy Saving TrustVan fleet management guide
03
The first step is to audit your fleet’s current financial and environmental performance.
Environmental performance benchmarks should be established, such as:
• average mpg data – for the whole fleet, sub-fleets (e.g. departments) and individual vehicle types
• mileage – including fleet total, per vehicle, per £ income, etc
• carbon dioxide emissions – calculated from fuel consumption or mileage.
Getting started: setting benchmarks
01020304050607080
Large Van A
Insurance & Accidents
Fuel
Servicing, Maintenance & Repair
VED
Depreciation
Type of van
Penc
e pe
r mile
Large Van B Medium Van Small Van
Good base data is essential when you make a business case to senior management for investment, for example in more expensive but more efficient vehicles to reduce whole life costs, or for investment in telematics.
Financial performance is measured by reviewing whole life costs in pence per mile (ppm) for each vehicle type. The chart below is a fictitious whole life cost comparison which illustrates the benefits from switching between comparable sized models, or indeed downsizing.
Determine which vehicles are right for you by auditing your fleet’s financial and environmental performance.
Vehicle pence per mile analysis
Energy Saving TrustVan fleet management guide
04
Van choice
Minimise whole life costsAfter depreciation, fuel is the greatest expense, responsible for 25 - 35 per cent of whole life costs. Therefore choosing the best, or better, in class in fuel economy can cut costs and emissions.
In working out whole life costs, it is important to consider factors that influence the fuel economy a vehicle will achieve under your operating conditions. Official fuel economy figures are for an empty van: actual consumption depends upon the type of use, load carried and driving style. The following should be considered:
• Real-world fuel consumption is typically 15 per cent higher than the vehicle’s official figure.
• Lower powered engines are most suitable for town and B-road driving, while a slightly more powerful engine may be more economical for vans used predominantly on motorways.
• Although most vans are used for urban and motorway driving, one or the other will often dominate. Use the most relevant fuel consumption figure (urban or extra urban) rather than the combined figure when comparing vehicles, especially for vans fitted with start/stop technology.
Downsizing opportunitiesMany manufacturers have introduced model ranges which fill previously empty niches and offer a greater range of options within each model. Issues to consider during procurement include:
• Ensure vehicles are not being treated as mobile store rooms for rarely needed spare parts. With better job scheduling, these could be more efficiently stored at base.
• If larger vans are needed only occasionally, using spot-hire when the extra capacity is required could be cost effective.
• Fit lightweight, space-efficient racking systems to maximise load space. Specify side loading doors and/or flexible bulkheads which make smaller vans more adaptable.
• Folding front passenger seats and flexible bulkheads facilitate the transport of long items in a smaller van.
For more information, read the Energy Saving Trust guide: Interpreting weight plates for light commercial vehicles (pdf), or watch our webinar - Vans: thinking inside the box.
Energy Saving TrustVan fleet management guide
05
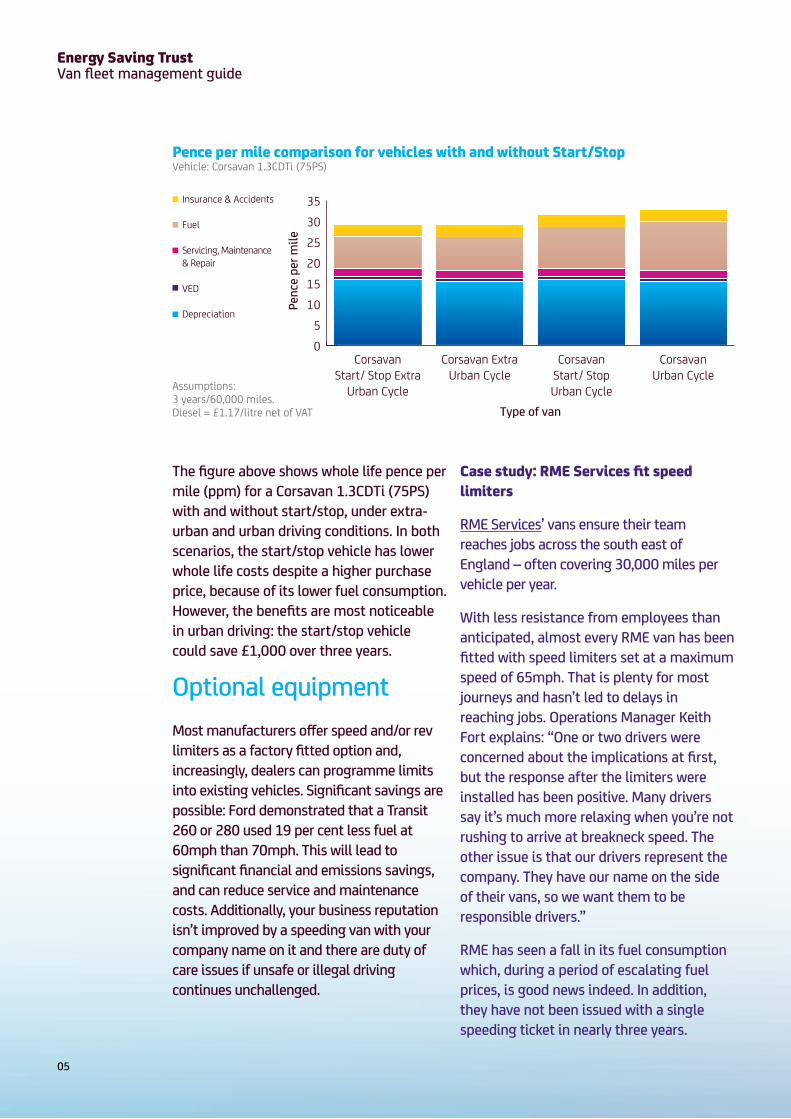
The figure above shows whole life pence per mile (ppm) for a Corsavan 1.3CDTi (75PS) with and without start/stop, under extra-urban and urban driving conditions. In both scenarios, the start/stop vehicle has lower whole life costs despite a higher purchase price, because of its lower fuel consumption. However, the benefits are most noticeable in urban driving: the start/stop vehicle could save £1,000 over three years.
Optional equipmentMost manufacturers offer speed and/or rev limiters as a factory fitted option and, increasingly, dealers can programme limits into existing vehicles. Significant savings are possible: Ford demonstrated that a Transit 260 or 280 used 19 per cent less fuel at 60mph than 70mph. This will lead to significant financial and emissions savings, and can reduce service and maintenance costs. Additionally, your business reputation isn’t improved by a speeding van with your company name on it and there are duty of care issues if unsafe or illegal driving continues unchallenged.
Case study: RME Services fit speed limiters
RME Services’ vans ensure their team reaches jobs across the south east of England – often covering 30,000 miles per vehicle per year.
With less resistance from employees than anticipated, almost every RME van has been fitted with speed limiters set at a maximum speed of 65mph. That is plenty for most journeys and hasn’t led to delays in reaching jobs. Operations Manager Keith Fort explains: “One or two drivers were concerned about the implications at first, but the response after the limiters were installed has been positive. Many drivers say it’s much more relaxing when you’re not rushing to arrive at breakneck speed. The other issue is that our drivers represent the company. They have our name on the side of their vans, so we want them to be responsible drivers.”
RME has seen a fall in its fuel consumption which, during a period of escalating fuel prices, is good news indeed. In addition, they have not been issued with a single speeding ticket in nearly three years.
Pence per mile comparison for vehicles with and without Start/Stop Vehicle: Corsavan 1.3CDTi (75PS)
05
101520253035
Corsavan Start/ Stop Extra
Urban Cycle
Corsavan Extra Urban Cycle
Corsavan Start/ Stop Urban Cycle
CorsavanUrban Cycle
Insurance & Accidents
Fuel
Servicing, Maintenance & Repair
VED
Depreciation
Type of van
Penc
e pe
r mile
Assumptions: 3 years/60,000 miles. Diesel = £1.17/litre net of VAT

Energy Saving TrustVan fleet management guide
06
Alternative fuelsCompressed Natural Gas (CNG) vehicles produce significantly less carbon dioxide and other emissions, and can be quieter than diesel powered models. Vans up to 3.5t are typically dual fuel and are designed to run on CNG; however, they have a small reserve petrol tank in case the CNG runs out. CNG compatible vehicles will also run on biogas, which is produced from waste material.
Per mile LPG (liquefied petroleum gas) produces fewer NOx and PM emissions than diesel and lower carbon dioxide emissions than petrol. LPG costs less than conventional fuels, but you get fewer miles to the gallon; per mile travelled it is about 25 per cent cheaper than petrol and around the same price as diesel. LPG tanks can reduce load space. The fuel is less widely available than petrol or diesel. For more information on CNG and LPG, download our guide to alternative fuels.
Plug-in vehicles produce zero emissions at the point of use. Because they draw power from the grid, there are associated emissions from electricity generation, although these are significantly less than those from diesel and petrol fuelled engines.
Purchase costs for plug-in vans are usually higher than for conventionally fuelled equivalent models, but savings accumulate from very low operating costs, particularly the reduced cost of fuel. Electric vehicles typically require up to eight hours to charge fully, and they have a range of around 100 miles. They are therefore most suited to urban use, although there is a developing recharging infrastructure with points available in car parks and on-street.
Per mile LPG (liquefied petroleum gas) produces fewer NOx and PM emissions than diesel and lower carbon dioxide emissions than petrol.

Energy Saving TrustVan fleet management guide
07
Cost-effective van fleet management consists of maximising fuel economy and minimising mileage. The two determinants of fuel economy - distance covered and volume of fuel used - must be captured on a regular basis, in order to compare the performance of vehicles and drivers and identify opportunities for efficiency improvements.
It is essential for you to develop a database of MPG and mileage. This will enable under-performing vehicles and drivers to be identified, enabling corrective action to be taken. Drivers who consistently under-perform against their fuel economy benchmark can be identified for training. Poorly performing vehicles may require a defect to be repaired. MPG data can feed into your whole life cost calculations to more accurately represent what is achieved within your operating environment.
Driver performanceOther than the type of vehicle used, the driver has the greatest influence on costs and emissions. Improving driver performance can reduce fuel costs, accident rates and insurance premiums and minimise vehicle wear and tear.
Van management
Driver behaviour can be influenced by raising and maintaining awareness. The most effective way to do this is through in-vehicle eco-driving training, supported by disseminating fuel economy information to drivers (for example, using league tables).
Companies are also advised to risk assess their drivers and select those deemed most at risk for additional training. Risk can be assessed using computer profiling tools and other indicators such as licence endorsements, accident rate, MPG and tyre change frequency.
Training that focuses on driving economically is recommended. Energy Saving Trust offers Smarter Driving for van drivers, coaching them in techniques that enable them to drive fuel efficiently. Training can be run from your premises by a highly experienced, accredited driver trainer. On average, drivers achieve fuel savings of 15 per cent on the day of training. Find out more at www.energysavingtrust.org.uk/smarterdriving
Finally, incentives can be used to maintain drivers’ focus. Incentives can range from an annual bonus for all drivers and/or teams who meet MPG targets, to occasional competitions such as ‘the most improved driver of the month’.

Energy Saving TrustVan fleet management guide
08
MaintenanceVehicles with under-inflated tyres, or requiring maintenance or which have damaged bodywork will use more fuel than vehicles in good condition. Deteriorating performance can be identified by monitoring fuel economy, allowing corrective action to be taken before the next planned service.
Possibly the most overlooked issue but one of the easiest to rectify is that of maintaining correct tyre pressures. This is important for several reasons:
• Under inflation decreases fuel economy. Four tyres under-inflated by 25 per cent (for example 24 instead of 32 psi) will increase fuel consumption by approximately two per cent.
• Under or over inflation increases wear and therefore reduces tyre life.
• Under or over inflation affects grip and braking, reducing safety.
For more information watch our webinar on tyre choice, maintenance and legislation.
Mileage managementMinimising mileage reduces costs and emissions increasing driver productivity.
Minimising mileage essentially involves efficient routing and maximising vehicle utilisation to get the best performance from a vehicle. Accurate route planning, using sat-nav systems, can avoid traffic jams and
find the most efficient route, while computerised routing and scheduling software packages enable you to plan the most efficient vehicle movements.
Telematics systems, or vehicle trackers, can be a powerful tool in reducing mileage. They offer advantages including:
• real time routing and scheduling of vehicles • elimination of unauthorised private use of
vehicles, or separation of public and private journeys where the latter is permitted
• elimination of unnecessary detours • identification of inefficiencies due to
speeding, harsh driving and excessive idling.
A common concern amongst drivers is that telematics will lead to management ‘spying’ on drivers, adding more pressure to the job. Before introducing vehicle tracking, consult your employees and highlight the benefits that the system will deliver. For example, communicating the safety and security aspects of telematics can ease driver concerns.
The importance of good mileage and journey recording should not be under-estimated. Fleets must have detailed mileage records to prove there is no significant private usage (where this is not permitted), as the burden of proof is on the company.
For impartial advice, tailored to meet the needs of your van fleet, call our Transport Advice Line on 0845 602 1425.

Energy Saving Trust 21 Dartmouth Street, London, SW1H 9BP Phone: 0845 602 1425
energysavingtrust.org.uk/fleet
TE812 © Energy Saving Trust January 2013