CUSTOMERS’ SUCCESS OUR ACHIEVEMENT
338
Stock Code: 0598HK 601598SH CUSTOMERS’ SUCCESS OUR ACHIEVEMENT INTERIM REPORT 2020
Transcript of CUSTOMERS’ SUCCESS OUR ACHIEVEMENT
Stock Code: 0598HK 601598SH
CUSTOMERS’ SUCCESSOUR ACHIEVEMENT
INTERIM REPORT2020
INTER
IM R
EPOR
T 2020
Important Notice
1INTERIM REPORT 2020
1. The Board and the Supervisory Committee of the Company and the Directors, Supervisors and members of the Senior Management warrant the truthfulness, accuracy and completeness of the contents in this Interim Report and confirm that there are no misrepresentations or misleading statements contained in or material omissions from this Interim Report, and accept several and joint legal responsibilities.
2. Absent Directors
Position of the absent Director
Name of the absent Director
Reason for the absence of the Director Name of proxy
Non-executive Director Su Jian Absent due to other business engagement
Li Guanpeng
3. The Interim Report is unaudited.
4. The Company’s legal representative, Li Guanpeng; Chief Financial Officer, Wang Jiuyun; and the person in charge of the Financial Department (“person in charge of accounting”), Mai Lina, hereby make the statement that they warrant the financial statements contained in this Interim Report are true, accurate and complete.
5. Proposal for profit distribution or proposal for conversion of common reserve fund into share capital during the Reporting Period considered by the Board
No
6. Risk disclaimer of forward-looking statements
3Applicable Not applicable
Forward-looking statements including future plans and development strategies in this Report do not constitute substantive commitments of the Company to investors. Investors should be aware of the investment risks.
7. Whether the controlling shareholder or its related parties has misappropriated the Company’s funds for purposes other than for business
No
8. Whether the Company has provided external guarantees in violation of any prescribed decision-making procedures
No
9. Significant risk alert
The Company has described the potential risks in detail in this Report. Please refer to “Chapter 4 Management Discussion and Analysis of Business Performance (Report of the Board) – III. OTHER DISCLOSURES – (III) Potential Risks” in this Report.
10. Others
3Applicable Not applicable
The Company’s 2020 interim financial report has been prepared in accordance with Accounting Standards for Business Enterprises published by the Ministry of Finance of the People’s Republic of China and related provisions. Unless otherwise specified, the reporting currency in this Report is Renminbi (“RMB”).
Contents contained in this Report are prepared in compliance with all disclosure requirements of the SSE Listing Rules and SEHK Listing Rules. The Report is published in both Chinese and English versions in Mainland China and Hong Kong at the same time. Should there be any discrepancies between the Chinese and English versions of this Report, the Chinese version shall prevail.
Corporate MissionCreating a logistics ecology system around the world
to successfully promote industrial progress
Corporate VisionBecoming a world-class intelligent logistics platform enterprise
Highlights of the First Half of 2020 4
Chapter 1 Definitions 5
Chapter 2 General Information and Key Financial Indicators 8
Chapter 3 Business Overview 12
Chapter 4 Management Discussion and Analysis of Business Performance (Report of the Board) 21
Chapter 5 Significant Matters 45
Chapter 6 Movement of Ordinary Shares and Particulars of Shareholders 64
Chapter 7 Particulars of Preferred Shares 70
Chapter 8 Directors, Supervisors, and Senior Management 71
Chapter 9 Particulars of Corporate Bonds 72
Chapter 10 Financial Report 77
Chapter 11 Documents Available for Check 336
CONTENTS
SINOTRANS LIMITED4
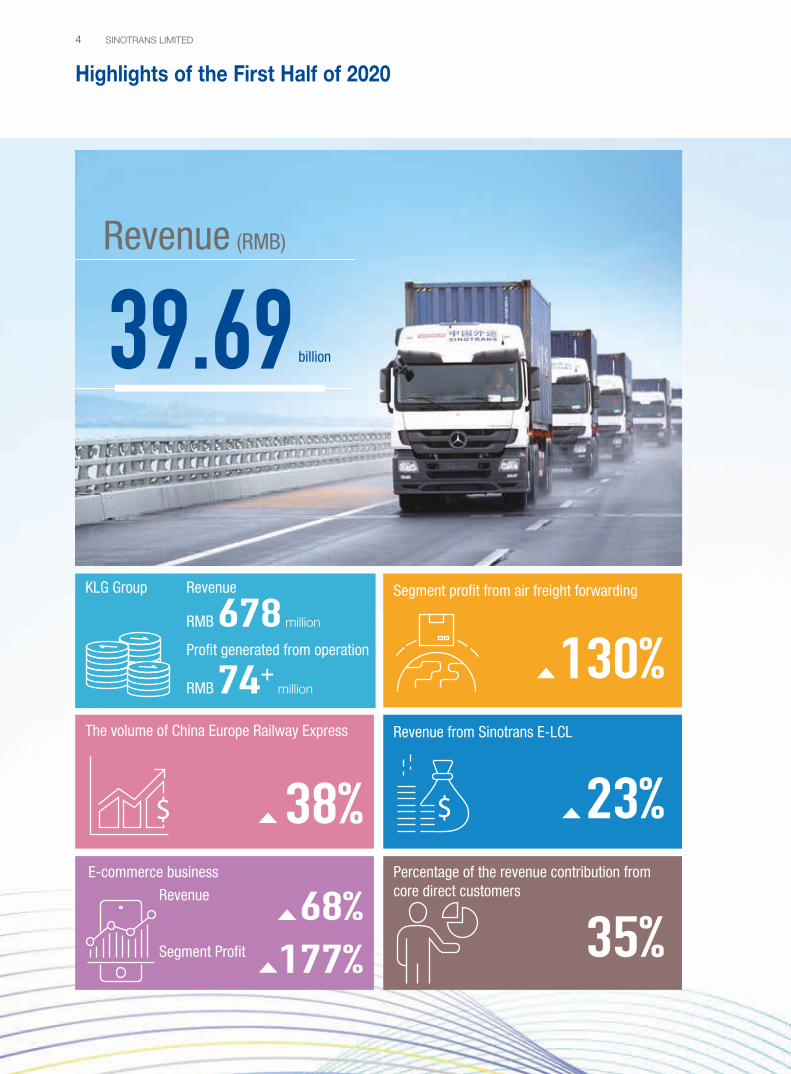
Highlights of the First Half of 2020
Percentage of the revenue contribution from core direct customers
KLG Group
RMB 678 million
RMB 74+ million
Segment profit from air freight forwarding
Revenue (RMB)
39.69 billion
The volume of China Europe Railway Express Revenue from Sinotrans E-LCL
E-commerce business
Revenue
Segment Profit
Profit generated from operation
Revenue
130%
38% 23%
68%177% 35%
Chapter 1Definitions
5INTERIM REPORT 2020
In this Report, unless the context otherwise indicates, the following words have the following meanings:
A Share(s) the Domestic Share(s) of the Company with nominal value of
RMB1.00 each, which are listed on the SSE and traded in RMB
Articles of Association the Articles of Association of Sinotrans Limited
Board the Board of Directors of the Company
CG Code code provisions of Corporate Governance Code as set out in
Appendix 14 to the SEHK Listing Rules
China Merchants China Merchants Group Limited (招 商 局 集 團 有 限 公 司), a wholly
state-owned enterprise established under the laws of the PRC
under direct control of the State-owned Assets Supervision
and Administration Commission of the State Council, the actual
controller of the Company, which holds approximately 57.61% of
the issued share capital of the Company at the date of this Report
China Merchants Group or CMG China Merchants and its subsidiaries
Companies Ordinance the Companies Ordinance (Chapter 622 of the Laws of Hong Kong)
Company or Sinotrans Sinotrans Limited (中 國 外 運 股 份 有 限 公 司), a joint stock limited
company incorporated in the PRC with limited liability, whose H
Shares are listed on the SEHK and A Shares are listed on the SSE
Company Law the Company Law of the People’s Republic of China
CSRC China Securities Regulatory Commission
Director(s)/Supervisor(s) Director(s)/Supervisor(s) of the Company
Domestic Share(s) shares issued by the Company under the laws of the PRC, the par
value of which is denominated in RMB, and which are subscribed in
RMB
Finance Company China Merchants Group Finance Co., Ltd. (招商局集團財務有限公司), a company owned as to 51% by China Merchants and 49% by
Sinotrans & CSC
Group Sinotrans Limited and its subsidiaries
HK$ Hong Kong dollars, the lawful currency of Hong Kong Special
Administrative Region of the PRC
SINOTRANS LIMITED6
Chapter 1Definitions
H Share(s) overseas listed foreign invested Share(s) of RMB1.00 each in the
issued share capital of the Company, which are listed on the Hong
Kong Stock Exchange and traded in HK$
Hong Kong Hong Kong Special Administrative Region of the People’s Republic
of China
Hong Kong Stock Exchange/SEHK The Stock Exchange of Hong Kong Limited
KLG Group the seven European logistics companies of KLG Europe Holding
B.V. acquired by the Company, which were whol ly-owned
subsidiaries of the Company as at the date of this Report
Listing Rules in Listing Places the SEHK Listing Rules and SSE Listing Rules
Model Code the Model Code for Securities Transactions by Directors of Listed
Issuers contained in Appendix 10 to the SEHK Listing Rules
PRC the People’s Republic of China
Reporting Period the period from 1 January 2020 to 30 June 2020
RMB Renminbi, the lawful currency of the PRC
SASAC the State-owned Assets Supervision and Administration Commission
of the State Council of the PRC
SEHK Listing Rules Rules Governing the Listing of Securities on The Stock Exchange of
Hong Kong Limited
Senior Management the Company’s senior management as defined by the Articles of
Association
SFO the Securities and Futures Ordinance (Chapter 571 of the Laws of
Hong Kong)
7INTERIM REPORT 2020
Chapter 1Definitions
Share(s) H Share(s) and A Share(s)
Shareholder(s) holder(s) of the Shares
Sinoair Sinotrans Air Transportation Development Co., Ltd. (中外運空運發展股份有限公司), a subsidiary of the Company
Sinotrans & CSC Sinotrans & CSC Holdings Co., Ltd. (中 國 外 運 長 航 集 團 有 限 公司), a wholly state-owned enterprise established under the laws of
the PRC, a wholly owned subsidiary of China Merchants, and the
controlling shareholder of the Company which collectively holds
35.99% of the issued share capital of the Company at the date of
this Report
SSE Shanghai Stock Exchange
SSE Listing Rules Listing Rules of Shanghai Stock Exchange
subsidiary(ies) has the meaning ascribed to it under the SEHK Listing Rules
Supervisory Committee the Supervisory Committee of the Company
SINOTRANS LIMITED8
Chapter 2General Information and Key Financial Indicators
I. COMPANY INFORMATION
Chinese name of the Company 中國外運股份有限公司Chinese abbreviation of the Company 中國外運Foreign name of the Company SINOTRANS LIMITED
Foreign abbreviation of the Company SINOTRANS
Legal representative of the Company Li Guanpeng
II. CONTACT PERSONS AND CONTACT METHODS
Secretary of the Board/
Company Secretary Representative of Securities Affairs
Name Li Shichu Lu Ronglei
Address Sinotrans Building Tower B, Building 10,
No. 5 Anding Road, Chaoyang District,
Beijing, China
Sinotrans Building Tower B, Building 10,
No. 5 Anding Road, Chaoyang District,
Beijing, China
Tel. 8610 52295721 8610 52295721
Fax 8610 52296519 8610 52296519
Email [email protected] [email protected]
III. BASIC INFORMATION
Initial date of registration of the Company 20 November 2002
Registered address of the Company Building A, Sinotrans Plaza, A43 Xizhimen
Beidajie, Haidian District, Beijing, China
Postcode of the registered address of the Company 100082
Office address of the Company Sinotrans Building Tower B, Building 10, No. 5
Anding Road, Chaoyang District, Beijing, China
Postcode of office address of the Company 100029
Company website www.sinotrans.com
Email [email protected]
IV. INFORMATION DISCLOSURE AND PREPARATION LOCATIONS
Name of disclosure newspapers selected
by the Company
China Securities Journal, Securities Daily
Website for publishing the Interim Report
designated by CSRC
www.sse.com.cn
Website for publishing the Interim Report
designated by SEHK
www.hkex.com.hk
Location for Interim Report stock 10/F, Sinotrans Building Tower B, Building 10, No. 5
Anding Road, Chaoyang District, Beijing, China
9INTERIM REPORT 2020
Chapter 2General Information and Key Financial Indicators
V. OVERVIEW OF COMPANY STOCK
Class of share Stock exchange Stock abbreviation Stock code
H Share SEHK Sinotrans 0598
A Share SSE Sinotrans 601598
VI. OTHER RELEVANT INFORMATION
3Applicable □Not applicable
Certified public accountants
engaged by the Company
Name ShineWing Certified Public Accountants LLP
Office address 9/F, Block A, Fuhua Mansion, No. 8 Chaoyangmen
North Street, Dongcheng District, Beijing
Legal counsel engaged by the
Company (As to the PRC
Laws)
Name FenXun Partners
Office address Suite 3501, China World Office 2, No. 1
Jianguomenwai Avenue, Chaoyang District,
Beijing
Legal counsel engaged by the
Company (As to Hong Kong
Laws)
Name Baker & McKenzie LLP
Office address 14/F One Taikoo Place, 979 King’s Road, Quarry
Bay, Hong Kong
Sponsors to continuously
perform their supervisory
function during the Reporting
Period
Name CITIC Securities Company Limited
Office address 21st Floor, CITIC Securities Building, 48
Liangmaqiao Road, Chaoyang District, Beijing
Sponsors to continuously
perform their supervisory
function during the Reporting
Period
Name China Merchants Securities Co., Ltd.
Office address 26th Floor, CMS China Securities Plaza, No. 111
FuHua Rd, Futian District, Shenzhen, Guangdong
Province
Share registrar of A Shares of
the Company
Name China Securities Depository & Clearing Corp. Ltd.
Shanghai Branch
Office address China Insurance Building, 166 East Lujiazui Road,
Pudong New Area, Shanghai
Share registrar of H Shares of
the Company
Name Computershare Hong Kong Investor Services
Limited
Office address Room 1712-1716, 17th Floor, Hopewell Centre, 183
Queen’s Road East, Wan Chai, Hong Kong
Business address in
Hong Kong
Office address Room F and G, 20/F, MG Tower, No. 133 Hoi Bun
Road, Kwun Tong, Kowloon, Hong Kong
Principal bank Name Bank of China
Office address No. 1 Inner Street, Fuxingmen, Xicheng District,
Beijing, China
SINOTRANS LIMITED10
Chapter 2General Information and Key Financial Indicators
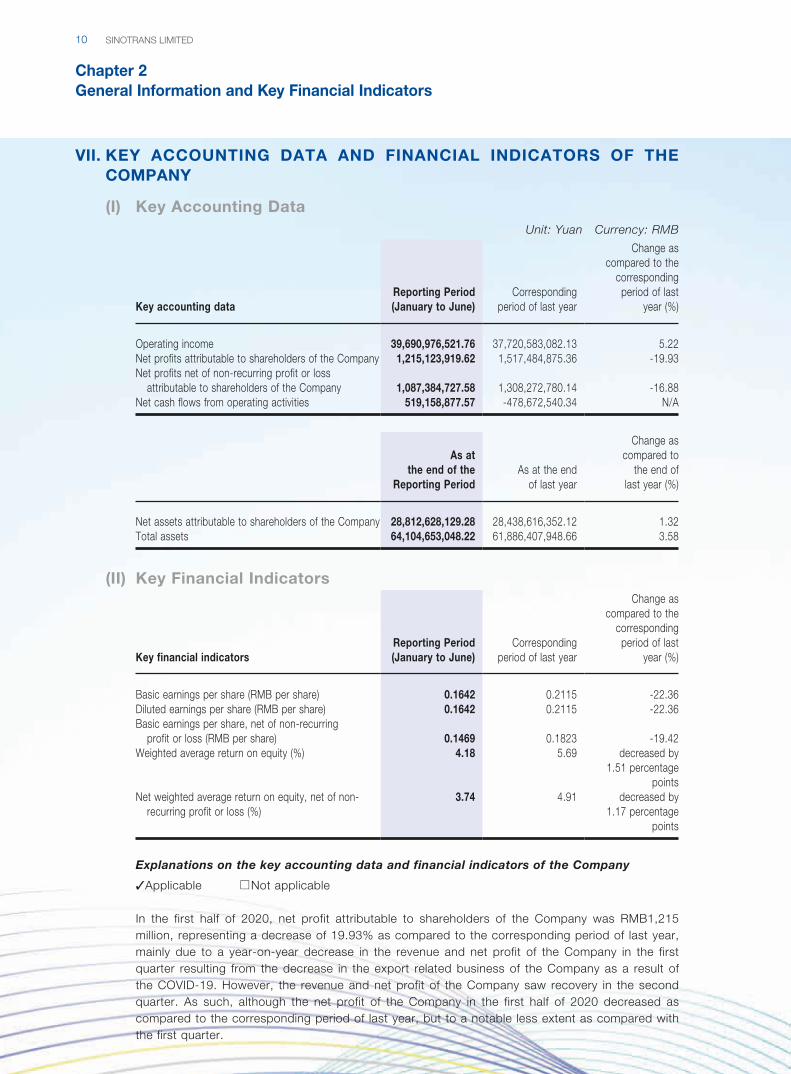
VII. KEY ACCOUNTING DATA AND FINANCIAL INDICATORS OF THE COMPANY
(I) Key Accounting DataUnit: Yuan Currency: RMB
Key accounting dataReporting Period (January to June)
Corresponding period of last year
Change as compared to the
corresponding period of last
year (%)
Operating income 39,690,976,521.76 37,720,583,082.13 5.22Net profits attributable to shareholders of the Company 1,215,123,919.62 1,517,484,875.36 -19.93Net profits net of non-recurring profit or loss
attributable to shareholders of the Company 1,087,384,727.58 1,308,272,780.14 -16.88Net cash flows from operating activities 519,158,877.57 -478,672,540.34 N/A
As at the end of the
Reporting PeriodAs at the end
of last year
Change as compared to
the end of last year (%)
Net assets attributable to shareholders of the Company 28,812,628,129.28 28,438,616,352.12 1.32Total assets 64,104,653,048.22 61,886,407,948.66 3.58
(II) Key Financial Indicators
Key financial indicatorsReporting Period (January to June)
Corresponding period of last year
Change as compared to the
corresponding period of last
year (%)
Basic earnings per share (RMB per share) 0.1642 0.2115 -22.36Diluted earnings per share (RMB per share) 0.1642 0.2115 -22.36Basic earnings per share, net of non-recurring
profit or loss (RMB per share) 0.1469 0.1823 -19.42Weighted average return on equity (%) 4.18 5.69 decreased by
1.51 percentage points
Net weighted average return on equity, net of non-recurring profit or loss (%)
3.74 4.91 decreased by 1.17 percentage
points
Explanations on the key accounting data and financial indicators of the Company
3Applicable □Not applicable
In the first half of 2020, net profit attributable to shareholders of the Company was RMB1,215 million, representing a decrease of 19.93% as compared to the corresponding period of last year, mainly due to a year-on-year decrease in the revenue and net profit of the Company in the first quarter resulting from the decrease in the export related business of the Company as a result of the COVID-19. However, the revenue and net profit of the Company saw recovery in the second quarter. As such, although the net profit of the Company in the first half of 2020 decreased as compared to the corresponding period of last year, but to a notable less extent as compared with the first quarter.
11INTERIM REPORT 2020
Chapter 2General Information and Key Financial Indicators
VIII. ACCOUNTING INFORMATION DIFFERENCES BETWEEN DOMESTIC AND OVERSEAS ACCOUNTING STANDARDS
□Applicable 3Not applicable
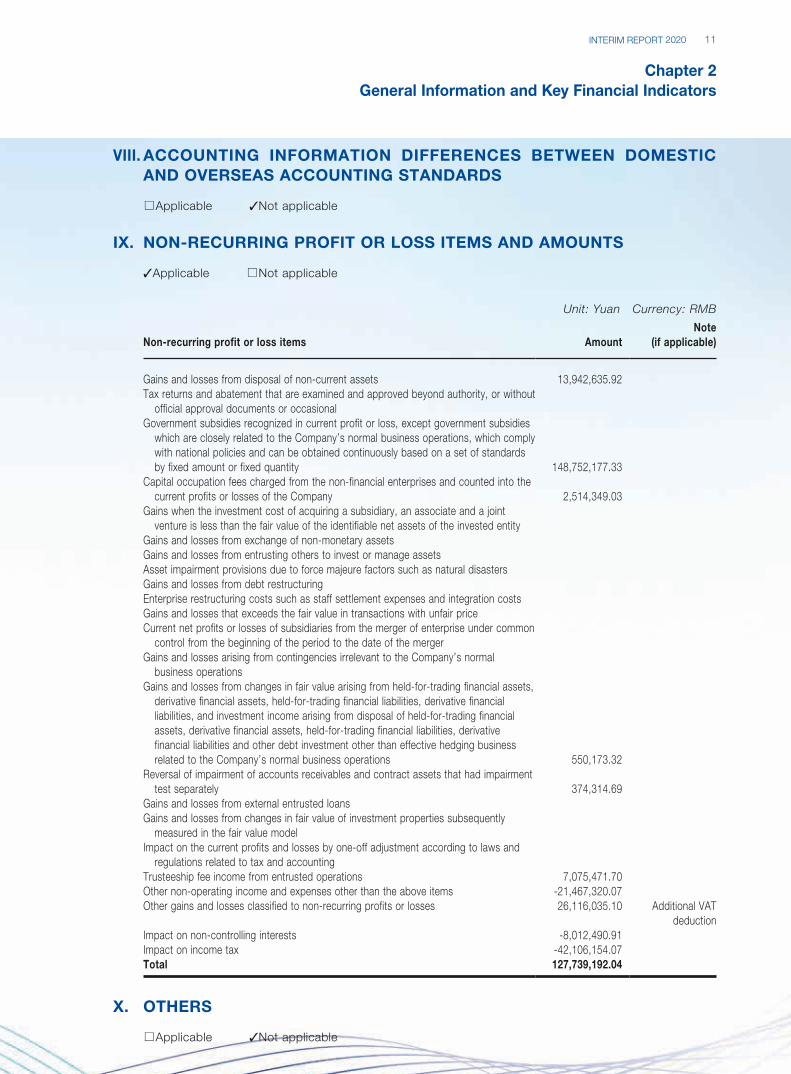
IX. NON-RECURRING PROFIT OR LOSS ITEMS AND AMOUNTS
3Applicable □Not applicable
Unit: Yuan Currency: RMB
Non-recurring profit or loss items AmountNote
(if applicable)
Gains and losses from disposal of non-current assets 13,942,635.92Tax returns and abatement that are examined and approved beyond authority, or without
official approval documents or occasionalGovernment subsidies recognized in current profit or loss, except government subsidies
which are closely related to the Company’s normal business operations, which comply with national policies and can be obtained continuously based on a set of standards by fixed amount or fixed quantity 148,752,177.33
Capital occupation fees charged from the non-financial enterprises and counted into the current profits or losses of the Company 2,514,349.03
Gains when the investment cost of acquiring a subsidiary, an associate and a joint venture is less than the fair value of the identifiable net assets of the invested entity
Gains and losses from exchange of non-monetary assetsGains and losses from entrusting others to invest or manage assetsAsset impairment provisions due to force majeure factors such as natural disastersGains and losses from debt restructuringEnterprise restructuring costs such as staff settlement expenses and integration costsGains and losses that exceeds the fair value in transactions with unfair priceCurrent net profits or losses of subsidiaries from the merger of enterprise under common
control from the beginning of the period to the date of the mergerGains and losses arising from contingencies irrelevant to the Company’s normal
business operationsGains and losses from changes in fair value arising from held-for-trading financial assets,
derivative financial assets, held-for-trading financial liabilities, derivative financial liabilities, and investment income arising from disposal of held-for-trading financial assets, derivative financial assets, held-for-trading financial liabilities, derivative financial liabilities and other debt investment other than effective hedging business related to the Company’s normal business operations 550,173.32
Reversal of impairment of accounts receivables and contract assets that had impairment test separately 374,314.69
Gains and losses from external entrusted loansGains and losses from changes in fair value of investment properties subsequently
measured in the fair value modelImpact on the current profits and losses by one-off adjustment according to laws and
regulations related to tax and accountingTrusteeship fee income from entrusted operations 7,075,471.70Other non-operating income and expenses other than the above items -21,467,320.07Other gains and losses classified to non-recurring profits or losses 26,116,035.10 Additional VAT
deductionImpact on non-controlling interests -8,012,490.91Impact on income tax -42,106,154.07Total 127,739,192.04
X. OTHERS
□Applicable 3Not applicable
SINOTRANS LIMITED12
Chapter 3Business Overview
I. DESCRIPTION OF THE PRINCIPAL BUSINESS, OPERATING MODEL AND INDUSTRY OF THE COMPANY DURING THE REPORTING PERIOD
(I) Principal Business of the Company and Its Business ModelThe Group is a leading integrated logistics service provider and integrator in the PRC. Adhering
to the mission of the enterprise of “creating a logistics ecology system connecting the world
to successfully promote industrial progress”, leveraging on its comprehensive service network,
abundant logistics resources, strong professional capabilities of logistics solutions, and leading
supply chain logistics model, the Group provides customers with customized logistics solutions
and integrated whole supply chain logistics services.
The Group’s principal businesses include logistics, forwarding and related business and
e-commerce business. As the core business, logistics business focus on high-growth, high-
value-added sub-industries and their upstream and downstream industries, so as to promote
high-quality industrial development. As the cornerstone business, forwarding and related
business provides support for the development of logistics business. As the innovative business,
e-commerce business combine internet and logistics technology to promote the Company’s
transformation and upgrading to a digital and smart logistics enterprise.
1. Logistics
Based on the different needs of customers, Sinotrans provides tailor-made integrated
logistics solutions covering the entire value chain and ensures the smooth implementation of
such solutions, mainly including contract logistics, project logistics, chemical logistics, cold
chain logistics and other logistics services.
Contract logistics is based on long-term cooperation relationship to provide customers
with industry supply chain logistics management services, including procurement logistics,
production logistics, sales logistics and reverse logistics, and also provide value-added
services such as information services, process optimization, logistics consulting, and
supply chain finance. The contract logistics service of the Company has been carried
out cluster management according to the target industries and possess leading solution
capabilities in multiple industries and fields, such as consumer goods and retail, automobile
and accessories, technology & electronics products, medical and health, and buyer
consolidation. The Company has established good long-term cooperative relationship with
many well-known enterprises at home and abroad.
Project logistics mainly covers the countries and regions along the “Belt and Road”
and provides design and implementation of end-to-end one stop logistics solutions to
export engineering equipments and materials from the PRC for Chinese international
EPC enterprises in industries such as electric power, petrochemical, metallurgical mining,
infrastructure and rail vehicles. The services include but are not limited to the provision
of logistics solution design, arranging sea, air, and land transportation, warehousing,
packaging, customs declaration and inspection, port transit, transportation of large items,
import and export policy consultation, etc. The Company has operated many logistics
projects in approximately 100 countries and regions around the world and has extensive
project experience.
13INTERIM REPORT 2020
Chapter 3Business Overview
Chemical logistics mainly serves refined chemical industry customers, and provides supply
chain solutions and logistics services to customers, which mainly include warehousing,
transportation and distribution, international freight forwarding and multimodal transportation
of hazardous chemicals and ordinary packaged chemicals. The Company has a set of
integrated service system for warehousing, transportation (including liquid tank container),
freight forwarding, multimodal transport and tax declaration, coordinates in different regional
subsidiaries in China, and forms resource network layout of five regions, namely Northeast
China, North China, Central China, East China and South China.
Cold chain logistics mainly serves processing, manufacturing and circulation enterprises
in food and beverage, import and export trade customers and chain catering enterprises,
providing cold chain logistics service of warehousing + line-haul transportation + distribution
to customers. Cold chain logistics includes three principal businesses, namely the integration
business of cold chain, warehouse and delivery, international supply chain integrated
business of imported fresh merchandises, and line-haul transportation of online freight
for fresh agricultural products. The Company has established national cold chain logistics
network layout, and has strong overall solution service ability of warehousing, line-haul
transportation and distribution, whole process cold chain temperature control, tracking, and
the ability of design, investment construction and operation management of high standard
cold storage.
The vision of the Company’s logistics business is to extend the business to value chain
consolidation. As the core business of the Company, logistics business will stick to the
target of “customized solution, industrialized sale, consolidated service, and unified
operation”, let the solution lead the whole process, focus on selected target industries,
deepen and refine industrial chain, vertically extend the business, and horizontally replicate
experience, to forge expertise and advantage of scale in target industries.
2. Forwarding and related business
The forwarding and related business of Sinotrans mainly includes sea freight forwarding, air
freight forwarding, railway freight forwarding, shipping agency, storage and terminal services
and etc. Sinotrans is the largest freight forwarding company in China and has an extensive
service system covering China and radiating the world.
In respect of sea freight forwarding, Sinotrans mainly provides customers with multi-
link logistics services related to shipping such as booking space from shipping companies,
arranging transportation, container delivery, container loading, storage, port collection and
distribution, customs declaration and inspection, distribution and delivery. Sinotrans is one
of the world’s leading sea freight forwarding service providers, handling more than 10 million
TEUs of containers each year, and is capable of providing whole supply chain logistics
services from major ports in China to more than 70 major trading countries and regions.
SINOTRANS LIMITED14
Chapter 3Business Overview
In respect of air freight forwarding, Sinotrans mainly provides professional air freight
forwarding services such as pick-up and dispatch, customs declaration and inspection,
warehousing, packaging, booking (including charter and block space services) and handling,
trunk air line freight forwarding and trucking transit services. The self-owned overseas air
freight forwarding network covers three major continents of Asia, Europe and North America,
and the agency network covers nearly 50 countries and regions, and has operated 28
standardized whole chain products. As a leading air freight forwarding company in China,
Sinotrans has accumulated extensive industrial experience and entered into strategic
cooperation agreements with major domestic and international airlines. With sufficient
transportation capacity resources, Sinotrans is able to provide customers with full-process,
visualized and standardized whole supply chain air related logistics services.
In terms of railway freight forwarding, Sinotrans is a leading railway freight forwarding
service provider in China. It is able to provide customers with railway transportation
and information services in bulk cargo, containers and in a variety of ways, including
integrated whole supply chain service like domestic railway transportation, international
railway transportation (including transit railway transportation) and sea-rail multi-modal
transportation throughout China and countries and regions along the “Belt and Road”. Since
its participation in China Europe Railway Express in 2015, Sinotrans has launched more than
40 routes of China Europe and China-Central Asia in Dongguan, Changsha, Shenyang, Xi’an,
Weihai, Xinxiang and other places, dispatched 3,518 trips in total.
In terms of shipping agency, Sinotrans is a leading shipping agency service company
in China, with branches in more than 70 ports along the coast of China and the Yangtze
River, and representative offices in Hong Kong SAR, Japan, Korea, Singapore, the United
Kingdom, Germany and Thailand, providing shipping companies with services such as port
arrival and departure, documentation, ship supplies and other ship related services at ports.
In terms of storage and terminal services, Sinotrans provides customers with services
such as storage, container consolidating and devanning, cargo loading and unloading,
dispatching and distribution, etc. Sinotrans has rich resources of warehouses and container
yards, and 8 self-operated river terminals in Guangdong province and Guangxi province,
which are important base for the Company to provide high-quality and efficient freight
forwarding and integrated logistics services.
Forwarding and related business is the cornerstone of development of logistics segment, it
will closely stick to the customers’ requirement, emphasize on customer-driven, the valuation
creation and model innovation, extend the service chain, mine the value of customers and
suppliers, push forward the construction of platform and products, so that to gradually turn
the service to whole supply chain logistics.
15INTERIM REPORT 2020
Chapter 3Business Overview
3. E-commerce business
Sinotrans’ e-commerce business includes cross-border e-commerce logistics, logistics
e-commerce platform and logistics equipment sharing platform. The cross-border
e-commerce logistics business mainly refers to the whole-chain and partial chain
professional logistics service provided to e-commerce customers. The products and
services cover Europe, America, the Middle East, Japan, Korea, Southeast Asia and
other regions. The scope of services includes door-to-door collection, domestic (bonded)
warehouse management, import and export customs clearance, international transportation,
overseas warehouse management, last mile distribution, etc. Logistics e-commerce
platform refers to the provision of various public services by the Company to the platform
customers through the unified online logistics e-commerce platform, namely Y2T, such as
information services such as visualization and tracking, handling services, settlement agency
services, freight factoring and technical services. Its products cover logistics services such
as Sinotrans E-LCL, online freight (trucking transportation), customs service, air freight
forwarding, railway and multimodal transport, and has launched a number of whole-chain
and sea-rail intermodal transportation products. Logistics equipment sharing platform
refers to the Company providing logistics equipment leasing service, including container and
mobile fridge container, tracking and monitoring services.
The e-commerce business of the Company aims at turning into platform and building
ecology system. We will grasp the two main streams of logistics e-commerce and
e-commerce logistics, consolidate internal and external resources by innovation of
technologies and business model to finally realize online operation of all principal businesses.
Based on fully promoting the online of major business, we will intensify our efforts to develop
the cross-border e-commerce logistics, actively explore logistics e-commerce platform
model, strengthen scientific and technological innovation, promote the link with the industrial
Internet, and form a “four streams into one” platform ecosystem.
(II) Industry Development1. Strong government support and guidance highlighting policy advantages of logistics
In 2020, the outbreak of the COVID-19 sparked a chain of events including the restructuring
of the supply chain of the manufacturing industry at a global scale. Being a key force for
the resumption of work and production as well as the safeguard of state industry security,
logistics has received high degree of concerns from all sectors of the society. Against the
background, the government has successively issued various documents including the
Guidance on Proactive and Orderly Promotion of the Resumption of Work and Production
While Conducting Effective Epidemic Prevention and Control (《關於在有效防控疫情的同時積極有序推進復工復產的指導意見》), Notice on the Furtherance of Establishing Pilots of Supply
Chain Innovation and Application (《關於進一步做好供應鏈創新與應用試點工作的通知》) and
Notice on the Implementation Opinions for Further Reducing the Cost of Logistics (《關於進一步降低物流成本實施意見的通知》). Besides, the government also initiated the construction of
national logistics hub layout for 2020, supported logistics companies to expedite the layout
of hub + channel + networks, accelerated the process of digitalization and encouraged
market-oriented merger and acquisition of large-scale logistics companies, as well as
promoting the transformation and upgrading of, and quality and efficiency enhancement
of the logistics industry, thus providing strong and robust support for the sustainable and
health development of the national economy.
SINOTRANS LIMITED16
Chapter 3Business Overview
In terms of the cross-border e-commerce business, in 2020, the State Council decided to
establish further 46 cross-border e-commerce comprehensive experimental zones. Together
with the 59 ones previously approved to be established, there will be an aggregate of 105
cross-border e-commerce comprehensive experimental zones nationwide, contributing to the
establishment of the development layout with links running eastward and westward, across
land and over sea. In addition, the State Council also launched various measures related to
e-commerce such as publishing customs supervisory methods of 9710 for 2B business and
9810 for overseas warehousing, cutting down the import tariff rate for overseas purchases,
to promote the development of cross-border e-commerce trade, which has brought about
unprecedented opportunities for the development of cross-border e-commerce logistics.
2. Market transformation accelerated as the logistics market was still in the recovery
phase
From January to June 2020, the national total social logistics value amounted to RMB123.4
trillion, representing a year-on-year decrease of 0.5% in terms of comparable prices,
the total social logistics costs amounted to RMB6.5 trillion, representing a year-on-year
decrease of 4.0%, and the total revenue recorded in logistics industry amounted to RMB4.6
trillion, representing a year-on-year decrease of 2.7%, with remarkably narrowed drops as
compared to that of the first quarter, an evidence that the logistics market was undergoing
gradual recovery. Structurally, demand for agricultural products logistics recorded steady
growth, demand for industrial logistics experienced slow yet steady growth, while demand
for consumption and livelihood related logistics resumed at a faster rate.
In the first half of 2020, amid the severe and sophisticated external environment of foreign
trade development for China, the total import and export value achieved RMB14.24
trillion, representing a year-on-year decrease of 3.2%, among which, the export value
amounted to RMB7.71 trillion, representing a year-on-year decrease of 3% and the import
value amounted to RMB6.53 trillion, representing a year-on-year decrease of 3.3%. On
a quarter-on-quarter basis, the import and export value stabilized in the second quarter
with significantly narrowed drop seen as compared with that of the first quarter upon the
fluctuation experienced in the first quarter.
The transformation of the logistics market accelerates. On one hand, the fact that order
and business volume of logistics companies is undergoing sluggish recovery but is still at
a slower pace than that of the corresponding period of previous years, will pose greater
pressure of existence on some enterprises. However, leading enterprises with strong
competitiveness will maintain advantages in the market and embrace opportunities arising
from the long-term strategic layout, which is expected to continuously boost sectoral
concentration. On the other hand, the boundary of logistics industry gets increasingly
fuzzy. Except for the existing internet enterprises and port and shipping enterprises that
step into logistics industry on a crossover basis, upon the outbreak of the pandemic, some
enterprises that conduct business flow began to restructure their logistics system under
supply chain.
17INTERIM REPORT 2020
Chapter 3Business Overview
3. The China Containerized Freight Index showed an overall downward trend with
gradual recovery
From January to May 2020, affected by the COVID-19, China Containerized Freight Index
showed an overall downward trend on a month-on-month basis and an upward trend on
a year-on-year basis. In June 2020, as the impacts of the COVID-19 were mitigated to
some extent, all countries had successively taken measures to stimulate recovery of the
economy, thus boosting demands for transportation in the market. Meanwhile, shipping
companies continued to implement the measures to suspend their shipping service of
trade routes with relatively greater shipping capacity, and driven by the generally improved
fundamental market, the freight of the majority of trade routes picked up. In June 2020,
China Containerized Freight Index averaged at 840.88 points, representing a month-on-
month increase of 0.4%, which was a rebound from a successive 4-month decline. In terms
of the performance of all trade routes, the freight of Europe Route and Mediterranean Route
stabilized and recovered, the market freight of North America Route ascended and that of
the Australia & New Zealand Route increased gradually and slightly. From January to June
2020, the container throughput of terminals in China was 120.19 million TEUs, representing
a decrease of 5.4% as compared to the corresponding period of last year.
4. Global air cargo transportation volume decreased with new features emerged in the
international aviation industry
Under the influences of the policies launched in various countries and the COVID-19, the
international air logistics mainly featured with “one decrease, one increase and two changes”
in the first half of 2020. The “one decrease” represents the sharp decrease in transportation
capacity resources. The global air cargo transportation recorded a year-on-year decrease of
more than 18% in the first half of the year, among which the airfreight export volume in the
Middle East and Southeast Asia region and Europe recorded the largest decrease of 32%
and 22%, respectively. The “one increase” represents the dramatic increase in the price of
freight. In the first half of 2020, the average global airfreight rate increased by 48%, with the
Asian-Pacific region recording the largest increase of 76%. The “two changes” represents
the change in structure of transport capacity from focusing on bellyhold space of passenger
aircrafts to cargo aircrafts and passenger-converted cargo aircrafts, and the change in
structure of the source of cargo, such as the surge in the quantity of emergency materials
and the disruption of other supply chain.
SINOTRANS LIMITED18
Chapter 3Business Overview
5. China Europe Railway Express played as the role of a strategic channel and served
as an important support for stabilizing international supply chain
During the outbreak of COVID-19, the Country intensively launched various documents
and policies to support for protection of the channel and promotion of foreign trade, and
guaranteed the channel of China Europe Railway Express. As a key project under the
“Belt and Road” Innitiative, China Europe Railway Express experienced growth against
unfavourable macro-economic conditions in terms of the number of trips in the first half
of 2020, with an accumulated 5,122 trips recorded, representing an increase of 36% as
compared to the corresponding period of last year. The number of trips in a single month
hit the historical record in consecutive four months. It has accelerated the resumption of
work and production. As China Europe Railway Express has become an important channel
and hub to support the trade between China and Europe and to clear the transportation
of pandemic prevention supplies during international cooperation, its function of stabilizing
foreign trade and promoting economic growth was highlighted.
II. EXPLANATION ON MATERIAL CHANGES IN MAJOR ASSETS OF THE COMPANY DURING THE REPORTING PERIOD
3Applicable □Not applicable
Significant changes in major assets of the Company during the Reporting Period are detailed in “(III)
Analysis of Assets and Liabilities” of “II. MAJOR BUSINESS CONDITIONS DURING THE REPORTING
PERIOD” in “Chapter 4 Management Discussion and Analysis of Business Performance (Report of the
Board)” in this Report.
Including: overseas assets RMB20,478,608,586.37 (Unit: Yuan Currency: RMB), accounting for 31.95%
of the total assets.
III. ANALYSIS OF CORE COMPETITIVENESS DURING THE REPORTING PERIOD
3Applicable □Not applicable
1. Well-established Service Network and Abundant Logistics ResourcesThe Group has an extensive and comprehensive domestic service network and overseas service
network. The domestic service network covers 32 provinces, autonomous regions, municipalities
and Hong Kong SAR in China. The Group has more than 10 million sq.m. of land in China, more
than 4 million sq.m. of warehouses and eight river terminals with more than 3,700 meters of
coastal line, while leasing approximately 3 million sq.m. of warehouses. The self-owned overseas
network has covered 38 countries and regions with 76 business outlets worldwide. The Group has
abundant logistics resources such as logistics centers, container freight stations and terminals in
coastal ports, key domestic cities and overseas regions. Meanwhile, the Group also implements
industry-finance integration and industry synergy with China Merchants Group’s financial, trading,
industrial park development, shipping and port business segments around the world to provide
customers with access to global logistics services.
19INTERIM REPORT 2020
Chapter 3Business Overview
2. Strong Logistics Solution CapabilitiesWith strong logistics resource integration, coordination and operation capabilities, as well as
extensive operating experience in improving the deployment of goods and equipment of all
aspects of production, manufacturing and engineering projects of customers, the Company may
deliver production resources scattered around the world to the designated locations of customers
as scheduled. For actual operations, the Company has experienced industry teams and overseas
teams familiar with the import and export policies of various countries. They can integrate and
coordinate the logistics resources in various countries, and formulate customized and whole
supply chain solutions which include all complicated logistics segments. The Company focuses
on key industries, including consumer goods and retail, automobile and accessories, technology &
electronics products, medical and health, buyer consolidation, engineering energy, chemical, and
cold chain, and provides tailor-made integrated logistics solutions covering the entire value chain
to such industry leaders and their upstream and downstream customers, and ensure their smooth
implementation. The Company has accumulated extensive industry-oriented service experience
and has established industry-leading advantages in full-value chain logistics services.
3. Leading Supply Chain Logistics Service ModelFollowing the development trend of the industry and in response to the changes in customer
demand, Sinotrans keeps innovating its logistics service model by the reorganisation of forwarding
and related business products to improve product research, development and design capability.
It focuses on six supply chain solution product systems, namely full container load, less than
container load, railway multimodal transport, air freight, bulk cargo logistics and comprehensive
carrier logistics services and increases the construction of water, land and air fright channels etc.
and is capable of providing end-to-end one-stop whole supply chain logistics service to domestic
and international enterprises and satisfying various logistics demands of customers in a fast and
high-efficient manner.
4. High Brand Awareness, Good Business Reputation and Abundant Customer and Supplier ResourcesWith 70 years of history and experience, the Group has established good brand awareness in
the logistics industry and has been granted many important awards in the industry. As an AAAAA
logistics enterprise rated by the China Federation of Logistics & Purchasing, Sinotrans has
consecutively won the first prize of the Top 100 Logistics Enterprises in China and the first prize
of the Top 100 International Freight Forwarding Logistics in China, and has been awarded as
the “Most Competitive (Influential) Logistics Enterprises in China” for many times. As the largest
third-party logistics service provider in China, the Company has good reputation and image in
terms of both customers and suppliers. On the one hand, Sinotrans has established long-term
and stable cooperative relationship with many well-known domestic enterprises and multinational
corporations, and has been well recognized by customers. On the other hand, based on its own
stable customer resources and strong logistics service capabilities, Sinotrans maintains good and
stable partnership with many suppliers, such as internationally renowned shipping companies and
airlines.
SINOTRANS LIMITED20
Chapter 3Business Overview
5. Innovative Technology to Accelerate Digital Transformation and Take the Lead in Developing Smart LogisticsThe Company continues to enhance the coordination of digitalization and innovation, and
strengthens the top-level design and the implementation of all scenarios. It has formulated a digital
transformation plan, established a smart logistics technology center, established a research and
development team of more than 500 people, and established Sinotrans Innovation & Technology
Co., Ltd. (中外運創新科技有限公司) as the operating platform for internet-based products. In the
meantime, the Company accelerates the application and promotion of logistics technology of
ABCDT (Artificial Intelligence, Blockchain, Cloud Computing, Big Data, Internet of Things). Many
technologies including intelligent platforms for processing of documents, logistics receiving and
delivering goods sorting and identification system, intelligent fridge containers, blockchain-based
golden chain logistics platform, intelligent scheduling algorithms, IoT platform plus Heimdallrs
(monitoring system) modular equipment have been applied and put into operation.
6. Advocation of Sinotrans Culture of “Customer as Priority, Value as Base, Innovation as Spirit and Hard-working as Foundation”The long-term development of an enterprise largely depends on its culture and value. The Group
has its distinct culture orientation and value proposition. During the 70 years development, the
Company always puts customer at the first place and takes value creation as the evaluation
criterion, innovation as the spirit for sustainable development and hard-working as the core for
success. The Company believes “The customer is priority” and forms a distinct customer culture
by returning to the basics of operation, being customer-oriented, taking customer satisfaction
as the highest performance indicator and insisting on customer-first service philosophy. The
Company takes value as its base and develops a distinct culture of value by setting up multi-
dimensional values, insisting on value-creation as its core principle and taking value-creation as
the basic standard for all operating activities. The Company deems innovation and reformation
as the spirit and establishes a distinct culture of innovation and reformation, pursuant to which
the Company sticks to deem innovation as destiny, reformation as genes, embracing changes
as mutual attitudes, and concept of innovation and reformation as the spirit to stimulate the
development of the Company. The Company also takes hard-working as the core for success
and creates a distinct culture of hard-working by persisting in a pragmatic attitude of unremitting
efforts.
Chapter 4Management Discussion and Analysis of Business Performance
(Report of the Board)
21INTERIM REPORT 2020
I. DISCUSSION AND ANALYSIS OF BUSINESS PERFORMANCE
(I) Overall operations during the Reporting PeriodIn the first half of 2020, the COVID-19 oppressed significant impact on the economic, trade and logistics industry. Since the outbreak of the COVID-19, the Company has actively performed its social responsibility while conducting practical and effective pandemic prevention and control. Under the severe situation that the international and domestic transportation suspended operation, the Company has taken lead in construction of the main logistics network for anti-pandemic materials leveraging its advantages of “five channels and one platform” (五通道、一平臺), thus fulfilling the tasks of transporting pandemic prevention materials at home and abroad. In the first half of 2020, the Company organized 348 international charter flights and 670 international cargo trains in total. Sinotrans transported approximately 4,000 tonnes of pandemic prevention materials through trucking transportation for “Emergency Delivery”. Cumulatively, Sinotrans has transported 20.6 thousand tonnes of anti-pandemic materials to more than 70 countries and regions worldwide, thereby firmly performing its commission as a state-owned enterprise that “when the Country is in need, Sinotrans delivers”.
Amidst the complex and severe economic situation, Sinotrans has conscientiously implemented the approach of “strategy-oriented development to pursue quality and efficiency for the entire operation” (以 戰 略 引 領 全 局, 以 質 效 貫 穿 始 終”). For operating management, the Company integrated and utilized logistics network advantages through construction of “enhancing products and strengthening operation”. On the other hand, the Company fortified control of cost and expenses, focused on improvement of quality and efficiency, and achieved excellent effects in various works. In the first half of 2020, the Company achieved operating income of RMB39,691 million, representing an increase of 5.22% as compared to the corresponding period of last year, which was mainly attributable to the Company successfully turned the challenges into opportunities during the Reporting Period, actively promoted the development of major business such as Sinotrans E-LCL, cross-border e-commerce logistics and international cargo trains, the Company also completed the acquisition of 100% equity interests of KLG Group which contributed revenue of RMB678 million. Net profit attributable to shareholders of the Company was RMB1,215 million, representing a decrease of 19.93% as compared to the corresponding period of last year, mainly due to a year-on-year decrease in the revenue and net profit of the Company in the first quarter resulting from the decrease in the export related business of the Company as a result of the COVID-19. However, the revenue and net profit of the Company saw recovery in the second quarter. As such, the net profit of the Company in the first half of 2020 decreased as compared to the corresponding period of last year, but to a notable less extent as compared with the first quarter.
1. Expediting business transformation and perfecting product system
In the logistics business, we expedited transformation to the value chain integration and concentrated into the refined high value-added sub-market with high growth potential. Based on the coverage of major industries, in the first half of 2020, we intensified expansion of our business to fashion industry and successfully expanded our logistics business for a number of key customers. We promoted product-based construction to provide major customers with tailor-made “inventory health analysis” product and created digitalized operation management and control solutions. We extended the service value chain focusing on our core customers’ demands for cross-border logistics. We bolstered digitalization driver and resource sharing and created a contract warehouse sharing system.
SINOTRANS LIMITED22
Chapter 4Management Discussion and Analysis of Business Performance (Report of the Board)
In the first half of 2020, positive progress was made in the logistics business of key industries. (1) For the consumer goods and retail industry, the loyalty of major customers continued to improve. We successfully renewed agreements with several major customers and further fortified our long-term partnership. (2) For the automobile and spare parts business, we started to engage in car transportation business and won the bid for car transportation business of BMW’s certified cars in China. (3) For the technology & electronic industry, we expanded to the subdivided areas and won the bids of projects such as Baidu IDG logistics project. “Smart manufacturing” started to become a new growth driver in the technological and electronic industry. (4) For the medical and health industry, we continuously developed customers such as Sinopharm (中國醫藥) and Beiyi Medicine (北醫醫藥) and extended our service chain to the upstream and downstream of the medical industry. (5) For the buyer consolidation business, we expanded to emerging markets and successfully entered into agreements with famous brands in retail and other industries in South America. (6) For the chemical industry, we optimized the resource deployment and officially initiated the construction project (phase II) of hazardous chemical logistics base in Shanghai and commenced the construction project (phase II) of hazardous chemical logistics base in Nantong. The practical availability of key resources in key projects laid a requisite foundation for the development of the chemical logistics industry. (7) For the cold chain logistics, we developed new markets continuously, improved operational capabilities, and optimized business structure, thus realizing the increase of income and profit.
In the forwarding and related business, we speeded up transformation to the whole-process supply chain, fortified integration capability throughout the network and established a system of six products systems including full container load, less than container load, railway multimodal transportation logistics, air freight, bulk cargo logistics, and carrier integrated logistics services. In particular, less than container load, railway multimodal transportation and air freight services recorded an increase amidst the pandemic. In the first half of 2020, Sinotrans E-LCL service platform cumulatively delivered 2,050 thousand cubic meters of cargo, representing an increase of 12.1% as compared to the corresponding period of last year; international cargo trains cumulatively ran 670 trips, representing an increase of 41.6% as compared to the corresponding period of last year; and the revenue from air freight services increased by nearly 30%, while profit increased by 1.3 times by leveraging higher freight price to conduct precise marketing.
The Company expedited optimization of construction of freight channels by water, land and air. For water freight channel, we strongly boosted the concentrated procurement of shipping capacity for Southeast Asia route. For land freight channel, we made concentrated procurement of 375 trains in the first half of 2020, firmly supporting the delivery of international cargo trains service. For air freight channel, we cumulatively provided customers with 268 temporary charter flights covering Middle East, Asia, Europe and North America, including 225 flights converted from passenger planes and 43 flights cargo planes.
In the e-commerce business, we expedited transformation to platform and ecologic system, intensified full-scenario linkage capability and public aggregation capability, accelerated the online operation of full-chain products and the standardization and sharing operation of the three customs service sharing centers, and bolstered the linkage with the transaction platform.
23INTERIM REPORT 2020
Chapter 4Management Discussion and Analysis of Business Performance
(Report of the Board)
In the first half of 2020, the Company continued to optimize services and bolstered the
sales and marketing towards large scale e-commerce customers. We also improved the
construction of cross-border e-commerce logistics system and upgraded and iterated
the existing structure, order management, reporting management and data docking
functions of the relevant main system, added new functions such as product management,
charging management, pickup and delivery operation, and online services, and expedited
implementation and systematic deployment of regional companies. We intensif ied
construction of main route, channels and network and paid attention to the access of
resources in strategic core regions. In the first half of 2020, we established the customs
clearance, truck transportation and terminal delivery service system throughout Europe
based on Hangzhou-Liege charter flights, taking 80 flights in total. We developed the route
from Ningbo/Shanghai to the Port of Long Beach, Los Angeles, the USA, and also provided
customs clearance of USA terminal sea freight packages and FBA (Fulfillment by Amazon)
and other products and conducted delivery of small packages within the USA. We also
opened up sites in Zhengzhou, Changsha and Xi’an and developed China Europe Railway
Express e-commerce export service products.
2. In-depth resource integration with continuous improvement of two strategic
deployments
For overseas deployment, Sinotrans continued to promote region-based management and
network restructuring in Southeast Asia, Africa, the Middle East and South Asia during the
Reporting Period, with improved overseas localized service capabilities. In the first half of
2020, the Company completed the acquisition of 100% equity interests in KLG Group,
which effectively expanded the European network and formed effective synergy with various
existing businesses, representing a good beginning for capital operation effectiveness.
For asset deployment, the Company has positioned Sinotrans Logistics Investment Holdings
Co., Ltd. (中外運物流投資控股有限公司) as the unified investment entity of strategic logistics
resources and new logistics facilities in the Group, which further guaranteed its infrastructure
investment management organization. Meanwhile, it closely followed up and studied
the relevant policies of logistics real estate, practically explored the feasibility of asset
securitization, private equity fund and cooperation development and continued to promote
the separation of light and heavy assets within the Group.
3. Insisted on innovation-driven approach with ful l acceleration of digital
transformation
In the first half of 2020, the Company fully launched digital transformation by setting up a
Digital Transformation Office (DTO), and helped to improve quality and efficiency through
smart logistics, with full acceleration of digital transformation.
The first was to empower the resumption of work and production with information
technology. It improved telecommuting capabilities with information technology internally,
and externally empowered customers online services. Logistics Toolbox products helped the
customs service sharing centers to conduct multi-places coordination, the Data Assistant
integrated business orders, customers, finance, risk and settlement data, and visualization
helped the Company to win the battle against the pandemic.
SINOTRANS LIMITED24
Chapter 4Management Discussion and Analysis of Business Performance (Report of the Board)
The second was to help reduce costs and increase efficiency with smart logistics.
The Company continued to deepen the R&D and application of ABCDT smart logistics
technology in combination with full-scenario and full-chain logistics. The application of such
technologies as document recognition processing, smart planning of historical data, smart
scheduling and Internet of Things (IoT) platforms has effectively reduced logistics costs
and promoted streamlining operation in multiple scenarios such as Sinotrans E-LCL, cross-
border e-commerce logistics, customs service sharing center, chemical logistics short-
distance transportation, regional distribution center (RDC) receiving and delivering cargo
identification and sorting, which increasingly demonstrated its influence with customers and
the effect of cost reduction and efficiency enhancement.
During the Reporting Period, the Company newly launched the smart document preparation
service, together with the smart document checking service to support the document smart
processing platform to provide integrated services for the customs service sharing center
and Sinotrans E-LCL; completed R&D and commercialization of the receiving and delivering
cargo identification and sorting system with independent intellectual property rights; and
completed the implementation of warehouse automation system for chemical logistics and
Pudong warehouse of Sinotrans E-LCL.
(II) Highlights of the Business1. Completion of the acquisition of KLG Group
Breakthrough in the European ground operation network
In the first half of 2020, Sinotrans exercised the second step of the transaction as agreed in
the Share Purchase Agreement to complete the acquisition of remaining 20% equity interests
of KLG Group, thus KLG Group became a wholly-owned subsidiary of the Company.
The acquisition of KLG Group is an important step for Sinotrans to exercise the overseas
strategy and expand the overseas channel. KLG Group proved its strong supplementary
and supporting function as Sinotrans’ European ground operation extension by excellent
performance in the first half of 2020. Despite the impact of COVID-19, KLG Group managed
to realize revenue of equivalent to RMB678 million and operating profit to more than 74
million. At the same time, KLG Group has initiated the full business coordination with
Sinotrans domestic business network, to jointly serve the existing customers and explore the
potential end-to-end overseas logistics requirement.
25INTERIM REPORT 2020
Chapter 4Management Discussion and Analysis of Business Performance
(Report of the Board)
2. Sinotrans E-LCL
Rapid volume expansion of the first nation-wide standardized product
Sinotrans E-LCL is the first nation-wide product with unified standards. In the first half of
2020, Sinotrans E-LCL gradually expand its deployment in strategic areas, there were new
central and satellite warehouses launched in Shenzhen, Shanghai, Ningbo and other cities.
Sinotrans E-LCL closely followed the news of the related markets and fully brought out the
logistics channel in Qianhai area to designed the special products including “Guangdong-
Hong Kong e-commerce transportation” targeted at the newly launched cross-border
e-commerce policy. Meanwhile, Sinotrans E-LCL made full use of the internal smart logistics
technology developed by Sinotrans to continuously improve the digitalization of operation,
launched and iterated functions including smart customs service, smart document checking,
which didn’t only improve the operational efficiency, but also largely optimize the customer
experience so as to increase the customer loyalty. In the first half of 2020, impacted by
the COVID-19, import volume of ordinary merchandise decreased, while the volume of
fragmentized e-commerce related products increased thanks to the change of shopping
habit. Reacting to the above situation, Sinotrans E-LCL took the initiative to provide
alternative solutions to customers and brought accretive business volume. The nation-wide
standardized product of Sinotrans E-LCL was constantly recognized by the target customers
and kept winning full network operation customers. In the first half of 2020, Sinotrans E-LCL
contributed revenue of approximately RMB240 million, representing an increase of 22.7% as
compared to the corresponding period of last year.
3. Charter plane service
Took off against the wind and doubled the profit
In the beginning of 2020, as the COVID-19 broke out at home and abroad, different nations
and regions all launched strict anti-pandemic measures and customs quarantine policies. At
the same time, the volume of international air travel passengers largely dropped, and major
air lines all ceased operation. As 70% of the international air cargo capacity are provided
by the belly of passenger flights, the above situation caused sever inadequate supply of
international air transportation capacity, plus the surge demand of transporting the anti-
pandemic materials, the air transportation freight rate soared to historical high during the first
half of this year. Sinotrans has been deployed the air transportation capacity to construct
the air channel. Depending on the long term cooperation foundation and business operation
capability, Sinotrans managed to resume the Hangzhou-Liège chartered plane ahead of
time and increased the frequency from 2 flights per week to 4 flights per week; and totally
flied 80 flights, loaded more than 10 thousand tons of cargo in the first half of this year,
maintained an air-support live life line between China and European area. Sinotrans also
promptly initiated temporary charter flights cooperation with airline companies including Air
China, China Southern Airline and Emirates Airline, and also launched the first passenger
plane adapted cargo plane on 7 February, to ensure the clear air cargo transportation
channel. In the first half of 2020, Sinotrans totally provided 268 temporary charter flights
service to customers, which didn’t only solve the urgent logistics requirement problems, but
also contribute to ensure the safety and stability of local supply chain. The well-established
channel operation in return brought satisfactory economic results, in the first half of 2020,
the operation profit of air freight forwarding business increased by 1.3 times as compared
with the corresponding period of last year.
SINOTRANS LIMITED26
Chapter 4Management Discussion and Analysis of Business Performance (Report of the Board)
4. International railway express
Eye-catching performance with surging volume
Affected by the COVID-19, the international transportation capacity of sea and air largely
dropped in the first half of 2020. The China Europe Railway Express and China-Central Asia
Railway operated by Sinotrans effectively undertook part of the transfer of capacity demand.
During the time, with the support from various level of governments, the five regional
subsidiaries and specialized subsidiaries made full use of the existing railway transportation
channel, and constantly developed new routes of charter train. As at the end of June 2020,
Sinotrans totally launched 670 international freight trains and the volume reached 67.3
thousand TEUs, representing an increase of 35.07% compared with the first half of last year,
among which, the China Europe Railway Express launched 612 trains with the volume of
59.2 thousand TEUs, increased 38.24% year-on-year.
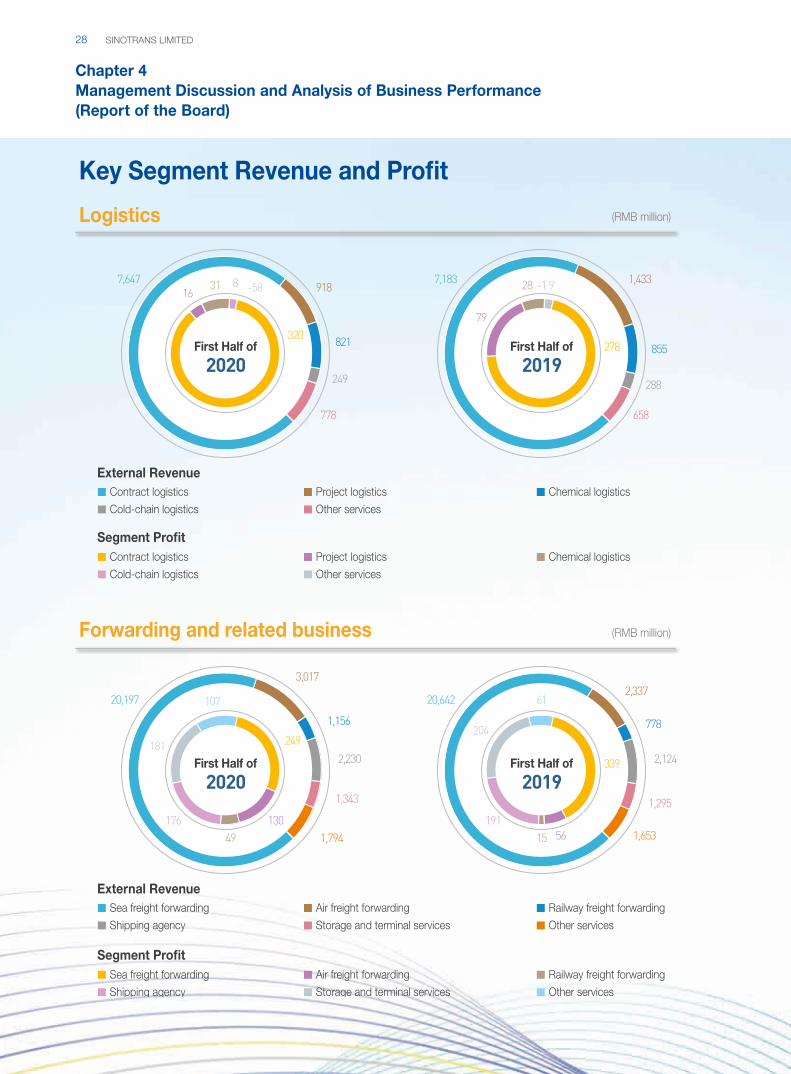
(III) Business Segments and Segment Profit (in which, the segment profit is the operating profit of the segment deducting the impact of investment income in associates and joint ventures)Logistics
In the first half of 2020, external revenue from the Group’s logistics business amounted
to RMB10,073 million, representing an increase of 1.40% from RMB9,934 million for the
corresponding period of last year, because the Group started to consolidate KLG Group from
2020, which contributed RMB678 million of revenue in the first half of this year; and the segment
profit amounted to RMB324 million, representing a decrease of 17.44% from RMB392 million for
the corresponding period of last year, which was mainly attributable to the decreased business
volume because the overseas projects were suspended as the impact of the COVID-19, resulting
in the profit of project logistics of the Company dropped by RMB 63 million compared with the
first half of last year.
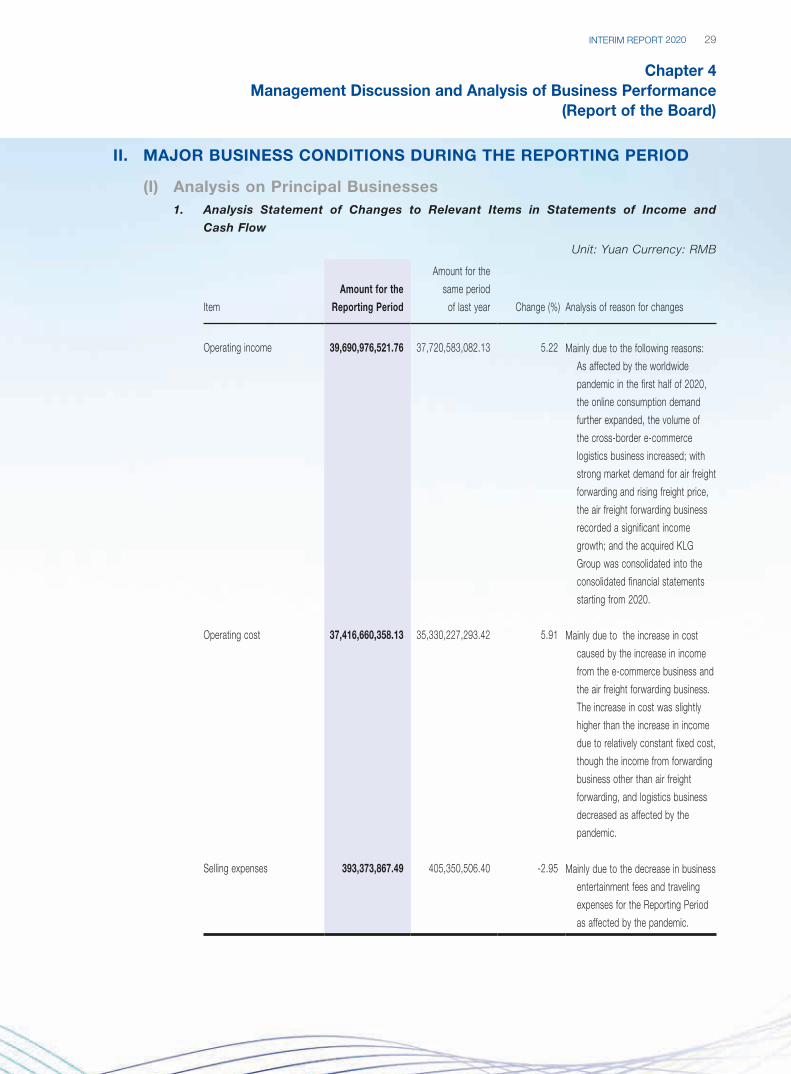
Forwarding and related business
In the first half of 2020, external revenue from the Group’s forwarding and related business
amounted to RMB26,995 million, representing an increase of 2.92% from RMB26,229 million
for the corresponding period of last year; and the segment profit amounted to RMB891 million,
representing an increase of 0.69% from RMB885 million for the corresponding period of last year,
which was mainly attributable to the volume increase in the China Europe Railway Express service
and a year-on-year increase in air freight rates in the first half of 2020.
E-commerce business
In the first half of 2020, external revenue from the Group’s e-commerce business amounted
to RMB2,623 million, representing an increase of 68.42% from RMB1,557 million for the
corresponding period of last year; and the segment profit amounted to RMB59 million,
representing an increase of 177.37% from RMB21 million for the corresponding period of last
year, which was mainly attributable to the increase in both volume and price of the cross-border
e-commerce logistics business caused by the factors including the COVID-19.
27INTERIM REPORT 2020
Chapter 4Management Discussion and Analysis of Business Performance
(Report of the Board)
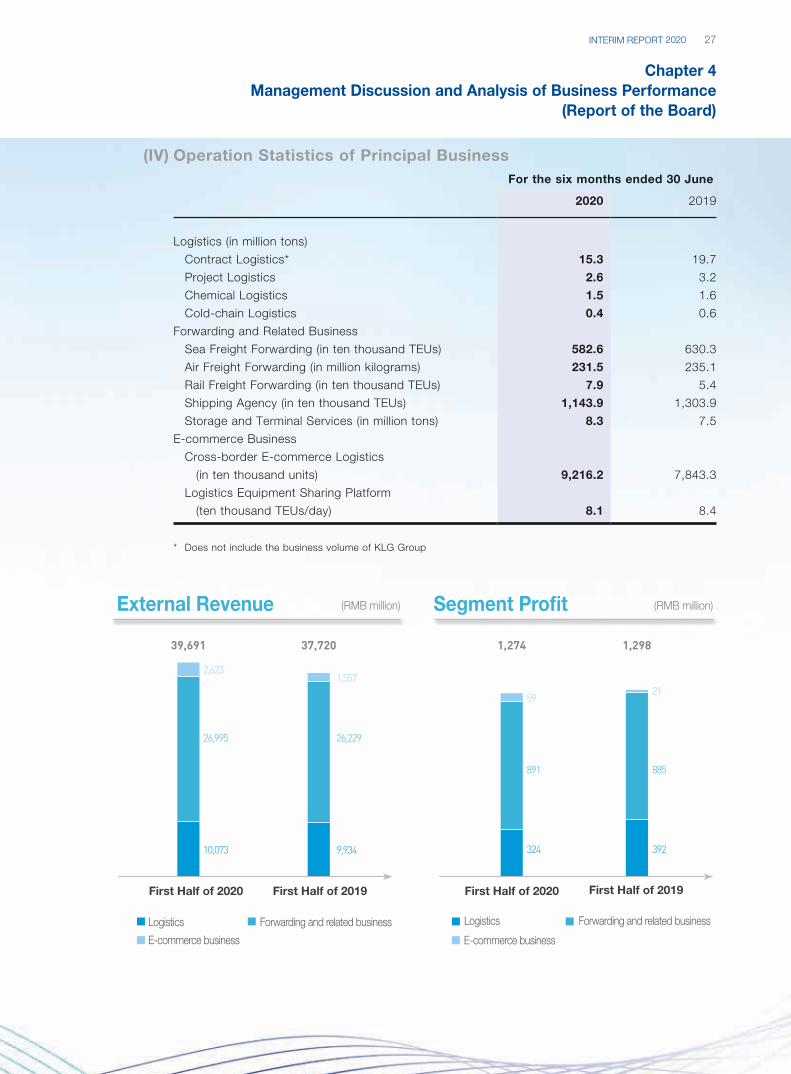
(IV) Operation Statistics of Principal BusinessFor the six months ended 30 June
2020 2019
Logistics (in million tons)
Contract Logistics* 15.3 19.7
Project Logistics 2.6 3.2
Chemical Logistics 1.5 1.6
Cold-chain Logistics 0.4 0.6
Forwarding and Related Business
Sea Freight Forwarding (in ten thousand TEUs) 582.6 630.3
Air Freight Forwarding (in million kilograms) 231.5 235.1
Rail Freight Forwarding (in ten thousand TEUs) 7.9 5.4
Shipping Agency (in ten thousand TEUs) 1,143.9 1,303.9
Storage and Terminal Services (in million tons) 8.3 7.5
E-commerce Business
Cross-border E-commerce Logistics
(in ten thousand units) 9,216.2 7,843.3
Logistics Equipment Sharing Platform
(ten thousand TEUs/day) 8.1 8.4
* Does not include the business volume of KLG Group
(RMB million)External Revenue
First Half of 2019First Half of 2020
Logistics
E-commerce business
Forwarding and related business Logistics
(RMB million)Segment Profit
First Half of 2019First Half of 2020
E-commerce business
39,691 37,720 1,274 1,298
10,073
26,995
2,623
9,934
1,557
26,229
324
891
59
392
885
21
Forwarding and related business
SINOTRANS LIMITED28
Chapter 4Management Discussion and Analysis of Business Performance (Report of the Board)
Key Segment Revenue and Profit
Forwarding and related business (RMB million)
External Revenue
Segment Profit
Sea freight forwarding
Shipping agency
Air freight forwarding
Storage and terminal services
Railway freight forwarding
Other services
20,197
3,017
1,156
2,230
1,343
1,79449176
181
107
130
249
2020First Half of
Sea freight forwarding
Shipping agency
Air freight forwarding
Storage and terminal services
Railway freight forwarding
Other services
20,6422,337
778
2,124
1,295
1,65315191
204
61
56
339
2019First Half of
Logistics (RMB million)
External Revenue
Segment Profit
Contract logistics
Cold-chain logistics
Contract logistics
Cold-chain logistics
Project logistics
Other services
Project logistics
Other services
Chemical logistics
Chemical logistics
7,647918
821
249
778
31 8 -5816
320
2020First Half of
7,183 1,433
855
288
658
28 -1 9
79
278
2019First Half of
29INTERIM REPORT 2020
Chapter 4Management Discussion and Analysis of Business Performance
(Report of the Board)
II. MAJOR BUSINESS CONDITIONS DURING THE REPORTING PERIOD
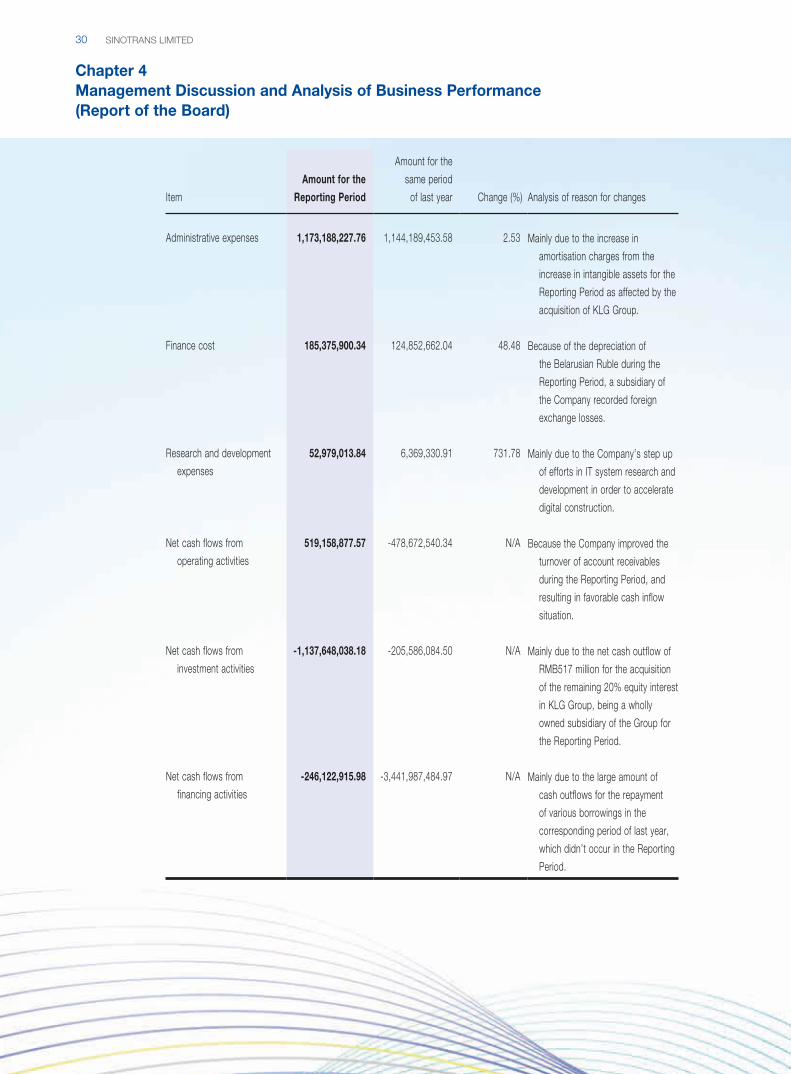
(I) Analysis on Principal Businesses1. Analysis Statement of Changes to Relevant Items in Statements of Income and
Cash Flow
Unit: Yuan Currency: RMB
Item
Amount for the
Reporting Period
Amount for the
same period
of last year Change (%) Analysis of reason for changes
Operating income 39,690,976,521.76 37,720,583,082.13 5.22 Mainly due to the following reasons:
As affected by the worldwide
pandemic in the first half of 2020,
the online consumption demand
further expanded, the volume of
the cross-border e-commerce
logistics business increased; with
strong market demand for air freight
forwarding and rising freight price,
the air freight forwarding business
recorded a significant income
growth; and the acquired KLG
Group was consolidated into the
consolidated financial statements
starting from 2020.
Operating cost 37,416,660,358.13 35,330,227,293.42 5.91 Mainly due to the increase in cost
caused by the increase in income
from the e-commerce business and
the air freight forwarding business.
The increase in cost was slightly
higher than the increase in income
due to relatively constant fixed cost,
though the income from forwarding
business other than air freight
forwarding, and logistics business
decreased as affected by the
pandemic.
Selling expenses 393,373,867.49 405,350,506.40 -2.95 Mainly due to the decrease in business
entertainment fees and traveling
expenses for the Reporting Period
as affected by the pandemic.
SINOTRANS LIMITED30
Chapter 4Management Discussion and Analysis of Business Performance (Report of the Board)
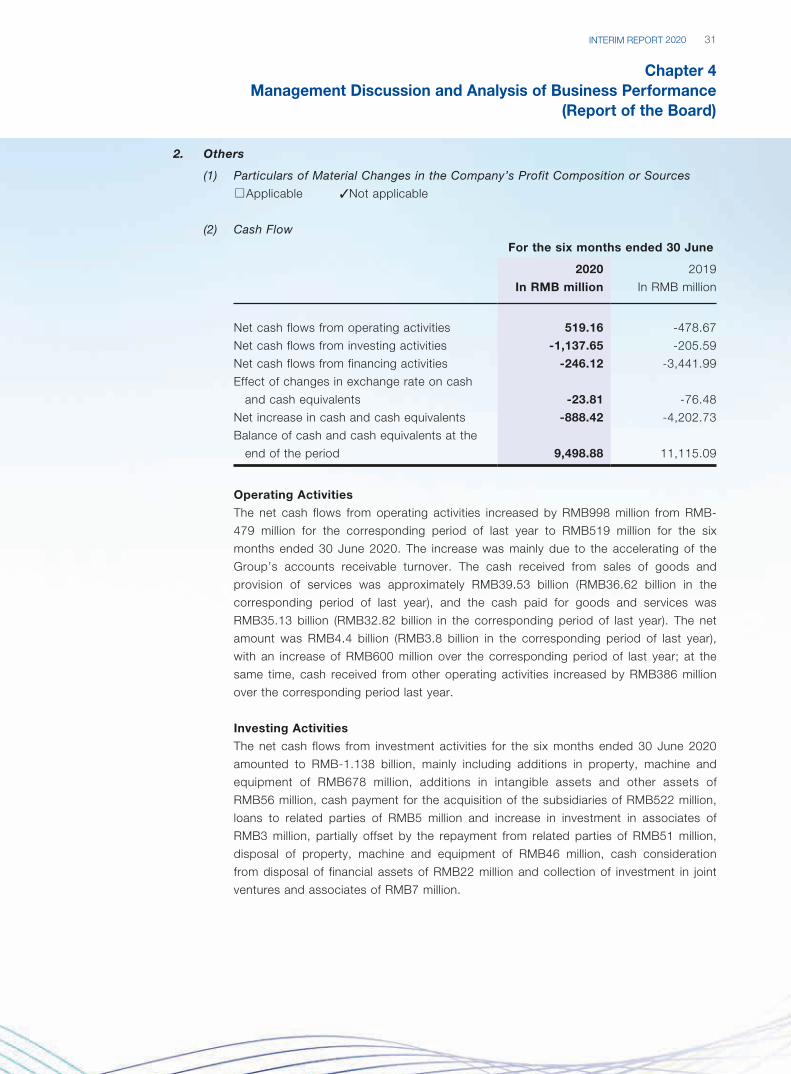
Item
Amount for the
Reporting Period
Amount for the
same period
of last year Change (%) Analysis of reason for changes
Administrative expenses 1,173,188,227.76 1,144,189,453.58 2.53 Mainly due to the increase in
amortisation charges from the
increase in intangible assets for the
Reporting Period as affected by the
acquisition of KLG Group.
Finance cost 185,375,900.34 124,852,662.04 48.48 Because of the depreciation of
the Belarusian Ruble during the
Reporting Period, a subsidiary of
the Company recorded foreign
exchange losses.
Research and development
expenses
52,979,013.84 6,369,330.91 731.78 Mainly due to the Company’s step up
of efforts in IT system research and
development in order to accelerate
digital construction.
Net cash flows from
operating activities
519,158,877.57 -478,672,540.34 N/A Because the Company improved the
turnover of account receivables
during the Reporting Period, and
resulting in favorable cash inflow
situation.
Net cash flows from
investment activities
-1,137,648,038.18 -205,586,084.50 N/A Mainly due to the net cash outflow of
RMB517 million for the acquisition
of the remaining 20% equity interest
in KLG Group, being a wholly
owned subsidiary of the Group for
the Reporting Period.
Net cash flows from
financing activities
-246,122,915.98 -3,441,987,484.97 N/A Mainly due to the large amount of
cash outflows for the repayment
of various borrowings in the
corresponding period of last year,
which didn’t occur in the Reporting
Period.
31INTERIM REPORT 2020
Chapter 4Management Discussion and Analysis of Business Performance
(Report of the Board)
2. Others
(1) Particulars of Material Changes in the Company’s Profit Composition or Sources
□Applicable 3Not applicable
(2) Cash Flow
For the six months ended 30 June
2020 2019
In RMB million In RMB million
Net cash flows from operating activities 519.16 -478.67
Net cash flows from investing activities -1,137.65 -205.59
Net cash flows from financing activities -246.12 -3,441.99
Effect of changes in exchange rate on cash
and cash equivalents -23.81 -76.48
Net increase in cash and cash equivalents -888.42 -4,202.73
Balance of cash and cash equivalents at the
end of the period 9,498.88 11,115.09
Operating Activities
The net cash flows from operating activities increased by RMB998 million from RMB-
479 million for the corresponding period of last year to RMB519 million for the six
months ended 30 June 2020. The increase was mainly due to the accelerating of the
Group’s accounts receivable turnover. The cash received from sales of goods and
provision of services was approximately RMB39.53 billion (RMB36.62 billion in the
corresponding period of last year), and the cash paid for goods and services was
RMB35.13 billion (RMB32.82 billion in the corresponding period of last year). The net
amount was RMB4.4 billion (RMB3.8 billion in the corresponding period of last year),
with an increase of RMB600 million over the corresponding period of last year; at the
same time, cash received from other operating activities increased by RMB386 million
over the corresponding period last year.
Investing Activities
The net cash flows from investment activities for the six months ended 30 June 2020
amounted to RMB-1.138 billion, mainly including additions in property, machine and
equipment of RMB678 million, additions in intangible assets and other assets of
RMB56 million, cash payment for the acquisition of the subsidiaries of RMB522 million,
loans to related parties of RMB5 million and increase in investment in associates of
RMB3 million, partially offset by the repayment from related parties of RMB51 million,
disposal of property, machine and equipment of RMB46 million, cash consideration
from disposal of financial assets of RMB22 million and collection of investment in joint
ventures and associates of RMB7 million.
SINOTRANS LIMITED32
Chapter 4Management Discussion and Analysis of Business Performance (Report of the Board)
The net cash flows from investment activities for the six months ended 30 June
2019 amounted to RMB-206 million, mainly including additions in property, machine
and equipment of RMB736 million, additions in intangible assets and other assets
of RMB141 million, additions in other equity-instrument investments of RMB18
million, and the payment of RMB9 million difference between the disposal price of
subsidiary and the carrying amount, partially offset by repayments from joint ventures
and associates of RMB388 million, received interest of RMB114 million on wealth
management products, disposal of property, machine and equipment of RMB129
million, investment gains of RMB40 million, disposal of intangible assets of RMB17
million and collection of investment in joint ventures and associates of RMB11 million.
Financing Activities
The net cash flow generated from financing activities for the six months ended 30 June
2020 amounted to RMB-246 million, mainly including new borrowings of RMB1.551
billion, capital increase from non-controlling shareholders of RMB53 million, loans from
related parties of RMB40 million, partially offset by cash repayment of borrowings of
RMB1.245 billion, cash repayment of interest of RMB215 million, lease payment of
RMB328 million, repayment of loans from related parties of RMB59 million and dividend
payment of RMB43 million.
The net cash flow generated from financing activities for the six months ended 30 June
2019 amounted to RMB-3.442 billion, mainly including new borrowings of RMB132
million and capital contribution from non-controlling Shareholders of RMB58 million,
partially offset by cash payment of RMB2.31 billion as the repayment of borrowings,
payment of non-related party capital transactions of RMB692 million, payment of rental
deposits of RMB271 million, cash repayment of interest of RMB248 million, payment
of legal advisor consulting fee of RMB55 million in relation to the merger of Sinoair
by absorption, payment of transfer consideration of RMB10 million in relation to the
acquisition of remaining equity interest of Shenzhen Henglu Logistics Co., Ltd.* and
payment of dividend of RMB45 million.
(3) Others
□Applicable 3Not applicable
(II) Explanation on Material Changes in the Profit Resulting from Non- Core Businesses3Applicable □Not applicable
1. Credit impairment loss for the Reporting Period was RMB62.8164 million, representing
an increase of RMB40.5435 million as compared with RMB22.2730 million for the
corresponding period of last year, mainly due to that the Group made full impairment
provision for the long-term receivables from Uni-top for the Reporting Period.
2. Gains on disposal of assets for the Reporting Period was RMB13.8883 million, representing
a decrease of RMB50.1824 mill ion as compared with RMB64.0707 mill ion for the
corresponding period of last year, mainly due to the absence of gains on disposal of assets
of RMB49.1593 million from the disposal of land by the Group’s subsidiary Sinotrans Central
China Co., Ltd. in the corresponding period of last year.
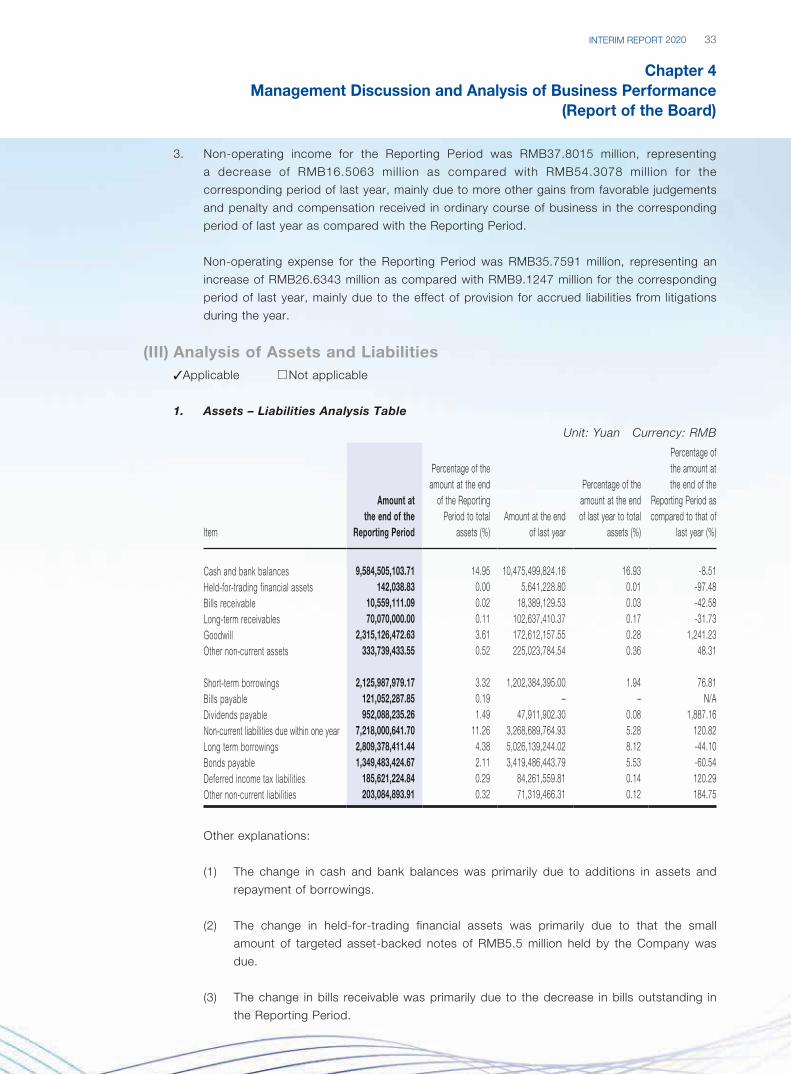
33INTERIM REPORT 2020
Chapter 4Management Discussion and Analysis of Business Performance
(Report of the Board)
3. Non-operating income for the Reporting Period was RMB37.8015 million, representing
a decrease of RMB16.5063 mill ion as compared with RMB54.3078 mill ion for the
corresponding period of last year, mainly due to more other gains from favorable judgements
and penalty and compensation received in ordinary course of business in the corresponding
period of last year as compared with the Reporting Period.
Non-operating expense for the Reporting Period was RMB35.7591 million, representing an
increase of RMB26.6343 million as compared with RMB9.1247 million for the corresponding
period of last year, mainly due to the effect of provision for accrued liabilities from litigations
during the year.
(III) Analysis of Assets and Liabilities3Applicable □Not applicable
1. Assets – Liabilities Analysis Table
Unit: Yuan Currency: RMB
Item
Amount at the end of the
Reporting Period
Percentage of the amount at the end
of the Reporting Period to total
assets (%)Amount at the end
of last year
Percentage of the amount at the end of last year to total
assets (%)
Percentage of the amount at the end of the
Reporting Period as compared to that of
last year (%)
Cash and bank balances 9,584,505,103.71 14.95 10,475,499,824.16 16.93 -8.51Held-for-trading financial assets 142,038.83 0.00 5,641,228.80 0.01 -97.48Bills receivable 10,559,111.09 0.02 18,389,129.53 0.03 -42.58Long-term receivables 70,070,000.00 0.11 102,637,410.37 0.17 -31.73Goodwill 2,315,126,472.63 3.61 172,612,157.55 0.28 1,241.23Other non-current assets 333,739,433.55 0.52 225,023,784.54 0.36 48.31
Short-term borrowings 2,125,987,979.17 3.32 1,202,384,395.00 1.94 76.81Bills payable 121,052,287.85 0.19 – – N/ADividends payable 952,088,235.26 1.49 47,911,902.30 0.08 1,887.16Non-current liabilities due within one year 7,218,000,641.70 11.26 3,268,689,764.93 5.28 120.82Long term borrowings 2,809,378,411.44 4.38 5,026,139,244.02 8.12 -44.10Bonds payable 1,349,483,424.67 2.11 3,419,486,443.79 5.53 -60.54Deferred income tax liabilities 185,621,224.84 0.29 84,261,559.81 0.14 120.29Other non-current liabilities 203,084,893.91 0.32 71,319,466.31 0.12 184.75
Other explanations:
(1) The change in cash and bank balances was primarily due to additions in assets and
repayment of borrowings.
(2) The change in held-for-trading financial assets was primarily due to that the small
amount of targeted asset-backed notes of RMB5.5 million held by the Company was
due.
(3) The change in bills receivable was primarily due to the decrease in bills outstanding in
the Reporting Period.
SINOTRANS LIMITED34
Chapter 4Management Discussion and Analysis of Business Performance (Report of the Board)
(4) The change in long-term receivables was primarily due to that the Group made full
impairment provision for the long-term receivables from Uni-top for the Reporting
Period.
(5) The change in goodwill was mainly because the Group completed the acquisition of
KLG Group and included it into the scope of consolidation in the year, resulting in the
increase of goodwill.
(6) The change in other non-current assets was primarily due to the change in receivables
and payables of Lanshi Port, the Group’s trusted asset under management, and the
prepayment of new land-use right in the Reporting Period.
(7) The change in short-term borrowings was primarily due to the new offshore short-term
financing of RMB716 million for the acquisition of KLG Group in the Reporting Period
and the increase in onshore short-term borrowings of the subsidiaries of the Group in
the Reporting Period.
(8) The change in bills payable was primarily due to the usage of bills payable for
settlement by some subsidiaries of the Group in the Reporting Period.
(9) The change in dividend payable was primarily due to the declaration and payment of
2019 annual dividend of RMB888 million by the Company for the Reporting Period.
(10) The change in non-current liabilities due within one year was primarily due to the
reclassification of the portion due within one year (RMB2.063 billion) under bonds
payable and the portion due within one year (RMB1.772 billion) under long term
borrowings into non-current liabilities due within one year for the Reporting Period, as
well as the increase in lease liabilities due within one year.
(11) The change in long term borrowings was primarily due to the reclassification of the
portion due within one year under the long term borrowings into non-current liabilities
due within one year for the Reporting Period.
(12) The change in bonds payable was primarily due to the reclassification of the portion
due within one year under the bonds payable of 2.063 billion into non-current liabilities
due within one year for the Reporting Period.
(13) The change in deferred income tax liabilities was primarily due to the increase in
temporary difference as a result of the change in the scope of consolidation for the
year. For details, please refer to Note VIII. 2 to the financial statements.
(14) The change in other non-current liabilities was primarily due to the increase in liabilities
related to Lanshi Port of RMB132 million (i.e. compensation received from the
government for demolition and removal), the Group’s trusted asset under management,
in the Reporting Period.
35INTERIM REPORT 2020
Chapter 4Management Discussion and Analysis of Business Performance
(Report of the Board)
2. Restriction on Major Assets as at the End of the Reporting Period
3Applicable □Not applicable
The major restricted assets of the Company mainly consists of cash and bank balances with
litimited usage, such as guaranteed deposit, and collateralized assets for obtaining long-term
and short-term borrowings from banks, mainly including the following:
(1) The capital in the accounts of the subsidiaries of the Group, which was under
supervision and with limited right of use, amounted to RMB63.9201 million at the end
of the Reporting Period, among which, guaranteed deposit amounted to RMB41.7833
million.
(2) To finance the building of the logistics center under “Project Tsing Yi 181”, Global
Traffic Limited (hereinafter, “Global Traffic”), a subsidiary of the Group, entered into
a facility agreement with China Development Bank for the facilities of HK$2.9 billion.
China Merchants Holdings (Hong Kong) Company Limited, a related party of the
Group, provided a full guarantee. Meanwhile, Global Traffic entered into a debenture
with China Development Bank on 26 June 2015, under which the Global Traffic was
the charger. As of 30 June 2020, the restricted assets with limited right of use were
accounted in investment properties and intangible assets.
For details, please refer to Note IX. 25 to the financial statements.
3. Other Explanations
□Applicable 3Not applicable
(IV) Analysis of Investments1. Overall Analysis of External Equity Investments
3Applicable □Not applicable
The Group’s long-term equity investment at the end of the Reporting Period amounted to
RMB7.722 billion, representing a decrease of RMB1.646 billion and a year-on-year decrease
of 17.57 % as compared to RMB9.368 billion at the beginning of the year, primarily due to
the decrease of RMB2.201 billion in the Reporting Period as a result of changes in the scope
of consolidation since the consolidation of KLG Group by the Group on 1 January 2020.
(1) Major equity investment
□Applicable 3Not applicable
(2) Major non-equity investment
□Applicable 3Not applicable

SINOTRANS LIMITED36
Chapter 4Management Discussion and Analysis of Business Performance (Report of the Board)
(3) Financial assets at fair value
3Applicable □Not applicable
Unit: Yuan Currency: RMB
ItemSource of funds
Cost at the beginning of
the year
Acquisition during the Reporting
Period Addition
Disposal during the Reporting
Period
Cost at the end of the Reporting
Period
At the beginning of
the yearAt the end of
the yearInvestment
income
Nanjing Port Longtan Container Co., Ltd. Self-financing 188,756,354.15 – 7,838,446.06 – 196,594,800.21 – – –China Merchants Logistics Synergy
Limited PartnershipSelf-financing 176,113,822.12 – 19,954,848.12 – 196,068,670.24 – – –
Ouyeel Equity Acquisition Self-financing 147,747,600.00 – – – 147,747,600.00 – – –BOE Technology Group Co., Ltd. Self-financing 127,133,750.00 – – 8,711,250.00 118,422,500.00 101,455,250.00 100,600,500.00 –China United Tally Co., Ltd. Self-financing 91,441,143.61 – – – 91,441,143.61 – – –SINO-BLR Industrial Investment Fund Self-financing 46,890,242.29 – – – 46,890,242.29 – – –Shenyang Airport Logistics Co., Ltd.*
(瀋陽空港物流有限公司)Self-financing 33,730,000.00 – – – 33,730,000.00 – – –
Air China Limited Self-financing 8,076,871.60 – – – 8,076,871.60 19,874,873.33 10,990,314.57 –Pankorea Yingkou Ferry Co., Ltd. Self-financing 2,896,775.00 – – – 2,896,775.00 – – –Pingze Container Port Co., Ltd.*
(平澤集裝箱碼頭有限公司)Self-financing 2,870,000.00 – 1,658.77 – 2,871,658.77 – – 146,464.00
Guangdong Waiyun Automobile Fitting Factory* (廣東外運汽車服務有限公司)
Self-financing 805,325.00 – – – 805,325.00 – – –
Chengdu Rongjie Technology Co., Ltd.* (成都蓉捷科技有限公司)
Self-financing 400,000.00 – – – 400,000.00 – – –
Ocean Network Express (China) Ltd. Self-financing 250,000.00 – – – 250,000.00 – – –Sichuan Tianhua Co., Ltd. Self-financing 134,680.92 – – – 134,680.92 – – –China Ferry Terminal Services Limited Self-financing 131,806.25 – 2,589.63 – 134,395.88 – – 70,389.09Shenzhen Sealink Technology, LLC*
(深圳市海易通科技有限責任公司)Self-financing 110,000.00 – – – 110,000.00 – – –
Taizhou Yiyou Sinotrans Shipping Agency Co., Ltd.* (泰州益友中外運船務代理有限公司)
Self-financing 100,000.00 – – – 100,000.00 – – –
Shaanxi Sinotrans Sanyuan Coal Co., Ltd.* (陝西中外運三原煤炭有限公司)
Self-financing 100,000.00 – – – 100,000.00 – – –
Beijing BITEMC Electronic Co., Ltd. Self-financing 46,500.00 – – – 46,500.00 – – –China Merchants Port Holdings
Company LimitedSelf-financing 8,958.00 – – – 8,958.00 32,270.80 33,080.83 –
Issuance of 2019 First Tranche of RMB Targeted Asset-Backed Notes
Self-financing 5,500,000.00 – – 5,500,000.00 – – – 333,320.23
Total 833,243,828.94 – 27,797,542.58 14,211,250.00 846,830,121.52 121,362,394.13 111,623,895.40 550,173.32
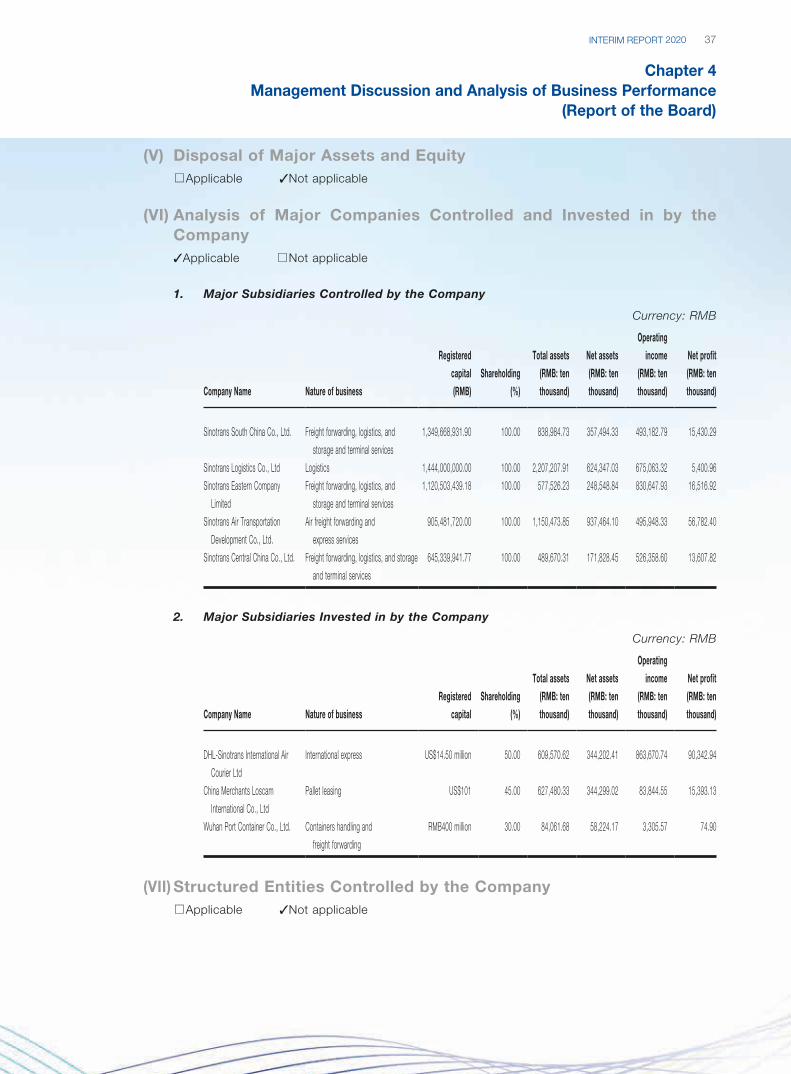
37INTERIM REPORT 2020
Chapter 4Management Discussion and Analysis of Business Performance
(Report of the Board)
(V) Disposal of Major Assets and Equity□Applicable 3Not applicable
(VI) Analysis of Major Companies Controlled and Invested in by the Company3Applicable □Not applicable
1. Major Subsidiaries Controlled by the Company
Currency: RMB
Company Name Nature of business
Registered
capital
(RMB)
Shareholding
(%)
Total assets
(RMB: ten
thousand)
Net assets
(RMB: ten
thousand)
Operating
income
(RMB: ten
thousand)
Net profit
(RMB: ten
thousand)
Sinotrans South China Co., Ltd. Freight forwarding, logistics, and
storage and terminal services
1,349,668,931.90 100.00 838,984.73 357,494.33 493,182.79 15,430.29
Sinotrans Logistics Co., Ltd Logistics 1,444,000,000.00 100.00 2,207,207.91 624,347.03 675,063.32 5,400.96
Sinotrans Eastern Company
Limited
Freight forwarding, logistics, and
storage and terminal services
1,120,503,439.18 100.00 577,526.23 248,548.84 830,647.93 16,516.92
Sinotrans Air Transportation
Development Co., Ltd.
Air freight forwarding and
express services
905,481,720.00 100.00 1,150,473.85 937,464.10 495,948.33 56,782.40
Sinotrans Central China Co., Ltd. Freight forwarding, logistics, and storage
and terminal services
645,339,941.77 100.00 489,670.31 171,828.45 526,358.60 13,607.82
2. Major Subsidiaries Invested in by the Company
Currency: RMB
Company Name Nature of business
Registered
capital
Shareholding
(%)
Total assets
(RMB: ten
thousand)
Net assets
(RMB: ten
thousand)
Operating
income
(RMB: ten
thousand)
Net profit
(RMB: ten
thousand)
DHL-Sinotrans International Air
Courier Ltd
International express US$14.50 million 50.00 609,570.62 344,202.41 863,670.74 90,342.94
China Merchants Loscam
International Co., Ltd
Pallet leasing US$101 45.00 627,480.33 344,299.02 83,844.55 15,393.13
Wuhan Port Container Co., Ltd. Containers handling and
freight forwarding
RMB400 million 30.00 84,061.68 58,224.17 3,305.57 74.90
(VII) Structured Entities Controlled by the Company□Applicable 3Not applicable
SINOTRANS LIMITED38
Chapter 4Management Discussion and Analysis of Business Performance (Report of the Board)
III. OTHER DISCLOSURES
(I) Warning and Explanation on Anticipated Loss on the Cumulative Net Profits from the Beginning of the Year to the End of the Next Reporting Period or Significant Changes as Compared to the Corresponding Period of Last Year□Applicable 3Not applicable
(II) Business Development and OutlookNew infrastructure, consumption upgrade and fragmented logistics demand in China will give rise
to new growth points, and internal circulation will become an important opportunity for a period
of time in the future. Therefore, China will maintain its favorable economic fundamentals in a long
run. Meanwhile, the COVID-19 has accelerated the restructuring of the global industrial chain, and
stabilizing the industrial chain and supply chain has become top priorities.
In the second half of 2020, the Company will review its positioning in the industrial chain, supply
chain and value chain, continue to maintain strategic determination and always implement the
strategy-driven and quality and efficiency-based approach, with focus on the following:
1. Enhance market share and adjust the structure to accelerate the development of
new growth points
With gradual formation of a new dual circulation development pattern, pursuant to which
domestic economic cycle plays a leading role while international economic cycle remains
its extension and supplement, we will redefine the market position and adjust our business
structure. On the one hand, we will strengthen in-depth cooperation with major strategic
customers, and explore upstream and downstream opportunities in the supply chain of
existing customers, so as to expand new business areas; on the other hand, we will take the
initiative and lead in the restructuring of the global industrial chain and supply chain through
“chain supplement, consolidation and enhancement”, further strengthen the development of
consumer market, import market and online market, and accelerate the development of new
growth points.
2. Focus on business transformation and integration, and continue to promote product
offering
The Company will continue to focus on the transformation of its three major business
segments, form product advantages and select high-quality business lines to sort out
business from the perspective of capital operation and effectively promote the integration of
internal resources.
For logistics business, we will accelerate the transformation to the integration of value
chain, and build a professional logistics product system with industrialized sale, customer
driven solution, consolidated service, unified operation and digital empowerment; focus
on key subdivided sectors to form standardized logistics solutions, and promote the
replication of mature products; develop and promote the replication of digitalized operational
management solutions based on the implementation of logistics control tower; continue
to strengthen business synergy with KLG Group in such sectors as the automotive and
accessories, technology & electronic products and buyer consolidation, and continue to
explore the logistics demand in China of KLG Group’s existing European customers.
39INTERIM REPORT 2020
Chapter 4Management Discussion and Analysis of Business Performance
(Report of the Board)
For forwarding and related businesses, we will accelerate the transformation to the
whole-process supply chain and build a whole-process supply chain product systems.
As for FCL, we will further optimize FCL premium products on Southeast Asian routes; as
for LCL, we will formulate a consolidated business management model based on unified
service standards, continue to expand market share and achieve double-digit growth in
annual business volume; as for rail express product, we will focus on the development
and operation of high-quality routes, and improve the whole-process service capabilities of
special delivery for major customers; as for air transportation, we will continue to develop
full-chain products, establish a national air transport product R&D center, and establish a
unified headquarter operation system, process management system and price management
system, with a focus on close connection between the operation management system and
the sales system.
For e-commerce business, we will strengthen and accelerate the transformation to
platformization and the ecosystem-based model, and collaborate online and offline channels
to develop a series of competitive digital products. The platform-based construction of
Y2T will continue to follow the integrated online and offline whole chain service model to
cover various principal business products; the construction of the industrial interconnection
ecosystem will coordinate the development of e-commerce platforms and power seller
customers, operate cross-border e-commerce full-chain products, enrich online product
offerings, and continuously extend the service and value chains.
3. Reshape the operating model and accelerate the enhancement of integrated
operating capabilities
The Company will drive operations with products, support products with operations, and
enhance the differentiated competitiveness of “product + network + model + platform” in
interactive empowerment. In this process, the Company will leverage the bridge and link
role of the digital operation platform, focus on the practical scenarios of small front end
of its products and the strong operational back office, accelerate digital transformation,
strive to solve standardization and informatization issues, and improve data quality, process
standards and operation system; concentrate on the online operation of its principal
businesses and effectively transform the technological innovation achievements into its
management benefit.
4. Strengthen technology-driven approach and accelerate digital transformation
In respect of digital transformation, we will promote the implementation of digital
transformation plan in an all-round manner, combine digital transformation with quality and
efficiency improvement in an organic way, and increase its effort in transformation and
empowerment of three major business segments and the construction of large operating
systems. In respect of the development of smart logistics, we will perform well in promoting
the application of technology to help reduce costs and increase efficiency and intelligence-
oriented operations. In respect of the innovation system and mechanism, we will focus on
improving product planning and management capabilities, technology R&D and application
capabilities; continue to increase research investment and explore innovative investment
projects in the field of new logistics technologies; continue to improve the innovation
mechanism and stimulate internal innovation vitality.
SINOTRANS LIMITED40
Chapter 4Management Discussion and Analysis of Business Performance (Report of the Board)
(III) Potential Risks3Applicable Not applicable
1. Macro economy risk
In 2020, the global macro economy is still in a period of in depth adjustment after the
international financial crisis. China’s economy has entered a new normal, the macro
economy growth rate has slowed down, the long-term positive trend does not change, but
there appeared additional uncertain factors, while the trade friction between China and the
US and the outbreak of COVID-19. The logistics industry in which the Group operates is
closely related to the macroeconomic situation and international trade. Any of the events
such as the growth in the macro-economy declines, international trade drops and the
fluctuations in the exchange rates of US dollar and the interest rate of RMB intensify in
the future may have a negative effect on the development of the logistics industry and the
operation of the Group.
Counter measures: The Company strengthens the tracking, research and analysis of the
macroeconomic situation, industrial policies, monetary and fiscal policies of major economies
related to customers, dynamically adjusts the business structure and customer structure,
focuses on high-growth industries to develop logistics business, and strengthens domestic
business development, so as to constantly improve its profitability and comprehensive
competitiveness. In addition, the Company strengthens the construction of overseas network
in Southeast Asia and overseas business, increases the proportion of import business and
actively develops new business, so as to create a new profit-making stream. Meanwhile,
according to the development of COVID-19, the Company will make timely adjustments to its
new marketing and service model during the pandemic to minimize the adverse effects of the
pandemic.
2. Industry competition risk
The competition of the Group’s principal business in logistics industry is fairly intense. On
the one hand, due to the current large number of market participants in logistics industry in
China, market competition is continuously intense. In recent years, cross-industrial players
like e-commerce companies, shipping companies continuously enter into this market, so
that the competition for market share become more intense. On the other hand, China’s
outstanding logistics companies also conduct the “Going Out” strategy to provide logistics
services on a global basis. The competition model in the whole industry has shifted from
pure cost and price to differentiated service and management efficiency. Inadequate
capabilities in new product design and research and development as well as platform
integration will never create core competitiveness, and there is no guarantee that the
Company will maintain its current market position and its advantages in market share.
41INTERIM REPORT 2020
Chapter 4Management Discussion and Analysis of Business Performance
(Report of the Board)
Counter measures: The Company adopts active measures to respond to the change of the
competing model and strives for enhancing the ability in industrial solutions and differentiated
services. We focus on enhancing products and strengthening operation to build product
systems and operating systems, in a great effort to develop core products and enhance our
core competitiveness. We attach importance to promoting the establishment of the logistics
product system and the construction of the national unified standardized products such
as Sinotrans E-LCL and further facilitate the construction of five transportation channels of
water, land, air, truck, and overseas. We restructure the Company’s business and operations
through digital technology to achieve the transformation and upgrading of traditional
business models as early as possible and establish a platform operating system with Y2T (運易通) as its unified interface, so as to pave solid foundation of principle business moving to
online and the online transactions and strengthen external connection to actively participate
in the construction of industrial connecting ecosystem.
3. Operational risk
The Group aims to provide customers with entire value chain and whole-process supply
chain service, which involves many logistics operations and links; any improper design of
business operation processes or failure to effectively manage and control may lead to freight
loss and damage, which may result in direct loss.
Counter measures: The Company strengthens the management and control of the
headquarters and the empowerment in a systematic manner. We establish an enterprise-
level process framework and data governance system, and strengthen operational
monitoring and analysis capabilities. We intensify risk monitoring and prevention and audit
supervision. Based on analysis on risks of key enterprises, businesses and risk sectors,
targeted special inspection is carried out to actively prevent and reduce risks. We conduct
response and alert against risk events, improve risk information integrated framework,
optimize risk information analysis template, establish a mechanism of regular analysis and
tracking of key risk information, adopt targeted special management and control measures,
and urge to improve response measures. We strengthen the training of business operators in
front-line operating units and regulate the operation behavior, so as to reduce major potential
risks and avoid significant loss in pivotal high risk areas.
4. Investment risk
To meet the Group’s strategic transformation and business development, the Group will
increase investment in long-term equity, logistics infrastructures such as warehouses, and IT
systems, which may result in the unfinished operation of projects and failure to meet profit
expectation, which may affect the future cash inflow of the Group.
Counter measures: We coordinate the management of key logistics resources, accelerate
asset arrangement and strategic asset investment, optimize the current infrastructure
investment management model, and gradually promote the separation of light and heavy
assets; we form a forward-looking strategic investment arrangement and perform well in
project feasibility analysis; focus on process management and post-investment evaluation of
investment projects.
SINOTRANS LIMITED42
Chapter 4Management Discussion and Analysis of Business Performance (Report of the Board)
(IV) Other Disclosures3Applicable □Not applicable
1. Merger of Sinoair by absorption
On 31 May 2018, the proposal in relation to merger of Sinoair, a subsidiary of the Company,
by absorption through share swap was considered and approved at the Company’s
extraordinary general meeting and the class general meetings. For details, please refer to
the circular disclosed by the Company on the website of the Hong Kong Stock Exchange
on 18 April 2018. On 8 October 2018, the merger by absorption through share swap
was unconditionally approved by the CSRC. As at 10 January 2019, the Company has
completed the issuance of 1,351,637,231 RMB-dominated ordinary shares (A Shares), and
public investors of ordinary shares of Sinoair have exchanged the 353,600,322 A shares of
Sinoair for 1,351,637,231 A Shares issued by the Company at a ratio of 1:3.8225 (adjusted),
and the issuing price is RMB5.24 per share (adjusted). In the meantime, 3,904,279,644
domestic shares held by China Merchants and Sinotrans & CSC were converted into
equivalent amount of A Shares. On 18 January 2019, A Shares issued by the Company (total
5,255,916,875 Shares) were officially listed on Shanghai Stock Exchange. As at the date of
this report, the Company has completed the business registration of the registered capital
change. At present, the Company is carrying forward the relevant legal procedures for the
cancellation of the corporate qualification of Sinoair and the transfer of all its assets and
liabilities to the Group.
2. Income Tax
For the six months ended 30 June 2020, the Group’s income tax expenses amounted to
RMB312 million, representing an increase of 33.32% as compared to RMB234 million for
the corresponding period of last year, mainly due to the reversal of provision for income tax
in relation to the previous-year disposal of overseas equity recognised in the corresponding
period of last year, which caused a decrease in income tax in the corresponding period of
last year, while there was no such matter in this period.
3. Capital Expenditures
For the six months ended 30 June 2020, the Group’s capital expenditure amounted
to RMB629 million, among which RMB351 million was used for the construction of
infrastructures, ports and terminals facilities and other projects, RMB60 million was used
to purchase land and software, RMB161 million was used to purchase assets such as
mechanical equipment, containers and vehicles, and RMB58 million was used for renovation
and improvement of assets.
43INTERIM REPORT 2020
Chapter 4Management Discussion and Analysis of Business Performance
(Report of the Board)
4. Securities Investment
As at 30 June 2020, the listed equity investments held by the Group was RMB238 million,
the details of which are set out in Note IX. 13 to the financial statements.
5. Contingent Liabilities and Guarantees
As at 30 June 2020, contingent liabilities mainly comprised outstanding lawsuits of the
Group arising from its ordinary course of business amounting to RMB461 million (31
December 2019: RMB120 million).
Please see “XI. MATERIAL CONTRACTS AND PERFORMANCE – (II) Guarantee” under
“Chapter 5 Significant Matters” of the this Report for details of the guarantees.
6. Borrowings and Bonds
As at 30 June 2020, the Group’s total borrowings amounted to RMB9,480 million (31
December 2019: RMB9,002 million), which comprised 811 million denominated in RMB, 439
million in US dollars, 1,871 million in Euro and 6,359 million in Hong Kong dollars. Of the
above bank borrowings, RMB4,545 million shall be payable within a year.
As at 30 June 2020, the Group’s total bonds payable amounted to RMB3,413 million (31
December 2019: RMB3,419 million). Of the above bonds, RMB2,063 million shall be payable
within a year.
Details of borrowings and bonds of the Group as at 30 June 2020 are set out in Note IX. 27,
Note IX. 36. Note IX.37 to the financial statements.
7. Secured and Guaranteed Borrowings
Details of the Group’s secured and guaranteed borrowings are set out in Note X. 4(5) to the
financial statements.
8. Debt-to-Asset Ratio
As at 30 June 2020, the debt-to-asset ratio of the Group was 52.22% (at the end of 2019:
51.12%), which was calculated by dividing total liabilities by total assets of the Group as at
30 June 2020.
9. Government Subsidies
For the six months period ended 30 June 2020, government subsidies received by the
Group in relation to profit amounted to RMB625 million in total, details of which are set out
in Note IX.60 to the financial statements.
SINOTRANS LIMITED44
Chapter 4Management Discussion and Analysis of Business Performance (Report of the Board)
10. Employees
Number of employees: as at 30 June 2020, the number of employees of the Group was
34,068 (31 December 2019: 33,751).
Training plan: as at 30 June 2020, the offline training of the Group accumulated to
345,674.75 hours with 49,108 participants, while 42,755 online courses were completed
(67,815.9 learning hours in total). The training program of the Group mainly included
trainings on corporate strategy and corporate culture, basic working skills, business
knowledge, elevation of management skills and leadership, new employee orientation and
teaching skills training of internal trainer, etc., in the Reporting Period. With the development
of the Group, to ensure the constant elevation of the staff quality, the Group will increase the
employees’ access to trainings and continuously review and improve the training courses to
meet the requirement of the business operation and employee development.
Remuneration policy: A remuneration and benefit management system that matches the
Company’s characteristics has been established pursuant to the Labour Contract Law
and relevant laws and regulations to formalise remuneration management. Emolument
will be paid for the strategic implementation of key links, the development of unique
competitiveness, the training of talents, as well as the effectiveness and production efficiency
of staff. The remuneration standards and adjustment plans will be determined based on the
Company’s cost and budget management range, with reference to market data. Details of
employees’ remuneration are set out in Note IX.31 to the financial statements.
11. Interim dividend
The Board did not recommend to distribute any interim dividend for the six months ended 30
June 2020.
Chapter 5Significant Matters
45INTERIM REPORT 2020
I. BRIEF INTRODUCTION OF SHAREHOLDERS’ GENERAL MEETINGS
Sessions of meeting Date
Inquiry index of designated
website for publication of the
resolutions
Disclosure date of
the publication of
the resolutions
2019 annual general meeting 1 June 2020 The websites of SSE (www.sse.com.cn)
and Hong Kong Stock Exchange
(www.hkex.com.hk)
2 June 2020
2020 first extraordinary general meeting
2020 first H Shareholders’ class meeting
2020 first A Shareholders’ class meeting
Particulars of general meetings3Applicable □Not applicable
1. The Company has successively convened 2019 annual general meeting, 2020 first extraordinary general meeting (the “EGM”), 2020 first H Shareholders’ class meeting and 2020 first A Shareholders’ class meeting (the “Class Meetings”) on 1 June 2020.
2. 2019 annual general meeting has considered and approved the following proposals: 1) the resolution in relation to the Work Report of the Board for the year 2019; 2) the resolution in relation to the Work Report of the Supervisory Committee for the year 2019; 3) the resolution in relation to debriefing the Work Report of the Independent Non-executive Directors for the year 2019; 4) the resolution in relation to the Final Financial Accounts Report of the Company for the year 2019; 5) the resolution in relation to the Annual Report of the Company and its summary for the year 2019; 6) the resolution in relation to the financial budget of the Company for the year 2020; 7) the resolution in relation to the profit distribution plan of the Company for the year 2019; 8) the resolution in relation to the re-appointment of auditor for the year 2020; 9) the resolution in relation to the Directors’ remuneration for the year 2019; 10) the general mandate to issue, allot and deal with Shares; 11) the general mandate to repurchase H Shares; 12) the resolution in relation to the Updated Mandate of the issue of Debt Financing Instruments; 13) the resolution in relation to the estimated guarantees of the Company for the year 2020; 14) the resolution in relation to the renewal of Liability Insurance for Directors, Supervisors and Senior Management of the Company; and 15) the re-election of executive Directors of the Company, in which the 11th resolution was also approved by the Class Meetings.
3. The EGM has considered the following proposals: 1) the Share Option Incentive Scheme of Sinotrans Limited (revised draft) (《中國外運股份有限公司股票期權激勵計劃(草案修訂稿)》) and a summary thereof; 2) the Share Option Incentive Scheme of Sinotrans Limited (Phase I) (revised draft) (《中國外運股份有限公司股票期權激勵計劃(第一期)(草案修訂稿)》) and a summary thereof; 3) the Appraisal Measures for Implementation of the Share Option Incentive Scheme of Sinotrans Limited (《中國外運股份有限公司股票期權激勵計劃實施考核辦法》); 4) the grant of a mandate to the board of directors by the general meeting to deal with matters regarding the Share Option Incentive Scheme of the Company; 5) the grant of a mandate to the board of directors by the general meeting to deal with matters regarding the Share Option Incentive Scheme (Phase I) of the Company; and 6) the amendments to the Articles of Association and the Procedural Rules for General Meetings of the Company. All the above proposals have been submitted to the Class Meetings for consideration at the same time. Among Which, the resolution No.6 has been considered and passed by the EGM and the Class Meetings, while the resolutions from No.1 to No.5 in relation to the share option incentive scheme and share option incentive scheme (phase I) of the Company were not duly passed by way of poll. The Company will actively communicate with Shareholders and continue to study and promote effective long-term incentive schemes when relevant conditions are fully developed, so as to enhance the Company’s long-term incentive mechanism, thereby attracting and retaining outstanding talents and promoting the healthy development of the Company and facilitating the maximization of Shareholder’s value.
SINOTRANS LIMITED46
Chapter 5Significant Matters
II. PROPOSALS OF PROFIT DISTRIBUTION OR CONVERSION OF COMMON RESERVE FUND INTO SHARE CAPITAL
(I) Profit Distribution Proposal and Proposal of Conversion of Common Reserve Fund into Share Capital for the Half YearWhether to distribute or to convert No
Number of bonus share per 10 shares (share) 0
Amount of dividend per 10 shares (tax included) 0
Number of shares converted per 10 shares (share) 0
Notes to proposals of profit distribution or conversion of capital reserve fund into share capital Nil
(II) Implementation of the Profit Distribution Plan for the Year 2019The Profit Distribution Plan for the year 2019 of the Company has been considered and approved
at the 2019 annual general meeting of the Company on 1 June 2020. The dividend for 2019 of
RMB1.2 per ten shares (tax included), i.e. RMB0.12 per share (tax included) was declared based
on the total share capital of 7,400,803,875 shares, amounting to RMB888,096,465.00 in total (tax
included). The aforesaid dividend has been fully distributed in cash on 16 July 2020.
III. PERFORMANCE OF COMMITMENTS
(I) Commitments during or Carried forward to the Reporting Period by the Actual Controllers, Shareholders, Related Parties, Acquirers of the Company and the Company and Other Relevant Parties3Applicable □Not applicable
Commitment
background
Commitment type Commitment by Summary of the commitment Time and term of the
commitment
Is there a
term for
fulfilment
Whether
timely
and
strictly
fulfilled
Commitments related
to material asset
restructuring
Others Sinotrans & CSC Within three years from the listing date of A shares of the
Company, if the closing prices of the A shares for 20
consecutive trading days are below the latest audited
net assets per share of the Company other than due to
force majeure and malicious speculation of a third party,
subject to law, regulation, normative documents and the
Listing Rules in Listing Places and under the premise
that the shareholding will be in compliance with the
listing requirement, measures including but not limited
to increase in shareholding of the A shares by Sinotrans
& CSC and repurchase of the A share by the Company
will be taken legally to stabilize the share price of the
Company’s A shares.
Time of commitment:
13 April 2018;
Term of the commitment:
18 January 2019 –
17 January 2022
Yes Yes
The Company
All Directors,
Supervisors and
Senior Management
of the Company
47INTERIM REPORT 2020
Chapter 5Significant Matters
From 1 April 2020 to 29 April 2020, the closing prices of the Company’s A shares had been lower
than the latest audited net assets per share for twenty consecutive trading days for the first time
(the latest audited net assets per share of the Company is RMB3.84, with the base date being
31 December 2019, which was stated in the 2019 Annual Report published by the Company),
and the preconditions for implementing the measures to stabilize the A share price have been
triggered. Considering the actual situation and the practicality of related measures, through
discussion, the Company and the controlling shareholder, Sinotrans & CSC have decided to adopt
the measure of increasing the shareholding in the A shares of the Company by Sinotrans & CSC
to stabilize the A share price of the Company. Sinotrans & CSC will use no less than RMB60
million to increase the shareholding in the A shares of the Company during twelve months starting
from 7 May 2020, and the price shall be no higher than the latest audited net assets per share
of the Company (since the Company has distributed the dividend for 2019, namely RMB0.12 per
share on 16 July 2020, net assets per share of the Company has been adjusted from RMB3.84
to RMB3.72. So far Sinotrans & CSC has been fulfilling its commitment by increasing the
shareholding in the A shares of the Company. For details, please refer to the announcements of
the Company dated 30 April 2020, 7 May 2020 and 17 July 2020 on the website of SSE.
For other commitments of the Company within their terms, please refer to section titled
“PERFORMANCE OF COMMITMENTS” in the 2019 annual report of the Company.
IV. APPOINTMENT AND DISMISSAL OF AUDITORS
Description of the appointment and dismissal of auditors3Applicable □Not applicable
On 31 March 2020, the 19th meeting of the second session of the Board was convened, at which the
proposal in relation to the re-appointment of auditor for the year 2020 was considered and approved.
The Board agreed to re-appoint ShineWing Certified Public Accountants LLP as the auditor of the
Company for financial reports and internal control for the year 2020, with a term of office until the
conclusion of the 2020 annual general meeting of the Company. The total audit fee is RMB9.7 million,
among which the audit fees for financial reports and internal control are RMB8.2 million and RMB1.5
million, respectively. The proposal has been considered and approved at the 2019 annual general
meeting convened on 1 June 2020 by the Company.
Explanations on change in the auditor during the auditing period□Applicable 3Not applicable
Explanations of the Company on “Non-Standard Auditing Report” issued by auditors□Applicable 3Not applicable
SINOTRANS LIMITED48
Chapter 5Significant Matters
Explanations of the Company on “Non-Standard Auditing Report” issued by the certified public accountant in the financial report of last year’s annual report□Applicable 3Not applicable
V. EVENTS RELATED TO BANKRUPTCY AND REORGANIZATION
□Applicable 3Not applicable
VI. MATERIAL LITIGATION AND ARBITRATION
□The company was involved in material litigation or arbitration proceedings.
3The company was not involved in material litigation or arbitration proceedings.
VII. PENALTIES AND RECTIFICATION OF LISTED COMPANY, ITS DIRECTORS, SUPERVISORS, SENIOR MANAGEMENT, CONTROLLING SHAREHOLDERS, ACTUAL CONTROLLERS AND ACQUIRERS
□Applicable 3Not applicable
VIII. EXPLANATION ON THE INTEGRITY OF THE COMPANY AND ITS CONTROLLING SHAREHOLDERS AND ACTUAL CONTROLLERS DURING THE REPORTING PERIOD
□Applicable 3Not applicable
IX. THE COMPANY’S EQUITY INCENTIVE SCHEME, EMPLOYEE STOCK OWNERSHIP SCHEME OR OTHER EMPLOYEE INCENTIVES AND THE IMPACT THEREOF
(I) Incentives Disclosed in the Temporary Announcements and without Progress or Changes in Subsequent Implementation□Applicable 3Not applicable
(II) Incentives Undisclosed in Temporary Announcements or with Progress in Subsequent ImplementationEquity incentives
□Applicable 3Not applicable
49INTERIM REPORT 2020
Chapter 5Significant Matters
Other explanations
3Applicable □Not applicable
Summary of Events Enquiry Index
On 31 March 2020, the 19th meeting of the
second session of the Board was convened, at
which the proposal in relation to the Share Option
Incentive Scheme of Sinotrans Limited (revised
draft) (《中國外運股份有限公司股票期權激勵計劃(草 案 修 訂 稿)》) and a summary thereof and
the Share Option Incentive Scheme of Sinotrans
Limited (Phase I) (revised draft) (《中國外運股份有限公司股票期權激勵計劃(第一期)(草案修訂稿)》)
and a summary thereof were considered and
approved.
For details, please refer to the announcements
of the Company dated 31 March 2020 on the
websites of the SSE (www.sse.com.cn) and the
Hong Kong Stock Exchange (www.hkex.com.hk).
On 3 April 2020, the Company has received the
related notice that the SASAC has approved in
principle the implementation of the share option
scheme.
For details, please refer to the announcements of
the Company dated 3 April 2020 on the websites
of the SSE (www.sse.com.cn) and the Hong Kong
Stock Exchange (www.hkex.com.hk).
On 1 June 2020, the Company has convened
the EGM and Class Meetings, at which all the
proposals in relation to share option incentive
scheme were considered but not passed by more
than two-thirds of the shares with voting rights.
For details, please refer to the announcements of
the Company dated 1 June 2020 on the websites
of the SSE (www.sse.com.cn) and the Hong Kong
Stock Exchange (www.hkex.com.hk).
Employee stock ownership scheme
□Applicable 3Not applicable
Other incentives
□Applicable 3Not applicable
X. MATERIAL RELATED PARTY TRANSACTIONS
(I) Material Related Party TransactionsThe material related party transactions undertaken by the Group for the six months ended 30 June
2020 are set out in Note X to the unaudited consolidated interim financial statements.
(II) The Related Party Transactions in Relation to The Ordinary Operations1. Events Disclosed in the Temporary Announcements and without Progress or
Changes in Subsequent Implementation
□Applicable 3Not applicable
SINOTRANS LIMITED50
Chapter 5Significant Matters
2. Events Disclosed in the Temporary Announcements but with Progress or Changes
in Subsequent Implementation
3Applicable □Not applicable
(1) On 10 November 2017, the Company entered into a Master Services Agreement with
China Merchants, the term of which is from 1 January 2018 to 31 December 2020.
According to the agreement, the annual cap of the amount of transportation and
logistics services provided by the Group to China Merchants Group shall be RMB2,500
million, RMB3,250 million and RMB4,225 million in 2018, 2019 and 2020, respectively;
the annual cap of the amount of transportation and logistics services received by the
Group from China Merchant Group shall be RMB3,500 million, RMB4,550 million and
RMB5,915 million in 2018, 2019 and 2020, respectively. For the six months ended 30
June 2020, the transportation and logistics services provided by the Group to China
Merchants amounted to RMB398 million, while the transportation and logistics services
received from China Merchants was RMB726 million.
(2) On 10 November 2017, the Company entered into a Master Lease Agreement with
China Merchants, the term of which is from 1 January 2018 to 31 December 2020.
According to the agreement, the annual cap of the amount of property leased by the
Group from China Merchants Group shall be RMB300 million, RMB330 million and
RMB363 million in 2018, 2019 and 2020, respectively. For the six months ended 30
June 2020, the expenses of the Group in respect of leasing of properties from China
Merchants Group was RMB123 million.
(3) On 10 November 2017, the Company entered into a Financial Services Agreement
with the Finance Company, the term of which is from 1 January 2018 to 31 December
2020. According to the agreement, the daily outstanding balance of the Group’s
deposit at the Finance Company shall not exceed RMB4 billion for the year of 2018,
and RMB5 billion for the year of 2019 and 2020 respectively. For the six months period
ended 30 June 2020, the Group’s daily maximum deposit balance at the Finance
Company was RMB3.857 billion.
The aforesaid related party transactions in relation to the dai ly operations/
continuing connected transactions (1)-(3) have been considered and approved at
the extraordinary general meeting convened on 28 December 2017. For details,
please refer to the announcements dated 10 November 2017 and 28 December
2017 published by the Company on the website of Hong Kong Stock Exchange
(www.hkex.com.hk).
51INTERIM REPORT 2020
Chapter 5Significant Matters
(4) On 7 March 2019, the Company convened the 2019 first extraordinary general
meeting, at which the related party transaction in relation to the ordinary operations
with China Merchants Bank was considered and approved. According to the proposal,
no limit will be imposed on the loan issued by China Merchants Bank, and the
annual cap of deposit is RMB3,500 million and RMB4,000 million in 2019 and 2020,
respectively. As at 30 June 2020, the Group’s deposit balance at China Merchants
Bank was RMB705 million.
For details, please refer to relevant announcements dated 21 January 2019 and 7
March 2019 published by the Company on the websites of SSE (www.sse.com.cn) and
Hong Kong Stock Exchange (www.hkex.com.hk).
3. Events Not Disclosed in the Temporary Announcements
□Applicable 3Not applicable
(III) Related Party Transactions from Acquisition and Disposal of Assets or Equity Interests1. Events Disclosed in the Temporary Announcements and without Progress or
Changes in Subsequent Implementation
□Applicable 3Not applicable
2. Events Disclosed in the Temporary Announcements but with Progress or Changes
in Subsequent Implementation
□Applicable 3Not applicable
3. Events Not Disclosed in the Temporary Announcements
□Applicable 3Not applicable
4. The Performance Achievements during the Reporting Period Shall be Disclosed if
Undertakings on Performance is Involved
□Applicable 3Not applicable
(IV) Material Related Party Transactions involving Joint External Investments1. Events Disclosed in the Temporary Announcements and without Progress or
Changes in Subsequent Implementation
Applicable 3Not applicable
2. Events Disclosed in the Temporary Announcements but with Progress or Changes
in Subsequent Implementation
Applicable 3Not applicable
3. Events Not Disclosed in the Temporary Announcements
Applicable 3Not applicable
SINOTRANS LIMITED52
Chapter 5Significant Matters
(V) Claims and Liabilities between Related Parties1. Events Disclosed in the Temporary Announcements and with No Progress or
Changes in Subsequent Implementation
□Applicable 3Not applicable
2. Events Disclosed in the Temporary Announcements but with Progress or Changes
in Subsequent Implementation
□Applicable 3Not applicable
3. Events Not Disclosed in the Temporary Announcements
3Applicable Not applicable
Unit: Yuan Currency: RMB
Capital provided to related parties Capital provided by related parties to listed company
Related parties Opening balance
Amount of the
transaction Closing balance Opening balance
Amount of the
transaction Closing balance
Other companies controlled by
the same parent company and
ultimate controlling party 4,040,417,559.57 -850,661,272.40 3,189,756,287.17 1,492,491,576.86 –95,135,707.42 1,397,355,869.44
Associates and joint ventures 683,736,803.34 325,348,304.67 1,009,085,108.01 182,723,536.53 114,909,057.64 297,632,594.17
Other related parties 7,746,417.75 2,837,776.64 10,584,194.39 35,758,741.22 -5,709,605.83 30,049,135.39
Total 4,731,900,780.66 -522,475,191.09 4,209,425,589.57 1,710,973,854.61 14,063,744.39 1,725,037,599.00
Reasons for related debts and
liabilities
Proceeds in dealings with related companies
The impact of related debts and
liabilities on the operating
results and financial condition of
Company
Related debts and liabilities are conducted based on the time agreed under the contract or agreement in accordance with the
financial settlement process and have no material effect on the operation results and financial position of the Company.
(VI) Other Material Related Party Transactions□Applicable 3Not applicable
(VII) Others□Applicable 3Not applicable
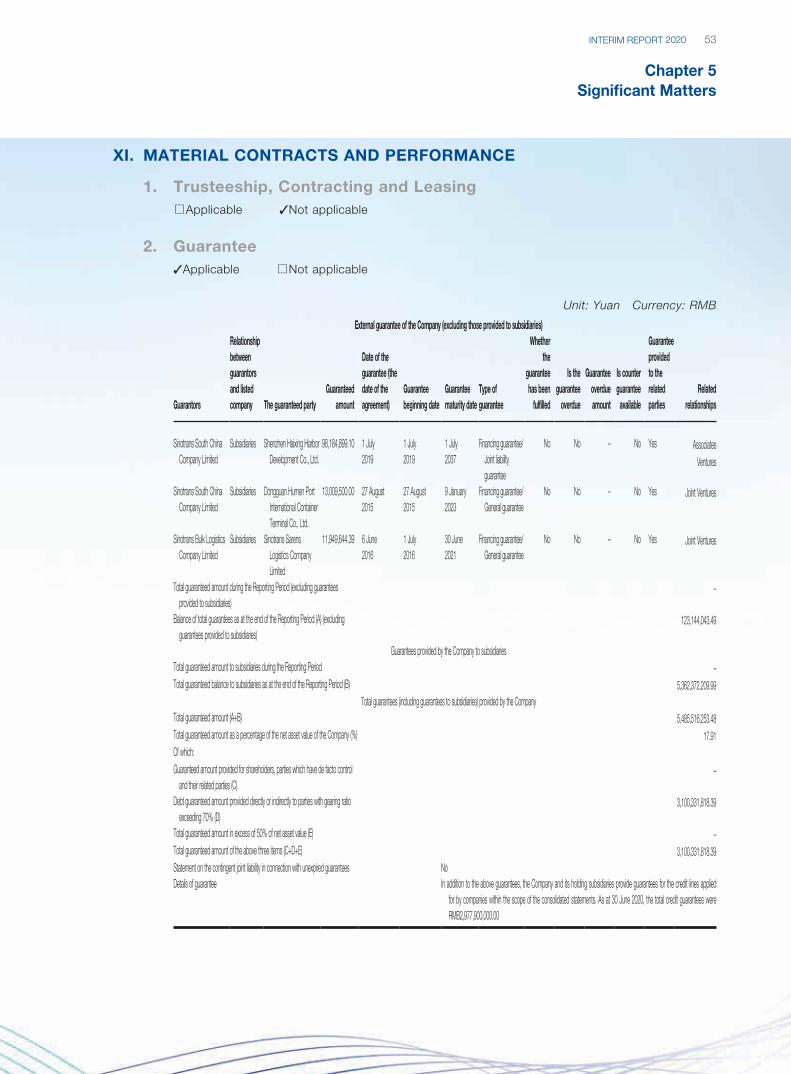
53INTERIM REPORT 2020
Chapter 5Significant Matters
XI. MATERIAL CONTRACTS AND PERFORMANCE
1. Trusteeship, Contracting and Leasing□Applicable 3Not applicable
2. Guarantee3Applicable □Not applicable
Unit: Yuan Currency: RMB
External guarantee of the Company (excluding those provided to subsidiaries)
Guarantors
Relationship between guarantors and listed company The guaranteed party
Guaranteed amount
Date of the guarantee (the date of the agreement)
Guarantee beginning date
Guarantee maturity date
Type of guarantee
Whether the
guarantee has been
fulfilled
Is the guarantee
overdue
Guarantee overdue amount
Is counter guarantee
available
Guarantee provided to the related parties
Related relationships
Sinotrans South China Company Limited
Subsidiaries Shenzhen Haixing Harbor Development Co., Ltd.
98,184,899.10 1 July 2019
1 July 2019
1 July 2037
Financing guarantee/ Joint liability guarantee
No No – No Yes Associates Ventures
Sinotrans South China Company Limited
Subsidiaries Dongguan Humen Port International Container Terminal Co., Ltd.
13,009,500.00 27 August 2015
27 August 2015
9 January 2023
Financing guarantee/General guarantee
No No – No Yes Joint Ventures
Sinotrans Bulk Logistics Company Limited
Subsidiaries Sinotrans Sarens Logistics Company Limited
11,949,644.39 6 June 2016
1 July 2016
30 June 2021
Financing guarantee/General guarantee
No No – No Yes Joint Ventures
Total guaranteed amount during the Reporting Period (excluding guarantees provided to subsidiaries)
–
Balance of total guarantees as at the end of the Reporting Period (A) (excluding guarantees provided to subsidiaries)
123,144,043.49
Guarantees provided by the Company to subsidiariesTotal guaranteed amount to subsidiaries during the Reporting Period –Total guaranteed balance to subsidiaries as at the end of the Reporting Period (B) 5,362,372,209.99
Total guarantees (including guarantees to subsidiaries) provided by the CompanyTotal guaranteed amount (A+B) 5,485,516,253.48Total guaranteed amount as a percentage of the net asset value of the Company (%) 17.91Of which:Guaranteed amount provided for shareholders, parties which have de facto control
and their related parties (C)–
Debt guaranteed amount provided directly or indirectly to parties with gearing ratio exceeding 70% (D)
3,100,331,818.39
Total guaranteed amount in excess of 50% of net asset value (E) –Total guaranteed amount of the above three items (C+D+E) 3,100,331,818.39Statement on the contingent joint liability in connection with unexpired guarantees NoDetails of guarantee In addition to the above guarantees, the Company and its holding subsidiaries provide guarantees for the credit lines applied
for by companies within the scope of the consolidated statements. As at 30 June 2020, the total credit guarantees were RMB2,977,900,000.00
SINOTRANS LIMITED54
Chapter 5Significant Matters
3. Other Material Contracts□Applicable 3Not applicable
XII. THE WORK OF THE LISTED COMPANY ON POVERTY ALLEVIATION
3Applicable □Not applicable
1. Targeted Poverty Alleviation Plan3Applicable □Not applicable
2020 is the decisive year for the establishment of a moderately prosperous society. Under the
overall arrangement of China Merchants, Sinotrans focuses on the general objective of ensuring
rural poor people free from worries over food and clothing and accessible to compulsory
education, basic medical services and safe housing. Considering the task of poverty elimination in
impoverished counties, Sinotrans relies on China Merchants Group Foundation as a professional
unified platform for public welfare and spares no effort in carrying out target poverty alleviation
work, particularly, in improving education and healthcare condition for people in the impoverished
areas. It also attaches importance to the building of brand for agricultural products, driving the
endogenous development of communities and solidifying the foundation of regional economic
development in order to secure a sustainable effect of poverty alleviation.
2. Summary of Targeted Poverty Alleviation during the Reporting Period3Applicable □Not applicable
In 2020, Sinotrans donated RMB12 million through the China Merchants Group Foundation
as a poverty alleviation fund, the utilization of which shall be planned and implemented by the
Foundation. Affected by COVID-19, by the end of June 2020, the China Merchants Group
Foundation’s expenditure for targeted poverty alleviation amounted to RMB39.863 million and 8
poverty alleviation projects have been launched, which are expected to accelerate in the second
half of the year. The main targeted poverty alleviation projects participated by Sinotrans were as
follows:
(1) Community development project in rural areas of Qichun, Hubei Province
Sinotrans has introduced professional social organizations to join in the poverty
alleviation work in Qichun. A community development project has been implemented in
the impoverished rural area, which provides supports to farmers in establishing mutual-
aid groups and cooperative, as well as trainings on aquaculture techniques and industrial
development to help the poor households to live with their own efforts. In 2020, the project
will intensify the capacity building of cooperative, advance the development of agricultural
products and industry cultivation to facilitate poverty elimination and income growth of poor
households.
55INTERIM REPORT 2020
Chapter 5Significant Matters
(2) Kindergarten project in rural areas of Qichun, Hubei Province
In addressing the shortage of pre-school education in remote rural areas, Sinotrans has
introduced social organizations to establish a kindergarten in the northern mountain area of
Qichun County and organized trainings for nursery teachers to provide quality pre-school
education to rural children. In 2020, in addition to financing the operation of the existing 16
classes, it will open 5 new classes to further expand the pre-school education coverage and
break the intergenerational transmission of poverty.
(3) “China Merchants – 27° Agriculture” farmer assistance project (招商局 ·27°農公益助農項目 )
In order to fortify brand building in impoverished areas and leveraging on “27° Agriculture”
as a platform, Sinotrans helps to develop more agricultural products, expand distribution
channel, create more jobs to assist the poor households to realize sustainable development.
(4) Targeted poverty alleviation projects in Chuxiong, Yunnan Province
Sinotrans supports the infrastructure improvement project in Waipulada Village, Yongren
County, the comprehensive community development project in Yongren County, and the
project of education-oriented poverty reduction project in Wuding County. Launched in
2019, all the three projects continue in 2020 to further enhance the rural infrastructures
and motivate the endogenous growth force of the public. In 2020, Sinotrans financed the
construction of a village clinic in Huangguayuan Town, Chuxiong prefecture and Yuanmou
County to improve the medical and health conditions of local villagers.
(5) “China Merchants – Happy Community” rural community assistance project (“招商局 ·幸福家園”鄉村社區支持計劃 )
Sinotrans supports nationwide professional organizations to be engaged in rural communities
to “improve the endogenous development sense and ability of the communities and address
their public needs in a systematic manner”, focuses on the “establishment of self-organizing
communities” and starts with community public affairs, encourages the villagers’ sense and
ability of public participation and continuously promotes the positive role of rural governance
in poverty alleviation.
3. Effectiveness of Targeted Poverty Alleviation□Applicable 3Not applicable
SINOTRANS LIMITED56
Chapter 5Significant Matters
4. Milestones in Performing the Social Responsibility of Targeted Poverty Alleviation3Applicable □Not applicable
(1) Pandemic fight and poverty alleviation
After the outbreak of COVID-19, located in the severely afflicted Hubei Province, Qichun
County was exposed to significant pressures of preventing from poverty returning. As
required by the pandemic prevention and control, Sinotrans in association with the China
Merchants Group Foundation, launched the first-level emergency response of its non-profit
logistics platform “Emergency Delivery” to provide professional logistics service to all sectors
of society for the delivery of pandemic prevention and control materials to Hubei without
any charges. Total approximately 4,000 tons of anti-pandemic materials were delivered via
“Emergency Delivery”, which strongly secured the effective supply of anti-pandemic materials
in Wuhan, Qichun and other affected areas. Besides, given the unmarketable agricultural
products in Qichun due to the pandemic, Sinotrans assisted the farmers to deliver their
agricultural products.
(2) Fulfilment of letters of commitment on targeted poverty alleviation entered into with
the central government
Sinotrans carried out poverty alleviation work in targeted counties through the China
Merchants Group Foundation. As at 30 June 2020, the China Merchants Group Foundation
provided poverty alleviation supports to four targeted counties, i.e. Weining in Guizhou,
Qichun in Hubei, Yecheng in Xinjiang and Shache in Xinjiang with direct support funds of
RMB196.583 million. Besides, it helped attract poverty alleviation funds of RMB4.785 million,
provided trainings to 266 grass-roots cadres and 2,109 technicians, purchased agricultural
products of RMB6.277 million in targeted poverty alleviation counties, assisted agricultural
products sales of RMB5.866 million in targeted poverty alleviation counties and purchased
agricultural products of RMB1.948 million in other poverty-stricken counties.
5. Follow-up Targeted Poverty Alleviation Plan3Applicable □Not applicable
In the second half of 2020, Sinotrans will continue to implement the central government’s overall
task in respect of winning the decisive battle against poverty. Under the overall arrangement and
planning of China Merchants, Sinotrans will further intensify and refine the anti-poverty measures
and help the targeted poverty alleviation counties to win the decisive battle against poverty as
scheduled and in a quality manner.
(1) Accelerating key project construction and securing poverty elimination
Sinotrans will focus on the general objective of ensuring rural poor people free from worries
over food and clothing and accessible to compulsory education, basic medical services
and safe housing, especially facilitate the smooth implementation of education, healthcare,
housing and other infrastructure projects and oversees the utilization of project fund and
progress to expediate poverty elimination in impoverished counties.
57INTERIM REPORT 2020
Chapter 5Significant Matters
(2) Intensifying industry and consumption-based poverty alleviation for long-term
development
Sinotrans will continue to advance the agricultural reform in those poverty-stricken counties
and help the farmers to eliminate poverty and broaden revenue streams in an industry-
oriented and brand-focused manner. In terms of consumption-based poverty alleviation,
Sinotrans will continue to rely on the platform “27° Agriculture” and step up both online and
offline efforts in order to make the agricultural products in the poor counties to “develop
stably, further and better” and allow the poverty-stricken regions to enjoy more benefits from
the market economy.
(3) Improving standardized project management for maximum benefit
Sinotrans will improve project management, adhere to the principle of “open and fair poverty
alleviation” (陽光扶貧) and “transparent poverty alleviation” (透明扶貧) and perform special
audits on the key projects in poor counties in order to ensure the poverty alleviation projects
can stand the test of time and secure poverty alleviation effect.
XIII. CONVERTIBLE BONDS
□Applicable 3Not applicable
XIV. ENVIRONMENTAL INFORMATION
(I) Explanation on Environmental Protection of Companies and Their Significant Subsidiaries Classified as the Key Pollutant Discharging Units Announced by the Environmental Protection Department□Applicable 3Not applicable
(II) Environmental Protection of the Companies Other than Key Pollutant Discharging Units3Applicable □Not applicable
The Company is not classified as the key pollutant discharging units announced by the
environmental protection department. In the process of operating activities, the Company has
complied with relevant national laws and regulations on environmental protection, persisted
in carrying out the concept of environmental protection throughout its business operation and
management and adhered to the principle that “The environmental protection efforts including
energy conservation, emission reduction, quality improvement and efficiency enhancement benefit
the country and its people”. Regarding the achievement of sustainable development as its target,
the Company attaches great importance to improving the energy efficiency and intensifies the
establishment of an energy-saving and environment-friendly enterprise.
SINOTRANS LIMITED58
Chapter 5Significant Matters
In terms of the establishment of organization mechanism, the Company further improved its
environmental protection management system, optimized it organization structure and insisted
on implementing the energy saving and environmental protection works effectively throughout
the production and operation activities to make sure that the main responsibilities of enterprises
in energy saving and environmental protection are further fulfilled. Meanwhile, the Company
further established and improved the accountability system for energy saving and environmental
protection works in line with actual situation to make sure the implementation of all task and
measures, which has made substantial achievements.
In terms of energy conservation and emission reduction, the Company reduced tail gas pollution
emissions through strict implementation of vehicle emission standards, rational deployment and
operation of vehicles, optimization of transportation structure and improvement of vehicle loading
rate and mileage utilization; optimized energy consumption structure by using solar energy,
LED energy-saving lamps, photovoltaic power generation, as well as clean energy vehicles and
eliminating old high energy-consumption equipment; improved operation efficiency and reduced
energy consumption by improving business operation process and technology, and introducing
automatic operation equipment, combining with the application of new technology and intelligent
solution. Through these efforts, we achieved a win-win situation for environmental protection and
economic benefits.
In terms of the publicity of environmental protection, the Company extensively carried out the
publicity and education campaigns on energy conservation and environmental protection based
on actual situation, strived to advocate all employees to strengthen environment protection
awareness and take green and low-carbon actions to conserve energy and protect environment,
so as to shape the concept of working hard and being thrift.
During the Reporting Period, the Company had a total energy consumption of 40,854 tons of
standard coal, representing a decrease of 14.75% as compared to the corresponding period of
last year.
(III) Explanation of Reasons for Non-Disclosure of Environmental Information of Companies other than Key Pollutant Discharging Units□Applicable 3Not applicable
(IV) Explanation of the Subsequent Progress or Changes on the Environmental Information Disclosed during the Reporting Period□Applicable 3Not applicable
59INTERIM REPORT 2020
Chapter 5Significant Matters
XV. CORPORATE GOVERNANCE
During the Reporting Period, the Company kept improving its corporate governance structure in
accordance with the Company Law, the Securities Law, the Code of Corporate Governance for Listed
Companies in China promulgated by the CSRC and other applicable laws and regulations, as well as
the requirements on corporate governance by the SSE and Hong Kong Stock Exchange. The Company
has set up a sound internal control system and constantly promotes the standardized and systematic
management to enhance corporate governance.
The Company has reviewed and adopted the principles and provisions of the CG Code as set out in
Appendix 14 of the SEHK Listing Rules during the period from 1 January 2020 to 30 June 2020 as our
code on corporate governance, and has complied with all code provisions set out in the CG Code.
(I) Members of the BoardAs at 30 June 2020, the Board comprised 11 Directors, including: Mr. Li Guanpeng as the
chairman; Mr. Song Dexing as the vice chairman; Mr. Song Rong as executive Director; Mr. Su
Jian, Mr. Xiong Xianliang, Mr. Jiang Jian, and Mr. Jerry Hsu as non-executive Directors; and Mr.
Wang Taiwen, Mr. Meng Yan, Mr. Song Haiqing and Ms. Li Qian as independent non-executive
Directors.
The Company has published the list of the Board members with their roles and positions on the
websites of Hong Kong Stock Exchange, SSE and the Company. Each Director of the Company
acknowledges his/her responsibilities as a Director and is aware of the Company’s operation
procedure, business activities and development.
(II) Changes in Information of Directors, Supervisors and Senior ManagementDuring the period from 1 January 2020 to 30 June 2020, Directors, Supervisors and Senior
Management of the Company have not changed, and no other latest changes in information of
Directors, Supervisors and Senior Management of the Company are required to be disclosed in
accordance with Rule 13.51B of the SEHK Listing Rules.
On 27 August 2020, the 21th meeting of the second session of the Board was convened, at
which the proposal in relation to appointment of general counsel of the Company was considered
and approved. The Board approved that Tian Lei was appointed as the general counsel of the
Company.
(III) Executive CommitteeThe executive committee is a standing organization under the Board and reports to the Board.
The principal responsibilities of executive committee include conducting research and providing
advice on the development strategy and material investment decisions of the Company; guiding,
examining and monitoring operation management members to carry out the development
strategies, operation plans and other decisions made by the Board; and executing the resolutions
during the adjournment of Board meetings based on the authorization of the Board.
SINOTRANS LIMITED60
Chapter 5Significant Matters
As at 30 June 2020, executive committee comprised chairman of the Board Mr. Li Guanpeng,
vice chairman Mr. Song Dexing, and executive Director Mr. Song Rong, with Mr. Li Guanpeng
acting as the chairman of the executive committee. On 27 August 2020, the 21th meeting of the
second session of the Board was convened, at which the Board approved that the executive
committee was renamed as the strategy committee, and its responsibilities related to business
management decision-making were delegated to the general manager’s meeting, only retaining
the responsibilities of the strategic decision-making. In addition, the Board supplemented non-
executive director Mr. Xiong Xianliang and independent non-executive director Mr. Song Haiqing
as members of the strategy committee.
(IV) Audit CommitteeThe principal responsibilities of the audit committee include reviewing the financial reporting
procedure, internal audit and internal control system of the Company, and monitoring integrity of
the Company’s financial statements, annual reports and accounts and interim reports.
The current audit committee comprises all independent non-executive Directors, namely Mr. Meng
Yan, Mr. Wang Taiwen, Mr. Song Haiqing and Ms. Li Qian, with Mr. Meng Yan acting as the
chairman of the audit committee.
The audit committee of the Company and ShineWing Certified Public Accountants LLP, the
Company’s auditor, have reviewed the unaudited consolidated interim financial statements of the
Company and its subsidiaries for the six months period ended 30 June 2020.
(V) Remuneration CommitteeThe principal responsibilities of the remuneration committee include formulating appraisal
standards of the Company’s Directors and Senior Management as classified by the Articles of
Association, arranging assessment, and developing and reviewing the Company’s remuneration
policy and structure for all Directors and Senior Management.
The current remuneration committee comprises all independent non-executive Directors, namely
Ms. Li Qian, Mr. Wang Taiwen, Mr. Meng Yan, and Mr. Song Haiqing, with Ms. Li Qian acting as
the chairman of the remuneration committee.
(VI) Nomination CommitteeThe principal responsibilities of the nomination committee include selecting and making
recommendations on candidates for Directors, president of the Company and other Senior
Management as classified by the Articles of Association, and the selecting criteria and procedures,
and assessing the independence of independent non-executive Directors.
The current nomination committee comprises all independent non-executive Directors and
chairman of the Board, namely Mr. Wang Taiwen, Mr. Meng Yan, Mr. Song Haiqing, Ms. Li Qian
and Mr. Li Guanpeng, with Mr. Wang Taiwen acting as the chairman of the nomination committee.
61INTERIM REPORT 2020
Chapter 5Significant Matters
(VII) Supervisory CommitteeThe Supervisory Committee reports to general meeting. As a standing supervisory organization
of the Company, the principal responsibilities of the Supervisory Committee include supervising
the Board and its members, as well as Senior Management (including president, vice president,
chief financial officer, board secretary, chief digital officer), to prevent them from abusing authority
or infringing the legitimate interests of Shareholders, the Company or Company’s staffs, and to
safeguard legitimate interests of the Company and Shareholders.
The current Supervisory Committee comprises one shareholder-representative Supervisor, two
independent Supervisors and two staff-representative Supervisors, namely Mr. Liu Yingjie, Mr.
Zhou Fangsheng, Mr. Fan Zhaoping, Ms. Ren Dongxiao and Ms. Mao Zheng, with Mr. Liu Yingjie
acting as the chairman of the Supervisory Committee.
(VIII) Model Code for Securit ies Transactions by Directors and SupervisorsThe Company has adopted the Model Code contained in Appendix 10 to the SEHK Listing Rules
as the code of conduct for securities transactions by the Company’s Directors and Supervisors.
The Directors and Supervisors have confirmed, following specific enquiries made by the Company
that they have complied with the required standard set out in the Model Code and the Company’s
code of conduct regarding securities transactions by directors and supervisors for the six months
from 1 January 2020 to 30 June 2020.
XVI. EXPLANATION ON OTHER MATERIAL MATTERS
(I) Changes of Accounting Policies, Accounting Estimates and Calculation Methods and Their Reasons and Impact Compared to Last Accounting Period3Applicable □Not applicable
1. CHANGES OF ACCOUNTING POLICIES AND THEIR EFFECTS
The Ministry of Finance issued Interpretation of Accounting Standards for Business
Enterprises No. 13 (Cai Kuai [2019] No. 21) on 10 December 2019, Interim Provisions on
Accounting Treatment Related to Carbon Emission Trading (Cai Kuai [2019] No. 22) on 16
December 2019, and Accounting Treatment of Rent Concessions Related to the COVID-19
(Cai Kuai [2020] No. 10) on 19 June 2020. The Group has adopted the above interpretations
and provisions for the preparation of the financial statements for the six months ended 30
June 2020. Interpretation of the Accounting Standards for Business Enterprises No. 13 and
Interim Provisions on Accounting Treatment Related to Carbon Emission Trading have no
significant impact on the Group and the Company.
In accordance with the “Accounting Treatment of Rent Concessions Related to the
COVID-19”, the Group adopts the simplified method for all rent concessions, such as rent
reductions and deferred payments, concluded between the Group as a party to a lease
contract and a lessor or lessee under an existing lease contract, directly caused by the
COVID-19, and does not evaluate whether a lease change has occurred or whether a lease
classification has been reevaluated.
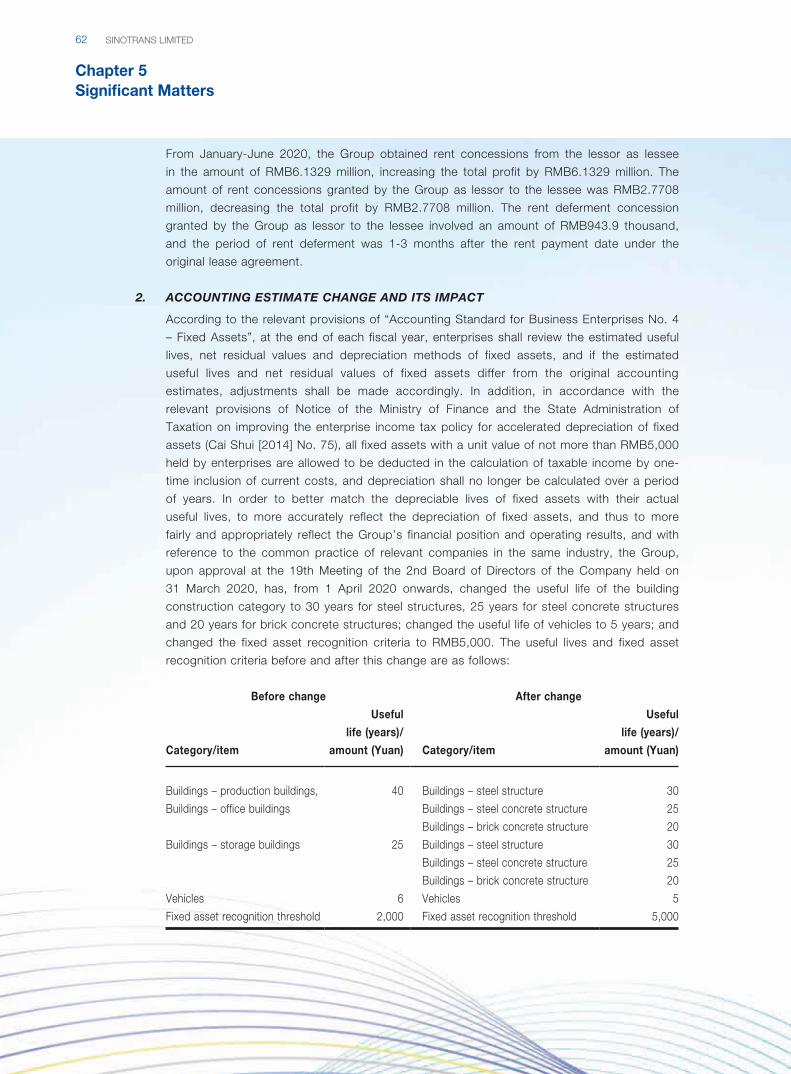
SINOTRANS LIMITED62
Chapter 5Significant Matters
From January-June 2020, the Group obtained rent concessions from the lessor as lessee
in the amount of RMB6.1329 million, increasing the total profit by RMB6.1329 million. The
amount of rent concessions granted by the Group as lessor to the lessee was RMB2.7708
million, decreasing the total profit by RMB2.7708 million. The rent deferment concession
granted by the Group as lessor to the lessee involved an amount of RMB943.9 thousand,
and the period of rent deferment was 1-3 months after the rent payment date under the
original lease agreement.
2. ACCOUNTING ESTIMATE CHANGE AND ITS IMPACT
According to the relevant provisions of “Accounting Standard for Business Enterprises No. 4
– Fixed Assets”, at the end of each fiscal year, enterprises shall review the estimated useful
lives, net residual values and depreciation methods of fixed assets, and if the estimated
useful lives and net residual values of fixed assets differ from the original accounting
estimates, adjustments shall be made accordingly. In addition, in accordance with the
relevant provisions of Notice of the Ministry of Finance and the State Administration of
Taxation on improving the enterprise income tax policy for accelerated depreciation of fixed
assets (Cai Shui [2014] No. 75), all fixed assets with a unit value of not more than RMB5,000
held by enterprises are allowed to be deducted in the calculation of taxable income by one-
time inclusion of current costs, and depreciation shall no longer be calculated over a period
of years. In order to better match the depreciable lives of fixed assets with their actual
useful lives, to more accurately reflect the depreciation of fixed assets, and thus to more
fairly and appropriately reflect the Group’s financial position and operating results, and with
reference to the common practice of relevant companies in the same industry, the Group,
upon approval at the 19th Meeting of the 2nd Board of Directors of the Company held on
31 March 2020, has, from 1 April 2020 onwards, changed the useful life of the building
construction category to 30 years for steel structures, 25 years for steel concrete structures
and 20 years for brick concrete structures; changed the useful life of vehicles to 5 years; and
changed the fixed asset recognition criteria to RMB5,000. The useful lives and fixed asset
recognition criteria before and after this change are as follows:
Before change After change
Category/item
Useful
life (years)/
amount (Yuan) Category/item
Useful
life (years)/
amount (Yuan)
Buildings – production buildings,
Buildings – office buildings
40 Buildings – steel structure 30
Buildings – steel concrete structure 25
Buildings – brick concrete structure 20
Buildings – storage buildings 25 Buildings – steel structure 30
Buildings – steel concrete structure 25
Buildings – brick concrete structure 20
Vehicles 6 Vehicles 5
Fixed asset recognition threshold 2,000 Fixed asset recognition threshold 5,000
63INTERIM REPORT 2020
Chapter 5Significant Matters
According to the provisions of “Accounting Standard for Business Enterprises No. 28 –
Changes in Accounting Estimates, Accounting Policies and Error Correction”, the future
applicable method is adopted in this accounting estimate change, which has no impact on
the financial status and operating results of the Group and the Company in previous years.
This change in accounting estimate resulted in a decrease in total profit of RMB13.0864
million for the period.
(II) Correction of Significant Accounting Errors Required to be Restated, the Amount after Correction, Reasons and Impact during the Reporting Period□Applicable 3Not applicable
(III) Others□Applicable 3Not applicable
SINOTRANS LIMITED64
Chapter 6Movement of Ordinary Shares and Particulars of Shareholders
I. CHANGES IN SHARE CAPITAL
(I) Table of Changes in Shares1. Table of Changes in Shares
During the Reporting Period, there is no change in the total share numbers and shareholding
structure of ordinary shares of the Company.
2. Particulars of Changes in Shares
□Applicable 3Not applicable
3. Effect of Changes in Shares on Financial Indicators such as Earnings per Share
and Net Assets per Share within the Period from the End of the Reporting Period to
Disclosure Date of the Interim Report (if any)
□Applicable 3Not applicable
4. Other Contents that the Company Deems Necessary or Security Regulatory
Authorities Require to Disclose
□Applicable 3Not applicable
(II) Changes in Restricted Shares□Applicable 3Not applicable
II. PARTICULARS OF SHAREHOLDERS
(I) Number of Shareholders:Number of ordinary Shareholders at the end of the Reporting Period
(shareholders) 72,058
Number of preferred Shareholders with restored voting rights at the end of the
Reporting Period (shareholders) 0
Note: At the end of the Reporting Period, the Company has 71,930 A shareholders and 128 registered H shareholders.
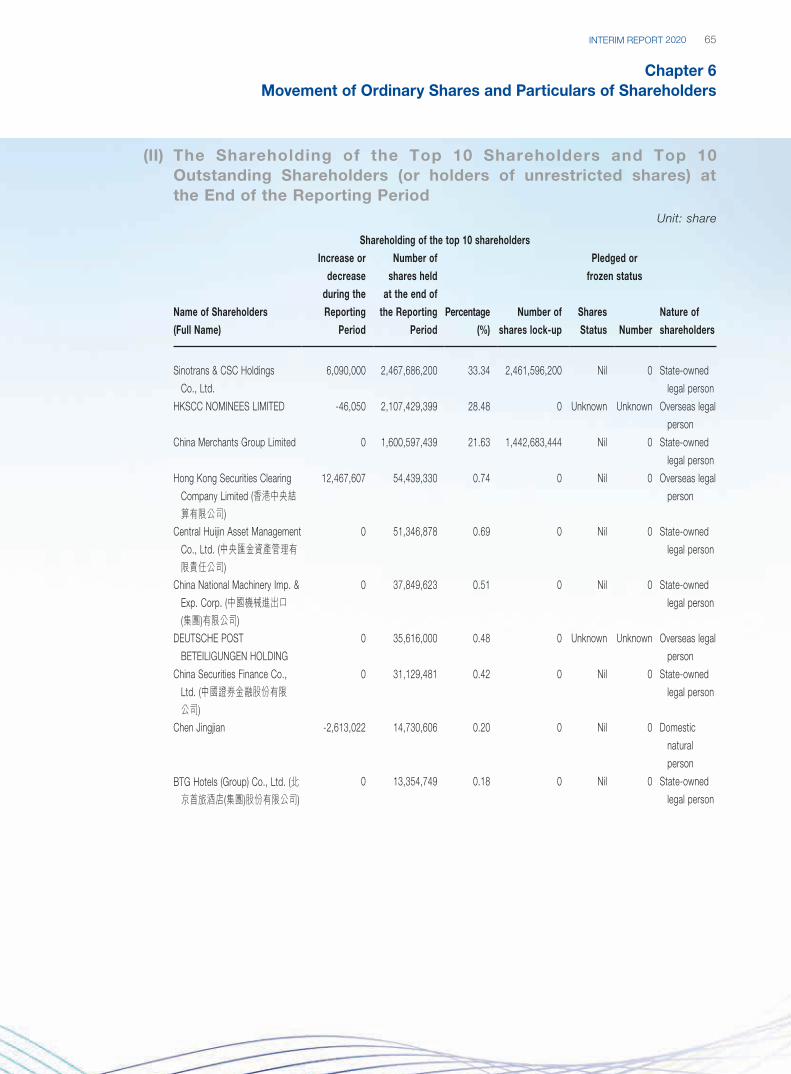
65INTERIM REPORT 2020
Chapter 6Movement of Ordinary Shares and Particulars of Shareholders
(II) The Shareholding of the Top 10 Shareholders and Top 10 Outstanding Shareholders (or holders of unrestricted shares) at the End of the Reporting Period
Unit: share
Shareholding of the top 10 shareholders
Name of Shareholders
(Full Name)
Increase or
decrease
during the
Reporting
Period
Number of
shares held
at the end of
the Reporting
Period
Percentage
(%)
Number of
shares lock-up
Pledged or
frozen status
Nature of
shareholders
Shares
Status Number
Sinotrans & CSC Holdings
Co., Ltd.
6,090,000 2,467,686,200 33.34 2,461,596,200 Nil 0 State-owned
legal person
HKSCC NOMINEES LIMITED -46,050 2,107,429,399 28.48 0 Unknown Unknown Overseas legal
person
China Merchants Group Limited 0 1,600,597,439 21.63 1,442,683,444 Nil 0 State-owned
legal person
Hong Kong Securities Clearing
Company Limited (香港中央結算有限公司)
12,467,607 54,439,330 0.74 0 Nil 0 Overseas legal
person
Central Huijin Asset Management
Co., Ltd. (中央匯金資產管理有限責任公司)
0 51,346,878 0.69 0 Nil 0 State-owned
legal person
China National Machinery Imp. &
Exp. Corp. (中國機械進出口 (集團)有限公司)
0 37,849,623 0.51 0 Nil 0 State-owned
legal person
DEUTSCHE POST
BETEILIGUNGEN HOLDING
0 35,616,000 0.48 0 Unknown Unknown Overseas legal
person
China Securities Finance Co.,
Ltd. (中國證券金融股份有限 公司)
0 31,129,481 0.42 0 Nil 0 State-owned
legal person
Chen Jingjian -2,613,022 14,730,606 0.20 0 Nil 0 Domestic
natural
person
BTG Hotels (Group) Co., Ltd. (北京首旅酒店(集團)股份有限公司)
0 13,354,749 0.18 0 Nil 0 State-owned
legal person
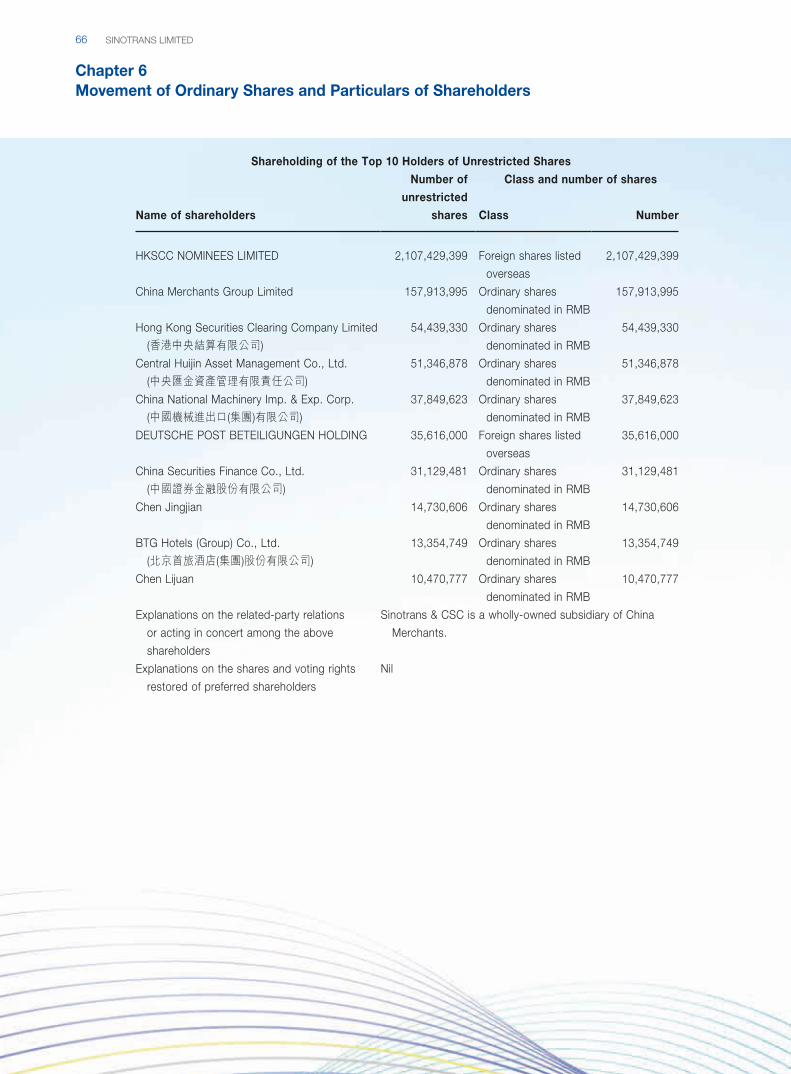
SINOTRANS LIMITED66
Chapter 6Movement of Ordinary Shares and Particulars of Shareholders
Shareholding of the Top 10 Holders of Unrestricted Shares
Name of shareholders
Number of
unrestricted
shares
Class and number of shares
Class Number
HKSCC NOMINEES LIMITED 2,107,429,399 Foreign shares listed
overseas
2,107,429,399
China Merchants Group Limited 157,913,995 Ordinary shares
denominated in RMB
157,913,995
Hong Kong Securities Clearing Company Limited
(香港中央結算有限公司)
54,439,330 Ordinary shares
denominated in RMB
54,439,330
Central Huijin Asset Management Co., Ltd.
(中央匯金資產管理有限責任公司)
51,346,878 Ordinary shares
denominated in RMB
51,346,878
China National Machinery Imp. & Exp. Corp.
(中國機械進出口(集團)有限公司)
37,849,623 Ordinary shares
denominated in RMB
37,849,623
DEUTSCHE POST BETEILIGUNGEN HOLDING 35,616,000 Foreign shares listed
overseas
35,616,000
China Securities Finance Co., Ltd.
(中國證券金融股份有限公司)
31,129,481 Ordinary shares
denominated in RMB
31,129,481
Chen Jingjian 14,730,606 Ordinary shares
denominated in RMB
14,730,606
BTG Hotels (Group) Co., Ltd.
(北京首旅酒店(集團)股份有限公司)
13,354,749 Ordinary shares
denominated in RMB
13,354,749
Chen Lijuan 10,470,777 Ordinary shares
denominated in RMB
10,470,777
Explanations on the related-party relations
or acting in concert among the above
shareholders
Sinotrans & CSC is a wholly-owned subsidiary of China
Merchants.
Explanations on the shares and voting rights
restored of preferred shareholders
Nil
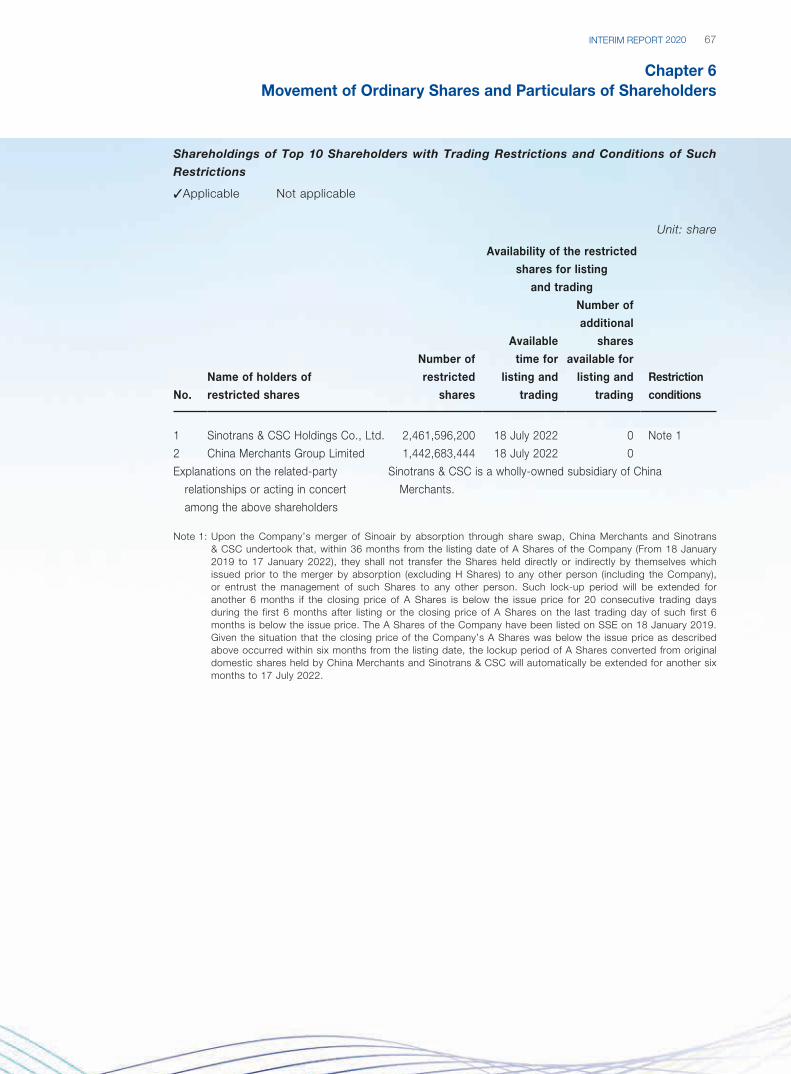
67INTERIM REPORT 2020
Chapter 6Movement of Ordinary Shares and Particulars of Shareholders
Shareholdings of Top 10 Shareholders with Trading Restrictions and Conditions of Such
Restrictions
3Applicable Not applicable
Unit: share
No.
Name of holders of
restricted shares
Number of
restricted
shares
Availability of the restricted
shares for listing
and trading
Restriction
conditions
Available
time for
listing and
trading
Number of
additional
shares
available for
listing and
trading
1 Sinotrans & CSC Holdings Co., Ltd. 2,461,596,200 18 July 2022 0 Note 1
2 China Merchants Group Limited 1,442,683,444 18 July 2022 0
Explanations on the related-party
relationships or acting in concert
among the above shareholders
Sinotrans & CSC is a wholly-owned subsidiary of China
Merchants.
Note 1: Upon the Company’s merger of Sinoair by absorption through share swap, China Merchants and Sinotrans & CSC undertook that, within 36 months from the listing date of A Shares of the Company (From 18 January 2019 to 17 January 2022), they shall not transfer the Shares held directly or indirectly by themselves which issued prior to the merger by absorption (excluding H Shares) to any other person (including the Company), or entrust the management of such Shares to any other person. Such lock-up period will be extended for another 6 months if the closing price of A Shares is below the issue price for 20 consecutive trading days during the first 6 months after listing or the closing price of A Shares on the last trading day of such first 6 months is below the issue price. The A Shares of the Company have been listed on SSE on 18 January 2019. Given the situation that the closing price of the Company’s A Shares was below the issue price as described above occurred within six months from the listing date, the lockup period of A Shares converted from original domestic shares held by China Merchants and Sinotrans & CSC will automatically be extended for another six months to 17 July 2022.
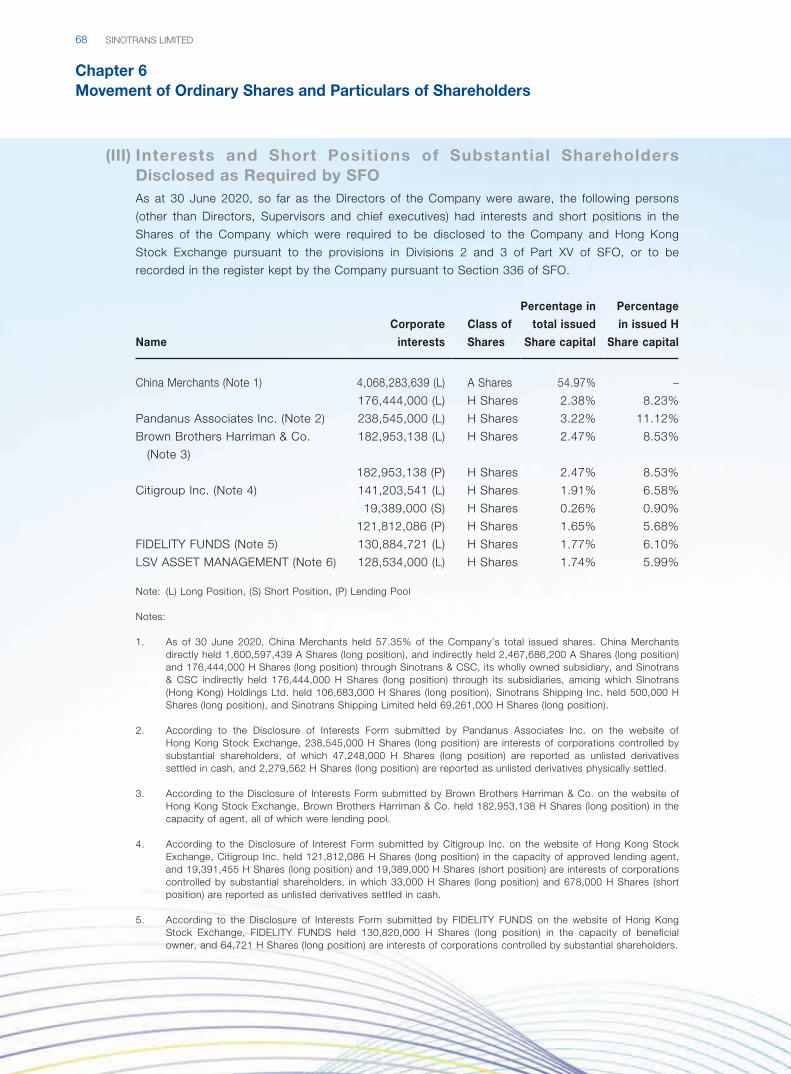
SINOTRANS LIMITED68
Chapter 6Movement of Ordinary Shares and Particulars of Shareholders
(III) Interests and Short Positions of Substantial Shareholders Disclosed as Required by SFOAs at 30 June 2020, so far as the Directors of the Company were aware, the following persons
(other than Directors, Supervisors and chief executives) had interests and short positions in the
Shares of the Company which were required to be disclosed to the Company and Hong Kong
Stock Exchange pursuant to the provisions in Divisions 2 and 3 of Part XV of SFO, or to be
recorded in the register kept by the Company pursuant to Section 336 of SFO.
Name
Corporate
interests
Class of
Shares
Percentage in
total issued
Share capital
Percentage
in issued H
Share capital
China Merchants (Note 1) 4,068,283,639 (L) A Shares 54.97% –
176,444,000 (L) H Shares 2.38% 8.23%
Pandanus Associates Inc. (Note 2) 238,545,000 (L) H Shares 3.22% 11.12%
Brown Brothers Harriman & Co.
(Note 3)
182,953,138 (L) H Shares 2.47% 8.53%
182,953,138 (P) H Shares 2.47% 8.53%
Citigroup Inc. (Note 4) 141,203,541 (L) H Shares 1.91% 6.58%
19,389,000 (S) H Shares 0.26% 0.90%
121,812,086 (P) H Shares 1.65% 5.68%
FIDELITY FUNDS (Note 5) 130,884,721 (L) H Shares 1.77% 6.10%
LSV ASSET MANAGEMENT (Note 6) 128,534,000 (L) H Shares 1.74% 5.99%
Note: (L) Long Position, (S) Short Position, (P) Lending Pool
Notes:
1. As of 30 June 2020, China Merchants held 57.35% of the Company’s total issued shares. China Merchants directly held 1,600,597,439 A Shares (long position), and indirectly held 2,467,686,200 A Shares (long position) and 176,444,000 H Shares (long position) through Sinotrans & CSC, its wholly owned subsidiary, and Sinotrans & CSC indirectly held 176,444,000 H Shares (long position) through its subsidiaries, among which Sinotrans (Hong Kong) Holdings Ltd. held 106,683,000 H Shares (long position), Sinotrans Shipping Inc. held 500,000 H Shares (long position), and Sinotrans Shipping Limited held 69,261,000 H Shares (long position).
2. According to the Disclosure of Interests Form submitted by Pandanus Associates Inc. on the website of Hong Kong Stock Exchange, 238,545,000 H Shares (long position) are interests of corporations controlled by substantial shareholders, of which 47,248,000 H Shares (long position) are reported as unlisted derivatives settled in cash, and 2,279,562 H Shares (long position) are reported as unlisted derivatives physically settled.
3. According to the Disclosure of Interests Form submitted by Brown Brothers Harriman & Co. on the website of Hong Kong Stock Exchange, Brown Brothers Harriman & Co. held 182,953,138 H Shares (long position) in the capacity of agent, all of which were lending pool.
4. According to the Disclosure of Interest Form submitted by Citigroup Inc. on the website of Hong Kong Stock Exchange, Citigroup Inc. held 121,812,086 H Shares (long position) in the capacity of approved lending agent, and 19,391,455 H Shares (long position) and 19,389,000 H Shares (short position) are interests of corporations controlled by substantial shareholders, in which 33,000 H Shares (long position) and 678,000 H Shares (short position) are reported as unlisted derivatives settled in cash.
5. According to the Disclosure of Interests Form submitted by FIDELITY FUNDS on the website of Hong Kong Stock Exchange, FIDELITY FUNDS held 130,820,000 H Shares (long position) in the capacity of beneficial owner, and 64,721 H Shares (long position) are interests of corporations controlled by substantial shareholders.
69INTERIM REPORT 2020
Chapter 6Movement of Ordinary Shares and Particulars of Shareholders
6. According to the Disclosure of Interests Form submitted by LSV ASSET MANAGEMENT on the website of Hong Kong Stock Exchange, LSV ASSET MANAGEMENT held 87,013,000 H Shares (long position) in the capacity of investment manager. 41,521,000 H Shares (long position) are deemed interest through its general partnership interest in certain limited partnerships.
Save as disclosed above, as at 30 June 2020, so far as the Directors of the Company were
aware, there was no other person (other than Directors, Supervisors or chief executives) who had
any interests and short positions in the Shares of the Company which would fall to be recorded in
the register kept by the Company pursuant to Section 336 of SFO and disclosed to the Company
and Hong Kong Stock Exchange pursuant to the provisions in Divisions 2 and 3 of Part XV of
SFO.
(IV) Strategic Investors or General Legal Person Become Top 10 Shareholders Due to the Placement of New Shares□Applicable 3Not applicable
III. CHANGES OF CONTROLLING SHAREHOLDERS OR ACTUAL CONTROLLERS
□Applicable 3Not applicable
IV. REPURCHASE, SALE OR REDEMPTION OF LISTED SECURITIES OF THE COMPANY
During the six months ended 30 June 2020, none of the members of the Group has repurchased, sold
or redeemed any listed securities of the Company.
SINOTRANS LIMITED70
Chapter 7Particulars of Preferred Shares
□Applicable 3Not applicable
Chapter 8Directors, Supervisors and Senior Management
71INTERIM REPORT 2020
I. CHANGES IN SHAREHOLDING
(I) Changes in Shareholding of Current and Resigned Directors, Supervisors and Senior Management During the Reporting Period□Applicable 3Not applicable
Other information
□Applicable 3Not applicable
(II) The Equity Incentives Granted to the Directors, Supervisors and Senior Management During the Reporting Period□Applicable 3Not applicable
(III) Interests and Short Positions of the Directors, Supervisors and Chief ExecutivesAs at 30 June 2020, so far as the Directors of the Company were aware, none of the Directors,
Supervisors, chief executives or their associates had any interests in any shares or debentures
and short positions of the Company or any associated corporation of the Company which were
required to be notified to the Company and Hong Kong Stock Exchange pursuant to Divisions 7
and 8 of Part XV of SFO (including interests and short positions which they are deemed to have
under such provisions of the SFO), or which were required pursuant to Section 352 of SFO to be
recorded in the register kept by the Company referred to therein, or which were required to be
notified to the Company and Hong Kong Stock Exchange pursuant to the Model Code.
II. C H A N G E S O F D I R E C T O R S , S U P E R V I S O R S A N D S E N I O R MANAGEMENT OF THE COMPANY
3Applicable □Not applicable
Name Position held Changes
Tian Lei General counsel Appointed
Explanations of changes of Directors, Supervisors and Senior Management of the Company3Applicable □Not applicable
On 27 August 2020, the 21th meeting of the second session of the Board was convened, at which the
proposal in relation to appointment of general counsel of the Company was considered and approved.
The Board approved that Tian Lei was appointed as the general counsel of the Company. For details,
please refer to relevant announcements of the Company disclosed on the websites of SSE (www.sse.
com.cn) and Hong Kong Stock Exchange (www.hkex.com.hk).
III. OTHERS
□Applicable 3Not applicable
SINOTRANS LIMITED72
Chapter 9Particulars of Corporate Bonds
3Applicable □Not applicable
I. BASIC INFORMATION OF CORPORATE BONDS
Unit: hundred million Yuan Currency: RMB
Name of bond Short name Code
Date of
issuance Maturity date
Balance
of bond
Interest
rate (%)
Manner of payment of
principal and interest
Transaction
site
Sinotrans Limited 2016
Corporate Bond (First
Tranche)
16 SINOTRANS 01 136248 2 March 2016 2 March 2021 20 3.20 Annual interest, no
compound interest,
repayment of principal
upon maturity
SSE
Sinotrans Limited 2016
Corporate Bond
(Second Tranche)
16 SINOTRANS 03 136654 24 August 2016 24 August 2021 13.5 2.94 (24
August
2016 – 23
August
2019);
3.70 (24
August
2019 – 23
August
2021)
Annual interest, no
compound interest,
repayment of principal
upon maturity
SSE
Investor Suitability Arrangements: “16 Sinotrans 01” and “16 Sinotrans 03” are bonds traded to qualified
investors.
Interest Payment of Corporate Bonds3Applicable □Not Applicable
The Company paid the interest of RMB64 million on the 16 Sinotrans 01 corporate bonds on 2 March
2020, and paid the interest of RMB49.95 million on the 16 Sinotrans 03 corporate bonds on 24 August
2020, all of which were announced on the website of the SSE.
Other Particulars of Corporate Bonds3Applicable □Not Applicable
According to the announcement disclosed on 29 July 2019, the Company increased the coupon rate
of the “16 Sinotrans 03” corporate bonds for the subsequent duration by 76 basis points, namely the
coupon rate would be 3.70% for last 2 years within the duration of the bond and remain unchanged.
According to the results of put-back of “16 Sinotrans 03” corporate bond, the number of put-back
of “16 Sinotrans 03” corporate bonds was 150,000 lots (10 bonds for one lot, and each bond with a
nominal value of RMB100), and the amount of put-back was RMB150,000,000 (exclusive of interest),
the release date of the put-back funds was 26 August 2019. After the compeletion of put-back, the
number of “16 Sinotrans 03” corporate bonds listed and traded on the SSE was 1,350,000 lots (the
total par value is RMB1,350,000,000). For details, please refer to the announcements of the Company
dated 29 July 2019 and 21 August 2019 disclosed on the website of SSE.
73INTERIM REPORT 2020
Chapter 9Particulars of Corporate Bonds
II. CONTACT PERSON AND CONTACT METHOD OF BOND TRUSTEE AND CONTACT INFORMATION OF CREDIT RATING AGENCIES
Bonds trustee Name BOCI Securities Limited
Address No. 110, Xidan North Avenue, Xicheng District, Beijing
Contact Person He Yinhui, Zhou Yuqing
Telephone 010-66229138
Credit rating agency Name Shanghai Brilliance Credit Rating & Investors Service Co., Ltd.
Address 14FL. Huasheng Building, No.398 Hankou Rd, Huangpu
District, Shanghai
Other Explanations:
□Applicable 3Not Applicable
III. USE OF PROCEEDS FROM CORPORATE BONDS
3Applicable □Not Applicable
Upon receipt of the proceeds, the Company has transferred the proceeds from the special account to
its own fund account. To use such fund, the Company exercised the related approval procedure of fund
expend, and strictly followed the purposes of proceeds agreed in the prospectus, which mainly included
the port charges, supplier payment, storage fees and other paying in relation to the daily operation.
There is no exception situations, and the closing balance of the proceeds is 0 currently.
IV. RATING OF CORPORATE BONDS
3Applicable □Not Applicable
Shanghai Brilliance Credit Rating & Investors Service Co., Ltd. has given a credit rating of AAA on the
issuer in relation to the corporate bonds, demonstrating that the issuer has a strong ability to repay its
debts and is basically not affected by the adverse economic environment, with low level of default risk;
and the current debt rating of the corporate bonds “16 Sinotrans 01” and “16 Sinotrans 03” is AAA,
demonstrating that the bonds have strong creditworthiness and security to be repaid, and is basically
not affected by the adverse economic environment, with low level of default risk. The rating is dated
26 May 2020 and the rating outlook is stable, with no changes as compared to last rating results. The
Company has disclosed the Rating Report on Sinotrans Limited and Corporate Bonds “16 Sinotrans
01” and “16 Sinotrans 03” issued by Sinotrans Limited on the website of the SSE.
V. CREDIT ENHANCEMENT MECHANISM, DEBT REPAYMENT PLAN AND OTHER RELEVANT INFORMATION OF CORPORATE BONDS DURING THE REPORTING PERIOD
3Applicable □Not Applicable
After the issuance of the Corporate Bonds, the Company will further strengthen the management of
assets and liabilities, liquidity management and the management of the use of proceeds according to
the debt structure, ensure that the funds are used as planned, and timely and fully prepare the funds for
the annual interest payment and principal repayment upon maturity, so as to fully protect the interests
of investors.
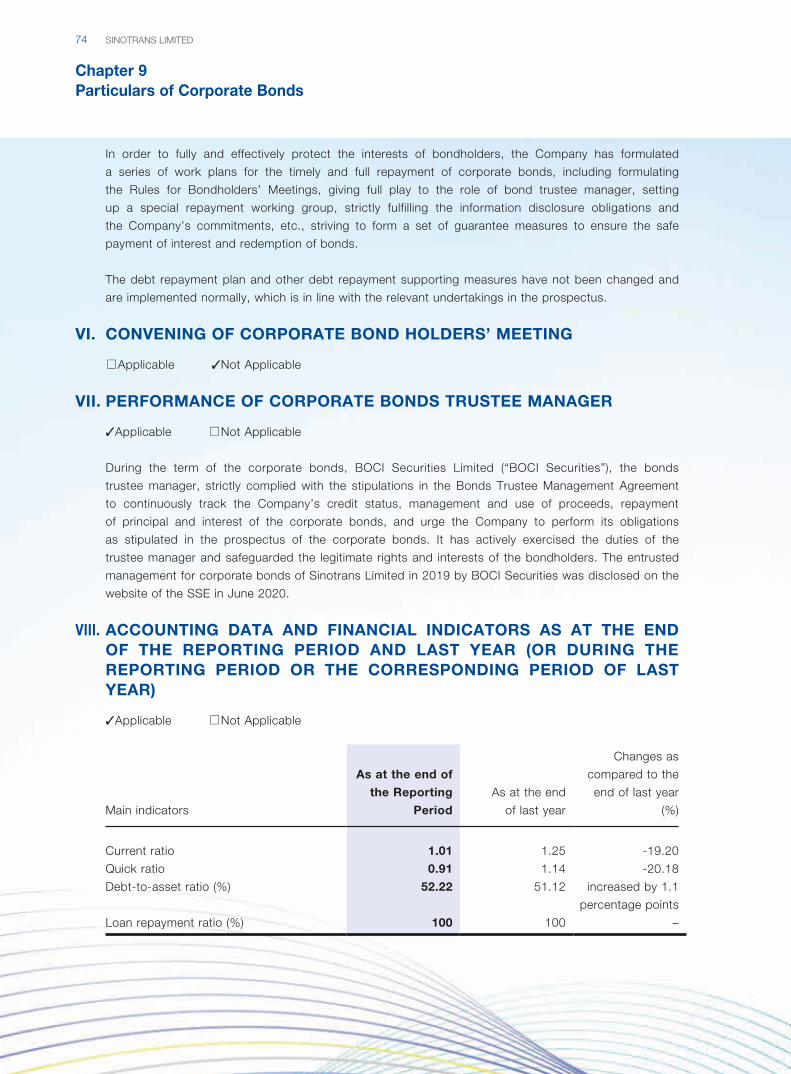
SINOTRANS LIMITED74
Chapter 9Particulars of Corporate Bonds
In order to fully and effectively protect the interests of bondholders, the Company has formulated
a series of work plans for the timely and full repayment of corporate bonds, including formulating
the Rules for Bondholders’ Meetings, giving full play to the role of bond trustee manager, setting
up a special repayment working group, strictly fulfilling the information disclosure obligations and
the Company’s commitments, etc., striving to form a set of guarantee measures to ensure the safe
payment of interest and redemption of bonds.
The debt repayment plan and other debt repayment supporting measures have not been changed and
are implemented normally, which is in line with the relevant undertakings in the prospectus.
VI. CONVENING OF CORPORATE BOND HOLDERS’ MEETING
□Applicable 3Not Applicable
VII. PERFORMANCE OF CORPORATE BONDS TRUSTEE MANAGER
3Applicable □Not Applicable
During the term of the corporate bonds, BOCI Securities Limited (“BOCI Securities”), the bonds
trustee manager, strictly complied with the stipulations in the Bonds Trustee Management Agreement
to continuously track the Company’s credit status, management and use of proceeds, repayment
of principal and interest of the corporate bonds, and urge the Company to perform its obligations
as stipulated in the prospectus of the corporate bonds. It has actively exercised the duties of the
trustee manager and safeguarded the legitimate rights and interests of the bondholders. The entrusted
management for corporate bonds of Sinotrans Limited in 2019 by BOCI Securities was disclosed on the
website of the SSE in June 2020.
VIII. ACCOUNTING DATA AND FINANCIAL INDICATORS AS AT THE END OF THE REPORTING PERIOD AND LAST YEAR (OR DURING THE REPORTING PERIOD OR THE CORRESPONDING PERIOD OF LAST YEAR)
3Applicable □Not Applicable
Main indicators
As at the end of
the Reporting
Period
As at the end
of last year
Changes as
compared to the
end of last year
(%)
Current ratio 1.01 1.25 -19.20
Quick ratio 0.91 1.14 -20.18
Debt-to-asset ratio (%) 52.22 51.12 increased by 1.1
percentage points
Loan repayment ratio (%) 100 100 –
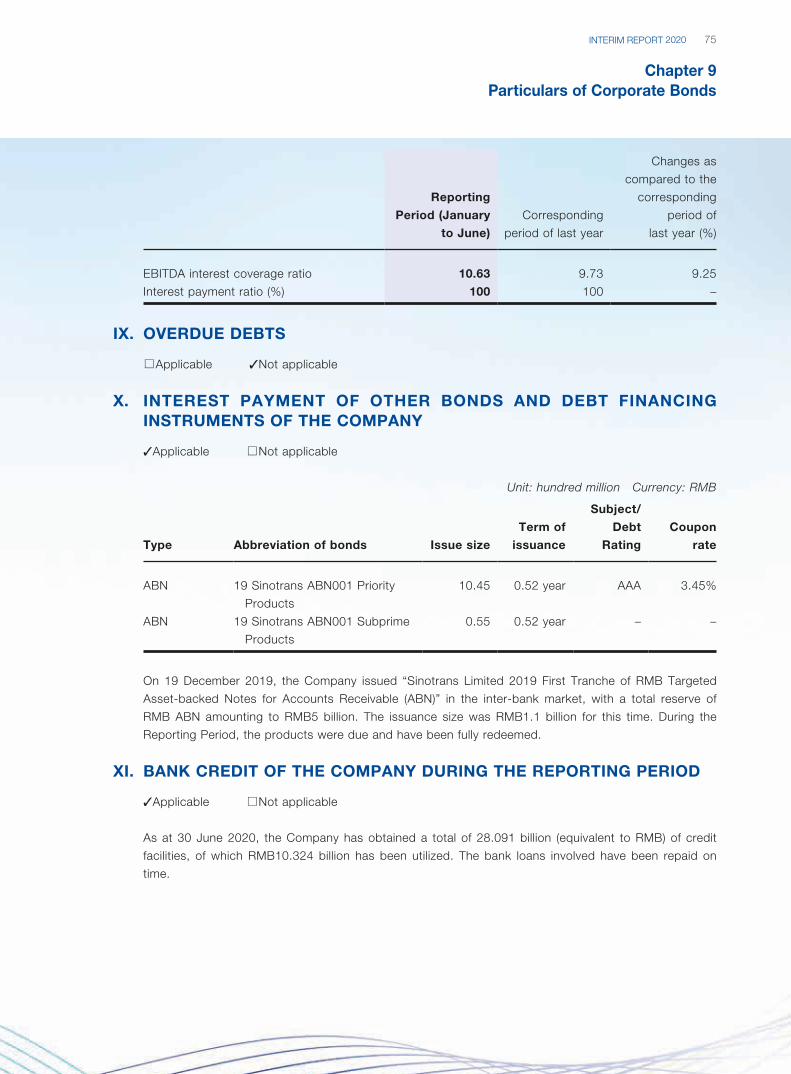
75INTERIM REPORT 2020
Chapter 9Particulars of Corporate Bonds
Reporting
Period (January
to June)
Corresponding
period of last year
Changes as
compared to the
corresponding
period of
last year (%)
EBITDA interest coverage ratio 10.63 9.73 9.25
Interest payment ratio (%) 100 100 –
IX. OVERDUE DEBTS
□Applicable 3Not applicable
X. INTEREST PAYMENT OF OTHER BONDS AND DEBT FINANCING INSTRUMENTS OF THE COMPANY
3Applicable □Not applicable
Unit: hundred million Currency: RMB
Type Abbreviation of bonds Issue size
Term of
issuance
Subject/
Debt
Rating
Coupon
rate
ABN 19 Sinotrans ABN001 Priority
Products
10.45 0.52 year AAA 3.45%
ABN 19 Sinotrans ABN001 Subprime
Products
0.55 0.52 year – –
On 19 December 2019, the Company issued “Sinotrans Limited 2019 First Tranche of RMB Targeted
Asset-backed Notes for Accounts Receivable (ABN)” in the inter-bank market, with a total reserve of
RMB ABN amounting to RMB5 billion. The issuance size was RMB1.1 billion for this time. During the
Reporting Period, the products were due and have been fully redeemed.
XI. BANK CREDIT OF THE COMPANY DURING THE REPORTING PERIOD
3Applicable □Not applicable
As at 30 June 2020, the Company has obtained a total of 28.091 billion (equivalent to RMB) of credit
facilities, of which RMB10.324 billion has been utilized. The bank loans involved have been repaid on
time.
SINOTRANS LIMITED76
Chapter 9Particulars of Corporate Bonds
XII. PERFORMANCE OF RELEVANT AGREEMENTS OR UNDERTAKINGS IN THE PROSPECTUS OF CORPORATE BONDS BY THE COMPANY DURING THE REPORTING PERIOD
□Applicable 3Not applicable
XIII. SIGNIFICANT MATTERS OF THE COMPANY AND THEIR IMPACT ON THE OPERATION AND SOLVENCY OF THE COMPANY
□Applicable 3Not applicable
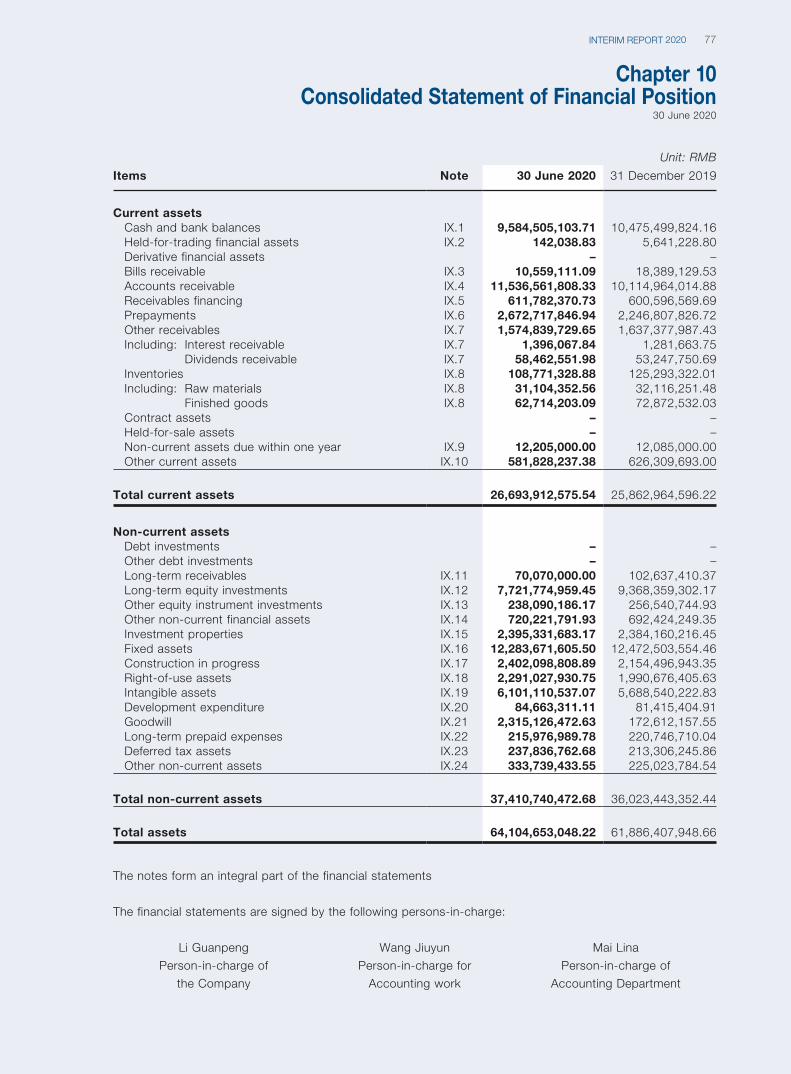
77INTERIM REPORT 2020
Chapter 10Consolidated Statement of Financial Position
30 June 2020
Unit: RMB
Items Note 30 June 2020 31 December 2019
Current assetsCash and bank balances IX.1 9,584,505,103.71 10,475,499,824.16Held-for-trading financial assets IX.2 142,038.83 5,641,228.80Derivative financial assets – –Bills receivable IX.3 10,559,111.09 18,389,129.53Accounts receivable IX.4 11,536,561,808.33 10,114,964,014.88Receivables financing IX.5 611,782,370.73 600,596,569.69Prepayments IX.6 2,672,717,846.94 2,246,807,826.72Other receivables IX.7 1,574,839,729.65 1,637,377,987.43Including: Interest receivable IX.7 1,396,067.84 1,281,663.75
Dividends receivable IX.7 58,462,551.98 53,247,750.69Inventories IX.8 108,771,328.88 125,293,322.01Including: Raw materials IX.8 31,104,352.56 32,116,251.48
Finished goods IX.8 62,714,203.09 72,872,532.03Contract assets – –Held-for-sale assets – –Non-current assets due within one year IX.9 12,205,000.00 12,085,000.00Other current assets IX.10 581,828,237.38 626,309,693.00
Total current assets 26,693,912,575.54 25,862,964,596.22
Non-current assetsDebt investments – –Other debt investments – –Long-term receivables IX.11 70,070,000.00 102,637,410.37Long-term equity investments IX.12 7,721,774,959.45 9,368,359,302.17Other equity instrument investments IX.13 238,090,186.17 256,540,744.93Other non-current financial assets IX.14 720,221,791.93 692,424,249.35Investment properties IX.15 2,395,331,683.17 2,384,160,216.45Fixed assets IX.16 12,283,671,605.50 12,472,503,554.46Construction in progress IX.17 2,402,098,808.89 2,154,496,943.35Right-of-use assets IX.18 2,291,027,930.75 1,990,676,405.63Intangible assets IX.19 6,101,110,537.07 5,688,540,222.83Development expenditure IX.20 84,663,311.11 81,415,404.91Goodwill IX.21 2,315,126,472.63 172,612,157.55Long-term prepaid expenses IX.22 215,976,989.78 220,746,710.04Deferred tax assets IX.23 237,836,762.68 213,306,245.86Other non-current assets IX.24 333,739,433.55 225,023,784.54
Total non-current assets 37,410,740,472.68 36,023,443,352.44
Total assets 64,104,653,048.22 61,886,407,948.66
The notes form an integral part of the financial statements
The financial statements are signed by the following persons-in-charge:
Li Guanpeng Wang Jiuyun Mai Lina
Person-in-charge of
the Company
Person-in-charge for
Accounting work
Person-in-charge of
Accounting Department
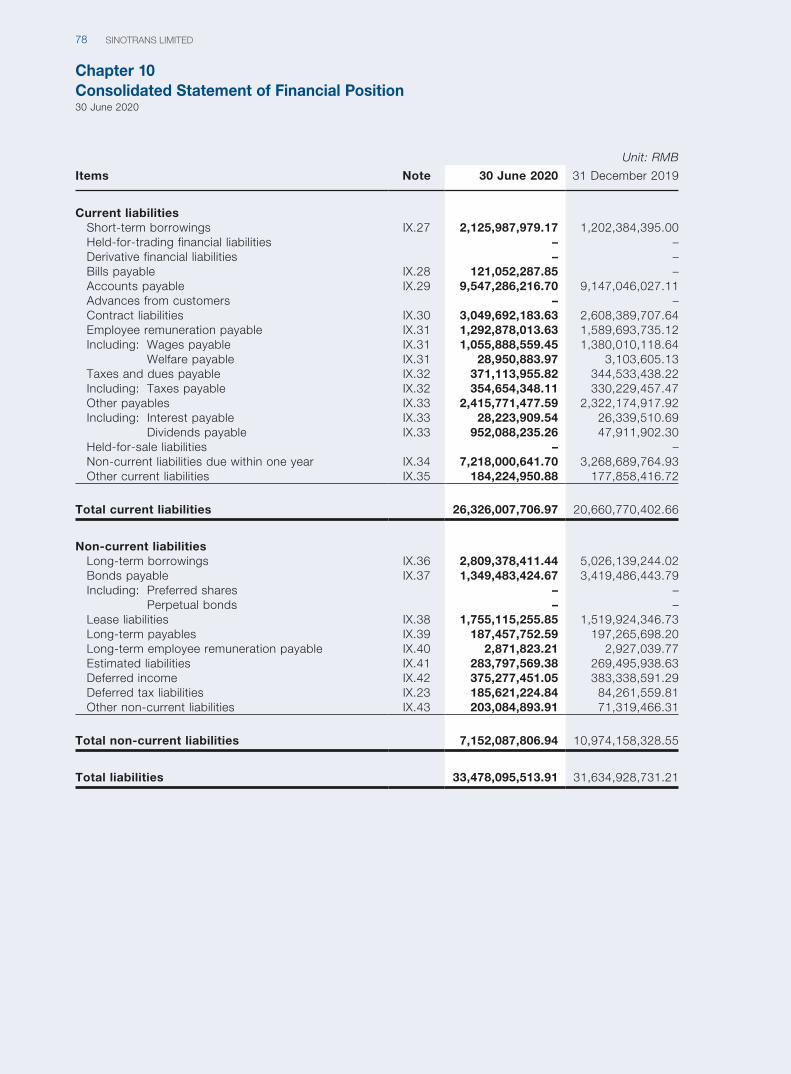
Chapter 10Consolidated Statement of Financial Position30 June 2020
SINOTRANS LIMITED78
Unit: RMB
Items Note 30 June 2020 31 December 2019
Current liabilitiesShort-term borrowings IX.27 2,125,987,979.17 1,202,384,395.00Held-for-trading financial liabilities – –Derivative financial liabilities – –Bills payable IX.28 121,052,287.85 –Accounts payable IX.29 9,547,286,216.70 9,147,046,027.11Advances from customers – –Contract liabilities IX.30 3,049,692,183.63 2,608,389,707.64Employee remuneration payable IX.31 1,292,878,013.63 1,589,693,735.12Including: Wages payable IX.31 1,055,888,559.45 1,380,010,118.64
Welfare payable IX.31 28,950,883.97 3,103,605.13Taxes and dues payable IX.32 371,113,955.82 344,533,438.22Including: Taxes payable IX.32 354,654,348.11 330,229,457.47Other payables IX.33 2,415,771,477.59 2,322,174,917.92Including: Interest payable IX.33 28,223,909.54 26,339,510.69
Dividends payable IX.33 952,088,235.26 47,911,902.30Held-for-sale liabilities – –Non-current liabilities due within one year IX.34 7,218,000,641.70 3,268,689,764.93Other current liabilities IX.35 184,224,950.88 177,858,416.72
Total current liabilities 26,326,007,706.97 20,660,770,402.66
Non-current liabilitiesLong-term borrowings IX.36 2,809,378,411.44 5,026,139,244.02Bonds payable IX.37 1,349,483,424.67 3,419,486,443.79Including: Preferred shares – –
Perpetual bonds – –Lease liabilities IX.38 1,755,115,255.85 1,519,924,346.73Long-term payables IX.39 187,457,752.59 197,265,698.20Long-term employee remuneration payable IX.40 2,871,823.21 2,927,039.77Estimated liabilities IX.41 283,797,569.38 269,495,938.63Deferred income IX.42 375,277,451.05 383,338,591.29Deferred tax liabilities IX.23 185,621,224.84 84,261,559.81Other non-current liabilities IX.43 203,084,893.91 71,319,466.31
Total non-current liabilities 7,152,087,806.94 10,974,158,328.55
Total liabilities 33,478,095,513.91 31,634,928,731.21
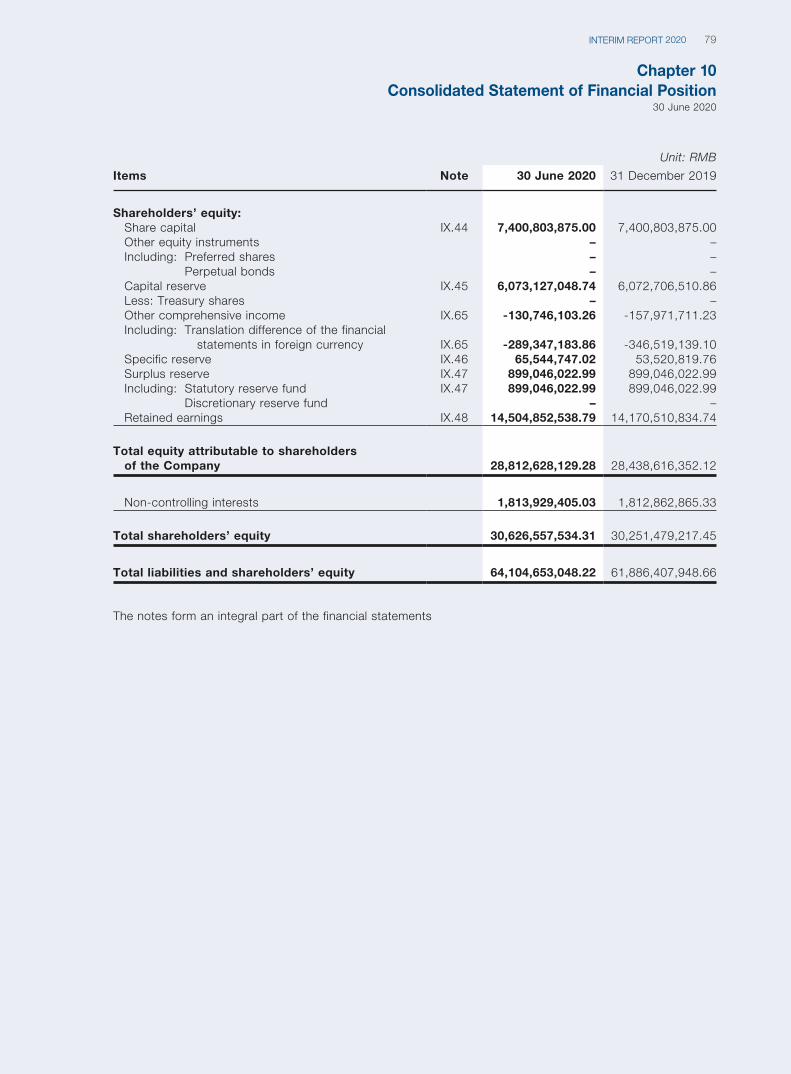
Chapter 10Consolidated Statement of Financial Position
30 June 2020
79INTERIM REPORT 2020
Unit: RMB
Items Note 30 June 2020 31 December 2019
Shareholders’ equity:Share capital IX.44 7,400,803,875.00 7,400,803,875.00Other equity instruments – –Including: Preferred shares – –
Perpetual bonds – –Capital reserve IX.45 6,073,127,048.74 6,072,706,510.86Less: Treasury shares – –Other comprehensive income IX.65 -130,746,103.26 -157,971,711.23Including: Translation difference of the financial
statements in foreign currency IX.65 -289,347,183.86 -346,519,139.10Specific reserve IX.46 65,544,747.02 53,520,819.76Surplus reserve IX.47 899,046,022.99 899,046,022.99Including: Statutory reserve fund IX.47 899,046,022.99 899,046,022.99
Discretionary reserve fund – –Retained earnings IX.48 14,504,852,538.79 14,170,510,834.74
Total equity attributable to shareholders of the Company 28,812,628,129.28 28,438,616,352.12
Non-controlling interests 1,813,929,405.03 1,812,862,865.33
Total shareholders’ equity 30,626,557,534.31 30,251,479,217.45
Total liabilities and shareholders’ equity 64,104,653,048.22 61,886,407,948.66
The notes form an integral part of the financial statements
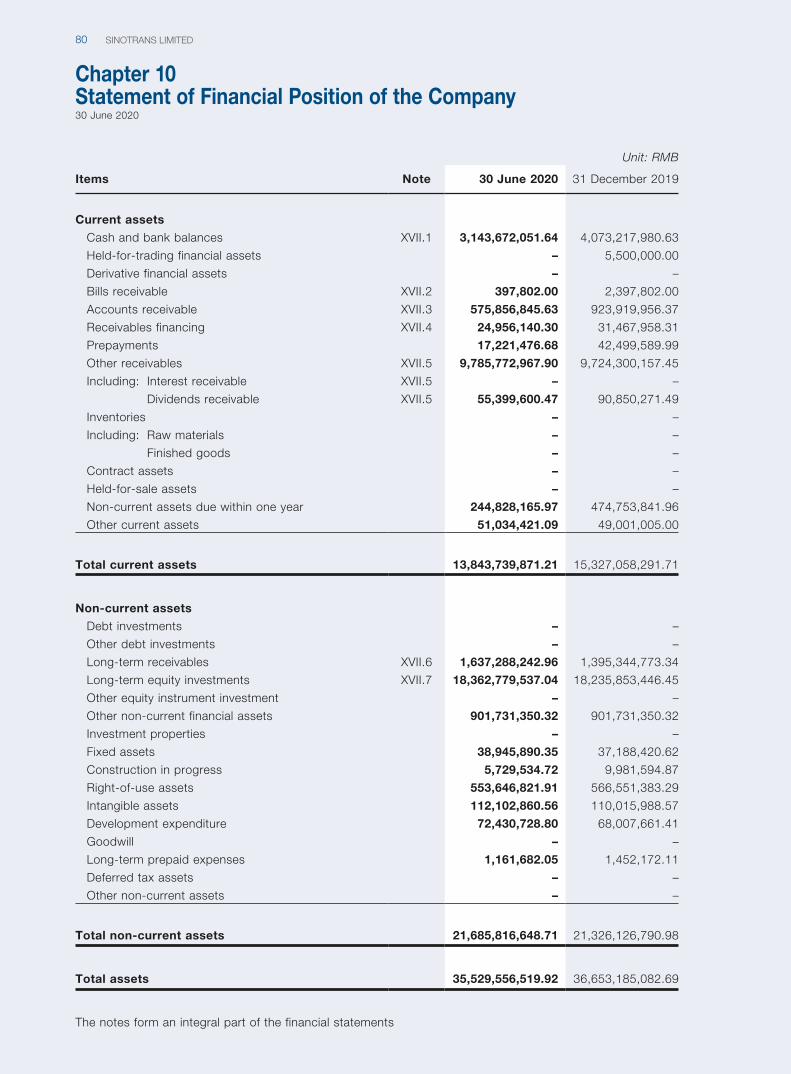
SINOTRANS LIMITED80
Chapter 10Statement of Financial Position of the Company30 June 2020
Unit: RMB
Items Note 30 June 2020 31 December 2019
Current assets
Cash and bank balances XVII.1 3,143,672,051.64 4,073,217,980.63
Held-for-trading financial assets – 5,500,000.00
Derivative financial assets – –
Bills receivable XVII.2 397,802.00 2,397,802.00
Accounts receivable XVII.3 575,856,845.63 923,919,956.37
Receivables financing XVII.4 24,956,140.30 31,467,958.31
Prepayments 17,221,476.68 42,499,589.99
Other receivables XVII.5 9,785,772,967.90 9,724,300,157.45
Including: Interest receivable XVII.5 – –
Dividends receivable XVII.5 55,399,600.47 90,850,271.49
Inventories – –
Including: Raw materials – –
Finished goods – –
Contract assets – –
Held-for-sale assets – –
Non-current assets due within one year 244,828,165.97 474,753,841.96
Other current assets 51,034,421.09 49,001,005.00
Total current assets 13,843,739,871.21 15,327,058,291.71
Non-current assets
Debt investments – –
Other debt investments – –
Long-term receivables XVII.6 1,637,288,242.96 1,395,344,773.34
Long-term equity investments XVII.7 18,362,779,537.04 18,235,853,446.45
Other equity instrument investment – –
Other non-current financial assets 901,731,350.32 901,731,350.32
Investment properties – –
Fixed assets 38,945,890.35 37,188,420.62
Construction in progress 5,729,534.72 9,981,594.87
Right-of-use assets 553,646,821.91 566,551,383.29
Intangible assets 112,102,860.56 110,015,988.57
Development expenditure 72,430,728.80 68,007,661.41
Goodwill – –
Long-term prepaid expenses 1,161,682.05 1,452,172.11
Deferred tax assets – –
Other non-current assets – –
Total non-current assets 21,685,816,648.71 21,326,126,790.98
Total assets 35,529,556,519.92 36,653,185,082.69
The notes form an integral part of the financial statements
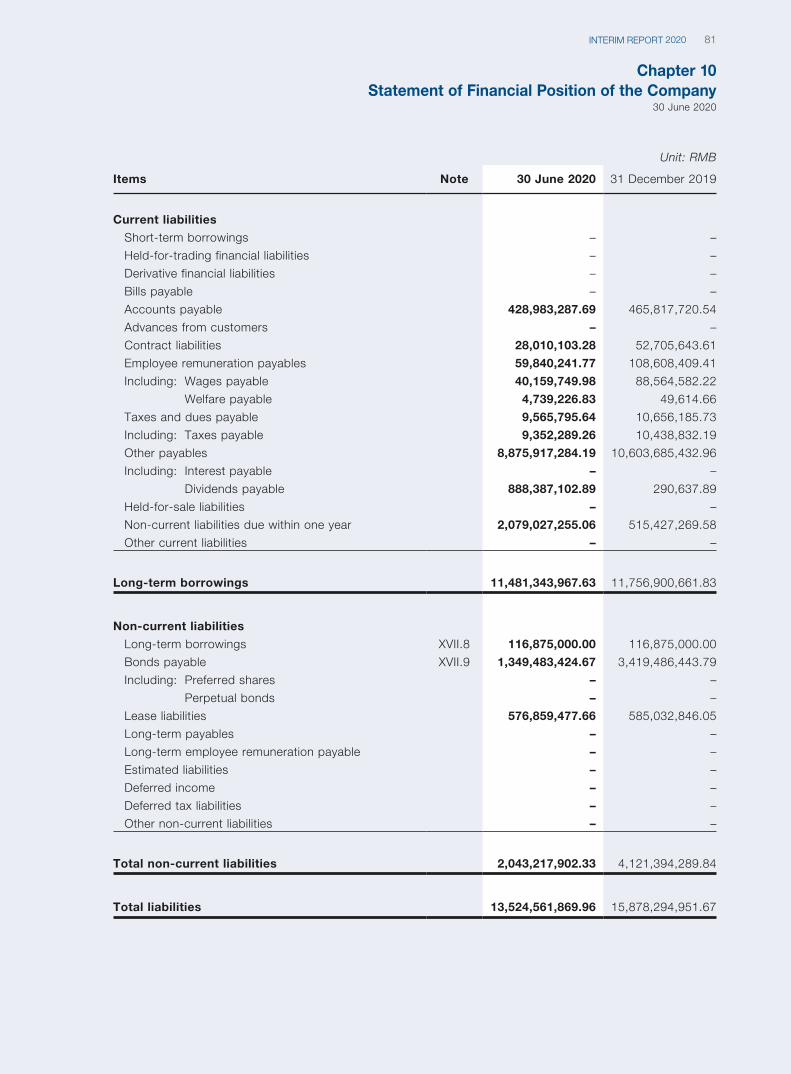
Chapter 10Statement of Financial Position of the Company
30 June 2020
81INTERIM REPORT 2020
Unit: RMB
Items Note 30 June 2020 31 December 2019
Current liabilities
Short-term borrowings – –
Held-for-trading financial liabilities – –
Derivative financial liabilities – –
Bills payable – –
Accounts payable 428,983,287.69 465,817,720.54
Advances from customers – –
Contract liabilities 28,010,103.28 52,705,643.61
Employee remuneration payables 59,840,241.77 108,608,409.41
Including: Wages payable 40,159,749.98 88,564,582.22
Welfare payable 4,739,226.83 49,614.66
Taxes and dues payable 9,565,795.64 10,656,185.73
Including: Taxes payable 9,352,289.26 10,438,832.19
Other payables 8,875,917,284.19 10,603,685,432.96
Including: Interest payable – –
Dividends payable 888,387,102.89 290,637.89
Held-for-sale liabilities – –
Non-current liabilities due within one year 2,079,027,255.06 515,427,269.58
Other current liabilities – –
Long-term borrowings 11,481,343,967.63 11,756,900,661.83
Non-current liabilities
Long-term borrowings XVII.8 116,875,000.00 116,875,000.00
Bonds payable XVII.9 1,349,483,424.67 3,419,486,443.79
Including: Preferred shares – –
Perpetual bonds – –
Lease liabilities 576,859,477.66 585,032,846.05
Long-term payables – –
Long-term employee remuneration payable – –
Estimated liabilities – –
Deferred income – –
Deferred tax liabilities – –
Other non-current liabilities – –
Total non-current liabilities 2,043,217,902.33 4,121,394,289.84
Total liabilities 13,524,561,869.96 15,878,294,951.67
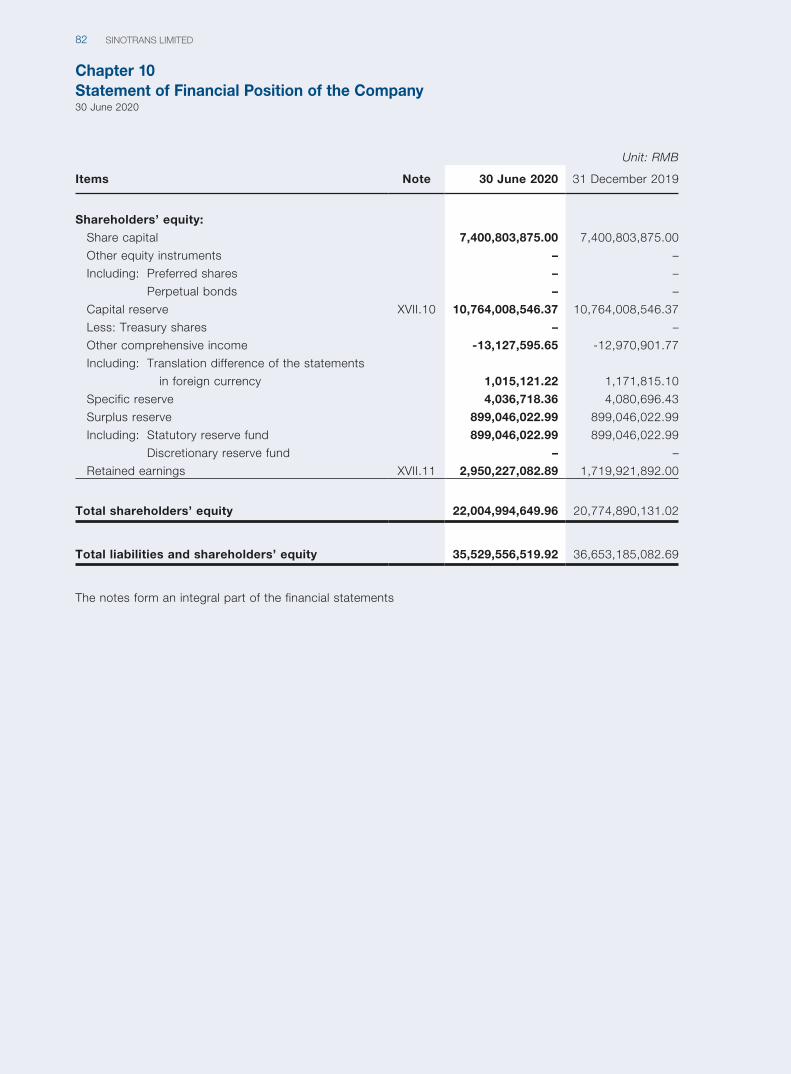
Chapter 10Statement of Financial Position of the Company30 June 2020
SINOTRANS LIMITED82
Unit: RMB
Items Note 30 June 2020 31 December 2019
Shareholders’ equity:
Share capital 7,400,803,875.00 7,400,803,875.00
Other equity instruments – –
Including: Preferred shares – –
Perpetual bonds – –
Capital reserve XVII.10 10,764,008,546.37 10,764,008,546.37
Less: Treasury shares – –
Other comprehensive income -13,127,595.65 -12,970,901.77
Including: Translation difference of the statements
in foreign currency 1,015,121.22 1,171,815.10
Specific reserve 4,036,718.36 4,080,696.43
Surplus reserve 899,046,022.99 899,046,022.99
Including: Statutory reserve fund 899,046,022.99 899,046,022.99
Discretionary reserve fund – –
Retained earnings XVII.11 2,950,227,082.89 1,719,921,892.00
Total shareholders’ equity 22,004,994,649.96 20,774,890,131.02
Total liabilities and shareholders’ equity 35,529,556,519.92 36,653,185,082.69
The notes form an integral part of the financial statements
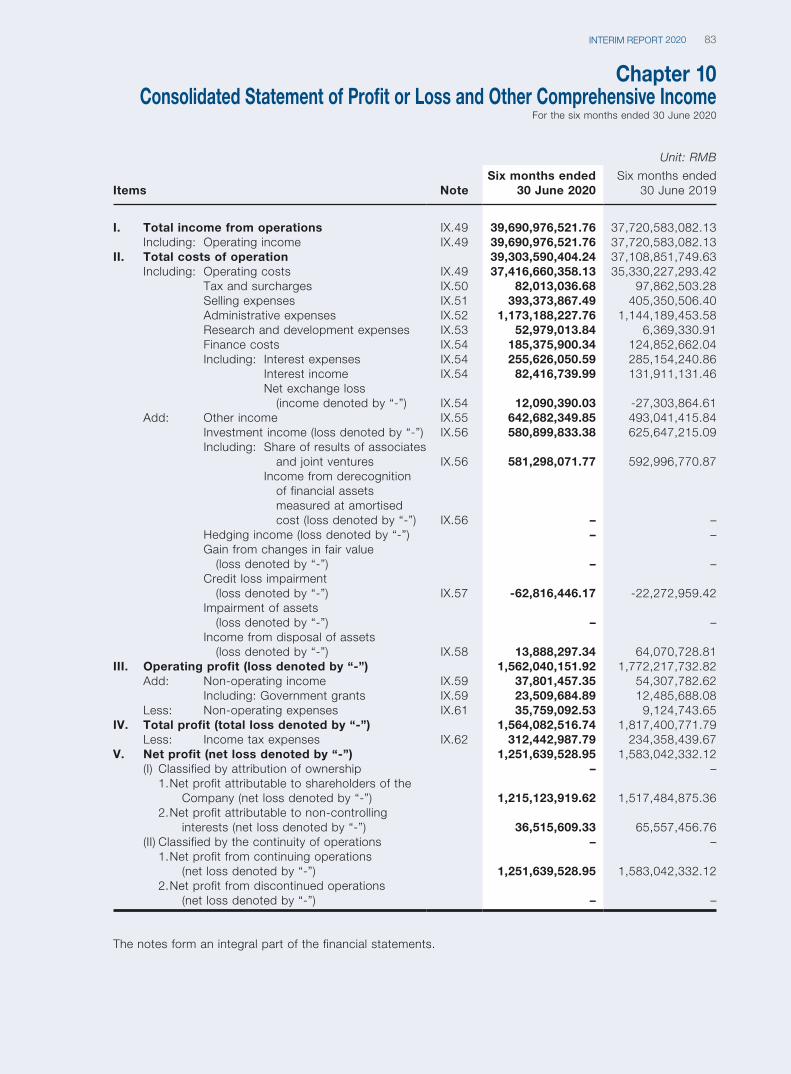
83INTERIM REPORT 2020
Chapter 10Consolidated Statement of Profit or Loss and Other Comprehensive Income
For the six months ended 30 June 2020
Unit: RMB
Items NoteSix months ended
30 June 2020Six months ended
30 June 2019
I. Total income from operations IX.49 39,690,976,521.76 37,720,583,082.13Including: Operating income IX.49 39,690,976,521.76 37,720,583,082.13
II. Total costs of operation 39,303,590,404.24 37,108,851,749.63Including: Operating costs IX.49 37,416,660,358.13 35,330,227,293.42
Tax and surcharges IX.50 82,013,036.68 97,862,503.28Selling expenses IX.51 393,373,867.49 405,350,506.40Administrative expenses IX.52 1,173,188,227.76 1,144,189,453.58Research and development expenses IX.53 52,979,013.84 6,369,330.91Finance costs IX.54 185,375,900.34 124,852,662.04Including: Interest expenses IX.54 255,626,050.59 285,154,240.86
Interest income IX.54 82,416,739.99 131,911,131.46Net exchange loss (income denoted by “-”) IX.54 12,090,390.03 -27,303,864.61
Add: Other income IX.55 642,682,349.85 493,041,415.84Investment income (loss denoted by “-”) IX.56 580,899,833.38 625,647,215.09Including: Share of results of associates
and joint ventures IX.56 581,298,071.77 592,996,770.87Income from derecognition of financial assets measured at amortised cost (loss denoted by “-”) IX.56 – –
Hedging income (loss denoted by “-”) – –Gain from changes in fair value (loss denoted by “-”) – –Credit loss impairment (loss denoted by “-”) IX.57 -62,816,446.17 -22,272,959.42Impairment of assets (loss denoted by “-”) – –Income from disposal of assets (loss denoted by “-”) IX.58 13,888,297.34 64,070,728.81
III. Operating profit (loss denoted by “-”) 1,562,040,151.92 1,772,217,732.82Add: Non-operating income IX.59 37,801,457.35 54,307,782.62
Including: Government grants IX.59 23,509,684.89 12,485,688.08Less: Non-operating expenses IX.61 35,759,092.53 9,124,743.65
IV. Total profit (total loss denoted by “-”) 1,564,082,516.74 1,817,400,771.79Less: Income tax expenses IX.62 312,442,987.79 234,358,439.67
V. Net profit (net loss denoted by “-”) 1,251,639,528.95 1,583,042,332.12(I) Classified by attribution of ownership – –
1. Net profit attributable to shareholders of the Company (net loss denoted by “-”) 1,215,123,919.62 1,517,484,875.36
2. Net profit attributable to non-controlling interests (net loss denoted by “-”) 36,515,609.33 65,557,456.76
(II) Classified by the continuity of operations – –1. Net profit from continuing operations
(net loss denoted by “-”) 1,251,639,528.95 1,583,042,332.122. Net profit from discontinued operations
(net loss denoted by “-”) – –
The notes form an integral part of the financial statements.

Chapter 10Consolidated Statement of Profit or Loss and Other Comprehensive IncomeFor the six months ended 30 June 2020
SINOTRANS LIMITED84
Unit: RMB
Items NoteSix months ended
30 June 2020Six months ended
30 June 2019
VI. Other comprehensive income, net of tax IX.65 8,571,560.47 1,606,646.75Other comprehensive income attributable to shareholders of the Company, net of tax IX.65 34,539,857.40 -3,184,834.58(I) Other comprehensive income not to be
subsequently reclassified to profit or loss IX.65 -2,425,059.33 46,350,772.211. Amount of change arising from re-
measurement of the defined benefit plan – –2. Other comprehensive income not to be
reclassified to profit or loss under the equity method – –
3. Changes in fair value of other equity instrument investments IX.65 -2,425,059.33 46,350,772.21
4. Changes in fair value attributable to changes in credit risk – –
5. Others – –(II) Other comprehensive income to be
subsequently reclassified to profit or loss IX.65 36,964,916.73 -49,535,606.791. Other comprehensive income to be
reclassified to profit or loss under the equity method IX.65 -20,207,038.51 7,793,447.85
2. Changes in fair value of other debt investments – –
3. Reclassification of financial assets – –4. Credit loss impairment of other debt
investments – –5. Cash flow hedge reserve (effective portion
of gains or losses from cash flow hedges) – –
6. Exchange differences on translation of foreign operations IX.65 57,171,955.24 -57,329,054.64
7. Others – –Other comprehensive income attributable to non-controlling interests, net of tax -25,968,296.93 4,791,481.33
VII. Total comprehensive income IX.65 1,260,211,089.42 1,584,648,978.87Total comprehensive income attributable to shareholders of the Company IX.65 1,249,663,777.02 1,514,300,040.78Total comprehensive income attributable to non-controlling interests IX.65 10,547,312.40 70,348,938.09
VIII. Earnings per share:Basic earnings per share (RMB/share) IX.63 0.16 0.21Diluted earnings per share (RMB/share) IX.63 0.16 0.21
The notes form an integral part of the financial statements.
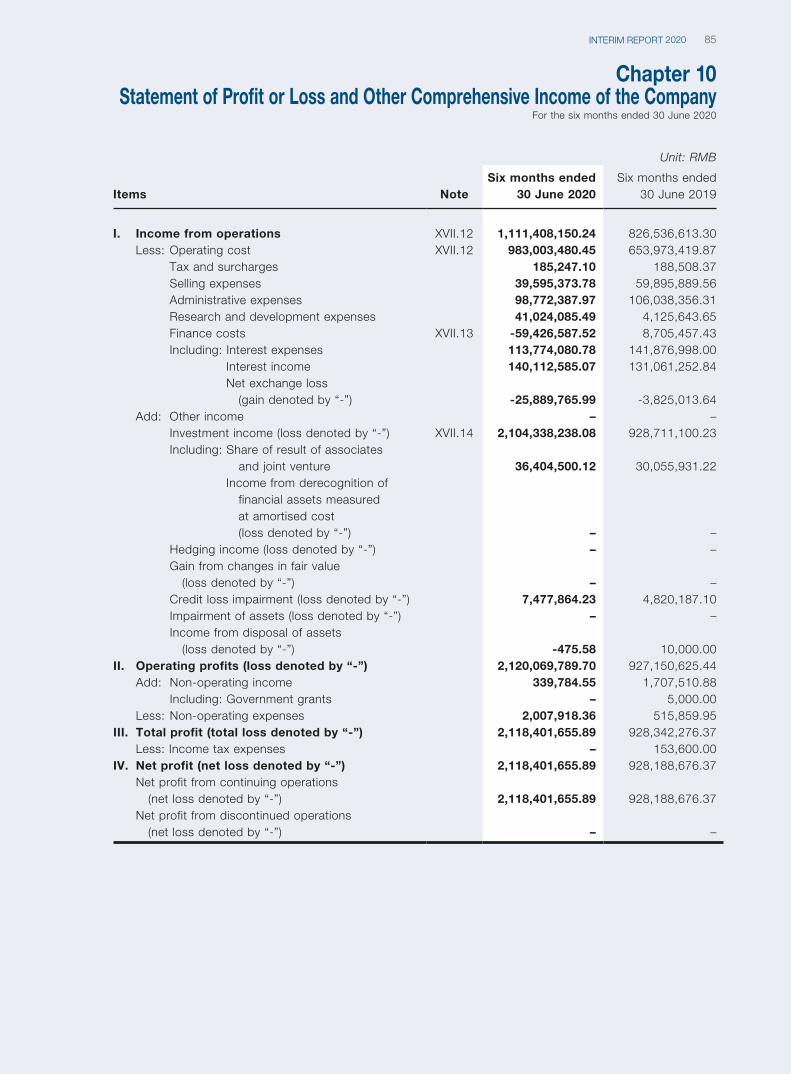
85INTERIM REPORT 2020
Chapter 10Statement of Profit or Loss and Other Comprehensive Income of the Company
For the six months ended 30 June 2020
Unit: RMB
Items NoteSix months ended
30 June 2020Six months ended
30 June 2019
I. Income from operations XVII.12 1,111,408,150.24 826,536,613.30Less: Operating cost XVII.12 983,003,480.45 653,973,419.87
Tax and surcharges 185,247.10 188,508.37Selling expenses 39,595,373.78 59,895,889.56Administrative expenses 98,772,387.97 106,038,356.31Research and development expenses 41,024,085.49 4,125,643.65Finance costs XVII.13 -59,426,587.52 8,705,457.43Including: Interest expenses 113,774,080.78 141,876,998.00
Interest income 140,112,585.07 131,061,252.84Net exchange loss (gain denoted by “-”) -25,889,765.99 -3,825,013.64
Add: Other income – –Investment income (loss denoted by “-”) XVII.14 2,104,338,238.08 928,711,100.23Including: Share of result of associates
and joint venture 36,404,500.12 30,055,931.22Income from derecognition of financial assets measured at amortised cost (loss denoted by “-”) – –
Hedging income (loss denoted by “-”) – –Gain from changes in fair value (loss denoted by “-”) – –Credit loss impairment (loss denoted by “-”) 7,477,864.23 4,820,187.10Impairment of assets (loss denoted by “-”) – –Income from disposal of assets (loss denoted by “-”) -475.58 10,000.00
II. Operating profits (loss denoted by “-”) 2,120,069,789.70 927,150,625.44Add: Non-operating income 339,784.55 1,707,510.88
Including: Government grants – 5,000.00Less: Non-operating expenses 2,007,918.36 515,859.95
III. Total profit (total loss denoted by “-”) 2,118,401,655.89 928,342,276.37Less: Income tax expenses – 153,600.00
IV. Net profit (net loss denoted by “-”) 2,118,401,655.89 928,188,676.37Net profit from continuing operations (net loss denoted by “-”) 2,118,401,655.89 928,188,676.37Net profit from discontinued operations (net loss denoted by “-”) – –
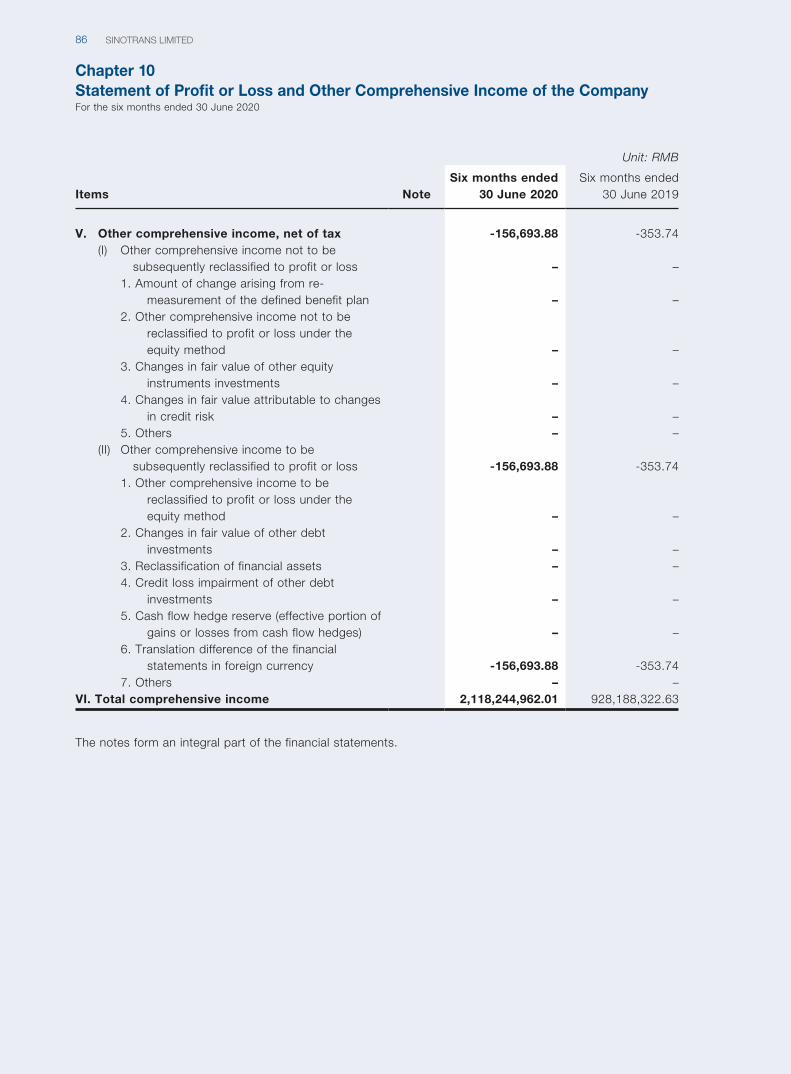
Chapter 10Statement of Profit or Loss and Other Comprehensive Income of the CompanyFor the six months ended 30 June 2020
SINOTRANS LIMITED86
Unit: RMB
Items NoteSix months ended
30 June 2020Six months ended
30 June 2019
V. Other comprehensive income, net of tax -156,693.88 -353.74(I) Other comprehensive income not to be
subsequently reclassified to profit or loss – –1. Amount of change arising from re-
measurement of the defined benefit plan – –2. Other comprehensive income not to be
reclassified to profit or loss under the equity method – –
3. Changes in fair value of other equity instruments investments – –
4. Changes in fair value attributable to changes in credit risk – –
5. Others – –(II) Other comprehensive income to be
subsequently reclassified to profit or loss -156,693.88 -353.741. Other comprehensive income to be
reclassified to profit or loss under the equity method – –
2. Changes in fair value of other debt investments – –
3. Reclassification of financial assets – –4. Credit loss impairment of other debt
investments – –5. Cash flow hedge reserve (effective portion of
gains or losses from cash flow hedges) – –6. Translation difference of the financial
statements in foreign currency -156,693.88 -353.747. Others – –
VI. Total comprehensive income 2,118,244,962.01 928,188,322.63
The notes form an integral part of the financial statements.
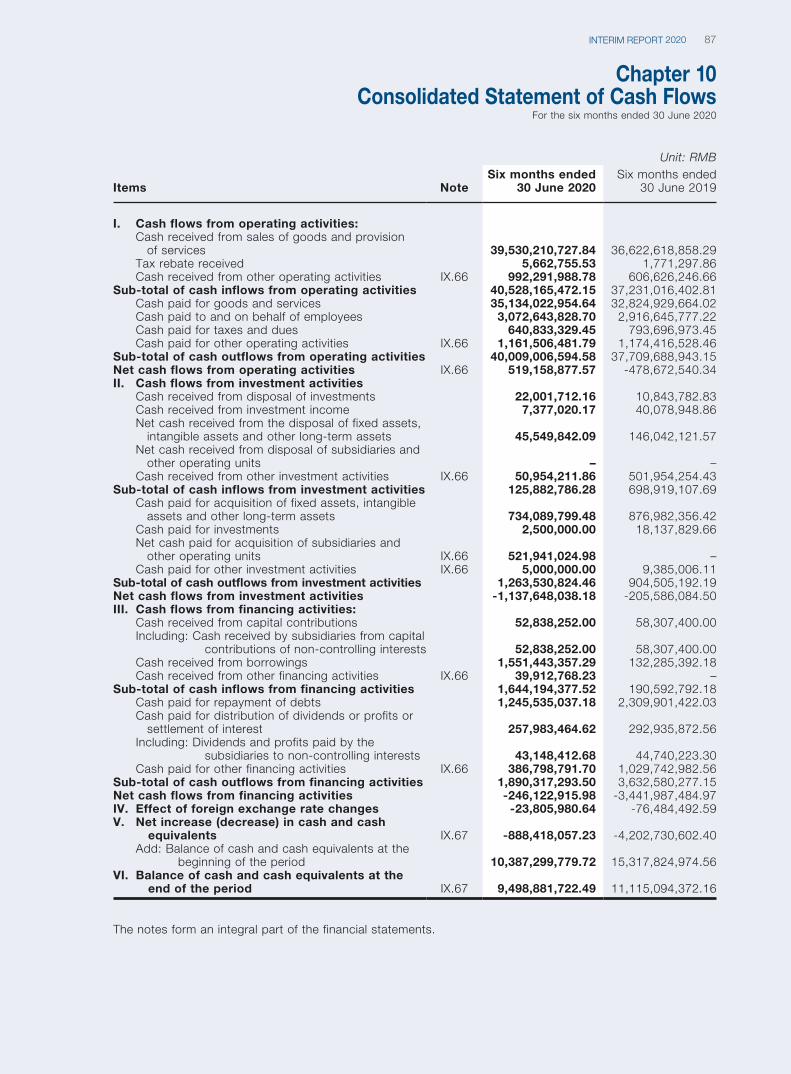
87INTERIM REPORT 2020
Chapter 10Consolidated Statement of Cash Flows
For the six months ended 30 June 2020
Unit: RMB
Items NoteSix months ended
30 June 2020Six months ended
30 June 2019
I. Cash flows from operating activities:Cash received from sales of goods and provision
of services 39,530,210,727.84 36,622,618,858.29Tax rebate received 5,662,755.53 1,771,297.86Cash received from other operating activities IX.66 992,291,988.78 606,626,246.66
Sub-total of cash inflows from operating activities 40,528,165,472.15 37,231,016,402.81Cash paid for goods and services 35,134,022,954.64 32,824,929,664.02Cash paid to and on behalf of employees 3,072,643,828.70 2,916,645,777.22Cash paid for taxes and dues 640,833,329.45 793,696,973.45Cash paid for other operating activities IX.66 1,161,506,481.79 1,174,416,528.46
Sub-total of cash outflows from operating activities 40,009,006,594.58 37,709,688,943.15Net cash flows from operating activities IX.66 519,158,877.57 -478,672,540.34II. Cash flows from investment activities
Cash received from disposal of investments 22,001,712.16 10,843,782.83Cash received from investment income 7,377,020.17 40,078,948.86Net cash received from the disposal of fixed assets,
intangible assets and other long-term assets 45,549,842.09 146,042,121.57Net cash received from disposal of subsidiaries and
other operating units – –Cash received from other investment activities IX.66 50,954,211.86 501,954,254.43
Sub-total of cash inflows from investment activities 125,882,786.28 698,919,107.69Cash paid for acquisition of fixed assets, intangible
assets and other long-term assets 734,089,799.48 876,982,356.42Cash paid for investments 2,500,000.00 18,137,829.66Net cash paid for acquisition of subsidiaries and
other operating units IX.66 521,941,024.98 –Cash paid for other investment activities IX.66 5,000,000.00 9,385,006.11
Sub-total of cash outflows from investment activities 1,263,530,824.46 904,505,192.19Net cash flows from investment activities -1,137,648,038.18 -205,586,084.50III. Cash flows from financing activities:
Cash received from capital contributions 52,838,252.00 58,307,400.00Including: Cash received by subsidiaries from capital
contributions of non-controlling interests 52,838,252.00 58,307,400.00Cash received from borrowings 1,551,443,357.29 132,285,392.18Cash received from other financing activities IX.66 39,912,768.23 –
Sub-total of cash inflows from financing activities 1,644,194,377.52 190,592,792.18Cash paid for repayment of debts 1,245,535,037.18 2,309,901,422.03Cash paid for distribution of dividends or profits or
settlement of interest 257,983,464.62 292,935,872.56Including: Dividends and profits paid by the
subsidiaries to non-controlling interests 43,148,412.68 44,740,223.30Cash paid for other financing activities IX.66 386,798,791.70 1,029,742,982.56
Sub-total of cash outflows from financing activities 1,890,317,293.50 3,632,580,277.15Net cash flows from financing activities -246,122,915.98 -3,441,987,484.97IV. Effect of foreign exchange rate changes -23,805,980.64 -76,484,492.59V. Net increase (decrease) in cash and cash
equivalents IX.67 -888,418,057.23 -4,202,730,602.40Add: Balance of cash and cash equivalents at the
beginning of the period 10,387,299,779.72 15,317,824,974.56VI. Balance of cash and cash equivalents at the
end of the period IX.67 9,498,881,722.49 11,115,094,372.16
The notes form an integral part of the financial statements.
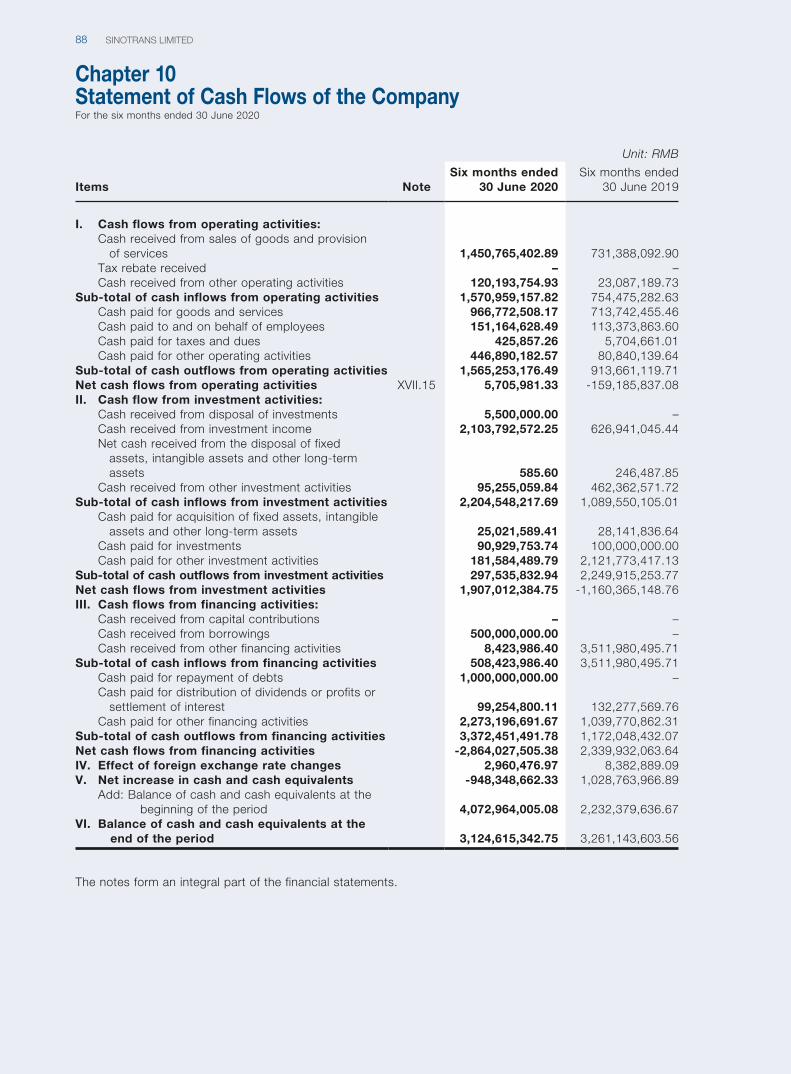
SINOTRANS LIMITED88
Chapter 10Statement of Cash Flows of the CompanyFor the six months ended 30 June 2020
Unit: RMB
Items NoteSix months ended
30 June 2020Six months ended
30 June 2019
I. Cash flows from operating activities:Cash received from sales of goods and provision
of services 1,450,765,402.89 731,388,092.90Tax rebate received – –Cash received from other operating activities 120,193,754.93 23,087,189.73
Sub-total of cash inflows from operating activities 1,570,959,157.82 754,475,282.63Cash paid for goods and services 966,772,508.17 713,742,455.46Cash paid to and on behalf of employees 151,164,628.49 113,373,863.60Cash paid for taxes and dues 425,857.26 5,704,661.01Cash paid for other operating activities 446,890,182.57 80,840,139.64
Sub-total of cash outflows from operating activities 1,565,253,176.49 913,661,119.71Net cash flows from operating activities XVII.15 5,705,981.33 -159,185,837.08II. Cash flow from investment activities:
Cash received from disposal of investments 5,500,000.00 –Cash received from investment income 2,103,792,572.25 626,941,045.44Net cash received from the disposal of fixed
assets, intangible assets and other long-term assets 585.60 246,487.85
Cash received from other investment activities 95,255,059.84 462,362,571.72Sub-total of cash inflows from investment activities 2,204,548,217.69 1,089,550,105.01
Cash paid for acquisition of fixed assets, intangible assets and other long-term assets 25,021,589.41 28,141,836.64
Cash paid for investments 90,929,753.74 100,000,000.00Cash paid for other investment activities 181,584,489.79 2,121,773,417.13
Sub-total of cash outflows from investment activities 297,535,832.94 2,249,915,253.77Net cash flows from investment activities 1,907,012,384.75 -1,160,365,148.76III. Cash flows from financing activities:
Cash received from capital contributions – –Cash received from borrowings 500,000,000.00 –Cash received from other financing activities 8,423,986.40 3,511,980,495.71
Sub-total of cash inflows from financing activities 508,423,986.40 3,511,980,495.71Cash paid for repayment of debts 1,000,000,000.00 –Cash paid for distribution of dividends or profits or
settlement of interest 99,254,800.11 132,277,569.76Cash paid for other financing activities 2,273,196,691.67 1,039,770,862.31
Sub-total of cash outflows from financing activities 3,372,451,491.78 1,172,048,432.07Net cash flows from financing activities -2,864,027,505.38 2,339,932,063.64IV. Effect of foreign exchange rate changes 2,960,476.97 8,382,889.09V. Net increase in cash and cash equivalents -948,348,662.33 1,028,763,966.89
Add: Balance of cash and cash equivalents at the beginning of the period 4,072,964,005.08 2,232,379,636.67
VI. Balance of cash and cash equivalents at the end of the period 3,124,615,342.75 3,261,143,603.56
The notes form an integral part of the financial statements.
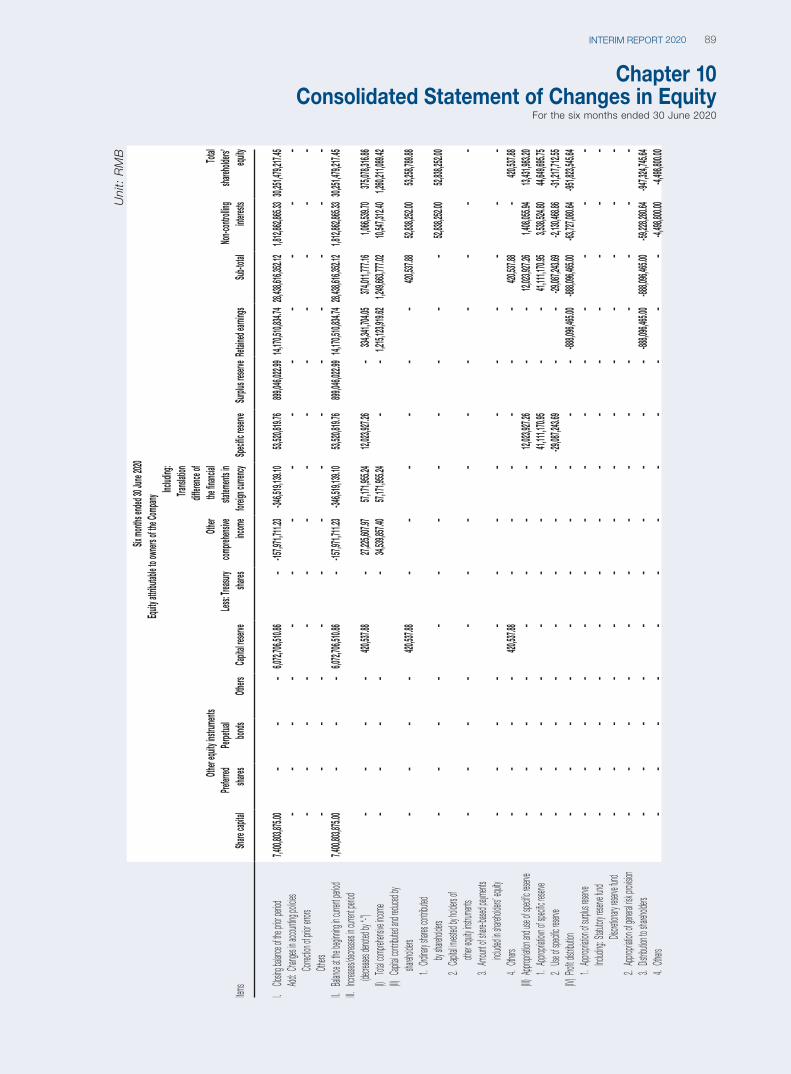
89INTERIM REPORT 2020
Chapter 10Consolidated Statement of Changes in Equity
For the six months ended 30 June 2020U
nit:
RM
B
Items
Six mo
nths e
nded 3
0 June
2020
Equity
attrib
utable
to ow
ners o
f the C
ompan
y
Non-c
ontrol
ling
interes
ts
Total
shareh
olders
’ equ
itySha
re cap
ital
Other
equity
instru
ments
Capita
l reser
veLes
s: Trea
sury
shares
Other
compre
hensiv
e inc
ome
Includ
ing:
Transl
ation
differe
nce of
the fin
ancial
statem
ents in
for
eign c
urrenc
ySpe
cific r
eserve
Surplu
s reser
veRe
tained
earnin
gsSub
-total
Prefer
red
shares
Perpet
ual
bonds
Others
I. Clo
sing ba
lance
of the
prior pe
riod7,4
00,803
,875.0
0–
––
6,072,
706,51
0.86
–-15
7,971,
711.23
-346,5
19,139
.1053,
520,81
9.76
899,04
6,022.
9914,
170,51
0,834.
7428,
438,61
6,352.
121,8
12,862
,865.3
330,
251,47
9,217.
45Add
: Chan
ges in
accoun
ting po
licies
––
––
––
––
––
––
––
Correc
tion of
prior er
rors–
––
––
––
––
––
––
–Oth
ers–
––
––
––
––
––
––
–II.
Balanc
e at th
e begi
nning
in curre
nt perio
d7,4
00,803
,875.0
0–
––
6,072,
706,51
0.86
–-15
7,971,
711.23
-346,5
19,139
.1053,
520,81
9.76
899,04
6,022.
9914,
170,51
0,834.
7428,
438,61
6,352.
121,8
12,862
,865.3
330,
251,47
9,217.
45III.
Increa
ses/de
crease
s in cu
rrent pe
riod
(decr
eases
denote
d by “-
”)–
––
–420
,537.8
8–
27,225
,607.9
757,
171,95
5.24
12,023
,927.2
6–
334,34
1,704.
05374
,011,7
77.16
1,066,
539.70
375,07
8,316.
86(I)
Total c
ompre
hensive
incom
e–
––
––
34,539
,857.4
057,
171,95
5.24
––
1,215,
123,91
9.62
1,249,
663,77
7.02
10,547
,312.4
01,2
60,211
,089.4
2(II)
Capital
contrib
uted a
nd red
uced b
y sha
rehold
ers–
––
–420
,537.8
8–
––
––
–420
,537.8
852,
838,25
2.00
53,258
,789.8
81.
Ordina
ry shar
es con
tribute
d b
y shar
eholde
rs–
––
––
––
––
––
–52,
838,25
2.00
52,838
,252.0
02.
Capital
investe
d by h
olders
of
othe
r equity
instrum
ents
––
––
––
––
––
––
––
3. Am
ount of
share
-based
paym
ents
inclu
ded in
shareh
olders
’ equity
––
––
––
––
––
––
––
4. Oth
ers–
––
–420
,537.8
8–
––
––
–420
,537.8
8–
420,53
7.88
(III) App
ropriat
ion an
d use
of spec
ific res
erve
––
––
––
––
12,023
,927.2
6–
–12,
023,92
7.26
1,408,
055.94
13,431
,983.2
01.
Approp
riatiovn
of spe
cific res
erve
––
––
––
––
41,111
,170.9
5–
–41,
111,17
0.95
3,538,
524.80
44,649
,695.7
52.
Use of
specific
reserv
e–
––
––
––
–-29
,087,2
43.69
––
-29,08
7,243.
69-2,1
30,468
.86-31
,217,7
12.55
(IV) P
rofit di
stribut
ion–
––
––
––
––
–-88
8,096,
465.00
-888,0
96,465
.00-63
,727,0
80.64
-951,8
23,545
.641.
Approp
riation
of sur
plus re
serve
––
––
––
––
––
––
––
Includ
ing: S
tatutory
reserv
e fund
––
––
––
––
––
––
––
Discre
tionary
reserv
e fund
––
––
––
––
––
––
––
2. App
ropriat
ion of
genera
l risk p
rovisio
n–
––
––
––
––
––
––
–3.
Distrib
ution to
share
holder
s–
––
––
––
––
–-88
8,096,
465.00
-888,0
96,465
.00-59
,228,2
80.64
-947,3
24,745
.644.
Others
––
––
––
––
––
––
-4,498,
800.00
-4,498,
800.00
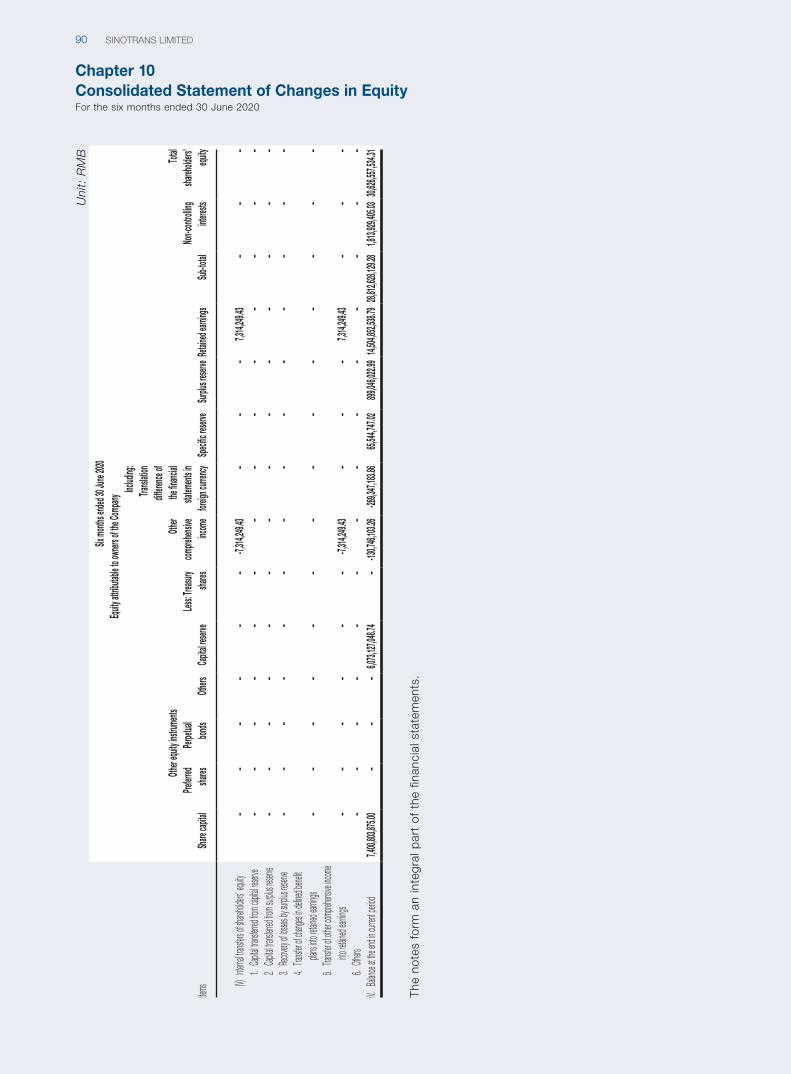
Chapter 10Consolidated Statement of Changes in EquityFor the six months ended 30 June 2020
SINOTRANS LIMITED90
Uni
t: R
MB
Items
Six mo
nths e
nded 3
0 June
2020
Equity
attrib
utable
to ow
ners o
f the C
ompan
y
Non-c
ontrol
ling
interes
ts
Total
shareh
olders
’ equ
itySha
re cap
ital
Other
equity
instru
ments
Capita
l reser
veLes
s: Trea
sury
shares
Other
compre
hensiv
e inc
ome
Includ
ing:
Transl
ation
differe
nce of
the fin
ancial
statem
ents in
for
eign c
urrenc
ySpe
cific r
eserve
Surplu
s reser
veRe
tained
earnin
gsSub
-total
Prefer
red
shares
Perpet
ual
bonds
Others
(V) Inte
rnal tra
nsfers
of sha
rehold
ers’ eq
uity–
––
––
–-7,3
14,249
.43–
––
7,314,
249.43
––
–1.
Capital
transfe
rred fro
m capi
tal res
erve
––
––
––
––
––
––
––
2. Cap
ital tran
sferred
from s
urplus
reserv
e–
––
––
––
––
––
––
–3.
Recove
ry of lo
sses b
y surp
lus res
erve
––
––
––
––
––
––
––
4. Tra
nsfer o
f chang
es in d
efined
benefit
p
lans in
to reta
ined e
arning
s–
––
––
––
––
––
––
–5.
Transf
er of ot
her co
mpreh
ensive
incom
e in
to reta
ined e
arning
s–
––
––
–-7,3
14,249
.43–
––
7,314,
249.43
––
–6.
Others
––
––
––
––
––
––
––
IV. Bal
ance a
t the e
nd in c
urrent p
eriod
7,400,
803,87
5.00
––
–6,0
73,127
,048.7
4–
-130,7
46,103
.26
-289,3
47,183
.86
65,544
,747.0
2899
,046,0
22.99
14,504
,852,5
38.79
28,812
,628,1
29.28
1,813,
929,40
5.03
30,626
,557,5
34.31
The
note
s fo
rm a
n in
tegr
al p
art
of t
he f
inan
cial
sta
tem
ents
.
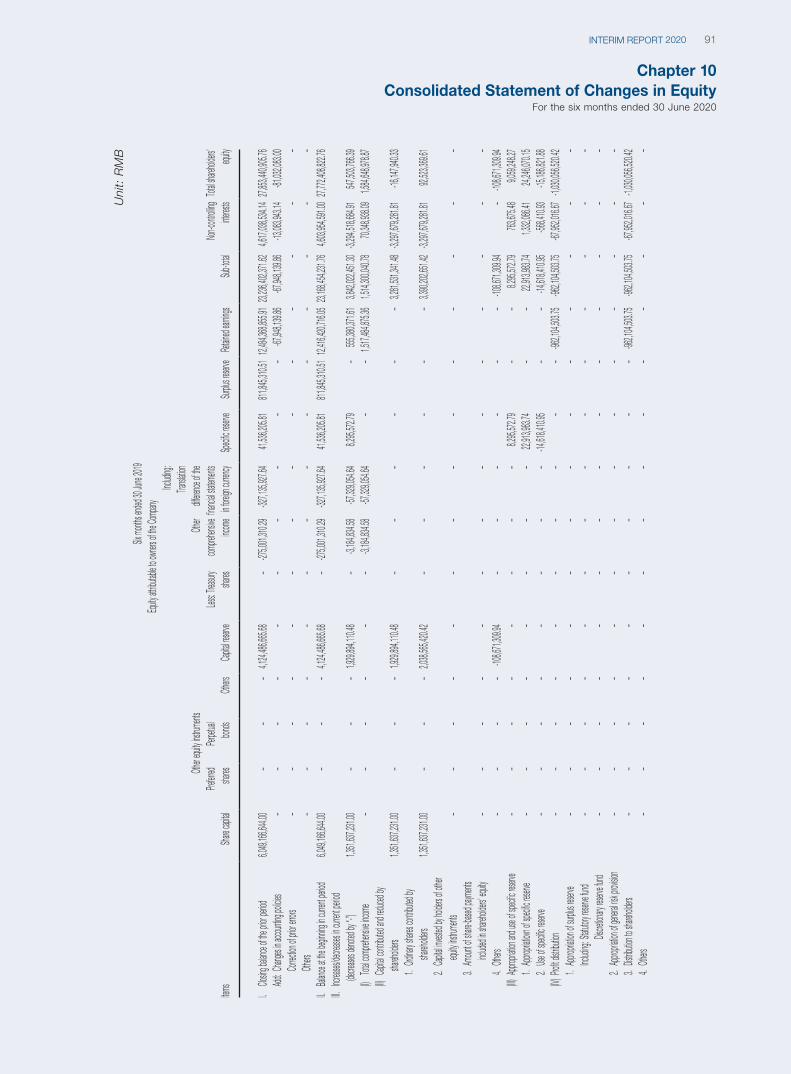
Chapter 10Consolidated Statement of Changes in Equity
For the six months ended 30 June 2020
91INTERIM REPORT 2020
Uni
t: R
MB
Items
Six mo
nths e
nded 3
0 June
2019
Equity
attribu
table t
o own
ers of
the Co
mpany
Non-c
ontroll
ing
interes
tsTot
al shar
eholde
rs’ equ
itySha
re capi
tal
Other e
quity i
nstrum
ents
Capital
reserv
eLes
s: Trea
sury
shares
Other
compre
hensive
inc
ome
Includ
ing:
Transla
tion
differe
nce of
the
financi
al state
ments
in f
oreign
curren
cySpe
cific res
erve
Surplu
s reser
veRet
ained
earnin
gsSub
-total
Preferr
ed
shares
Perpet
ual
bonds
Others
I. Clo
sing ba
lance
of the
prior pe
riod6,0
49,166
,644.0
0–
––
4,124,
486,66
5.68
–-27
5,001,
310.29
-327,1
35,927
.6441,
536,20
5.81
811,84
5,310.
5112,
484,36
8,855.
9123,
236,40
2,371.
624,6
17,038
,534.1
427,
853,44
0,905.
76Add
: Chan
ges in
accoun
ting po
licies
––
––
––
––
––
-67,94
8,139.
86-67
,948,1
39.86
-13,08
3,943.
14-81
,032,0
83.00
Correc
tion of
prior er
rors–
––
––
––
––
––
––
–Oth
ers–
––
––
––
––
––
––
–II.
Balanc
e at th
e begi
nning
in curre
nt perio
d6,0
49,166
,644.0
0–
––
4,124,
486,66
5.68
–-27
5,001,
310.29
-327,1
35,927
.6441,
536,20
5.81
811,84
5,310.
5112,
416,42
0,716.
0523,
168,45
4,231.
764,6
03,954
,591.0
027,
772,40
8,822.
76III.
Increa
ses/de
crease
s in cu
rrent pe
riod
(decr
eases
denote
d by “-
”)1,3
51,637
,231.0
0 –
––
1,929,
894,11
0.48
–-3,1
84,834
.58-57
,329,0
54.64
8,295,
572.79
–555
,380,3
71.61
3,842,
022,45
1.30
-3,294,
518,68
4.91
547,50
3,766.
39(I)
Total c
ompre
hensive
incom
e–
––
––
–-3,1
84,834
.58-57
,329,0
54.64
––
1,517,
484,87
5.36
1,514,
300,04
0.78
70,348
,938.0
91,5
84,648
,978.8
7(II)
Capital
contrib
uted a
nd red
uced b
y sha
rehold
ers1,3
51,637
,231.0
0–
––
1,929,
894,11
0.48
––
––
––
3,281,
531,34
1.48
-3,297,
679,28
1.81
-16,14
7,940.
331.
Ordina
ry shar
es con
tribute
d by
shar
eholde
rs1,3
51,637
,231.0
0–
––
2,038,
565,42
0.42
––
––
––
3,390,
202,65
1.42
-3,297,
679,28
1.81
92,523
,369.6
12.
Capital
investe
d by h
olders
of oth
er e
quity i
nstrum
ents
––
––
––
––
––
––
––
3. Am
ount of
share
-based
paym
ents
inclu
ded in
shareh
olders
’ equity
––
––
––
––
––
––
––
4. Oth
ers–
––
–-10
8,671,
309.94
––
––
––
-108,6
71,309
.94–
-108,6
71,309
.94(III)
Approp
riation
and u
se of s
pecific
reserv
e–
––
––
––
–8,2
95,572
.79–
–8,2
95,572
.79763
,675.4
89,0
59,248
.271.
Approp
riatiovn
of spe
cific res
erve
––
––
––
––
22,913
,983.7
4–
–22,
913,98
3.74
1,332,
086.41
24,246
,070.1
52.
Use of
specific
reserv
e–
––
––
––
–-14
,618,4
10.95
––
-14,61
8,410.
95-56
8,410.
93-15
,186,8
21.88
(IV) P
rofit di
stribut
ion–
––
––
––
––
–-96
2,104,
503.75
-962,1
04,503
.75-67
,952,0
16.67
-1,030,
056,52
0.42
1. App
ropriat
ion of
surplu
s reser
ve–
––
––
––
––
––
––
–Inc
luding
: Statu
tory res
erve fu
nd–
––
––
––
––
––
––
–Dis
cretion
ary res
erve fu
nd–
––
––
––
––
––
––
–2.
Approp
riation
of gen
eral ris
k prov
ision
––
––
––
––
––
––
––
3. Dis
tributio
n to sh
arehol
ders
––
––
––
––
––
-962,1
04,503
.75-96
2,104,
503.75
-67,95
2,016.
67-1,0
30,056
,520.4
24.
Others
––
––
––
––
––
––
––
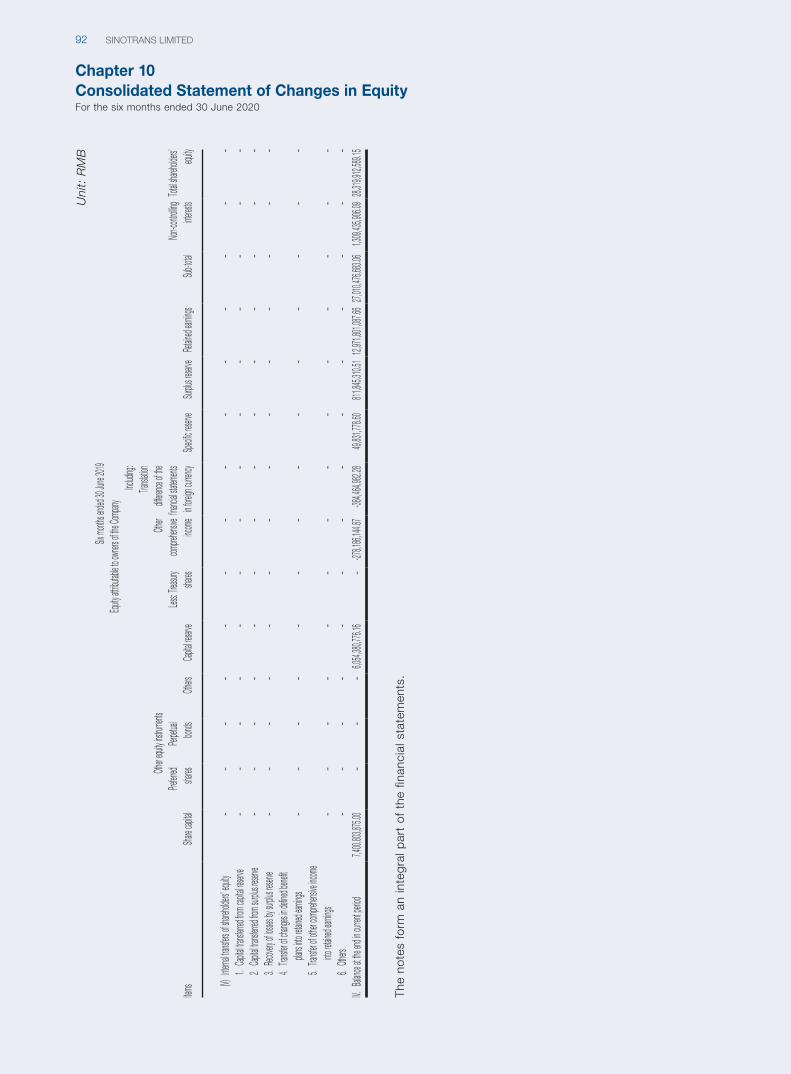
Chapter 10Consolidated Statement of Changes in EquityFor the six months ended 30 June 2020
SINOTRANS LIMITED92
Uni
t: R
MB
Items
Six mo
nths e
nded 3
0 June
2019
Equity
attribu
table t
o own
ers of
the Co
mpany
Non-c
ontroll
ing
interes
tsTot
al shar
eholde
rs’ equ
itySha
re capi
tal
Other e
quity i
nstrum
ents
Capital
reserv
eLes
s: Trea
sury
shares
Other
compre
hensive
inc
ome
Includ
ing:
Transla
tion
differe
nce of
the
financi
al state
ments
in f
oreign
curren
cySpe
cific res
erve
Surplu
s reser
veRet
ained
earnin
gsSub
-total
Preferr
ed
shares
Perpet
ual
bonds
Others
(V) Inte
rnal tra
nsfers
of sha
rehold
ers’ eq
uity–
––
––
––
––
––
––
–1.
Capital
transfe
rred fro
m capi
tal res
erve
––
––
––
––
––
––
––
2. Cap
ital tran
sferred
from s
urplus
reserv
e–
––
––
––
––
––
––
–3.
Recove
ry of lo
sses b
y surp
lus res
erve
––
––
––
––
––
––
––
4. Tra
nsfer o
f chang
es in d
efined
benefit
p
lans in
to reta
ined e
arning
s–
––
––
––
––
––
––
–5.
Transf
er of ot
her co
mpreh
ensive
incom
e in
to reta
ined e
arning
s–
––
––
––
––
––
––
–6.
Others
––
––
––
––
––
––
––
IV. Bal
ance a
t the e
nd in c
urrent p
eriod
7,400,
803,87
5.00
––
–6,0
54,380
,776.1
6–
-278,1
86,144
.87-38
4,464,
982.28
49,831
,778.6
0811
,845,3
10.51
12,971
,801,0
87.66
27,010
,476,6
83.06
1,309,
435,90
6.09
28,319
,912,5
89.15
The
note
s fo
rm a
n in
tegr
al p
art
of t
he f
inan
cial
sta
tem
ents
.
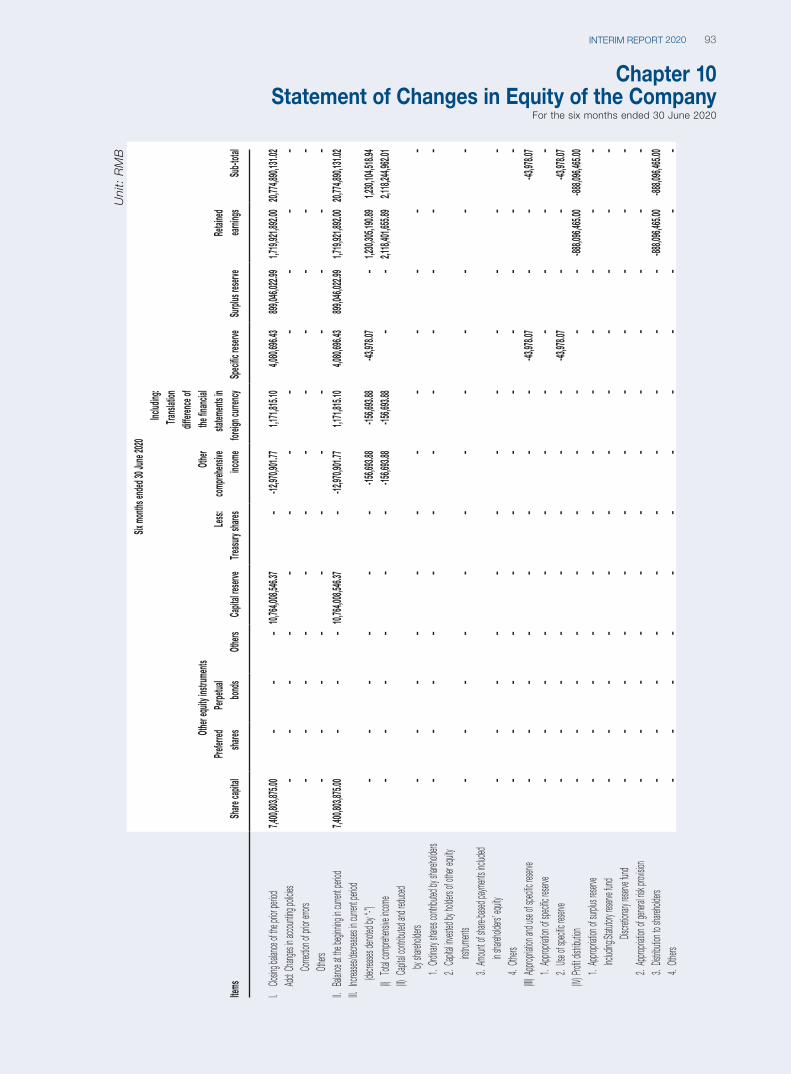
93INTERIM REPORT 2020
Chapter 10Statement of Changes in Equity of the Company
For the six months ended 30 June 2020U
nit:
RM
B
Items
Six m
onths
ende
d 30 J
une 2
020
Share
capit
al
Other
equit
y instr
umen
ts
Capit
al res
erve
Less:
Tre
asury
shares
Other
comp
rehen
sive
incom
e
Includ
ing:
Transl
ation
dif
feren
ce of
the
finan
cial
statem
ents
in for
eign c
urren
cySp
ecific
reser
veSu
rplus
reserv
eRe
taine
d ea
rning
sSu
b-tota
lPre
ferred
sha
resPe
rpetua
l bo
nds
Others
I. Clo
sing b
alance
of th
e prior
period
7,400,
803,87
5.00
––
–10,
764,00
8,546.
37–
-12,97
0,901.
771,1
71,815
.104,0
80,696
.43899
,046,0
22.99
1,719,
921,89
2.00
20,774
,890,1
31.02
Add:
Chang
es in a
ccount
ing po
licies
––
––
––
––
––
––
Corre
ction o
f prior
error
s–
––
––
––
––
––
–Oth
ers–
––
––
––
––
––
–II.
Balan
ce at
the be
ginnin
g in cu
rrent
period
7,400,
803,87
5.00
––
–10,
764,00
8,546.
37–
-12,97
0,901.
771,1
71,815
.104,0
80,696
.43899
,046,0
22.99
1,719,
921,89
2.00
20,774
,890,1
31.02
III. Inc
reases
/decre
ases in
curre
nt per
iod
(dec
reases
denot
ed by
“-”)
––
––
––
-156,6
93.88
-156,6
93.88
-43,97
8.07
–1,2
30,305
,190.8
91,2
30,104
,518.9
4(I)
Total c
ompre
hensiv
e incom
e–
––
––
–-15
6,693.
88-15
6,693.
88–
–2,1
18,401
,655.8
92,1
18,244
,962.0
1(II)
Capita
l contr
ibuted
and r
educed
b
y shar
eholde
rs–
––
––
––
––
––
–1.
Ordina
ry shar
es con
tribute
d by s
hareho
lders
––
––
––
––
––
––
2. Ca
pital in
vested
by ho
lders
of oth
er equ
ity
inst
rument
s–
––
––
––
––
––
–3.
Amoun
t of sh
are-ba
sed pa
yment
s inclu
ded
in s
hareho
lders’
equity
––
––
––
––
––
––
4. Oth
ers–
––
––
––
––
––
–(III)
App
ropriat
ion an
d use
of spe
cific r
eserve
––
––
––
––
-43,97
8.07
––
-43,97
8.07
1. Ap
propria
tion of
speci
fic res
erve
––
––
––
––
––
––
2. Us
e of sp
ecific
reserv
e–
––
––
––
–-43
,978.0
7–
–-43
,978.0
7(IV)
Profit
distrib
ution
––
––
––
––
––
-888,0
96,465
.00-88
8,096,
465.00
1. Ap
propria
tion of
surplu
s rese
rve–
––
––
––
––
––
–Inc
luding
: Statu
tory re
serve
fund
––
––
––
––
––
––
Discre
tionary
reser
ve fun
d–
––
––
––
––
––
–2.
Appro
priation
of ge
neral r
isk pr
ovisio
n–
––
––
––
––
––
–3.
Distrib
ution t
o shar
eholde
rs–
––
––
––
––
–-88
8,096,
465.00
-888,0
96,465
.004.
Others
––
––
––
––
––
––
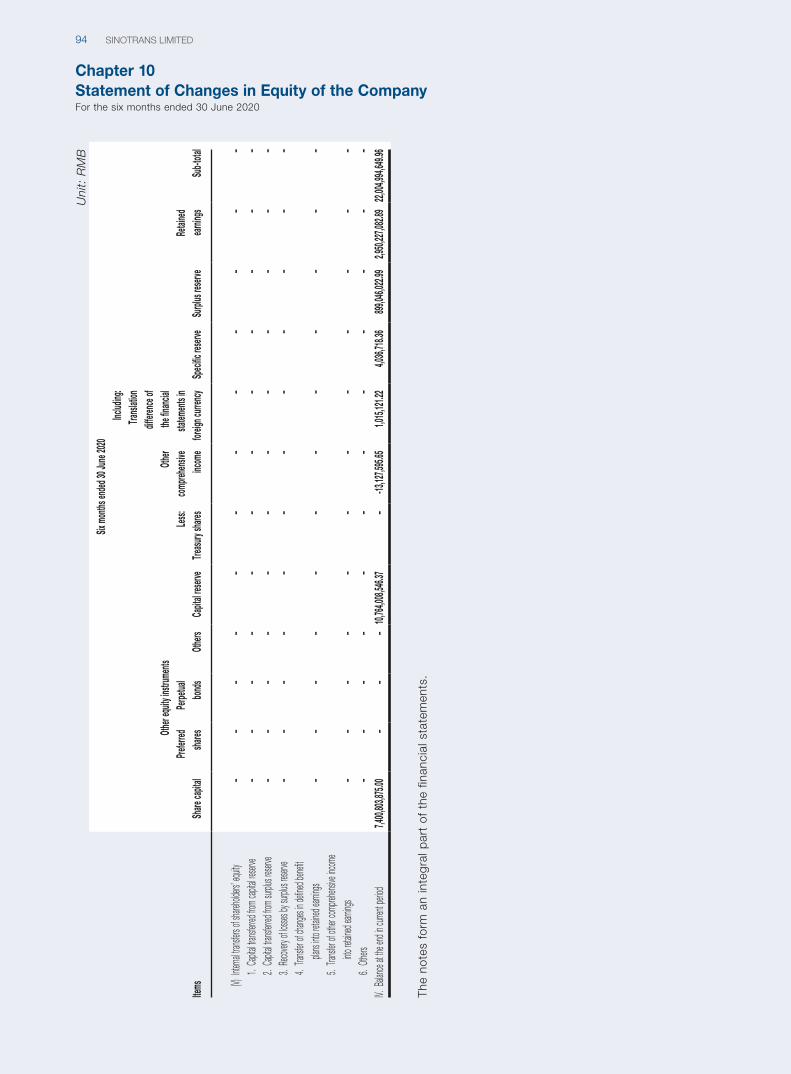
Chapter 10Statement of Changes in Equity of the CompanyFor the six months ended 30 June 2020
SINOTRANS LIMITED94
Uni
t: R
MB
Items
Six m
onths
ende
d 30 J
une 2
020
Share
capit
al
Other
equit
y instr
umen
ts
Capit
al res
erve
Less:
Tre
asury
shares
Other
comp
rehen
sive
incom
e
Includ
ing:
Transl
ation
dif
feren
ce of
the
finan
cial
statem
ents
in for
eign c
urren
cySp
ecific
reser
veSu
rplus
reserv
eRe
taine
d ea
rning
sSu
b-tota
lPre
ferred
sha
resPe
rpetua
l bo
nds
Others
(V) Inte
rnal tr
ansfers
of sh
arehol
ders’ e
quity
––
––
––
––
––
––
1. Ca
pital tr
ansferr
ed fro
m cap
ital re
serve
––
––
––
––
––
––
2. Ca
pital tr
ansferr
ed fro
m sur
plus r
eserve
––
––
––
––
––
––
3. Re
covery
of los
ses by
surplu
s rese
rve–
––
––
––
––
––
–4.
Transf
er of
change
s in de
fined b
enefit
plan
s into
retain
ed ear
nings
––
––
––
––
––
––
5. Tra
nsfer
of oth
er com
prehen
sive in
come
into
retain
ed ear
nings
––
––
––
––
––
––
6. Oth
ers–
––
––
––
––
––
–IV.
Balan
ce at
the en
d in cu
rrent
period
7,400,
803,87
5.00
––
–10,
764,00
8,546.
37–
-13,12
7,595.
651,0
15,121
.224,0
36,718
.36899
,046,0
22.99
2,950,
227,08
2.89
22,004
,994,6
49.96
The
note
s fo
rm a
n in
tegr
al p
art
of t
he f
inan
cial
sta
tem
ents
.
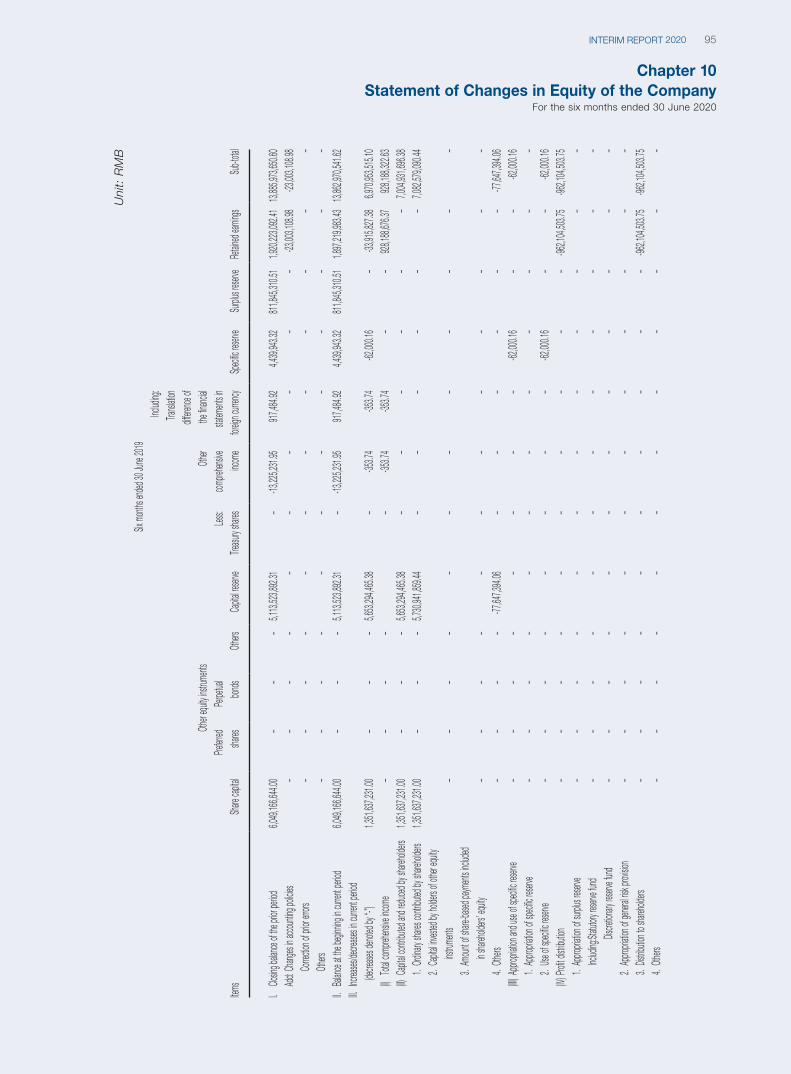
Chapter 10Statement of Changes in Equity of the Company
For the six months ended 30 June 2020
95INTERIM REPORT 2020
Uni
t: R
MB
Items
Six m
onths
ended
30 Jun
e 2019
Share
capita
l
Other
equity
instru
ments
Capita
l reser
veLes
s: Tre
asury s
hares
Other
compre
hensiv
e inc
ome
Includ
ing:
Transl
ation
differe
nce of
the fin
ancial
statem
ents in
for
eign c
urrenc
ySp
ecific
reserv
eSu
rplus r
eserve
Retain
ed ear
nings
Sub-t
otal
Preferr
ed
shares
Perpe
tual
bonds
Others
I. Clo
sing b
alance
of th
e prior
period
6,049,
166,64
4.00
––
–5,1
13,523
,892.3
1–
-13,22
5,231.
95 917
,484.9
24,4
39,943
.32
811,84
5,310.
511,9
20,223
,092.4
113,
885,97
3,650.
60Ad
d: Ch
anges
in acco
unting
polici
es–
––
––
––
––
–-23
,003,1
08.98
-23,00
3,108.
98Co
rrectio
n of p
rior er
rors
––
––
––
––
––
––
Others
––
––
––
––
––
––
II. Ba
lance
at the
begin
ning in
curre
nt per
iod6,0
49,166
,644.0
0–
––
5,113,
523,89
2.31
–-13
,225,2
31.95
917,48
4.92
4,439,
943.32
811,84
5,310.
511,8
97,219
,983.4
313,
862,97
0,541.
62III.
Increa
ses/de
crease
s in cu
rrent
period
(
decrea
ses de
noted
by “-”
)1,3
51,637
,231.0
0–
––
5,653,
294,46
5.38
–-35
3.74
-353.7
4-62
,000.1
6–
-33,91
5,827.
38 6,9
70,953
,515.1
0 (I)
Total c
ompre
hensiv
e incom
e–
––
––
-353.7
4-35
3.74
––
928,18
8,676.
37928
,188,3
22.63
(II) Ca
pital co
ntribu
ted an
d redu
ced by
share
holder
s1,3
51,637
,231.0
0–
––
5,653,
294,46
5.38
––
––
––
7,004,
931,69
6.38
1. Ord
inary s
hares
contrib
uted b
y shar
eholde
rs1,3
51,637
,231.0
0–
––
5,730,
941,85
9.44
––
––
––
7,082,
579,09
0.44
2. Ca
pital in
vested
by ho
lders
of oth
er equ
ity
inst
rument
s–
––
––
––
––
––
–3.
Amoun
t of sh
are-ba
sed pa
yment
s inclu
ded
in s
hareho
lders’
equity
––
––
––
––
––
––
4. Oth
ers–
––
–-77
,647,3
94.06
––
––
––
-77,64
7,394.
06 (III)
App
ropriat
ion an
d use
of spe
cific r
eserve
––
––
––
––
-62,00
0.16
––
-62,00
0.16
1. Ap
propria
tion of
speci
fic res
erve
––
––
––
––
––
––
2. Us
e of sp
ecific
reserv
e–
––
––
––
–-62
,000.1
6–
–-62
,000.1
6(IV)
Profit
distrib
ution
––
––
––
––
––
-962,1
04,503
.75
-962,1
04,503
.75
1. Ap
propria
tion of
surplu
s rese
rve–
––
––
––
––
––
–Inc
luding
: Statu
tory re
serve
fund
––
––
––
––
––
––
Discre
tionary
reser
ve fun
d–
––
––
––
––
––
–2.
Appro
priation
of ge
neral r
isk pr
ovisio
n–
––
––
––
––
––
–3.
Distrib
ution t
o shar
eholde
rs–
––
––
––
––
–-96
2,104,
503.75
-96
2,104,
503.75
4.
Others
––
––
––
––
––
––
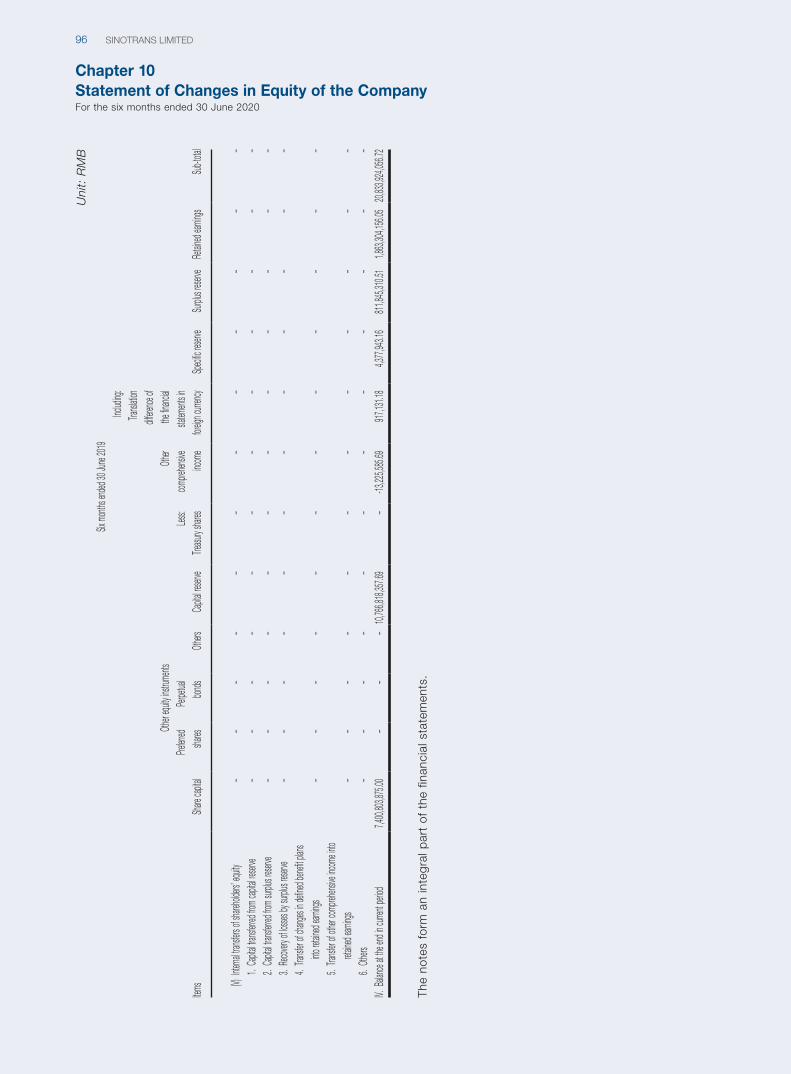
Chapter 10Statement of Changes in Equity of the CompanyFor the six months ended 30 June 2020
SINOTRANS LIMITED96
Uni
t: R
MB
Items
Six m
onths
ended
30 Jun
e 2019
Share
capita
l
Other
equity
instru
ments
Capita
l reser
veLes
s: Tre
asury s
hares
Other
compre
hensiv
e inc
ome
Includ
ing:
Transl
ation
differe
nce of
the fin
ancial
statem
ents in
for
eign c
urrenc
ySp
ecific
reserv
eSu
rplus r
eserve
Retain
ed ear
nings
Sub-t
otal
Preferr
ed
shares
Perpe
tual
bonds
Others
(V) Inte
rnal tr
ansfers
of sh
arehol
ders’ e
quity
––
––
––
––
––
––
1. Ca
pital tr
ansferr
ed fro
m cap
ital re
serve
––
––
––
––
––
––
2. Ca
pital tr
ansferr
ed fro
m sur
plus r
eserve
––
––
––
––
––
––
3. Re
covery
of los
ses by
surplu
s rese
rve–
––
––
––
––
––
–4.
Transf
er of
change
s in de
fined b
enefit p
lans
into
retain
ed ear
nings
––
––
––
––
––
––
5. Tra
nsfer
of oth
er com
prehen
sive in
come in
to
reta
ined e
arning
s–
––
––
––
––
––
–6.
Others
––
––
––
––
––
––
IV. Ba
lance
at the
end in
curre
nt per
iod7,4
00,803
,875.0
0–
––
10,766
,818,3
57.69
–-13
,225,5
85.69
917,13
1.18
4,377,
943.16
811,84
5,310.
511,8
63,304
,156.0
5 20,
833,92
4,056.
72
The
note
s fo
rm a
n in
tegr
al p
art
of t
he f
inan
cial
sta
tem
ents
.
97INTERIM REPORT 2020
Chapter 10Notes to the Financial Statements
For the six months ended 30 June 2020(Unless otherwise indicated, the unit of amount is RMB)
I. GENERAL INFORMATION OF THE COMPANY
Sinotrans Limited (hereinafter referred to as “the Company”) is a joint stock limited company established
in the People’s Republic of China (hereinafter referred to as “PRC”) on 20 November 2002, initiated
by China National Foreign Trade Transportation (Group) Corporation (hereinafter referred to as “China
Foreign Transportation Group Company”).
The Company was established with a total capital of 2,624,087,200 shares with a par value of RMB1
per share. On 21 November 2002, the State Economy and Trade Commission made the Approval on
the Conversion of Sinotrans Limited into an Overseas Fund-raising Company (GJMQG [2002] No.870),
agreed that the Company converted into a company that raised shares overseas and to be listed. On
22 November 2002, according to the Disclosure on the Issuance of Overseas Listed Foreign Capital
Shares by Sinotrans Limited (ZJGHZ [2002] No.35), the China Securities Regulatory Commission
(hereinafter referred to as “CSRC”) agreed the Company to issue no more than 1,787,407,050 overseas
listed foreign capital shares (including 233,140,050 over-allotment shares), with a par value of RMB1
per share; the shares issued this time are all ordinary shares, in which the Company issued no more
than 1,624,915,500 new shares, and the shareholders sold no more than 162,491,550 Pre-IPO Shares.
In February 2003, the Company completed its initial public offering on the Stock Exchange of Hong
Kong (hereinafter referred to as “Hong Kong Stock Exchange”), issuing 1,787,406,000 overseas listed
foreign shares (hereinafter referred to as “H-shares”), including 1,624,915,000 newly issued shares
and 162,491,000 H-shares allocated by China Foreign Transportation Group Company. So far, the
Company’s issued capital has increased from 2,624,087,200 shares to 4,249,002,200 shares, including
2,461,596,200 domestic shares and 1,787,406,000 H-shares held by China Foreign Transportation
Group Company, accounting for 57.9% and 42.1% of the issued capital respectively.
In 2009, China Foreign Transportation Group Company changed its name to China Foreign
Transportation & Changjiang Shipping Group Co., Ltd. (hereinafter referred to as “SINOTRANS & CSC”)
after merging with China Changjiang National Shipping (Group) Corporation. Since then, the Company
has become a subsidiary of SINOTRANS & CSC.
On 11 June 2014, according to the resolution passed by the board of directors and the shareholders’
meeting of the Company, approved by the State-owned Assets Supervision and Administration
Commission of the State Council (hereinafter referred to as “SASAC”) of Approval on Issues Relevant to
the Private Issuance of H-share Stocks by Sinotrans Limited (State-owned Assets Right [2014] No.441)
and on 9 July 2014, CSRC approved the Approval on Additional Issuance of Overseas Listed Foreign
Shares by Sinotrans Limited (Securities Regulatory License [2014] No.688), the Company allocated
357,481,000 H-shares in total to various places, with a par value of RMB1 per share, accounting
for 8.41% of the issued capital, the Company’s issued capital has increased from 4,249,002,200
shares to 4,606,483,200 shares. Hereby, the registered capital of the Company is changed to
RMB4,606,483,200.
Chapter 10Notes to the Financial StatementsFor the six months ended 30 June 2020(Unless otherwise indicated, the unit of amount is RMB)
SINOTRANS LIMITED98
I. GENERAL INFORMATION OF THE COMPANY (CONTINUED)
On 29 December 2015, after SASAC reported to the State Council and approved by the State Council,
SINOTRANS & CSC and China Merchants Group (hereinafter referred to as “China Merchants”)
implemented strategic restructuring. SINOTRANS & CSC merged into China Merchants as a whole by
means of free transfer, and became its wholly-owned subsidiary. The Company has therefore become
a listed subsidiary of China Merchants. Since 1 January 2016, China Merchants has taken control of
SINOTRANS & CSC, so China Merchants has become the ultimate holding company of the Company.
On 22 August 2017, the Company entered into an acquisition agreement with China Merchants.
Pursuant to the acquisition agreement, the Company agreed to purchase all the shares of the China
Merchants Logistics Holding Co., Ltd. (its name was changed as Sinotrans Logistics Co., Ltd. in
2019, hereinafter referred to as “Sinotrans Logistics”) held by China Merchants from it, and the total
consideration was RMB5,450,000,000, which was paid by issuing 1,442,683,444 domestic shares. On
16 October 2017, the Company’s extraordinary general meeting and H-share shareholders’ meeting
voted to agree the above acquisition. Meanwhile, the related acquisition was approved by the SASAC
on 11 October 2017 on the Approval of the Related Issues of Assets Restructuring of Sinotrans Limited
(State-owned Assets Right [2017] No.1052), the Company completed the registration and issuance of
1,442,683,444 domestic shares in China Securities Depository and Clearing Co., Ltd. on 3 November
2017, the newly issued shares accounted for 31.32% of issued capital, the Company’s issued capital
has increased from 4,606,483,200 shares to 6,049,166,644 shares. Hereby, the registered capital of
the Company is changed to RMB6,049,166,644.
On 31 May 2018, a motion for the exchange of shares and the consolidation by merger of Sinotrans Air
Transportation Development Corporation Limited (hereinafter referred to as “Sinoair”) as a subsidiary
by the Company was considered and adopted at the Company’s extraordinary general meeting
and the meeting of class shareholders in 2018, which approved the issuance of A shares by the
Company to all the shareholders of Sinoair (excluding the Company) in exchange for the shares of
Sinoair held by it. On 1 November 2018, China Securities Regulatory Commission issued an Reply
on Approval of the Application of Sinotrans Limited for Consolidation by Merger of Sinotrans Air
Transportation Development Co., Ltd. (ZJXK [2018] No. 1772), approving the issuance by the Company
of 1,351,637,231 shares for the consolidation by merger of Sinoair. On 10 January 2019, the Company
completed the issuance of A shares, and it was officially listed on Shanghai Stock Exchange (hereinafter
referred to as “SSE”) on 18 January 2019. The registered capital of the Company was changed into
RMB7,400,803,875.
The Company belongs to the logistics and transport industry, specifically involving non-vessel transport
business (valid until 9 March 2024); domestic waterway transport shipping agency and passenger cargo
transport agency business; undertake the international freight forwarding business of marine, land,
air import and export goods, international exhibits, private goods and transit goods, etc. Registered
address of the Company: A43, Xizhimen Beidajie, Haidian District, Beijing. Legal representative: Li
Guanpeng.
Chapter 10Notes to the Financial Statements
For the six months ended 30 June 2020(Unless otherwise indicated, the unit of amount is RMB)
99INTERIM REPORT 2020
I. GENERAL INFORMATION OF THE COMPANY (CONTINUED)
The Company and its subsidiary (hereinafter referred to as “the Group”) are principally engaged in
the provision of forwarding and related, logistics, e-commerce and other services. The Group’s main
business is located in China.
Details of the principal activities of major subsidiaries of the Company are set out in Note VIII “Business
Combination and Consolidated Financial Statements”.
II. BASIS FOR THE PREPARATION
The Group has evaluated its ability to continue as a going concern for the 12 months from 30 June
2020, including, but not limited to, an assessment for the potential impact of COVID-19, and has not
identified any events or circumstances that may cast a significant doubt over its ability to continue as a
going concern.
Therefore, the financial statements are prepared on a going concern and accrual basis and are
prepared in accordance with the Accounting Standards for Business Enterprises and other relevant
regulations issued by the Ministry of Finance (hereinafter referred to as “Accounting Standards for
Business Enterprises”), and the relevant disclosures required by the Rules for Compiling Information
Disclosure of Public Securities Companies No. 15 — General Provisions on Financial Reporting (revised
in 2014) of CSRC and relevant provisions, the disclosure requirements of the Hong Kong Companies
Ordinance and the Rules Governing the Listing of Securities on Hong Kong Stock Exchange (the
“Listing Rules”) and based on the accounting policies and accounting estimates as described in the
note “IV. Significant Accounting Policies and Accounting Estimates of the Company”.
III. STATEMENT OF COMPLIANCE WITH ACCOUNTING STANDARDS FOR BUSINESS ENTERPRISES
The financial statements prepared by the Company are in compliance with the Accounting Standards
for Business Enterprises, and truly and completely present the financial position of the Group and the
Company as of 30 June 2020; as well as the consolidated and the Company’s operating results and
cash flows from January to June 2020.
Chapter 10Notes to the Financial StatementsFor the six months ended 30 June 2020(Unless otherwise indicated, the unit of amount is RMB)
SINOTRANS LIMITED100
IV. SIGNIFICANT ACCOUNTING POLICIES AND ACCOUNTING ESTIMATES OF THE COMPANY
1. Fiscal YearThe Group’ adopts the calendar year, i.e. from 1 January to 31 December of each year, as its fiscal
year.
2. Functional CurrencyRenminbi is the currency in the main economic environment where the Company and its domestic
subsidiaries operate. The functional currency of the Company and its domestic subsidiaries is in
Renminbi. The overseas subsidiaries of the Company determine its functional currency according to
the principal currency of its business income and expenditure. The presentation currency used by the
Company in preparing these financial statements is Renminbi.
3. Accounting Basis and MeasurementThe accounting of the Group is based on the accrual basis. The financial statements have been
prepared on the historical cost basis except for certain financial instruments that are measured at fair
values at the end of each reporting period. Where an asset is impaired, the corresponding impairment
shall be made in accordance with the applicable standard.
Under the historical cost basis, assets are measured according to the amount of cash or cash
equivalents paid at the time of acquisition or the fair value of the consideration paid. Liabilities are
measured according to the amount of cash or value of assets actually received due to the assumption
of current obligations, or the contract amount of the current obligation, or in accordance with the
amount of cash or cash equivalents expected to be paid in daily activities to discharge such liabilities.
Fair value is the price that market participants can receive or transfer a liability in an orderly transaction
on the measurement date. Whether the fair value is observable or estimated by using valuation
techniques, the fair value measured and/or disclosed in the financial statements is determined on this
basis.
The fair value measurement is divided into three levels based on the observability of the input value of
the fair value and the importance of the input value to the fair value measurement as a whole.
• The Level I input value is the unadjusted quotation of the same assets or liabilities that can be
obtained on the measurement date in the active market.
• The Level II input value is the direct or indirect observable input value of related assets or liabilities
other than the Level I input value.
• The Level III input value is the unobservable input value of related assets or liabilities.
Chapter 10Notes to the Financial Statements
For the six months ended 30 June 2020(Unless otherwise indicated, the unit of amount is RMB)
101INTERIM REPORT 2020
IV. SIGNIFICANT ACCOUNTING POLICIES AND ACCOUNTING ESTIMATES OF THE COMPANY (CONTINUED)
4. Business CombinationBusiness combination includes business combinations involving entities under common control and
business combinations not involving entities under common control.
4.1 Business combination involving entities under common control
A business combination involving entities under common control is a business combination in
which all of the combining entities are ultimately controlled by the same party or parties both
before and after the combination, and that control is not transitory.
Assets and liabilities of the combining entities or businesses are consolidated using the existing
carrying amount at the date of acquisition from the controlling party’s perspective. The difference
between the carrying amount of the net assets acquired and the consideration is adjusted to
capital reserve (capital premium). If the capital premium is not sufficient to absorb the difference,
any excess is adjusted to retained earnings.
Costs that are directly attributable to the business combination are charged to profit or loss when
incurred.
4.2 Business combination not involving entities under common control
A business combination not involving entities under common control is a business combination in
which all of the combining enterprises are not ultimately controlled by the same party or parties
before and after the combination.
The consideration paid for business combination is measured at fair value, which is calculated
as the sum of the acquisition-date fair values of the assets transferred by the Group, liabilities
incurred by the Group to the former owners of the acquiree and the equity interests issued by the
Group in exchange for control of the acquiree. Acquisition-related costs incurred, including the
expenses for audit, legal services, assessment, and other relevant administrative expenses, are
recognised in profit or loss as incurred.
At the acquisition date, the identifiable assets acquired and the liabilities assumed are recognised
at their fair value.
The difference between the consideration paid for business combination over the share of the fair
value of the acquiree’s identifiable net assets acquired in the business combination is recognised
as an asset and initially measured at cost as goodwill. If the consideration paid for business
combination is less than the fair value share of the acquiree’s identifiable net assets acquired in
the business combination, the fair value of each of the acquiree’s identifiable assets, liabilities
and contingent liabilities acquired and the measurement of the consideration paid for business
combination are reviewed. If, after review, the consideration paid for business combination
remains less than the fair value share of the acquiree’s identifiable net assets acquired in the
business combination, it is recognised in profit or loss for the current period.
Chapter 10Notes to the Financial StatementsFor the six months ended 30 June 2020(Unless otherwise indicated, the unit of amount is RMB)
SINOTRANS LIMITED102
IV. SIGNIFICANT ACCOUNTING POLICIES AND ACCOUNTING ESTIMATES OF THE COMPANY (CONTINUED)
5. GoodwillGoodwill resulting from business combination shall be separately presented in the consolidated financial
statements and shall be measured on the basis of its costs less the accumulative impairment losses.
Goodwill shall be tested for impairment at least annually.
For the purpose of impairment testing, goodwill is allocated to each of the Group’s cash-generating
units or groups of cash-generating units that is expected to benefit from the synergies of the
combination. If the recoverable amount of the cash-generating unit is less than its carrying amount, the
impairment loss is allocated first to reduce the carrying amount of any goodwill allocated to the unit and
then to the other assets of the unit on a pro rata basis based on the carrying amount of each asset in
the unit.
Recoverable amount is the higher of value in use and fair value less costs of disposal.
Any impairment loss for goodwill is recognised directly in profit or loss. An impairment loss recognised
for goodwill is not reversed in subsequent periods.
6. Consolidated Financial StatementsThe scope of consolidation in the consolidated financial statements is determined on a control basis.
Control means that the investor has power over the investee, exposes a variable return through
participation in the investee’s related activities, and has the ability to use its power over the investee to
influence the amount of its return. In the event that changes in relevant facts and circumstances result
in a change in the relevant elements involved in the above definition of control, the Group will reassess.
Consolidation of a subsidiary begins when the Group obtains control of the subsidiary and cease when
the Group loses control of the subsidiary.
For subsidiaries disposed of by the Group, the operating results and cash flows prior to the disposal
date (the date of loss of control) shall be properly included in the consolidated statement of profit or
loss and other comprehensive income and consolidated statement of cash flows.
For subsidiaries acquired through business combination not under common control, its operating
results and cash flows since the acquisition date (the date of control) shall be properly included in the
consolidated statement of profit or loss and other comprehensive income and consolidated statement
of cash flows.
For the subsidiaries acquired through business combination under common control, whether the
business combination occurs at any point in the reporting period, the operating results and cash flows
of the acquiree shall be included in the consolidated financial statements from the beginning of the
period, as if the reporting entity established through combination has been existing since the ultimate
controller begins to exercise control.
Chapter 10Notes to the Financial Statements
For the six months ended 30 June 2020(Unless otherwise indicated, the unit of amount is RMB)
103INTERIM REPORT 2020
IV. SIGNIFICANT ACCOUNTING POLICIES AND ACCOUNTING ESTIMATES OF THE COMPANY (CONTINUED)
6. Consolidated Financial Statements (continued)The significant accounting policies and accounting periods adopted by the subsidiaries shall be
determined in accordance with the accounting policies and accounting periods uniformly stipulated by
the Company.
All intra-group assets and liabilities, equity, income, expenses and cash flows relating to transactions
between entities of the Group are eliminated in full on consolidation.
Interests in the subsidiaries that do not belong to the Company are accounted for as non-controlling
interests and shall be presented as “non-controlling interests” under the shareholders’ equity line item
in the consolidated statement of financial position. The share of the current net profit or loss of a
subsidiary belonging to non-controlling interests shall be presented as “non-controlling interests” under
the net profit line item in the consolidated statement of profit or loss and other comprehensive income.
The share of other comprehensive income of a subsidiary belonging to non-controlling interests shall be
presented as “Total comprehensive income attributable to non-controlling interests” under the line item
of total comprehensive income in the consolidated statement of profit or loss and other comprehensive
income.
The excess of subsidiaries’ loss shared by the non-controlling interests over the initial interests is still
adjusted to non-controlling interests.
For the transaction of acquiring non-controlling interests of the subsidiary or disposing part of the equity
investment without losing the control of the subsidiary, it is regarded as equity transaction accounting,
and the carrying amount of the Company’s shareholders’ equity and non-controlling interests is
adjusted to reflect the changes of related equity in the subsidiary. Differences between the adjustment
of non-controlling interests and the fair value of consideration are adjusted to capital reserve. If the
differences exceed capital reserve, retained earnings shall be adjusted.
When a business combination is achieved in stages and not involving entities under common control,
it is further determined if it is a “package deal” or not: if it belongs to a “package deal”, accounting
treatment of transactions as a transaction in which control is acquired. If it does not belong to a
“package deal”, accounting treatment as the acquisition of control on the purchase date, the equity
of the acquiree held before the purchase date shall be remeasured according to the fair value of the
equity on the acquisition date, and the difference between the fair value and the carrying amount shall
be recorded into the profit or loss of the current period; where the acquisition of the acquirer’s equity
held prior to the acquisition date involves other comprehensive income and other changes in owners’
equity under the equity and equity accounting method, it shall be recognised as current profit or loss or
retained earnings on the acquisition date.
Chapter 10Notes to the Financial StatementsFor the six months ended 30 June 2020(Unless otherwise indicated, the unit of amount is RMB)
SINOTRANS LIMITED104
IV. SIGNIFICANT ACCOUNTING POLICIES AND ACCOUNTING ESTIMATES OF THE COMPANY (CONTINUED)
6. Consolidated Financial Statements (continued)When the Group loses control of a subsidiary due to partial disposal or other reasons, the retained
interest shall be remeasured at fair value at the date when control is lost. The difference between (1) the
aggregate of the fair value of consideration received and the fair value of any retained interest (2) the
share of the former subsidiary’s net assets accumulated from the acquisition date based on the original
proportion of ownership interest shall be included in the investment income in the period when control
is lost and relevant goodwill shall be written off at the same time. Other comprehensive income related
to the equity investment of the former subsidiary shall be reclassified into profit or loss when the control
is lost.
Where the loss of control is achieved in stages and is determined to be a “package deal”, the Company
accounts for each of these transactions similar as disposal of the subsidiary. Where the accounting
policy/accounting period adopted by the subsidiary are inconsistent with the Company before the
loss of control, necessary adjustments have been performed to conform with the accounting policy/
accounting period of the Company. The difference between (1) each consideration received before the
loss of control (2) the corresponding share of the former subsidiary’s net assets accumulated from the
acquisition date shall be included in other comprehensive income, and it shall be transferred to current
profit or loss when losing control.
7. Joint ArrangementA joint arrangement refers to an arrangement under the joint control of two or more participants. The
joint arrangement of the Group has the following characteristics: (1) Each participant is bound by the
arrangement; (2) Two or more participants have joint control over the arrangement. No participant can
control the arrangement independently, and any participant with joint control over the arrangement
can prevent other participant or a combination of participants from controlling the arrangement
independently.
Joint control refers to the sharing of control over an arrangement according to relevant agreements,
and the related activities of the arrangement can only be decided after the unanimous consent of the
participants sharing the control.
Joint venture arrangement is classified into joint operation and joint venture. A joint operation is a joint
arrangement whereby the parties that have joint control of the arrangement have rights to the assets
and obligations for the liabilities relating to the arrangement. A joint venture is a joint arrangement
whereby the parties that have joint control of the arrangement have rights to the net assets of the
arrangement.
Chapter 10Notes to the Financial Statements
For the six months ended 30 June 2020(Unless otherwise indicated, the unit of amount is RMB)
105INTERIM REPORT 2020
IV. SIGNIFICANT ACCOUNTING POLICIES AND ACCOUNTING ESTIMATES OF THE COMPANY (CONTINUED)
8. Cash and Cash EquivalentsCash refers to cash on hand and deposits that are available for payment at any time. Cash equivalents
refer to short-term high liquid investments held by the Group which are easily convertible into known
amount of cash and subject to an insignificant risk of changes in value.
9. Financial InstrumentsWhen the Group becomes a party to a financial instrument, it shall recognise a financial asset or
financial liability.
For the purchase or sale of financial assets in a conventional method, the assets to be received and the
liabilities to be borne for this shall be recognised on the trading day, or the assets to be sold shall be
derecognised on the trading day.
Financial assets and financial liabilities are measured at fair value at initial recognition. For financial
assets and financial liabilities measured at fair value through profit or loss, related transaction costs
are directly included in profit or loss; for other types of financial assets and financial liabilities, related
transaction costs are included in the initially recognised amount. When the Group initially recognises
receivables that do not contain significant financing components or do not consider financing
components in contracts not exceeding one year in accordance with Accounting Standards for
Business Enterprises No. 14 – Revenue (“New Revenue Standards”), the transaction price as defined by
the revenue standard is initially measured.
The effective interest rate method refers to the method of calculating the amortised cost of a financial
asset or financial liability, and the allocation of interest income or interest expenses to each accounting
period.
The effective interest rate refers to the interest rate used to discount the estimated future cash flows
of a financial asset or financial liability over the expected duration of the financial asset’s carrying
amount or the amortised cost of the financial liability. In determining the effective interest rate, the
expected cash flow is estimated on the basis of considering all contract terms of financial assets or
financial liabilities (such as prepayment, rollover, call options, or other similar options, etc.), but without
considering expected credit losses.
The amortised cost of a financial asset or financial liability is the initial recognition amount of the
financial asset or financial liability minus the principal repaid, plus or minus the difference between
the initial recognition amount and the amount due on the effective interest method The accumulated
amortisation amount formed by the difference is amortised, and then the accumulated loss provision is
deducted (only applicable to financial assets).
Chapter 10Notes to the Financial StatementsFor the six months ended 30 June 2020(Unless otherwise indicated, the unit of amount is RMB)
SINOTRANS LIMITED106
IV. SIGNIFICANT ACCOUNTING POLICIES AND ACCOUNTING ESTIMATES OF THE COMPANY (CONTINUED)
9. Financial Instruments (continued)9.1 Classification and measurement of financial assets
After the initial recognition, the Group’s financial assets of various categories are subsequently
measured at amortised cost, at fair value through other comprehensive income or at fair value
through profit or loss.
The contract terms of financial assets stipulate that the cash flow generated on a specific date is
only the payment of principal and interest based on the outstanding principal amount, and that
the business model of the Group for managing the financial asset is to collect contract cash flows
as the goal. The Group classifies the financial asset as a financial asset measured at amortised
cost. Such financial assets mainly include cash and bank balances, accounts receivable, other
receivables and long-term receivables.
The contract terms of financial assets stipulate that the cash flows generated on a specific date
are only payments of principal and interest based on the outstanding principal amount, and that
the business model of the Group for managing the financial assets is both to collect contract
cash flows and for the purpose of selling the financial asset. The financial asset is classified as
a financial asset measured at fair value through other comprehensive income. If such financial
assets have a maturity period of more than one year, they are listed as other debt investments,
and if they mature within one year (including one year) from the date of the statement of financial
position, they are listed as non-current assets due within one year; If the acquisition time limit is
within one year (including one year), it is listed in other current assets.
Financial assets measured at fair value through profit or loss include financial assets classified as
measured at fair value through profit or loss and financial assets designated as measured at fair
value through in profit or loss, except derivative financial assets are listed in transactional financial
assets. Those are due more than one year (or have no fixed term) from the date of the statement
of financial position and are expected to be held for more than one year are listed in other non-
current financial assets.
• Financial assets that do not meet the criteria for classification as financial assets measured
at amortised cost and financial assets measured at fair value through other comprehensive
income are classified as financial assets measured at fair value through profit or loss.
• At the time of initial recognition, in order to eliminate or significantly reduce accounting
mismatches, the Group can irrevocably designate financial assets as financial assets
measured at fair value through profit or loss.
Upon initial recognition, the Group may irrevocably designate non-tradable equity instrument
investments other than those recognised or contingently recognised in business combinations not
under common control as a single financial asset, which is measured at fair value through other
comprehensive income. Such financial assets are listed as other equity instrument investments.
Chapter 10Notes to the Financial Statements
For the six months ended 30 June 2020(Unless otherwise indicated, the unit of amount is RMB)
107INTERIM REPORT 2020
IV. SIGNIFICANT ACCOUNTING POLICIES AND ACCOUNTING ESTIMATES OF THE COMPANY (CONTINUED)
9. Financial Instruments (continued)9.1 Classification and measurement of financial assets (continued)
If a financial asset meets one of the following conditions, it indicates that the Group’s purpose in
holding the financial asset is transactional:
• The purpose of obtaining relevant financial assets is mainly for the recent sale.
• The relevant financial assets are part of the identifiable financial instrument portfolio under
centralised management at the time of initial recognition, and there is objective evidence that
a short-term profit model actually exists in the near future.
• The relevant financial assets are derivatives, except when the derivatives meet the definition
of a financial guarantee contract and derivatives that are designated as effective hedging
instruments.
9.1.1 Financial assets measured at amortised cost
Financial assets measured at amortised cost are subsequently measured at amortised cost
using the effective interest method. Gains or losses arising from impairment or derecognition
are recognised in profit or loss for the current period.
The Group recognises interest income on financial assets measured at amortised cost using
the effective interest method. Except for the following cases, the Group determines the
interest income based on the financial asset carrying amount multiplied by the effective
interest rate:
• For credit assets that have been or were originally credit-impaired, the Group calculates
its interest income from the initial recognition of the financial asset based on the
amortised cost of the financial asset and the effective interest rate adjusted for credit.
• For financial assets that have been purchased or originated without credit impairment
but have become credit impairment in subsequent periods, the Group calculates its
interest income in the subsequent periods based on the amortised cost of the financial
asset and the effective interest rate. If the financial instrument has no credit impairment
due to an improvement in its credit risk in subsequent periods, and this improvement
can be linked to an event that occurs after the application of the above provisions, the
Group will multiply the financial interest rate by the effective interest rate. The book
balance of assets is used to calculate and determine interest income.
Chapter 10Notes to the Financial StatementsFor the six months ended 30 June 2020(Unless otherwise indicated, the unit of amount is RMB)
SINOTRANS LIMITED108
IV. SIGNIFICANT ACCOUNTING POLICIES AND ACCOUNTING ESTIMATES OF THE COMPANY (CONTINUED)
9. Financial Instruments (continued)9.1 Classification and measurement of financial assets (continued)
9.1.2 Financial assets measured at fair value through other comprehensive income
For financial assets measured at fair value through other comprehensive income, their
impairment losses or reversals, interest income calculated using the effective interest rate
and exchange gains and losses are included in the profit or loss. Otherwise, changes in the
fair value of the financial asset are included in other comprehensive income. The amount
of this financial asset included in the profit or loss of each period is equal to the amount
that has been included in the profit or loss of each period as if it had been measured
at amortised cost. When the financial asset is derecognised, the accumulated gains or
losses previously recorded in other comprehensive income are transferred from other
comprehensive income to profit or loss in current period.
After a non-tradable equity instrument investment is designated as a financial asset that is
measured at fair value through other comprehensive income, the changes in the fair value of
the financial asset are recognised in other comprehensive income. The accumulated gains
or losses included in other comprehensive income are transferred from other comprehensive
income to retained earnings. During the period when the Group holds investments in these
non-tradable equity instruments, the Group’s right to receive dividends has been established,
and economic benefits related to dividends are likely to flow into the Group, and when the
amount of dividends can be reliably measured, dividend income is recognised and calculated
into profit or loss.
9.1.3 Financial assets measured at fair value through profit or loss
Financial assets measured at fair value through profit or loss are measured at fair value
at the end of each reporting period. Gains or losses resulting from changes in fair value,
dividends and interest income related to the financial assets are included in the profit or loss.
Chapter 10Notes to the Financial Statements
For the six months ended 30 June 2020(Unless otherwise indicated, the unit of amount is RMB)
109INTERIM REPORT 2020
IV. SIGNIFICANT ACCOUNTING POLICIES AND ACCOUNTING ESTIMATES OF THE COMPANY (CONTINUED)
9. Financial Instruments (continued)9.2 Impairment of financial instruments
For financial assets measured at amortised cost, debt investments measured at fair value through
other comprehensive income and contract assets, the Group conducts impairment treatment
based on expected credit losses and recognises loss provisions.
For all contract assets and accounts receivable formed by transactions regulated by revenue
standard and lease receivables formed by transactions regulated by Accounting Standards for
Business Enterprises No. 21 – Leases, the Group measures loss provision equivalent to the
amount of expected credit losses throughout the duration period.
For other financial instruments, except the financial assets purchased or originated with credit
impairment, the Group shall evaluate the credit risk changes of the relevant financial instruments
since the initial recognition at the end of each reporting period. If the credit risk of the financial
instrument has increased significantly since the initial recognition, the Group shall measure its
loss provision according to the amount equivalent to the expected credit loss of the financial
instrument during the entire duration; If the credit risk of the financial instrument has not increased
significantly since the initial recognition, the Group shall measure its loss provision at an amount
equivalent to the expected credit loss of the financial instruments within the next 12 months.
Except for financial assets measured at fair value through other comprehensive income, the
increased or retracted amount of credit loss provision shall be recorded in profit or loss of the
period as impairment loss or gain. For financial assets measured at fair value through other
comprehensive income, the Group shall recognise its credit loss provision in other comprehensive
income, and record impairment loss or gain into profit or loss of the current period, without
reducing the carrying amount of the financial assets listed in the statement of financial position.
The Group measured expected credit loss throughout the duration period of the financial
instruments in the prior accounting period. However, at current balance sheet date, for the above
financial instruments, due to failure to qualify as significant increase in credit risk since initial
recognition, the Group measures loss provision for the financial instrument at 12-month expected
credit loss at each balance sheet date. Relevant reversal of loss provision is included in profit or
loss for the current period as gain on impairment.
Chapter 10Notes to the Financial StatementsFor the six months ended 30 June 2020(Unless otherwise indicated, the unit of amount is RMB)
SINOTRANS LIMITED110
IV. SIGNIFICANT ACCOUNTING POLICIES AND ACCOUNTING ESTIMATES OF THE COMPANY (CONTINUED)
9. Financial Instruments (continued)9.2 Impairment of financial instruments (continued)
9.2.1 Significant increase in credit risk
By comparing the default risk of financial instruments at the end of the reporting period
with that on initial recognition date, the Group uses reasonable and well-founded forward-
looking information available to determine whether the credit risk of financial instruments
has increased significantly since initial recognition. For loan commitments, when applying
the provision of impairment of financial instruments, the Group shall take the date when it
becomes the party making an irrevocable commitment as the initial recognition date.
The Group will take the following factors into consideration when evaluating whether the
credit risk is significantly increased:
(1) Whether there is a significant change in the internal price index caused by the change
of credit risk;
(2) If an existing financial instrument is originated or issued as new financial instruments
at the end of the reporting period, whether the interest rate or other terms of the
financial instrument have changed significantly (such as more stringent contract terms,
increased collateral or security or higher yield, etc.);
(3) Whether the external market indicators of the credit risk of the same financial
instrument or similar financial instrument with the same expected duration have
changed significantly. These indicators Including: credit spreads, the price of
credit default swaps for borrowers, the length and extent to which the fair value of
financial assets is less than its amortised cost, and other market information related
to borrowers (such as the price changes of borrowers’ debt instruments or equity
instruments);
(4) Whether the external credit rating the financial instruments there is any significant
change in the actual or expected;
(5) Whether the actual or expected internal credit rating of the debtor is downgraded;
(6) Adverse changes in business, financial or economic conditions that are expected to
result in a significant change in the ability of the debtor to meet its obligations;
(7) Whether the actual or expected operating results of the debtor have changed
significantly;
(8) Whether the credit risk of other financial instruments issued by the same debtor
increases significantly;
Chapter 10Notes to the Financial Statements
For the six months ended 30 June 2020(Unless otherwise indicated, the unit of amount is RMB)
111INTERIM REPORT 2020
IV. SIGNIFICANT ACCOUNTING POLICIES AND ACCOUNTING ESTIMATES OF THE COMPANY (CONTINUED)
9. Financial Instruments (continued)9.2 Impairment of financial instruments (continued)
9.2.1 Significant increase in credit risk (continued)
(9) Whether there has been a significant adverse change in the regulatory, economic or
technological environment of the debtor;
(10) Whether there has been a significant change in the value of the collateral or in the
quality of the collateral or credit enhancement provided by a third party as collateral for
a debt. These changes are expected to reduce the debtor’s financial incentive to repay
the debt within the time limit specified in the contract or affect the probability of default;
(11) Whether there is a significant change in the borrower’s economic motivation to repay
the loan within the agreed term;
(12) Anticipated changes to the loan contract, including whether the anticipated breach
of contract may result in the release or amendment of contractual obligations, the
granting of interest-free periods, the jump in interest rates, the demand for additional
collateral or collateral, or other changes to the contractual framework of the financial
instrument;
(13) Whether the expected performance and repayment behavior of the debtor change
significantly;
(14) Whether the Group has changed the credit management method of financial
instruments;
Regardless of whether the credit risk has increased significantly after the above assessment,
when the contractual payment of a financial instrument has been overdue (inclusive) for
more than 30 days, it indicates that the credit risk of the financial instrument has increased
significantly.
The Group assumes that the credit risk on a financial instrument has not increased
significantly since initial recognition if the financial instrument is determined to have low credit
risk at the end of the reporting period. If the default risk of financial instruments is low, the
borrower’s ability to fulfill its contractual cash flow obligations in the short term is strong, and
even if there are adverse changes in the economic situation and operating environment over
a long period of time, the borrower’s performance of its contractual cash obligations may not
necessarily be reduced. The financial instrument is considered to have a lower credit risk.
Chapter 10Notes to the Financial StatementsFor the six months ended 30 June 2020(Unless otherwise indicated, the unit of amount is RMB)
SINOTRANS LIMITED112
IV. SIGNIFICANT ACCOUNTING POLICIES AND ACCOUNTING ESTIMATES OF THE COMPANY (CONTINUED)
9. Financial Instruments (continued)9.2 Impairment of financial instruments (continued)
9.2.2 Credit-impaired financial assets
A financial asset is credit impaired when one or more events of the Group are expected to
have adverse effects on the future cash flow of the financial assets. Evidence of financial
asset that is credit impaired includes the following observable information:
(1) The issuer or debtor has major financial difficulties;
(2) Breach of contract by the debtor, such as breach or delay in payment of interest or
principal;
(3) The creditor gives the debtor concessions that would not be made under any other
circumstances for economic or contractual reasons in connection with the debtor’s
financial difficulties;
(4) The debtor is likely to go bankrupt or undergo other financial restructuring;
(5) The financial difficulties of the issuer or debtor result in the disappearance of the active
market of the financial asset;
(6) Purchase or originate a financial asset at a substantial discount that reflects a credit
loss.
Based on the Group’s internal credit risk management, when the internally recommended or
externally obtained information indicates that the debtor of the financial instrument cannot
fully pay its creditors including the Group (regardless of any guarantees obtained by the
Group), the Group believes that a default has occurred event.
Regardless of the above assessment results, if the contractual payment of a financial
instrument has been overdue (inclusive) for more than 90 days, the Group presumes that the
financial instrument has defaulted.
Chapter 10Notes to the Financial Statements
For the six months ended 30 June 2020(Unless otherwise indicated, the unit of amount is RMB)
113INTERIM REPORT 2020
IV. SIGNIFICANT ACCOUNTING POLICIES AND ACCOUNTING ESTIMATES OF THE COMPANY (CONTINUED)
9. Financial Instruments (continued)9.2 Impairment of financial instruments (continued)
9.2.3 Determination of expected credit losses
The Group recognises the credit losses of lease receivables on the basis of individual assets
and uses the impairment matrix to recognise the credit losses of related financial instruments
on a portfolio basis for accounts receivable, other receivables, contract assets, and debt
investments. The Group divides financial instruments into different groups based on common
risk characteristics. Common credit risk characteristics adopted by the Group Including: type
of financial instrument, credit risk rating, type of collateral, initial recognition date, remaining
contract term, industry in which the debtor is located, geographical location of the debtor,
value of collateral relative to financial assets, etc.
The Group determines the expected credit loss of the relevant financial instruments
according to the following methods:
• For financial assets, the credit loss shall be the present value of the difference between
the contractual cash flow to be collected by the Group and the expected cash flow to
be collected.
• For lease receivables, the credit loss shall be the present value of the difference
between the contractual cash flow to be collected by the Group and the expected cash
flow to be collected.
• For credit-impaired financial assets other than the purchased or internally generated of
credit-impaired financial assets at the date of the statement of financial position, the
credit loss is the difference between the carrying amount of the financial asset and the
present value of the estimated future cash flow discounted at the original real interest
rate.
The Group considers the following factors in measuring the expected credit losses of
financial instruments: an unbiased probabilistic weighted average amount determined by
evaluating a range of possible outcomes; time value of money; reasonable and evidence-
based information about past events, current conditions and projections of future economic
conditions that can be obtained at the end of the reporting period without unnecessary
additional cost or effort.
Chapter 10Notes to the Financial StatementsFor the six months ended 30 June 2020(Unless otherwise indicated, the unit of amount is RMB)
SINOTRANS LIMITED114
IV. SIGNIFICANT ACCOUNTING POLICIES AND ACCOUNTING ESTIMATES OF THE COMPANY (CONTINUED)
9. Financial Instruments (continued)9.2 Impairment of financial instruments (continued)
9.2.4 Write-off of financial assets
The Group writes off a financial asset when there is information indicating that the debtor is
in severe financial difficulty and there is no realistic prospect of recovery.
9.3 Transfer of financial assets
Financial assets that meet one of the following conditions shall be derecognised: (1) The
contractual right to collect the cash flow of the financial assets is terminated; (2) The financial
assets have been transferred, and almost all the risks and rewards in the ownership of the
financial assets have been transferred to the transferee; (3) The financial assets have been
transferred, though the Group neither transfers nor retains almost all the risks and rewards in the
ownership of the financial assets, it does not retain control over the financial assets.
If the Group neither transfers nor retains almost all the risks and rewards in the ownership of the
financial assets, and retains control over the financial assets, it shall continue to recognise the
transferred financial assets according to the extent to which it continues to be involved in the
transferred financial assets, and recognise the relevant liabilities accordingly. The Group measures
the related liabilities in the following ways:
• For the transferred financial assets are measured at amortised cost, the carrying amount
of the related liabilities is equal to the carrying amount of the continued involvement in the
transferred financial assets less the amortised cost of the rights retained by the Group (if the
Group retains the relevant rights due to the transfer of financial assets) and the obligations
undertaken by the Group (if the Group assumes the relevant obligations due to the transfer
of financial assets). Relevant liabilities are not designated as financial liabilities measured at
fair value through profit or loss.
• For the transferred financial assets are measured at fair value, the carrying amount
of the related liabilities is equal to the carrying amount of the continued involvement in
the transferred financial assets minus the fair value of rights retained by the Group (if the
Group retains the relevant rights due to the transfer of financial assets) and the obligations
undertaken by the Group (if the Group assumes the relevant obligations due to the transfer
of financial assets). The fair value of the right and obligation shall be the fair value measured
on an independent basis.
Chapter 10Notes to the Financial Statements
For the six months ended 30 June 2020(Unless otherwise indicated, the unit of amount is RMB)
115INTERIM REPORT 2020
IV. SIGNIFICANT ACCOUNTING POLICIES AND ACCOUNTING ESTIMATES OF THE COMPANY (CONTINUED)
9. Financial Instruments (continued)9.3 Transfer of financial assets (continued)
The overall transfer of financial assets meets the conditions for derecognition, for the classification
of financial assets measured at amortised cost and the classification of financial assets measured
at fair value through other comprehensive income, the difference between the carrying amount
of the transferred financial assets and the sum of the consideration received due to the transfer
and the accumulative amount of changes in fair value originally recorded in other comprehensive
income is recorded in the current profit or loss. For non-tradable equity instruments designated
by the Group to be measured at fair value through other comprehensive income, the accumulated
gains or losses previously recorded in other comprehensive income shall be transferred from other
comprehensive income and be recorded in retained earnings.
If the partial transfer of financial assets meets the conditions for the derecognition, the total
carrying amount of the financial assets before the transfer shall be allocated between the part of
the derecognition and the part of the continuing recognition according to their respective relative
fair value on the transfer date. The difference between the sum of the consideration received from
the transfer and the accumulative amount of the fair value changes originally recorded in other
comprehensive income plus the carrying amount allocated to the part of the derecognition shall be
recorded into the current profit or loss or retained earnings.
If the overall transfer of financial assets fails to meet the conditions for derecognition, the Group
shall continue to recognise the overall transfer of financial assets, and the consideration received
due to the transfer of assets shall be recognised as a liability upon receipt.
9.4 Classification of financial liabilities and equity instruments
The Group classifies the financial instrument or its components as financial liabilities or equity
instruments at the time of initial recognition in accordance with the terms of the contract of the
financial instrument issued and the economic substance reflected therein, rather than only in legal
form, in combination with the definition of financial liabilities and equity instruments.
9.4.1 Classification and measurement of financial liabilities
Financial liabilities are classified into financial liabilities and other financial liabilities at fair
value through profit or loss upon initial recognition.
Chapter 10Notes to the Financial StatementsFor the six months ended 30 June 2020(Unless otherwise indicated, the unit of amount is RMB)
SINOTRANS LIMITED116
IV. SIGNIFICANT ACCOUNTING POLICIES AND ACCOUNTING ESTIMATES OF THE COMPANY (CONTINUED)
9. Financial Instruments (continued)9.4 Classification of financial liabilities and equity instruments (continued)
9.4.1 Classification and measurement of financial liabilities (continued)
9.4.1.1 Financial liabilities at fair value through profit or loss
Financial liabilities at fair value through profit or loss, including trading financial liabilities
(including derivatives belonging to financial liabilities) and financial liabilities designated
at fair value through profit or loss. Except that the derivative financial liabilities are
separately listed. Financial liabilities at fair value through profit or loss are listed as held-
for-trading financial liabilities.
The financial liabilities meet one of the following conditions, indicating that the purpose
of the financial liabilities of the Group is transactional:
• The purpose of undertaking related financial liabilities is mainly for recent
repurchase.
• At the time of initial recognition, relevant financial liabilities were part of a centrally
managed identifiable financial instrument portfolio, and there was objective
evidence that a short-term profit model actually existed in the near future.
• Related financial liabilities are derivatives. The exceptions are derivatives that meet
the definition of financial guarantee contracts and derivatives that are designated
as effective hedging instruments.
The financial liabilities that meet one of the following conditions can be designated
at initial recognition as financial liabilities at fair value through profit or loss: (1) the
designation can eliminate or significantly reduce accounting mismatches; (2)
management and performance evaluation of financial liability portfolios or financial asset
and financial liability portfolios based on fair value according to the risk management
or investment strategy stated in the Group’s official written documents, and use this
as a basis of key management reporting; (3) Eligible mixed contracts with embedded
derivatives.
Held-for-trading financial liabilities are subsequently measured at fair value. Gains or
losses arising from changes in fair value and dividends or interest expenses related to
these financial liabilities are included in the current profit or loss.
Chapter 10Notes to the Financial Statements
For the six months ended 30 June 2020(Unless otherwise indicated, the unit of amount is RMB)
117INTERIM REPORT 2020
IV. SIGNIFICANT ACCOUNTING POLICIES AND ACCOUNTING ESTIMATES OF THE COMPANY (CONTINUED)
9. Financial Instruments (continued)9.4 Classification of financial liabilities and equity instruments (continued)
9.4.1 Classification and measurement of financial liabilities (continued)
9.4.1.1 Financial liabilities at fair value through profit or loss (continued)
For financial liabilities designated at fair value through profit or loss, changes in
the fair value of such financial liabilities arising from changes in the Group’s own
credit risk are recognised in other comprehensive income and changes in other fair
values are recognised in profit or loss in the current period. On derecognition of the
financial liability, the cumulative change in fair value attributable to changes in own
credit risk previously recognised in other comprehensive income is transferred to
retained earnings. Dividends or interest expenses related to these financial liabilities
are recognised in profit or loss for the period. If the treatment of the effects of changes
in the own credit risk of such financial liabilities as described above would cause or
enlarge an accounting mismatch in profit or loss, the Group recognises the entire gain
or loss on such financial liabilities (including the amount of the effect of changes in own
credit risk) in profit or loss for the period.
For financial liabilities resulting from contingent consideration recognised by the Group
as the acquirer in a business combination not under common control, the Group
measures the financial liabilities at fair value and recognises the change in current profit
or loss.
9.4.1.2 Other financial liabilities
Other financial liabilities, except those arising from the transfer of financial assets that
does not meet the conditions for derecognition or continue to involve in the financial
liabilities formed by the transferred financial assets, shall be classified as financial
liabilities measured at amortised costs, and shall be subsequently measured at
amortised costs. The profits or losses generated by derecognition or amortisation shall
be recorded into profit or loss of the current period.
If the Group revises or renegotiates the contract with the counterparty, which does
not result in the derecognition of financial liabilities that are subsequently measured
at amortised cost, but results in changes in contractual cash flows, the Group
recalculates the carrying amount of the financial liability and gains or losses are
included in profit or loss. The recalculated carrying amount of the financial liability is
determined based on the discounted present value of the contractual cash flow to be
renegotiated or modified at the original effective interest rate of the financial liability.
For all costs or expenses incurred by revising or renegotiating the contract, the Group
adjusts the carrying amount of the revised financial liability and amortises it over the
remaining period of the revised financial liability.
Chapter 10Notes to the Financial StatementsFor the six months ended 30 June 2020(Unless otherwise indicated, the unit of amount is RMB)
SINOTRANS LIMITED118
IV. SIGNIFICANT ACCOUNTING POLICIES AND ACCOUNTING ESTIMATES OF THE COMPANY (CONTINUED)
9. Financial Instruments (continued)9.4 Classification of financial liabilities and equity instruments (continued)
9.4.1 Classification and measurement of financial liabilities (continued)
9.4.1.2 Other financial liabilities (continued)
9.4.1.2.1 Financial guarantee contract
A financial guarantee contract is a contract that requires the issuer to pay a
specific amount to the contract holder who has suffered a loss when a specific
debtor fails to repay the debt in accordance with the terms of the original or
modified debt instrument. Subsequent to initial recognition, for financial guarantee
contracts that are not designated as financial liabilities at fair value through profit
or loss or financial liabilities formed by failing to meet derecognition or continuing
to involve in the transferred financial assets, they are measured at the higher of
the amount of loss provisions and the initial recognition amount after deducting
the accumulated amortisation amount determined in accordance with the relevant
provisions of the revenue standard.
9.4.2 Derecognition of financial liabilities
If all or part of the current obligation of the financial liabilities has been released, the
recognition of the financial liabilities or part thereof shall be terminated. The Group (debtor)
and the creditor enter into an agreement to replace the original financial liabilities with new
financial liabilities, and if the contract terms of the new financial liabilities and the original
financial liabilities are substantially different, the Group derecognises the original financial
liabilities and simultaneously recognises the new financial liabilities.
If the financial liabilities is derecognised in whole or in part, the difference between the
carrying amount of the part to be derecognised and the consideration paid (including the
transferred non-cash assets or the new financial liabilities) shall be recorded into profit or
loss of the current period.
9.4.3 Equity instruments
Equity instruments are contracts that prove ownership of the residual interest in the Group’s
assets after deducting all liabilities. The Group issues (including refinancing), repurchases,
sales or write-offs of equity instruments as changes in equity. The Group does not recognise
changes in the fair value of equity instruments. Transaction costs associated with an equity
transaction are deducted from the equity.
The distribution of equity instruments holders by the Group are treated as profit distribution,
and the stock dividends issued by the Group does not affect the total amount of
shareholders’ equity.
Chapter 10Notes to the Financial Statements
For the six months ended 30 June 2020(Unless otherwise indicated, the unit of amount is RMB)
119INTERIM REPORT 2020
IV. SIGNIFICANT ACCOUNTING POLICIES AND ACCOUNTING ESTIMATES OF THE COMPANY (CONTINUED)
9. Financial Instruments (continued)9.5 Derivative instruments and embedded derivative instruments
Derivative financial instruments include forward foreign exchange contracts, currency exchange
rate swap contracts, interest rate swap contracts and foreign exchange options contracts, etc.
Derivative instruments are initially measured at fair value on the signing date of relevant contracts,
and are subsequently measured at fair value.
For the mixed contracts composed of the embedded derivative instruments and the main
contract, if the main contract belongs to financial assets, the Group does not split the embedded
derivative instruments from the mixed contracts, but applies the accounting standards for the
classification of financial assets as a whole to the mixed contracts.
If the main contract contained in the mixed contracts does not belong to financial assets and
meets the following conditions, the Group will split the embedded derivative instruments from the
mixed instruments and deal it as separate derivative financial instruments.
(1) The embedded derivative instruments are not closely related to the main contract in terms of
economic characteristics and risks;
(2) The separate instruments with the same terms as the embedded derivative instruments
comply with the definition of derivative instruments;
(3) The mixed contracts are not measured at fair value through profit or loss.
Where the embedded derivative instruments are split from the mixed contracts, the Group
shall account for the main contract of the mixed contracts in accordance with the applicable
accounting standards. If the Group is unable to reliably measure the fair value of the embedded
derivative instruments according to the terms and conditions of the embedded derivative
instruments, the fair value of the embedded derivative instruments shall be determined according
to the difference between the fair value of the mixed contracts and the fair value of the main
contract. After using the above method, if the fair value of the embedded derivative instruments
still cannot be measured separately either on the acquisition date or subsequent to the end of the
reporting period, the Group will designate the mixed contracts as financial instruments at fair value
through profit or loss.
Chapter 10Notes to the Financial StatementsFor the six months ended 30 June 2020(Unless otherwise indicated, the unit of amount is RMB)
SINOTRANS LIMITED120
IV. SIGNIFICANT ACCOUNTING POLICIES AND ACCOUNTING ESTIMATES OF THE COMPANY (CONTINUED)
9. Financial Instruments (continued)9.6 Offsetting of financial assets and financial liabilities
When the Group has legal right to offset recognised financial assets and liabilities, and this
legal right is the currently executable, at the same time, while the Group plans to settle or
simultaneously realise the financial assets and liquidate the financial liabilities in the net amount,
the financial assets and financial liabilities are shown in the consolidated statement of financial
position with the amount offset by each other. Except for the above circumstances, financial
assets and financial liabilities are shown separately in the statement of financial position and shall
not be offset against each other.
10. InventoryThe Group’s inventory mainly includes raw materials, finished goods and consumables (packaging, low-
priced consumables, etc.). Inventories are initially measured at cost. The cost of inventories includes
purchase cost, processing cost and other expenses incurred to bring the inventories to their current
location and state.
The weighted average method is adopted to determine the actual cost of the inventory. Consumables
are expensed by immediate write-off.
At the end of the reporting period, inventories are measured at the lower of cost and net realisable
value. When the net realisable value is lower than the cost, a provision is made for decline in value.
Net realisable value represents the estimated selling price for inventories less all estimated costs of
completion and costs necessary to make the sale. The net realisable value of inventories is determined
based on the concrete evidence obtained, taking into account the purpose of holding inventory and the
impact of events after the end of the reporting period.
Provision is considered on a category basis for inventories in large quantity and with relatively low unit
prices and on an individual basis for all other inventories. Provision is considered on a consolidated
basis for inventories in series produced and sold in the same region, same or similar end-use purpose
or which are difficult to be measured separately from other items.
When the circumstances that previously caused inventories to be written down below cost no longer
exist and the net realisable value is higher than the carrying amount, the original amount of the write-
down is reversed and charged to the profit or loss for the current period.
The Group adopts perpetual inventory system as the inventory accounting system.
Chapter 10Notes to the Financial Statements
For the six months ended 30 June 2020(Unless otherwise indicated, the unit of amount is RMB)
121INTERIM REPORT 2020
IV. SIGNIFICANT ACCOUNTING POLICIES AND ACCOUNTING ESTIMATES OF THE COMPANY (CONTINUED)
11. Long-Term Equity Investment11.1 Determine the Basis for Joint Control and Significant Influence on the Invested Entities
Control refers to the investor has the power over the investee, and exposes variable returns by
participating in the relevant activities of the investee, and has the ability to use the power of
the investee to influence the amount of returns. Joint control refers to the joint control over an
arrangement according to relevant agreements, and the related activities of the arrangement can
only be decided after the consensus of the parties sharing the control. Significant influence refers
to the power to participate in the decision-making of the financial and operational policies of the
investee, but cannot control or jointly control the determination of these policies with other parties.
In determining whether it is possible to exercise control over or exert significant influence over the
invested entities, it has taken into account the potential voting right factors such as the current
convertible bonds of the investee unit and the current executable warrants held by the investor
and other parties.
11.2 Determination of Investment Cost
For the long-term equity investment acquired through business combination involving enterprises
under common control, the initial investment cost of the long-term equity investment shall be
the share of the owner’s equity of the acquiree in the carrying amount of the ultimate controlling
party’s consolidated financial statements on the acquisition date. The difference between the
initial investment cost and the carrying amount of cash paid, non-cash assets transferred and
liabilities assumed adjusted to capital reserve. If the balance of capital reserve is not sufficient,
any excess is adjusted to retained earnings. To issue equity securities as the cost of business
combination, the initial investment cost of the long-term equity investment shall be the share of
the owner’s equity of the acquiree in the carrying amount of the final ultimate controlling party’s
consolidated financial statements on the acquisition date, The face value of the total issued shares
are recognised as share capital. The difference between the initial investment cost adjusted to
capital reserve. If the balance of capital reserve is not sufficient, any excess is adjusted to retained
earnings.
As for the long-term equity investment acquired through business combination not involving
enterprises under common control, the initial investment cost of the long-term equity investment
shall be taken as the cost of business combination on the acquisition date.
The intermediary fees such as auditing, legal services, evaluation and consultation and other
related administrative expenses incurred by the acquirer for business combination shall be
recorded into the profits or losses of the current period when incurred.
Chapter 10Notes to the Financial StatementsFor the six months ended 30 June 2020(Unless otherwise indicated, the unit of amount is RMB)
SINOTRANS LIMITED122
IV. SIGNIFICANT ACCOUNTING POLICIES AND ACCOUNTING ESTIMATES OF THE COMPANY (CONTINUED)
11. Long-Term Equity Investment (continued)11.2 Determination of Investment Cost (continued)
The initial measurement of the long-term equity investment obtained by other means other than
the long-term equity investment formed by the business combination shall be measured at initial
cost. When the entity is able to exercise significant influence or joint control (but not control) over
an investee due to additional investment, the cost of long-term equity investments is the sum of
the fair value of previously-held equity investments determined in accordance with Accounting
Standards for Business Enterprises No. 22 – Recognition and Measurement of Financial
Instruments and the additional investment cost.
11.3 Subsequent Measurement and Profit or Loss Recognition Method
11.3.1 Long-term Equity Investment accounted for using the Cost Method
The Company’s financial statements adopt the cost method to calculate the long-term equity
investment in subsidiaries. Subsidiaries refer to invested entities which is controlled by the
Group.
The long-term equity investment accounted for using the cost method is measured at the
initial investment cost. When additional investment is made or the investment is recouped,
the cost of the long-term equity investment is adjusted accordingly. The current investment
income is recognised according to the cash dividend or profit distributions declared by the
invested entity.
11.3.2 Long-term Equity Investment Accounted for Using the Equity Method
In addition to investments in associates and joint ventures classified in whole or in part as
held-for-sale assets, the Group’s investment in associates and joint ventures is accounted
for using the equity method. Associates refer to invested entity to which the Group can exert
a significant influence, and joint venture is a joint venture arrangement in which the Group
has only the right to the net assets of the arrangement.
When adopt equity method accounting, if the initial investment cost of long-term equity
investment is greater than the fair value share of identifiable net assets of the invested entity,
the initial investment cost of long-term equity investment shall not be adjusted; If the initial
investment cost is less than the fair value share of the identifiable net assets of the invested
entity, the difference shall be recorded into the current profit or loss, and the long-term
equity investment cost shall be adjusted accordingly.
Chapter 10Notes to the Financial Statements
For the six months ended 30 June 2020(Unless otherwise indicated, the unit of amount is RMB)
123INTERIM REPORT 2020
IV. SIGNIFICANT ACCOUNTING POLICIES AND ACCOUNTING ESTIMATES OF THE COMPANY (CONTINUED)
11. Long-Term Equity Investment (continued)11.3 Subsequent Measurement and Profit or Loss Recognition Method (continued)
11.3.2 Long-term Equity Investment Calculated Accounted for Using the Equity Method
(continued)
When adopt equity method accounting, the investment income and other comprehensive
income shall be recognised respectively according to the share of net profit or loss and
other comprehensive income of the invested unit. The carrying amount of long-term
equity investment shall be adjusted accordingly. The carrying amount of long-term equity
investment shall be reduced accordingly by calculating the share of the profit distribution
or cash dividend declared by investee. The carrying amount of long-term equity investment
shall be adjusted and included in capital reserve for other changes in the owner’s equity of
investee rather than net or and loss, other comprehensive income and profit distribution.
When recognising the share of the net profit and loss of the investee, the net profit of
investee shall be adjusted and recognised on the basis of the fair value of the identifiable
assets of the invested unit at the acquisition date. If the accounting policies and periods
adopted by the invested unit are inconsistent with those of the Group, the financial
statements of the investee shall be adjusted in accordance with the accounting policies of
the Group and the accounting period of the Group, and the investment income and other
comprehensive income shall be recognised accordingly. Unrealised profit or loss resulting
from the Group’s transactions with its associates and joint ventures are recognised as
investment income or loss to the extent that those attributable to the Group’s equity interest
are eliminated. However, unrealised profit or loss resulting from the Group’s transactions
with its investee which represent impairment losses on the transferred assets are not
eliminated.
When it is recognised that the net loss of the invested unit shall be shared, the carrying
amount of the long-term equity investment and other long-term interests that substantially
constitute the net investment of the invested unit shall be written down to zero. In addition,
if the Group has the obligation to bear additional losses to the investee entity, it shall
recognise the estimated liabilities according to the expected obligations and record them
into the current investment loss. Where net profits are subsequently made by the investee,
the Group resumes recognising its share of those profits only after its share of the profits
exceeds the share of losses previously not recognised.
Chapter 10Notes to the Financial StatementsFor the six months ended 30 June 2020(Unless otherwise indicated, the unit of amount is RMB)
SINOTRANS LIMITED124
IV. SIGNIFICANT ACCOUNTING POLICIES AND ACCOUNTING ESTIMATES OF THE COMPANY (CONTINUED)
11. Long-Term Equity Investment (continued)11.4 Long-term Equity Investment Disposal
At the time of the disposal of long-term equity investment, the difference between its carrying
amount and the actual price obtained shall be recorded into the current profit and loss. For long-
term equity investment accounted for using equity method, the remaining shares after disposal
are still accounted for using the equity method. Other comprehensive income recognised by
equity method is accounted for on the same basis as the assets or liabilities directly disposed
of by the investee, and is carried forward proportionately to the current profit and loss; Owner’s
equity is carried forward proportionately to the current profit and loss. For long-term equity
investments accounted for using the cost method, if the remaining equity after disposal is still
accounted for using the cost method, other comprehensive income recognised due to the use
of the equity method before gaining control over the investee is accounted for on the same basis
as the relevant assets or liabilities directly disposed of by the investee, and is carried forward
proportionately to the current profit and loss; the net assets of the investee recognised due to
the use of the equity method are excluded from the equity method. Changes in net profit or loss,
other comprehensive income and other equity other than profit distributions are carried forward on
a pro rata basis to the current period’s profit or loss.
Where the Group loses control over the investee due to the disposal of part of its equity
investment, when preparing individual financial statements, the remaining equity after disposal can
exercise joint control or exert significant influence on the investee, it shall be accounted for using
the equity method instead, and the residual equity shall be accounted for using the equity method
when it is deemed to be acquired; if the residual equity after disposal cannot exercise joint control
or exert significant influence on the investee, it shall be accounted for according to the relevant
provisions of the financial instruments recognition and measurement standards, and the difference
between its fair value and carrying amount on the date of loss of control shall be included in the
profits and losses of the current period. Other comprehensive income recognised as a result of
the equity method of accounting before the Group acquired control over the investee is accounted
for on the same basis as the assets or liabilities associated with the direct disposal of the investee
when control over the investee is lost. Changes in owner’s equity other than net gains and losses,
other comprehensive income and profit distribution are carried forward to current gains and losses
when the control of the investee is lost. Among them, if the residual equity after disposal is
accounted for by equity method, other comprehensive income and other owners’ equity are
carried forward proportionally; if the residual equity after disposal is accounted for according to
the criteria of recognition and measurement of financial instruments, all other comprehensive
income and other owners’ equity are carried forward.
Chapter 10Notes to the Financial Statements
For the six months ended 30 June 2020(Unless otherwise indicated, the unit of amount is RMB)
125INTERIM REPORT 2020
IV. SIGNIFICANT ACCOUNTING POLICIES AND ACCOUNTING ESTIMATES OF THE COMPANY (CONTINUED)
11. Long-Term Equity Investment (continued)11.4 Long-term Equity Investment Disposal (continued)
If the Group loses joint control or significant influence on the invested entity due to the disposal of
part of its equity investment, the remaining equity after disposal shall be accounted for according
to the criteria of recognition and measurement of financial instruments, and the difference between
the fair value and carrying amount on the date of the loss of joint control or significant impact
shall be included in the profits and losses of the current period. Other comprehensive income
recognised by the original equity method shall be accounted for on the same basis as the assets
or liabilities directly disposed of by the invested entity when the equity method is terminated.
Owner’s equity recognised by the invested party due to the change of owner’s rights and interests
other than net profit and loss, other comprehensive income and profit distribution shall be
terminated when the equity method is terminated. All of them will be transferred to the current
investment income.
The Group disposes of its subsidiary’s equity investment step by step through multiple
transactions until it loses control, if the aforementioned transaction belongs to a package deal, the
transaction shall be treated as a transaction dealing with subsidiary equity investment and losing
control. Before losing control, the difference between the carrying amount of each disposal price
and the long-term equity investment corresponding to the disposal equity shall be recognised as
other comprehensive income for the current period. When losing control, the difference shall be
transferred from other comprehensive income to profit or loss of the same period.
12. Investment PropertiesInvestment properties refer to the properties held by the Group for the purpose of earning rent or
capital appreciation, or both, including leased land use rights, leased buildings, etc.
Investment properties are initially measured at cost. Subsequent expenditures related to investment
properties are included in the cost of investment properties if the economic benefits related to the asset
are likely to flow in and its cost can be measured reliably. Other subsequent expenditures shall be
recorded into the current profits and losses when incurred.
The Group adopts the cost model for the subsequent measurement of investment properties, and
carries out depreciation or amortisation in accordance with the policies consistent with the buildings or
land use rights.
The difference of the disposal income of the sale, transfer, scrap or destruction of the investment
properties after deducting its carrying amount and relevant taxes and fees shall be recorded into the
current profit and loss.
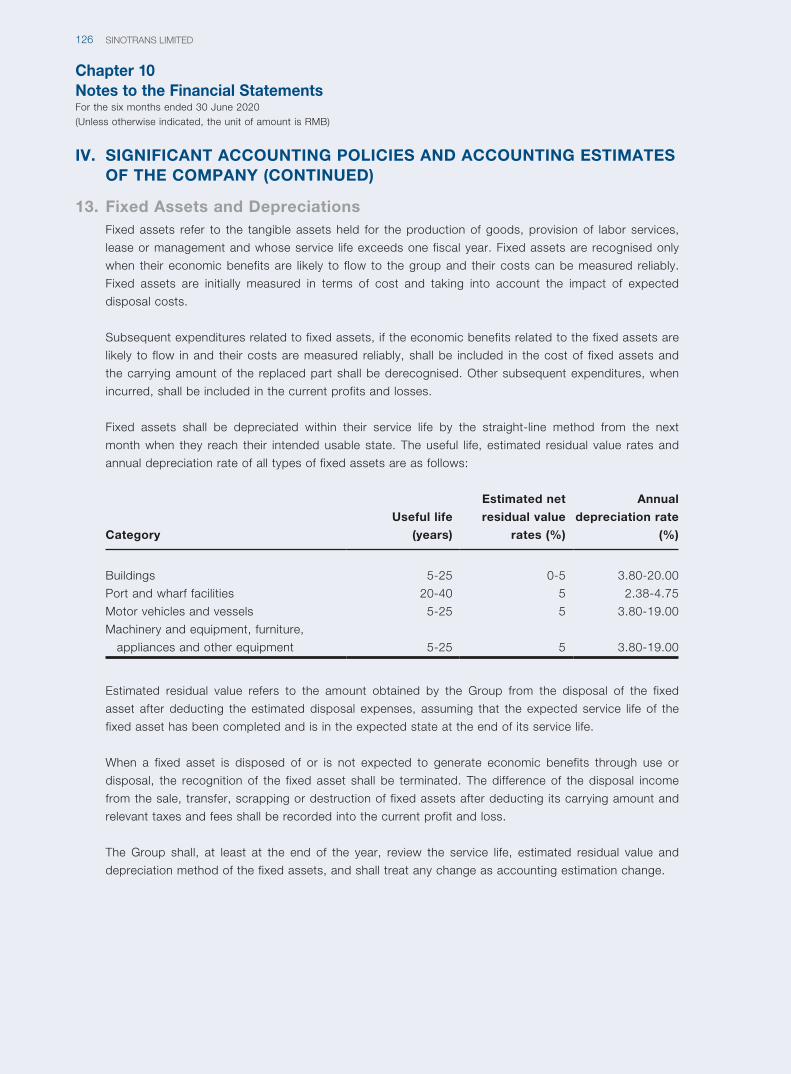
Chapter 10Notes to the Financial StatementsFor the six months ended 30 June 2020(Unless otherwise indicated, the unit of amount is RMB)
SINOTRANS LIMITED126
IV. SIGNIFICANT ACCOUNTING POLICIES AND ACCOUNTING ESTIMATES OF THE COMPANY (CONTINUED)
13. Fixed Assets and DepreciationsFixed assets refer to the tangible assets held for the production of goods, provision of labor services,
lease or management and whose service life exceeds one fiscal year. Fixed assets are recognised only
when their economic benefits are likely to flow to the group and their costs can be measured reliably.
Fixed assets are initially measured in terms of cost and taking into account the impact of expected
disposal costs.
Subsequent expenditures related to fixed assets, if the economic benefits related to the fixed assets are
likely to flow in and their costs are measured reliably, shall be included in the cost of fixed assets and
the carrying amount of the replaced part shall be derecognised. Other subsequent expenditures, when
incurred, shall be included in the current profits and losses.
Fixed assets shall be depreciated within their service life by the straight-line method from the next
month when they reach their intended usable state. The useful life, estimated residual value rates and
annual depreciation rate of all types of fixed assets are as follows:
Category
Useful life
(years)
Estimated net
residual value
rates (%)
Annual
depreciation rate
(%)
Buildings 5-25 0-5 3.80-20.00
Port and wharf facilities 20-40 5 2.38-4.75
Motor vehicles and vessels 5-25 5 3.80-19.00
Machinery and equipment, furniture,
appliances and other equipment 5-25 5 3.80-19.00
Estimated residual value refers to the amount obtained by the Group from the disposal of the fixed
asset after deducting the estimated disposal expenses, assuming that the expected service life of the
fixed asset has been completed and is in the expected state at the end of its service life.
When a fixed asset is disposed of or is not expected to generate economic benefits through use or
disposal, the recognition of the fixed asset shall be terminated. The difference of the disposal income
from the sale, transfer, scrapping or destruction of fixed assets after deducting its carrying amount and
relevant taxes and fees shall be recorded into the current profit and loss.
The Group shall, at least at the end of the year, review the service life, estimated residual value and
depreciation method of the fixed assets, and shall treat any change as accounting estimation change.
Chapter 10Notes to the Financial Statements
For the six months ended 30 June 2020(Unless otherwise indicated, the unit of amount is RMB)
127INTERIM REPORT 2020
IV. SIGNIFICANT ACCOUNTING POLICIES AND ACCOUNTING ESTIMATES OF THE COMPANY (CONTINUED)
14. Construction in ProgressThe construction in process is measured by actual cost, which includes the expenditure incurred during
the construction period, the capitalised borrowing cost before the project reaches its intended usable
state, and other related costs. There is no depreciation in construction. Construction in progress is
transferred to fixed assets when the asset is ready for its intended use.
15. Intangible Assets15.1 Intangible assets
Intangible assets include land use right, software use right, trademark right and so on.
Intangible assets are initially measured at cost. Since the intangible assets with limited service life
are available for use, the original value minus the estimated residual value and the accumulated
amount of impairment reserve are amortised by the straight-line method in phases during their
expected service life. Intangible assets with uncertain service life shall not be amortised.
At the end of the period, the service life and amortisation method of intangible assets with limited
service life shall be reviewed and adjusted if necessary.
15.2 Research and development expenditures
Expenditure at the research stage shall be recorded into current profits and losses when incurred.
Expenditures in the development stage that meet the following conditions at the same time shall
be recognised as intangible assets, and expenditures in the development stage that cannot meet
the following conditions shall be recorded into current profits and losses:
(1) The completion of the intangible asset so that it can be used or sold is technically feasible;
(2) It has the intention to complete the intangible asset and use or sell it;
(3) The ways in which intangible assets generate economic benefits include proving the
existence of a market for the products produced by using the intangible assets or the
existence of a market for the intangible assets themselves;
(4) Having sufficient technical, financial and other resources to support the completion of the
development of the intangible assets, and having the ability to use or sell the intangible
assets;
(5) Expenditure attributable to the development stage of the intangible asset can be measured
reliably.
If it is impossible to distinguish the expenditure in the research stage from the expenditure in the
development stage, all the R&D expenditure incurred shall be recorded into the current profits and
losses.
Chapter 10Notes to the Financial StatementsFor the six months ended 30 June 2020(Unless otherwise indicated, the unit of amount is RMB)
SINOTRANS LIMITED128
IV. SIGNIFICANT ACCOUNTING POLICIES AND ACCOUNTING ESTIMATES OF THE COMPANY (CONTINUED)
16. Long-Term Prepaid ExpensesLong-term prepaid expenses represent expenditures incurred which should be recognised as expenses
over one year and should be allocated in current and subsequent periods. Long-term prepaid expenses
are amortised on the straight-line basis over the estimated beneficial period.
17. Impairment of Non-Financial Assets Other Than GoodwillAt the end of each reporting period, the Group inspects whether there are signs of possible impairment
of long-term equity investments, investment properties, fixed assets, construction in process and
intangible assets with certain service life. If there are any indication that those assets have suffered an
impairment loss, the recoverable amount of the assets is estimated. For intangible assets with uncertain
service life and intangible assets that have not yet reached the usable state, the impairment test shall
be conducted every year regardless of whether there are signs of impairment.
If it is difficult to estimate the recoverable amount of a single asset, the recoverable amount of the asset
group shall be determined on the basis of the asset group to which the asset belongs. The recoverable
amount is the higher of the net amount of the fair value of the asset or group of assets minus the
disposal expenses and the present value of the expected future cash flow.
If the recoverable amount of an asset is less than its carrying amount, the difference between the
amount and the carrying amount of the asset shall be calculated and the asset impairment provision
shall be included in the current profits and losses.
Once the impairment loss of the aforesaid assets is recognised, it is not reversed in subsequent
accounting periods.
18. Estimated LiabilitiesWhen the contingent obligation is the current obligation undertaken by the Group, and the performance
of the obligation is likely to lead to outflow of economic benefits, and the amount of the obligation can
be measured reliably, it is recognised as an estimated liability.
At the end of the reporting period, the estimated liabilities are measured in accordance with the best
estimate of the expenditure required to fulfill the relevant current obligations, taking into account the
risk, uncertainty and time value of money related to contingencies. If the time value of money has a
significant impact, the best estimate is determined by the amount discounted by the expected future
cash outflow.
If all or part of the expenditure required to pay off the estimated liabilities is expected to be
compensated by a third party, the amount of compensation shall be recognised as an asset when it
is basically confirmed that it can be received, and the confirmed amount of compensation shall not
exceed the carrying amount of the estimated liabilities.
Chapter 10Notes to the Financial Statements
For the six months ended 30 June 2020(Unless otherwise indicated, the unit of amount is RMB)
129INTERIM REPORT 2020
IV. SIGNIFICANT ACCOUNTING POLICIES AND ACCOUNTING ESTIMATES OF THE COMPANY (CONTINUED)
19. Employee RemunerationsEmployee remunerations refer to the remuneration or compensation in various forms provided by
the Group for the purpose of obtaining the service provided by the employee or the termination of
labor relations. Employee remunerations include short-term compensation, post-employment benefits,
termination benefits and other long-term employee benefits.
In addition to the compensation for the termination of the labor relationship with the employee, the
Group shall recognise the employee compensation payable as a liability during the accounting period
when the employee provides services.
The Group shall participate in the employee social security system established by government
institutions according to the regulations, including basic endowment insurance, medical insurance,
housing provident fund and other social security systems, and the corresponding expenditure shall be
included in the cost of related assets or current profit and loss when incurred.
Short-term remunerations refer to the compensation that the Group needs to pay to all employees
within 12 months after the end of the annual reporting period for the relevant services provided by
employees, with the exception of post-retirement benefits and termination benefits. Short-term
remuneration includes wages, bonuses, allowances and subsidies, employee benefits, social insurance
premiums such as medical insurance, work injury insurance and maternity insurance, housing fund,
trade union funds and employee education funds, short-term paid absences, short-term profit-sharing
plans, non-monetary benefits and other short-term remuneration. During the accounting period when
the employees provide services, the Group shall recognise the short-term remuneration payable as a
liability and record it into the cost or expense of related assets according to the beneficiaries of the
services provided by the employees.
Post-employment benefit refers to the various forms of remuneration and welfare provided by the Group
after the employee retires or dissolves labor relations with the enterprise in order to obtain the services
provided by the employee, with the exception of short-term remuneration and termination benefits.
Post-employment benefits include endowment insurance, annuity, unemployment insurance, internal
retirement benefits and other post-employment benefits.
The Group classifies post-employment benefit plans into defined contribution plans and defined benefit
plans. Post-employment benefit plan refers to the agreement reached between the Group and the
employee on the post-employment benefit, or the regulations or measures formulated by the Group
for the provision of post-employment benefit are to the employee. Where, a defined contribution plans
is a post-employment benefit plan in which the Group no longer undertakes the further payment
obligation after the fixed fee is deposited into the independent fund; Defined benefit plans refer to post-
employment benefit plans other than defined contribution plans. During the accounting period when
the employee provides services for the Group, the amount due for deposit calculated according to the
defined escrow plan shall be recognised as a liability and recorded into the current profit and loss or the
cost of related assets.
Chapter 10Notes to the Financial StatementsFor the six months ended 30 June 2020(Unless otherwise indicated, the unit of amount is RMB)
SINOTRANS LIMITED130
IV. SIGNIFICANT ACCOUNTING POLICIES AND ACCOUNTING ESTIMATES OF THE COMPANY (CONTINUED)
19. Employee Remunerations (continued)The Group provides early retirement benefits to employees who accept internal retirement
arrangements. Early retirement benefits is to point to did not reach the emeritus age that the country
sets via approving the worker that withdraws job post of one’s own accord the salary that pays and
the society insurance premium that are its pay. For early retirement benefits, if the conditions related to
the recognition of internal retirement benefits are met, the internal retirement benefits to be paid by the
Group during the period when the employee stops providing the service solstice normally retires will be
recognised as liabilities according to the present value and recorded into the profits and losses of the
current period
Termination benefits means that the Group terminates the labor relationship with the employee before
the expiration of the employee’s labor contract or compensates the employee to encourage the
employee to voluntarily accept the reduction. Where the Group provides termination benefits to the
employee, the liability arising from the termination benefits shall be recognised at an early date and
recorded into the current profit or loss if: (1) the Group cannot unilaterally withdraw the termination
benefits provided by the termination plan or reduction proposal. (2) when the Group confirms the costs
or expenses related to the restructuring related to the payment of dismiss benefits
Other long-term employee benefits refer to all employee remunerations except short-term
compensation, post-employment benefit and termination benefits
20. Share-Based PaymentsThe Group’s share-based payments are transactions that grant equity instruments in order to obtain
services from employees or other parties. The Group’s share-based payments are equity-settled share-
based payments.
For equity-settled share-based payments made in exchange for services rendered by employees, the
Group measures the fair value of the equity instruments granted to employees at the date of grant. The
amount of this fair value is measured on a straight-line basis over the waiting period based on the best
estimate of the number of viable equity instruments, with the related cost or expense charged on a
straight-line basis, or on the date of grant when the rights become viable immediately after grant, with a
corresponding increase in other equity instruments.
21. Bonds PayableThe initial recognition of the bonds payable of the Group shall be measured at the fair value, and the
relevant transaction expenses shall be included in the initial recognition amount. Bonds payable is
measured at amortised cost subsequently.
The difference between the issue price of the bonds and the total face value of the bonds shall be
regarded as the bond premium or discount, which shall be amortised at the time of interest withdrawal
according to the effective interest rate method within the duration of the bonds, and shall be handled
according to the principle of borrowing costs.
Chapter 10Notes to the Financial Statements
For the six months ended 30 June 2020(Unless otherwise indicated, the unit of amount is RMB)
131INTERIM REPORT 2020
IV. SIGNIFICANT ACCOUNTING POLICIES AND ACCOUNTING ESTIMATES OF THE COMPANY (CONTINUED)
22. Revenue RecognitionThe Group recognises revenue at the transaction price apportioned to the performance obligation in the
contract when it is satisfied, i.e. when the customer acquires control of the relevant goods or services.
A performance obligation is a contractual commitment by the Group to transfer clearly distinguishable
goods or services to the customer. The transaction price is the amount of consideration that the Group
expects to be entitled to receive as a result of the transfer of goods or services to the customer, but
excluding amounts collected on behalf of third parties and amounts that the Group expects to be
returned to the customer.
A performance obligation is a performance obligation that is performed over a period of time, and the
Group recognises revenue over a period of time in accordance with the progress of the performance,
when one of the following conditions is met: (I) the customer acquires and consumes the economic
benefits from the Group’s performance as the Group performs; (II) the customer is able to control the
goods under construction in the Group’s performance; (III) the goods or services produced by the
Group’s performance are irreplaceable, and the Group is entitled to receive payment for the portion
of the performance that has been accumulated to date throughout the contract period. Otherwise, the
Group recognises revenue at the point at which the customer acquires control of the relevant goods or
services.
The Group uses the input method to determine the progress of performance, i.e., it determines the
progress of performance based on the Group’s inputs to meet its performance obligations. When the
progress of performance is not reasonably determinable and the costs incurred are expected to be
recovered, the Group recognises revenue at the amount of the costs incurred until the progress of
performance is reasonably determinable.
A contract asset is a right to receive consideration for goods or services that the Group has transferred
to a customer and that is dependent on factors other than the passage of time. For the accounting
policy regarding contract asset impairment, please refer to Note IV. 9 for details. The Group’s
unconditional (that is, time-dependent)right to collect considerations from customers are presented
separately as receivables.
A contract liability is an obligation to transfer goods or services to a customer for consideration received
or receivable by the Group from the customer.
Contract assets and contract liabilities under the same contract are shown on a net basis.
Chapter 10Notes to the Financial StatementsFor the six months ended 30 June 2020(Unless otherwise indicated, the unit of amount is RMB)
SINOTRANS LIMITED132
IV. SIGNIFICANT ACCOUNTING POLICIES AND ACCOUNTING ESTIMATES OF THE COMPANY (CONTINUED)
22. Revenue Recognition (continued)Where a contract contains two or more performance obligations, the Group allocates the transaction
price to each individual performance obligation in proportion to the relative proportions of the individual
sale price of the goods or services committed to by each individual performance obligation at the
commencement date of the contract. However, where there is conclusive evidence that the contractual
discount or variable consideration relates to only one or more (but not all) of the performance
obligations in the contract, the Group apportions the contractual discount or variable consideration to
the relevant one or more performance obligations. The individual selling price is the price at which the
Group sells goods or services to a customer individually. Where individual selling prices are not directly
observable, the Group estimates the individual selling price, taking into account all relevant information
that is reasonably available and using observable inputs to the maximum extent possible.
Where there is variable consideration in a contract, the Group determines the best estimate of the
variable consideration based on expectations or the most likely amount to occur. The transaction
price that includes variable consideration does not exceed the amount by which it is highly unlikely
that there will be a material reversal of the cumulative recognised revenue at the time the related
uncertainty is eliminated. At each balance sheet date, the Group re-estimates the amount of the
variable consideration that should be included in the transaction price.
Where the customer pays non-cash consideration, the Group determines the transaction price by
reference to the fair value of the non-cash consideration. If the fair value of the non-cash consideration
cannot be reasonably estimated, the Group determines the transaction price indirectly by reference to
the separate selling price of the goods or services that the Group promises to transfer to the customer.
Where there is consideration payable to a customer under a contract, unless the consideration is
to obtain other clearly distinguishable goods or services from the customer, the Group offsets the
consideration payable against the transaction price and reduces current revenue at the later of the point
at which the related revenue is recognised and the customer consideration is paid (or promised to be
paid).
For sales with a quality assurance clause, the quality assurance constitutes a single performance
obligation if it provides a separate service in addition to the assurance to the customer that the
goods or services sold comply with established standards. Otherwise, the Group accounts for the
quality assurance obligation in accordance with the provisions of Accounting Standards for Business
Enterprises No.13 – Contingencies.
Where there is a significant financing element in a contract, the Group determines the transaction price
based on the amount that would be payable in cash assuming that the customer paid for the goods or
services at the time it acquired control. The difference between this transaction price and the contract
consideration is amortised over the term of the contract using the effective interest method. Significant
financing elements of the contract are not taken into account when the Group expects that the interval
between the customer’s acquisition of control of the goods or services and the customer’s payment of
the price will not exceed one year at the contract start date.
Chapter 10Notes to the Financial Statements
For the six months ended 30 June 2020(Unless otherwise indicated, the unit of amount is RMB)
133INTERIM REPORT 2020
IV. SIGNIFICANT ACCOUNTING POLICIES AND ACCOUNTING ESTIMATES OF THE COMPANY (CONTINUED)
22. Revenue Recognition (continued)The Group determines whether it is the principal obligor or agent at the time of the transaction based
on whether it has control over the goods or services prior to the transfer of the goods or services to the
customer. If the Group has control over the goods or services before transferring them to the customer,
the Group is the principal obligor and recognises revenue based on the total consideration received
or receivable; otherwise, the Group is the agent and recognises revenue based on the amount of
commission or fee to which it is expected to be entitled, which is net of the total consideration received
or receivable, less the price payable to other related parties, or based on the established commission
Amount or percentage, etc. determined.
When the Group receives advance payments from customers for the sale of goods or services, it first
recognises the payments as a liability and then converts them to revenue when the related performance
obligations are fulfilled. When the Group’s advance receipts are not required to be returned and it
is probable that the customer will waive all or part of its contractual rights, the Group recognises
the above amount as revenue ratably in accordance with the pattern of the customer’s exercise of
contractual rights, if the Group expects to be entitled to the amount related to the contractual rights
waived by the customer; otherwise, the Group transfers the relevant balance of the above liability only
when it is highly unlikely that the customer will demand performance of the remaining performance
obligation to Income.
The Group’s specific operating revenue recognition principles are as follows:
Revenue from forwarding and related businesses: the realization of revenue in the Group’s forwarding
and related businesses for originating businesses is recognised on the date of departure of the vessel/
aircraft departure/loading of the cargo; and for destination businesses, the realization of revenue is
recognised on the date of delivery of the cargo to the agreed delivery point;
Logistics e-commerce business income, the group’s business to provide clients with Logistics
e-commerce point to point transport service, customers in the performance of the group at the same
time also obtain and consume the performance brought by the economic interests of the group, due
to the group to provide Logistics and electronic business service in an accounting period usually finish
in a short time period, across the accounting period to provide service to this group is not significant,
therefore, the group of the above services in complete point to confirm the implementation of income.
The cost of obtaining a contract
An asset is recognised when the Group expects to recover the incremental costs incurred to obtain the
contract (i.e., costs that would not have been incurred but for the contract). If the asset is amortised
over a period of less than one year, it is charged to profit or loss as incurred. Other expenses incurred
by the Group to acquire a contract are charged to profit or loss when incurred, except when clearly
borne by the customer.
Chapter 10Notes to the Financial StatementsFor the six months ended 30 June 2020(Unless otherwise indicated, the unit of amount is RMB)
SINOTRANS LIMITED134
IV. SIGNIFICANT ACCOUNTING POLICIES AND ACCOUNTING ESTIMATES OF THE COMPANY (CONTINUED)
22. Revenue Recognition (continued)The cost of fulfilling a contract
Costs incurred by the Group to perform a contract, which are outside the scope of other corporate
accounting standards other than the revenue standard, are recognised as an asset when the following
conditions are met: (1) the cost is directly related to a current or expected contract; (2) the cost
increases the Group’s future resources available to meet its performance obligations; and (3) the cost is
expected to be recoverable. These assets are amortised using the same basis as revenue recognition
for the goods or services to which the asset relates, and are recognised in profit or loss for the period.
23. Government GrantsGovernment grants are monetary and non-monetary assets that the Group acquires from governments
at no cost to the Group. Government grants are recognised when the conditions attached to the grant
can be met and the grant can be received.
Where the government grant is a monetary asset, it is measured at the amount received or receivable.
Where government grants are non-monetary assets, they are measured at fair value; where fair value
cannot be obtained reliably, they are measured at nominal amounts. Government grants measured at
nominal amounts are directly recognised in profit or loss for the period.
Government grants relating to assets should be recognised as deferred income and charged to profit
or loss over the useful life of the related assets in a reasonable and systematic manner. Government
grants measured at nominal amounts are directly recognised in profit or loss for the current period.
If the relevant asset is sold, transferred, scrapped or destroyed before the end of its useful life, the
undistributed balance of the relevant deferred income should be transferred to the profit or loss of the
period in which the asset is disposed of.
Revenue-related government grants, which are used to compensate the Group for related costs or
losses in future periods, are recognised as deferred income and charged to profit or loss in the period
in which the related costs or losses are recognised; those used to compensate the Group for related
costs or losses already incurred are charged directly to profit or loss in the current period.
For government grants that contain both asset-related parts and revenue-related parts, the different
parts should be distinguished for separate accounting treatment; if it is difficult to distinguish, the whole
should be classified as revenue-related government grants.
Government grants related to the Group’s daily activities should be included in other income in
accordance with the substance of economic operations. Government grants not related to the Group’s
daily activities should be included in non-operating income and expenditure.
Chapter 10Notes to the Financial Statements
For the six months ended 30 June 2020(Unless otherwise indicated, the unit of amount is RMB)
135INTERIM REPORT 2020
IV. SIGNIFICANT ACCOUNTING POLICIES AND ACCOUNTING ESTIMATES OF THE COMPANY (CONTINUED)
24. Borrowing CostsThe capitalization of borrowing costs directly attributable to the acquisition or production of a
capitalization-eligible asset begins when expenditures for the asset have been incurred, borrowing
costs have been incurred, and the acquisition or production activities necessary to bring the asset to
its intended useable or marketable condition have commenced; the capitalization of a capitalization-
eligible asset constructed or produced to its intended useable or marketable condition ceases when
the asset is constructed or produced. If an abnormal interruption in the acquisition or production of a
capitalization-eligible asset occurs and the interruption lasts for more than three consecutive months,
the capitalization of borrowing costs is suspended until the acquisition or production of the asset is
restarted.
The remaining borrowing costs are recognised as an expense in the period in which they are incurred.
The amount of interest expenses actually incurred during the period of special borrowing, less the
interest income earned by depositing unused borrowed funds with banks or investment income earned
by making temporary investments, is capitalized; the amount of capitalization for general borrowing
is determined by multiplying the weighted average of the cumulative asset expenses in excess of the
portion of special borrowing by the capitalization rate of the general borrowing used. The capitalization
rate is determined based on the calculation of the weighted average interest rate on the general
borrowings. During the capitalization period, all exchange differences on foreign-currency specialized
borrowings are capitalized; exchange differences on foreign-currency general borrowings are recorded
in profit or loss for the current period.
25. Income TaxesIncome tax expense consists of current income taxes and deferred income taxes.
25.1 Current income tax
At the date of the statement of financial position, for current income tax liabilities (or assets)
arising from current and prior periods, the amount of income tax expected to be paid (or refunded)
is measured at the amount calculated in accordance with the tax laws.
Chapter 10Notes to the Financial StatementsFor the six months ended 30 June 2020(Unless otherwise indicated, the unit of amount is RMB)
SINOTRANS LIMITED136
IV. SIGNIFICANT ACCOUNTING POLICIES AND ACCOUNTING ESTIMATES OF THE COMPANY (CONTINUED)
25. Income Taxes (continued)25.2 Deferred tax assets and deferred tax liabilities
Deferred tax assets and deferred tax liabilities are recognised using the balance sheet liability
method for temporary differences arising from differences between the carrying amount of certain
items of assets and liabilities and their tax bases, and for temporary differences arising from
differences between the carrying amount and tax bases of items that are not recognised as assets
and liabilities but whose tax bases can be determined in accordance with the provisions of the tax
laws.
Generally all temporary differences are recognised for related deferred income tax purposes.
However, for deductible temporary differences, the Group recognises a related deferred tax asset
to the extent that it is more likely than not that the Group will be able to realize the taxable
income used to offset the deductible temporary differences. In addition, related deferred tax
assets or liabilities are not recognised for temporary differences that relate to the initial recognition
of goodwill and to the initial recognition of assets or liabilities arising from transactions that are
neither business combinations nor, when they occur, affect accounting profit and taxable income
(or deductible losses).
A corresponding deferred tax asset is recognised to the extent that it is probable that future
taxable income will be available against which the deductible losses and tax credits can be carried
forward to future years.
The Group recognises deferred tax liabilities arising from taxable temporary differences related
to investments in subsidiaries, associates and joint ventures, unless the Group is able to control
the timing of the reversal of the temporary difference and it is probable that the temporary
difference will not reverse in the foreseeable future. For deductible temporary differences related
to investments in subsidiaries, associates and joint ventures, the Group recognises a deferred
tax asset only when it is probable that the temporary difference will reverse in the foreseeable
future and it is probable that future taxable income will be available against which the deductible
temporary difference can be utilized.
At the date of the statement of financial position, deferred tax assets and deferred tax liabilities
are measured at the tax rates that are expected to apply in the period in which the related asset is
recovered or the related liability is settled, in accordance with the provisions of the tax laws.
Current income taxes and deferred income taxes are recorded in other comprehensive income
or equity, except for current income taxes and deferred income taxes related to transactions
and events directly in other comprehensive income or equity, and the carrying value of deferred
income tax adjusted goodwill resulting from business combinations, in which the remaining current
income tax and deferred income tax expense or gain is recorded in current profit or loss.
Chapter 10Notes to the Financial Statements
For the six months ended 30 June 2020(Unless otherwise indicated, the unit of amount is RMB)
137INTERIM REPORT 2020
IV. SIGNIFICANT ACCOUNTING POLICIES AND ACCOUNTING ESTIMATES OF THE COMPANY (CONTINUED)
25. Income Taxes (continued)25.2 Deferred tax assets and deferred tax liabilities (continued)
At the date of the statement of financial position, the carrying amount of deferred tax assets is
reviewed and the carrying amount of deferred tax assets is written down to the extent that it is
more likely than not that sufficient taxable income will not be available in the future to offset the
benefit of the deferred tax assets. To the extent that it is probable that sufficient taxable income
will be available, the amount of the write-down is reversed.
25.3 Offset of deferred tax assets and deferred tax liabilities
The Group’s deferred tax assets and deferred tax liabilities are presented net of offset when there
is a legally enforceable right to settle current income tax assets and current income tax liabilities
on a net basis and the deferred tax assets and liabilities relate to income taxes levied by the same
taxation authority on the same taxable entity or on different taxable entities, provided that, in
each future period in which significant deferred tax assets and liabilities reverse, the taxable entity
involved intends to settle current income tax assets and liabilities on a net basis, or to acquire the
assets and settle the liabilities simultaneously.
26. Foreign Currency Operations and Translation of Foreign Currency Statements26.1 Foreign currency operations
Foreign currency transactions are translated at initial recognition using the spot exchange rate at
the date of the transaction.
At the date of the statement of financial position, monetary items denominated in foreign
currencies are translated into the local currency of record using the spot exchange rate at that
date, and exchange differences resulting from differences between the spot exchange rate at
that date and the spot exchange rate at initial recognition or at the previous balance sheet date,
except: (1) exchange differences on foreign currency specific borrowings eligible for capitalization
are capitalized to the cost of the related assets during the capitalization period; (2) exchange
differences on foreign currency specific borrowings for the purpose of hedging foreign currency
risk are capitalized to the cost of the related assets; (3) exchange differences on foreign currency
specific borrowings for the purpose of hedging foreign currency risk are capitalized to the cost of
the related assets during the capitalization period. Exchange differences on hedging instruments
that are hedged are accounted for under the hedge accounting method; (3) exchange differences
on monetary items classified as fair value through other comprehensive income, other than those
arising from changes in carrying amount other than amortised cost, are recognised in other
comprehensive income.
Chapter 10Notes to the Financial StatementsFor the six months ended 30 June 2020(Unless otherwise indicated, the unit of amount is RMB)
SINOTRANS LIMITED138
IV. SIGNIFICANT ACCOUNTING POLICIES AND ACCOUNTING ESTIMATES OF THE COMPANY (CONTINUED)
26. Foreign Currency Operations and Translation of Foreign Currency Statements (continued)26.1 Foreign currency operations (continued)
If the preparation of the consolidated financial statements involves foreign operations, and if
there are foreign currency monetary items that substantially constitute a net investment in foreign
operations, exchange differences resulting from changes in exchange rates are included in
“Translation difference of the financial statements in foreign currency” in other comprehensive
income; when foreign operations are disposed of, they are included in profit or loss for the period
of disposal.
Foreign currency non-monetary items measured at historical cost continue to be measured at
the recorded local currency amount discounted at the spot exchange rate at the date of the
transaction. Non-monetary items in foreign currencies measured at fair value are translated using
the spot exchange rate at the date the fair value is determined, and the difference between the
recorded local currency amount after translation and the original recorded local currency amount
is treated as a change in fair value (including exchange rate changes) and recognised in profit or
loss or in other comprehensive income.
26.2 Translation of foreign currency financial statements
For the purpose of preparing consolidated financial statements, foreign currency financial
statements of foreign operations are translated into RMB as follows: all assets and liability items in
the balance sheet are translated at the spot exchange rate at the date of the statement of financial
position; equity items are translated at the spot exchange rate at the time of occurrence; all items
in the income statement and items reflecting the occurrence of profit distribution are translated
at the approximate exchange rate at the spot exchange rate at the date of the transaction; the
difference between the translated asset items and the sum of liability items and equity items is
recognised as other comprehensive income and included in equity.
Cash flows in foreign currencies and the cash flows of foreign subsidiaries are translated using
the approximate exchange rate of the spot rate at the date of the cash flows, and the effect
of exchange rate changes on cash and cash equivalents is shown as a reconciling item in the
statement of cash flows as “Effect of exchange rate changes on cash and cash equivalents”.
The opening and prior-period actual amount are shown on the basis of amounts translated from
the prior-period financial statements.
Upon the disposal of the Group’s entire owner’s equity in a foreign operation or the loss of
control over the foreign operation due to the disposal of a portion of the equity investment or
otherwise, the translation difference of the financial statements in foreign currency shown in the
other comprehensive income line item in the balance sheet that are attributable to the owners’
equity of the parent company related to that foreign operation are transferred in full to the current
profit or loss on disposal.
Chapter 10Notes to the Financial Statements
For the six months ended 30 June 2020(Unless otherwise indicated, the unit of amount is RMB)
139INTERIM REPORT 2020
IV. SIGNIFICANT ACCOUNTING POLICIES AND ACCOUNTING ESTIMATES OF THE COMPANY (CONTINUED)
26. Foreign Currency Operations and Translation of Foreign Currency Statements (continued)26.2 Translation of foreign currency financial statements (continued)
In the event of the disposal of a portion of an equity investment or other reasons resulting in a
reduction in the proportion of equity interest held in a foreign operation without loss of control
over the foreign operation, the foreign currency statement translation differences related to the
disposal portion of the foreign operation will be attributed to minority interests and will not be
transferred to the profit or loss of the current period. When the foreign operation is disposed of
as part of an associate or joint venture, the foreign currency translation differences related to the
foreign operation are transferred to the profit and loss of the period in which the foreign operation
is disposed of in proportion to the disposal of the foreign operation.
27. LeasesA lease is a contract in which the lessor gives the right to use an asset to the lessee for a certain period
of time in return for consideration.
For contracts entered into or varied after the date of first performance, the Group assesses whether the
contract is a lease or contains a lease at the date of commencement or variation of the contract. The
Group does not re-evaluate whether a contract is a lease or an included lease unless the terms and
conditions of the contract have changed.
27.1 The Group as lessee
27.1.1 Separating components of leases
Where the contract contains one or more lease and non-lease components, the Group splits
each separate lease and non-lease component and apportions the contract consideration
in relative proportions to the sum of the separate prices of each lease component and the
separate prices of the non-lease components.
For practical purposes, the Group accounts for leases with similar characteristics as a
portfolio if the Group can reasonably be expected not to have a significantly different impact
on the financial statements than if each individual lease in the portfolio were accounted for
separately.
Chapter 10Notes to the Financial StatementsFor the six months ended 30 June 2020(Unless otherwise indicated, the unit of amount is RMB)
SINOTRANS LIMITED140
IV. SIGNIFICANT ACCOUNTING POLICIES AND ACCOUNTING ESTIMATES OF THE COMPANY (CONTINUED)
27. Leases (continued)27.1 The Group as lessee (continued)
27.1.2 Right-of-use asset
With the exception of short-term leases and leases of low-value assets, the Group
recognises a right-of-use asset for leases at the lease term start date. The lease term start
date is the date on which the lessor makes the leased asset available for use by the Group.
Right-of-use assets are initially measured at cost. This cost comprises:
• The initial measurement of the lease liability.
• Lease payments made on or before the start date of the lease term, where a lease
incentive exists, are reduced by the amount associated with the lease incentive already
enjoyed.
• Initial direct costs incurred by the Group.
• The Group expects to incur costs to dismantle and remove the leased asset,
rehabilitate the site where the leased asset is located or restore the leased asset to the
condition agreed under the terms of the lease.
When a remeasurement of the lease liability occurs after the lease term begins, the carrying
value of the right-of-use asset is adjusted accordingly.
Where the Group is able to obtain ownership of a leased asset with reasonable certainty at
the end of the lease term, the right-to-use asset is depreciated over the remaining useful
life of the leased asset. Where it is not reasonably certain that ownership of a leased asset
can be obtained at the end of the lease term, depreciation is charged over the shorter of the
lease term and the remaining useful life of the leased asset.
The Group determines whether a right-of-use asset is impaired in accordance with the
relevant provisions of “Accounting Standard for Business Enterprises No. 8 – Impairment of
Assets” and makes accounting treatment.
27.1.3 Refundable rental deposits
Refundable lease deposits paid by the Group are accounted for in accordance with
“Accounting Standard for Business Enterprises 22 – Recognition and Measurement of
Financial Instruments” and are measured at fair value on initial recognition. The difference
between the fair value and the notional amount at initial recognition is treated as an
additional lease payment and included in the cost of the right-of-use asset.
Chapter 10Notes to the Financial Statements
For the six months ended 30 June 2020(Unless otherwise indicated, the unit of amount is RMB)
141INTERIM REPORT 2020
IV. SIGNIFICANT ACCOUNTING POLICIES AND ACCOUNTING ESTIMATES OF THE COMPANY (CONTINUED)
27. Leases (continued)27.1 The Group as lessee (continued)
27.1.4 Lease liability
Except for short-term leases and leases of low-value assets, the Group initially measures
the lease liability at the beginning of the lease term based on the present value of the lease
payments outstanding at that date. In calculating the present value of the lease payments,
the Group uses the intrinsic lease rate as the discount rate and, where the intrinsic lease rate
cannot be determined, the incremental borrowing rate as the discount rate.
Lease payments are payments made by the Group to the lessor relating to the right to use
the leased asset over the lease term and Including:
• Fixed payments and substantive fixed payments, net of lease incentives, if there are
lease incentives related amounts.
• Variable lease payments that depend on an index or rate.
• The Group reasonably determines the exercise price of the purchase options to be
exercised.
• The lease term reflects the payments required to exercise the lease termination option
where the Group will exercise the lease termination option.
• Expected payments based on the residual value of guarantees provided by the Group.
Variable lease payments that are index- or rate-dependent are determined at initial
measurement based on an index or ratio at the lease term commencement date. Variable
lease payments that are not included in the measurement of lease liabilities are recognised
in profit or loss when they are actually made. The provisions of other standards, such as
“Accounting Standard for Business Enterprises No. 1 – Inventories”, are followed if they are
included in the cost of the related assets.
After the start date of the lease term, the Group calculates the interest expense of the
lease liability for each period during the lease term at a fixed periodic interest rate. If
the cost of the relevant assets is included in accordance with other standards, such as
“Accounting Standard for Business Enterprises No. 17 – Borrowing Costs”, it is subject to
their provisions.
Chapter 10Notes to the Financial StatementsFor the six months ended 30 June 2020(Unless otherwise indicated, the unit of amount is RMB)
SINOTRANS LIMITED142
IV. SIGNIFICANT ACCOUNTING POLICIES AND ACCOUNTING ESTIMATES OF THE COMPANY (CONTINUED)
27. Leases (continued)27.1 The Group as lessee (continued)
27.1.4 Lease liability (continued)
After the lease term begins, the Group remeasures the lease liability and adjusts the
corresponding right-of-use asset if any of the following occurs:
• In the event of a change in the lease term or a change in the valuation of a purchase
option, the Group remeasures the lease liability at the present value of the lease
payments after the change and at a revised discount rate.
• Where there is a change in the amount expected to be payable based on the remaining
value of the guarantee or in the index or ratio used to determine lease payments,
the Group remeasures the lease liability to the present value of the changed lease
payments and the original discount rate. Where changes in lease payments result from
changes in floating interest rates, the revised discount rate is used.
27.1.5 Short-term leases and leases of low-value assets
The Group elects not to recognize right-of-use assets and lease liabilities for short-term
leases of business premises or transportation vehicles, as well as leases of low-value assets.
Short-term leases are leases with a lease term of less than 12 months at the commencement
date of the lease term and do not include purchase options. Low value asset leases are
leases where the value of a single leased asset does not exceed RMB50,000 when the asset
is brand new. The Group recognises the lease payments for short-term leases and low-value
asset leases in profit or loss or the cost of the related assets in each period of the lease term
on a straight-line basis or by other systematic and reasonable methods.
27.1.6 Lease modification
The Group has chosen to adopt a simplified method for rent reductions, deferred payments
and other rent concessions agreed between the Group as lessee and lessor on existing
lease contracts that are directly caused by the new coronary pneumonia epidemic and that
meet the “Accounting Treatment of Rent Concessions Related to the COVID-19 Epidemic”
(Cai Kuai [2020] No. 10 issued by the Ministry of Finance, and does not assess whether a
lease change has occurred or reassess the lease classification. Beyond that:
When a lease change occurs and the following conditions are also met, the Group accounts
for the lease change as a separate lease:
• The lease change expands the scope of the lease by adding the right to use one or
more of the leased assets.
• The increased consideration is equal to the separate price of the expanded portion of
the lease, adjusted for that contract.
Chapter 10Notes to the Financial Statements
For the six months ended 30 June 2020(Unless otherwise indicated, the unit of amount is RMB)
143INTERIM REPORT 2020
IV. SIGNIFICANT ACCOUNTING POLICIES AND ACCOUNTING ESTIMATES OF THE COMPANY (CONTINUED)
27. Leases (continued)27.1 The Group as lessee (continued)
27.1.6 Lease modification (continued)
If the lease change is not accounted for as a separate lease, at the effective date
of the lease change, the Group reassesses the consideration for the changed contract,
redetermines the lease term and remeasures the lease liability at the present value of the
changed lease payments and the revised discount rate.
27.2 The Group as lessor
The Group recognises lease payments under operating leases as rental income on a straight-line
basis from period to period over the term of the lease, unless another systematic and rational
method better reflects the pattern of depletion of economic benefits arising from the use of the
leased asset. Initial direct costs incurred by the lessor in connection with operating leases are
capitalized and amortised over the lease term on the same basis as rental revenue recognition,
and are recognised in profit or loss over the period.
27.2.1 Separating components of leases
Where the contract contains both leased and non-leased components, the Group
apportioned the contract consideration in accordance with the provisions of Accounting
Standard for Business Enterprises 14 – Revenue on transaction price apportionment, based
on the separate prices of each of the leased and non-leased components.
27.2.2 Refundable lease deposits
Refundable lease deposits received by the Group are accounted for in accordance with
”Accounting Standard for Business Enterprises 22 – Recognition and Measurement of
Financial Instruments” and are measured at fair value on initial recognition. The difference
between the fair value and the notional amount at initial recognition is considered to be the
additional lease receivable paid by the lessee.
27.2.3 Classification of leases
A lease that transfers substantially all the risks and rewards of ownership of the leased asset
is a finance lease. Leases other than finance leases are operating leases.
Chapter 10Notes to the Financial StatementsFor the six months ended 30 June 2020(Unless otherwise indicated, the unit of amount is RMB)
SINOTRANS LIMITED144
IV. SIGNIFICANT ACCOUNTING POLICIES AND ACCOUNTING ESTIMATES OF THE COMPANY (CONTINUED)
27. Leases (continued)27.2 The Group as lessor (continued)
27.2.4 The Group records operating lease business as lessor
At various periods during the lease term, the Group recognises lease payments for operating
leases as rental income using the straight-line method or other systematic and reasonable
method. Initial direct costs incurred by the Group in connection with operating leases are
capitalized as incurred and are amortised over the term of the lease on the same basis as
rental revenue recognition and charged to profit or loss in the current period.
Variable lease receipts acquired by the Group in connection with operating leases that are
not included in lease receipts are charged to profit or loss in the period in which they are
incurred.
27.2.5 The Group records financial leasing operations as lessor
At the start of the lease term, the Group records the net lease investment as the value of
the finance lease receivables and derecognises the finance lease asset. The net investment
in leases is the sum of the unguaranteed residual value and the present value of the lease
receivables not yet received at the start of the lease term, discounted at the intrinsic lease
rate.
Lease receipts, which represent amounts receivable by the Group from lessees in connection
with the assignment of the right to use a leased asset during the lease term, Including:
• The amount of the fixed payments to be paid by the lessee and the amount of the
substantive fixed payments, less the amount related to the lease incentive, if there is a
lease incentive.
• Variable lease payments that depend on an index or rate.
• The exercise price of the purchase option, provided that it is reasonably certain that the
lessee will exercise the option.
• Payments required to be made by a lessee exercising a lease termination option,
provided that the lease term reflects that the lessee will exercise the lease termination
option.
• The residual value of the guarantee provided to the Group by the lessee, a party related
to the lessee and an independent third party with the financial ability to meet the
guarantee obligations.
• Variable lease receivables that are index- or rate-dependent are determined at initial
measurement based on an index or ratio at the lease term commencement date.
• Variable lease receipts that are not included in the net lease investment measurement
are charged to profit or loss in the period in which they occur.
Chapter 10Notes to the Financial Statements
For the six months ended 30 June 2020(Unless otherwise indicated, the unit of amount is RMB)
145INTERIM REPORT 2020
IV. SIGNIFICANT ACCOUNTING POLICIES AND ACCOUNTING ESTIMATES OF THE COMPANY (CONTINUED)
27. Leases (continued)27.2 The Group as lessor (continued)
27.2.5 The Group records financial leasing operations as lessor (continued)
The Group calculates and recognises interest income at a fixed periodic rate for each period
of the lease term.
27.2.6 Sublease
The Group, as the sublease lessor, accounts for the original lease and the sublease contract
separately as two contracts. The Group classifies subleases based on the right-of-use asset
arising from the original lease, rather than the asset that is the subject of the original lease.
27.2.7 Lease modification
The Group has chosen to adopt a simplified method for rent reductions, deferred payments
and other rent concessions agreed between the Group as lessor and lessee on existing
lease contracts that are directly caused by the new coronary pneumonia epidemic and that
meet the “Accounting Treatment of Rent Concessions Related to the COVID-19 Epidemic”
(Cai Kuai [2020] No. 10) issued by the Ministry of Finance, and does not assess whether a
lease change has occurred or reassess the lease classification. Beyond that:
Where there is a change in an operating lease, the Group accounts for it as a new lease
from the effective date of the change, and the amount of lease receipts received or
receivable in advance relating to the pre-change lease is treated as receipts under the new
lease.
When a change in a finance lease occurs and the following conditions are also met, the
Group accounts for the change as a separate lease:
• The change expands the scope of the lease by adding the right to use one or more of
the leased assets.
• The increased consideration is equal to the separate price of the expanded portion of
the lease, adjusted for that contract.
If a change in a finance lease is not accounted for as a separate lease, the Group treats the
changed lease as follows:
• Where the lease would have been classified as an operating lease had the change been
effective at the lease commencement date, the Group accounts for the lease as a new
lease from the effective date of the lease change and the carrying amount of the leased
asset is the net investment in the lease as at the effective date of the lease change;
Chapter 10Notes to the Financial StatementsFor the six months ended 30 June 2020(Unless otherwise indicated, the unit of amount is RMB)
SINOTRANS LIMITED146
IV. SIGNIFICANT ACCOUNTING POLICIES AND ACCOUNTING ESTIMATES OF THE COMPANY (CONTINUED)
27. Leases (continued)27.2 The Group as lessor (continued)
27.2.7 Lease modification (continued)
• Had the change been effective at the lease commencement date, the lease would
have been classified as a finance lease, and the Group would have accounted for it
in accordance with the provisions of Accounting Standard for Business Enterprises
22 – Recognition and Measurement of Financial Instruments for the modification or
renegotiation of contracts.
27.3 Sale and leaseback transactions
27.3.1 The Group as seller and lessee
The Group assesses whether the transfer of an asset in a sale and leaseback transaction is a
sale in accordance with the provisions of Accounting Standard for Business Enterprises 14 –
Revenue. If the asset transfer is not a sale, the Group continues to recognize the transferred
asset and recognises a financial liability equal to the amount of the transfer proceeds, and
accounts for the financial liability in accordance with Accounting Standard for Business
Enterprises 22 – Recognition and Measurement of Financial Instruments. If the transferred
asset is a sale, the Group measures the right-of-use asset resulting from the sale and
leaseback at the portion of the carrying value of the original asset that relates to the right of
use acquired through leaseback, and recognises gain or loss only on the right transferred to
the lessor.
27.3.2 The Group as buyer (lessor)
Where the transfer of an asset in a sale and leaseback transaction is not a sale, the Group
does not recognize the transferred asset, but recognises a financial asset equal to the
proceeds of the transfer, and accounts for the financial asset in accordance with Accounting
Standard for Business Enterprises 22 – Recognition and Measurement of Financial
Instruments. If the transferred asset is a sale, the Group accounts for the purchase of the
asset and the lease of the asset in accordance with other applicable business accounting
standards.
Chapter 10Notes to the Financial Statements
For the six months ended 30 June 2020(Unless otherwise indicated, the unit of amount is RMB)
147INTERIM REPORT 2020
IV. SIGNIFICANT ACCOUNTING POLICIES AND ACCOUNTING ESTIMATES OF THE COMPANY (CONTINUED)
28. Held for SaleThe Group is classified as held for sale when it recovers the carrying value of a non-current asset or
disposal group primarily through a sale, including a non-monetary asset exchange with commercial
substance, rather than through the continued use of the asset or disposal group.
A non-current asset or disposal group classified as held for sale is subject to both (1) immediate sale
in its current condition, as is customary for the sale of such an asset or disposal group in similar
transactions, and (2) a sale is highly probable, i.e. the Group has resolved on a plan to sell and has
received firm purchase commitments and the sale is expected to be completed within one year.
The Group measures non-current assets held for sale or disposal groups at the lower of their carrying
value or fair value less costs to sell. If the carrying value is higher than the fair value less costs to sell,
the carrying value is written down to the fair value less costs to sell, and the amount of the write-
down is recognised as an impairment loss on the asset, which is recognised in profit or loss and an
impairment provision for assets held for sale. If the fair value of non-current assets held for sale, net of
selling expenses, increases at subsequent balance sheet dates, the amount previously written down is
restored and reversed within the amount of the impairment loss recognised after classification as held
for sale, and the reversed amount is recognised in profit or loss for the current period.
Non-current assets held for sale or non-current assets in the disposal group are not depreciated or
amortised, and interest and other charges on liabilities in the disposal group held for sale continue to be
recognised. Equity investments in associates or joint ventures are classified in whole or in part as assets
held for sale, and the portion classified as held for sale is no longer accounted for under the equity
method from the date it is classified as held for sale.
29. Safety Production CostThe Group extracts production safety fees in accordance with the Administrative Measures on the
Withdrawal and Use of Safety Production Cost by Enterprises (Caiqi [2012] No.16) issued jointly by the
Ministry of Finance and the State Administration of Work Safety on 14 February 2012, which is recorded
in the cost of the relevant products or current profit and loss, and transferred to the special reserve.
When using the extracted safety production cost, if it is an expense, it is directly deducted from the
special reserve. When the safety production cost are used to form fixed assets, the expenses incurred
are collected under the account “Construction in progress” and recognised as fixed assets when the
safety projects are completed and ready for use; at the same time, the special reserve is deducted from
the cost of the fixed assets and the same amount of accumulated depreciation is recognised. Such
fixed assets are not depreciated in subsequent periods.
Chapter 10Notes to the Financial StatementsFor the six months ended 30 June 2020(Unless otherwise indicated, the unit of amount is RMB)
SINOTRANS LIMITED148
IV. SIGNIFICANT ACCOUNTING POLICIES AND ACCOUNTING ESTIMATES OF THE COMPANY (CONTINUED)
30. Asset Securitization BusinessWhen a financial asset is transferred, it is judged on the basis of the transfer of substantially all the
risks and rewards of ownership of the relevant financial asset: if it has been transferred in full, the
corresponding financial asset is derecognised; if it has not been transferred and substantially all the
risks and rewards of ownership of the relevant financial asset have been retained, derecognition is
not possible; if substantially all the risks and rewards of ownership of the relevant financial asset have
neither been transferred nor retained, the financial asset is derecognised. If control over the financial
asset is relinquished, the financial asset is derecognised; if control over the financial asset is not
relinquished, the financial asset is recognised to the extent of its continuing involvement in the financial
asset, and the related liability is recognised accordingly.
If the financial asset meets the criteria for derecognition of the whole financial asset, the difference
between the consideration received and the corresponding carrying amount is recognised in profit
or loss for the period, and the cumulative change in fair value of the relevant financial asset originally
recognised directly in equity is also recognised in profit or loss for the period; if the conditions for
derecognition of the partial transfer are met, the carrying amount of the whole financial asset involved in
the transfer, between the part that is derecognised and the part that is not derecognised, is recognised
in profit or loss for the period in accordance with the following criteria. The relative fair value of each is
apportioned and the apportioned carrying amount is treated on an overall transfer versus partial transfer
basis. If the conditions for derecognition are not met, the consideration received is recognised as a
financial liability.
31. Discontinued OperationDiscontinued operation refers to a separate component of the Group which meets one of the following
conditions and which has been disposed of or classified as held-for-sale:
(1) The component represents an independent major business or a major area of operation;
(2) The component is part of an associated plan for the disposition of an independent major business
or a separate major area of operation;
(3) The component is a subsidiary acquired specifically for resale.
Chapter 10Notes to the Financial Statements
For the six months ended 30 June 2020(Unless otherwise indicated, the unit of amount is RMB)
149INTERIM REPORT 2020
IV. SIGNIFICANT ACCOUNTING POLICIES AND ACCOUNTING ESTIMATES OF THE COMPANY (CONTINUED)
32. Non-Monetary Asset ExchangeNon-monetary asset exchanges are measured at fair value if the non-monetary asset exchange has
commercial substance and the fair value of the exchange-in asset or exchange-out asset can be
measured reliably. For the exchange-in assets, the fair value of the exchange-out asset and the related
tax payable are initially measured as the cost of the exchange-in asset; for the exchange-out assets,
the difference between the fair value and the carrying amount of the exchange-out asset is recognised
in current profit or loss upon derecognition. If there is sufficient evidence that the fair value of the
exchange-in asset is more reliable, the fair value of the exchange-in asset and the relevant tax payable
are used as the initial measurement amount of the exchanged asset; for the exchange-out asset, the
difference between the fair value of the exchange-in asset and the carrying amount of the exchange-out
asset is charged to the profit or loss for the current period upon derecognition.
Non-monetary asset exchanges that do not meet the condition of being measured at fair value are
measured at carrying amount. For the exchange-in assets, the carrying amount of the exchange-out
asset and the relevant tax payable are used as the initial measurement amount of the exchange-in
asset; for the exchange-out assets, no gain or loss is recognised upon derecognition.
When there is a discrepancy between the point of recognition of the exchange-in asset and the point of
derecognition of the exchange-out asset, the exchange-in asset meets the asset recognition condition
and, if the exchange-out asset has not yet met the derecognition condition, the obligation to deliver the
exchange-out asset is recognised as a liability at the same time as the exchange-in asset is recognised;
if the exchange-in asset has not yet met the asset recognition condition and the exchange-out asset
meets the derecognition condition, the right to acquire the exchange-in asset is recognised as an asset
at the same time as the exchange-out asset is derecognised.
Where multiple assets are exchanged simultaneously in a non-monetary asset exchange, if the
exchange is measured at fair value, the net amount of the total fair value of the exchange-out assets
less the fair value of the exchange-in financial assets is apportioned according to the relative proportion
of the fair value of each exchange-in asset other than the exchange-in financial assets, and the amount
apportioned to each exchange-in asset plus the relevant taxes payable, is initially measured as the
cost of each exchange-in asset; where there is sufficient evidence that the fair value of the exchange-
in assets is more reliable, the fair value of each exchange-in asset and the related taxes payable are
used as the initial measurement of the cost of each exchange-in asset. Where the non-monetary asset
exchange is measured at carrying amount, the total carrying amount of the exchange-out asset is
apportioned to each exchange-in asset in proportion to the relative proportion of the fair value of each
exchange-in asset, and the amount apportioned plus the relevant taxes payable are recognised as the
initial measurement amount of each exchange-in asset. If the fair value of the exchange-in asset cannot
be measured reliably, the carrying amount of the exchange-out asset is apportioned in proportion to the
relative or other reasonable proportion of the original carrying value of each exchange-in asset.
Chapter 10Notes to the Financial StatementsFor the six months ended 30 June 2020(Unless otherwise indicated, the unit of amount is RMB)
SINOTRANS LIMITED150
IV. SIGNIFICANT ACCOUNTING POLICIES AND ACCOUNTING ESTIMATES OF THE COMPANY (CONTINUED)
32. Non-Monetary Asset Exchange (continued)Where multiple assets are exchanged simultaneously in a non-monetary asset exchange, if the
exchange is measured at fair value, the difference between the fair value of each exchange-out asset
and its carrying amount is recognised in profit or loss upon derecognition of each exchange-out asset;
if there is sufficient evidence that the fair value of the exchange-in asset is more reliable, the total
fair value of the exchange-in asset is apportioned to each exchange-out asset in proportion to the
relative proportion of the fair value of each exchange-out asset. The difference between the amount
apportioned to each exchange-out asset and the carrying amount of each exchange-out asset is
recognised in profit or loss on derecognition of each exchange-out asset. Where non-monetary asset
exchange is measured at carrying amount, no gain or loss is recognised on derecognition of each
exchange-out asset.
33. Debt Restructuring33.1 Recording debt restructuring obligations as a debtor
A debt restructuring in which the debt is settled by assets is derecognised when the relevant
assets and the settled debt meet the conditions for derecognition, and the difference between
the carrying amount of the settled debt and the carrying amount of the transferred assets is
recognised in profit or loss for the current period.
A debt restructuring that converts a debt into an equity instrument is derecognised when the
settled debt meets the conditions for derecognition. The equity instrument is measured at its fair
value upon initial recognition, and if the fair value cannot be reliably measured, it is measured at
the fair value of the settled debt. The difference between the carrying amount of the settled debt
and the amount recognised for the equity instrument is recognised in profit or loss for the current
period.
Debt restructuring by modifying other terms shall be recognised and measured in accordance
with Accounting Standards for Business Enterprises No. 22 – Recognition and Measurement of
Financial Instruments and Accounting Standards for Business Enterprises No. 37 – Presentation of
financial instruments.
If debt restructuring is carried out by using multiple assets to pay off debts or combination, equity
instruments and restructured debts shall be recognised and measured according to the above-
mentioned methods. The difference between the carrying amount of the settled debts and the
carrying amount of the transferred assets and the sum of the recognised amounts of the equity
instruments and restructured debts shall be included in the current profits or losses.
Chapter 10Notes to the Financial Statements
For the six months ended 30 June 2020(Unless otherwise indicated, the unit of amount is RMB)
151INTERIM REPORT 2020
IV. SIGNIFICANT ACCOUNTING POLICIES AND ACCOUNTING ESTIMATES OF THE COMPANY (CONTINUED)
33. Debt Restructuring (continued)33.2. Recording debt restructuring obligations as a creditor
For debt restructuring in which assets are used to pay off debts, assets other than the transferred
financial assets are initially recognised at cost. The cost of inventory includes the fair value of
abandoned creditor’s rights and other costs directly attributable to the asset, such as taxes,
transportation costs, handling charges, insurance premiums, etc., incurred to enable the asset to
reach its current position and state. The cost of an investment in an associate or joint venture and
the cost of investment property respectively include the fair value of abandoned creditor’s rights
and other costs directly attributable to the asset, such as taxes. The cost of a fixed asset includes
the fair value of abandoned creditor’s rights and other costs directly attributable to the asset,
such as taxes, transportation costs, handling charges, installation costs, professional services fee,
incurred before bringing the asset to its intended usable condition. The cost of a biological asset
includes the fair value of abandoned creditor’s rights and other costs attributable to the asset,
such as taxes, transportation costs, insurance premiums. The cost of an intangible asset includes
the fair value of abandoned creditor’s rights and other costs such as taxes that are directly
attributable to bringing the asset to its intended use. The difference between the fair value and the
carrying value of abandoned creditor’s rights should be recognised in profit or loss for the current
period.
If the debt restructuring of converting debt into equity instrument causes the group to convert
the creditor’s right into equity investment in an associate or a joint venture, the initial investment
cost shall be measured according to the fair value of the abandoned creditor’s right and other
costs such as taxes directly attributable to the asset. The difference between the fair value and
the carrying amount of the abandoned creditor’s rights recognised in profit or loss for the current
period.
For debt restructuring by modifying other terms, the creditor’s rights restructured shall be
recognised and measured in accordance with the Accounting Standards for Business Enterprises
No. 22 – Recognition and Measurement of Financial Instruments.
If debt restructuring is carried out by using multiple assets to pay off debts or combination, firstly,
the transferred financial assets and creditor’s right restructured are recognised and measured
in accordance with the provisions of “Accounting Standards for Business Enterprises No. 22
– Recognition and Measurement of Financial Instruments”, and then the net amount of the fair
value of the abandoned creditor’s rights after deducting the recognised amount of the transferred
financial assets and the restructured creditor’s rights are allocated in proportion to the fair value of
each asset other than the transferred financial assets. and, on this basis, the cost of each asset
is determined separately in accordance with the above method. The difference between the fair
value and the carrying amount of the abandoned creditor’s rights is recognised in profit or loss for
the current period.
Chapter 10Notes to the Financial StatementsFor the six months ended 30 June 2020(Unless otherwise indicated, the unit of amount is RMB)
SINOTRANS LIMITED152
V. CRITICAL ACCOUNTING JUDGMENTS AND KEY ASSUMPTIONS AND UNCERTAINTIES IN ACCOUNTING ESTIMATES
In the application of the Group’s accounting policies, which are described in Note IV, the directors
of the Company are required to make judgments, estimates and assumptions about the amounts of
assets, liabilities, revenue and expenses reported and disclosures made in the consolidated financial
statements. The estimates and associated assumptions are based on historical experience and other
factors that are considered to be relevant. Actual results may differ from these estimates.
The estimates and underlying assumptions are reviewed on an on-going basis. Revisions to accounting
estimates are recognised in the period in which the estimate is revised if the revision affects only that
period, or in the period of the revision and future periods if the revision affects both current and future
periods.
1. Key Assumptions and Uncertainties in Accounting EstimatesAt the end of the reporting period, the key assumptions and uncertainties in accounting estimates that
are likely to lead to significant adjustments in the carrying amount of assets and liabilities in the future
are as follows:
1.1 Classification of financial assets
The classification and measurement of financial assets is dependent on the contractual cash flow
test and the business model test. The Group is required to consider all relevant evidence available
at the date of the business model assessment, including the manner in which the enterprise
evaluates and reports the performance of financial assets to key management personnel, the risks
that affect the performance of financial assets and their management, and the manner in which
the relevant business management personnel are compensated. The Group is also required to
make a judgment as to whether the contractual cash flows generated from the financial assets
held at a particular date are solely payments of principal and interest based on the outstanding
principal amount.
1.2 Derecognition of transfers of financial assets
The Group transfers financial assets in the normal course of business through a variety of
methods, including conventional transactions and asset securitization. The Group is required to
make significant judgments and estimates in the process of determining whether or not all of the
transferred financial assets can be derecognised.
Where the Group transfers financial assets to a special purpose entity through a structured
transaction, the Group analyses and assesses whether the relationship with the special purpose
entity substantially demonstrates that the Group has control over the special purpose entity and
therefore consolidation is required. The judgment of consolidation will determine whether the
derecognition analysis should be performed at the level of the consolidation entity, or at the level
of the single entity from which the financial assets are transferred.
Chapter 10Notes to the Financial Statements
For the six months ended 30 June 2020(Unless otherwise indicated, the unit of amount is RMB)
153INTERIM REPORT 2020
V. CRITICAL ACCOUNTING JUDGMENTS AND KEY ASSUMPTIONS AND UNCERTAINTIES IN ACCOUNTING ESTIMATES (CONTINUED)
1. Key Assumptions and Uncertainties in Accounting Estimates (continued)1.2 Derecognition of transfers of financial assets (continued)
The Group is required to analyse the contractual cash flow rights and obligations related to the
transfer of financial assets to determine whether it meets the conditions for derecognition based
on the following judgments.
• Whether the authority to obtain the contractual cash flows has been transferred; or whether
the cash flows have met the “pass through” requirements and transferred to an independent
third party.
• Assess the degree of risk and reward transfer in the ownership of financial assets. The group
uses significant accounting estimates and judgments in estimating cash flows and other
factors that affect the degree of risk and reward transfer before and after the transfer.
1.3 Recognition of expected credit losses
Significant increase in credit risk: In assessing the expected credit losses on financial assets,
the Group is required to judge whether the credit risk on financial assets has increased
significantly since acquisition, taking into account both qualitative and quantitative information and
incorporating forward-looking information in the process.
Establishment of asset groups with similar credit risk characteristics: when expected credit losses
are measured on a portfolio basis, financial instruments are grouped together based on similar risk
characteristics. The Group continually assesses whether these financial instruments continue to
have similar credit risk characteristics to ensure that should the credit risk characteristics change,
the financial instruments will be reclassified appropriately. This may result in the creation of a new
portfolio or the reclassification of assets into an existing portfolio to better reflect the similar credit
risk characteristics of such assets.
1.4 Fair value evaluation and goodwill recognition of identifiable net assets related to
acquisition business
As described in Note IV. 4. 4.2 “Business combination not involving entities under common
control”, the Group measures the identifiable assets, liabilities and contingent liabilities of the
acquiree that qualify for recognition in a business combination that is not under common control
at fair value at the date of acquisition. The difference between the cost of the combination over
the fair value share of the acquiree’s identifiable net assets acquired in the combination is treated
as an asset and recognised as goodwill and initially measured at cost.
Chapter 10Notes to the Financial StatementsFor the six months ended 30 June 2020(Unless otherwise indicated, the unit of amount is RMB)
SINOTRANS LIMITED154
V. CRITICAL ACCOUNTING JUDGMENTS AND KEY ASSUMPTIONS AND UNCERTAINTIES IN ACCOUNTING ESTIMATES (CONTINUED)
1. Key Assumptions and Uncertainties in Accounting Estimates (continued)1.4 Fair value evaluation and goodwill recognition of identifiable net assets related to
acquisition business (continued)
The evaluation of the fair value of identifiable assets, liabilities and contingent liabilities involves
significant estimation and judgment of the management, especially the identification of intangible
assets and the assessment of their fair value, thus affecting the recognition of goodwill. As
stated in Note VIII. 2. “Business combination of the Group not under common control during the
period” and recognised intangible assets (customer relationship) of EUR59,927,096 and goodwill
of EUR269,126,280.
The key assumptions used in the evaluation of the fair value of intangible assets, including the
different inputs in key assumptions such as discount rate and growth rate of income, may lead to
significant differences in the fair value estimation.
1.5 Goodwill impairment
As at 30 June 2020, the carrying amount of goodwill is RMB2,315,126,472.63. The Group
conducts impairment test on goodwill at least annually. In the impairment test of goodwill, it is
necessary to calculate the present value of the expected future cash flow of the relevant asset
group or asset group portfolios, and to estimate the future cash flow of the asset group or
asset group portfolios. At the same time, it is necessary to determine a pre-tax interest rate that
appropriately reflects the time value of currency in the current market and asset specific risks. All
these matters involve the judgment of the management.
1.6 Recognition of deferred income tax
Within the limits of deductible temporary differences and deductible losses, the Group is likely
to obtain sufficient taxable income in the future to recognize deferred income tax assets for all
unused deductible temporary differences and deductible losses. This requires the management of
the Group to use a large number of judgments to estimate the time and amount of future taxable
income, combined with tax planning strategy, to determine the amount of deferred income tax
assets that should be recognised.
The Group operates in many countries and regions and collects the income tax payable in each
region according to the local tax law and relevant regulations. The Group will calculate and submit
deferred income tax liabilities in accordance with the requirements of relevant state agencies,
the Group’s development strategy and the distribution plan of retained earnings of subsidiaries,
associates and joint ventures, as well as the provisions of the relevant tariff law. If the actual
distribution of future profits exceeds expectations, the corresponding deferred income tax liabilities
will be recognised and recorded in profits and losses at a relatively early period between the
change of distribution plan and the announcement of profit distribution.
Chapter 10Notes to the Financial Statements
For the six months ended 30 June 2020(Unless otherwise indicated, the unit of amount is RMB)
155INTERIM REPORT 2020
V. CRITICAL ACCOUNTING JUDGMENTS AND KEY ASSUMPTIONS AND UNCERTAINTIES IN ACCOUNTING ESTIMATES (CONTINUED)
1. Key Assumptions and Uncertainties in Accounting Estimates (continued)1.7 Impairment of long-term equity investments
As at 30 June 2020, the carrying amount of the Group’s investment in associates amounted
to RMB3,984,599,282.79 (1 January 2020: RMB3,903,774,411.31); the carrying amount of the
Group’s investment in joint ventures as at 30 June 2020 amounted to RMB3,749,967,883.58 (1
January 2020: RMB5,464,584,890.86). For long-term equity investments that have indications
of impairment, the Group determines whether a long-term equity investment is impaired by
estimating the recoverable amount of the long-term equity investment and comparing it with its
carrying amount. If the carrying amount of the long-term equity investment is greater than the
estimated recoverable amount, an impairment provision is made accordingly.
1.8 Fair Value of Financial Instruments
For financial instruments which lacking active market, the Group adopts valuation method to
determine their fair value. Valuation methods make the best use of observable market information;
when observable market information is not available, an estimate is made of the significant
unobservable information included in the valuation method.
Observable input values refer to input values that can be obtained from market data. The input
value reflects the assumptions that market participants use to price related assets or liabilities
Non-observable input values refer to input values that cannot be obtained from market data. The
input value shall be determined based on the best available information on the assumptions used
by market participants in pricing the relevant assets or liabilities.
1.9 Estimated useful life and estimated residual value of fixed assets and intangible assets
The Group determines the useful life and residual value of fixed assets and intangible assets.
The estimation is based on the historical experience of the actual useful life and residual value
of fixed assets and intangible assets with similar properties and functions, and may have
significant changes due to technological innovation and severe industry competition. When the
expected useful life and residual value of fixed assets or intangible assets are less than the
previous estimates, the Group will increase the depreciation/amortisation, or write off or offset the
technologically obsolete fixed assets or intangible assets.
Chapter 10Notes to the Financial StatementsFor the six months ended 30 June 2020(Unless otherwise indicated, the unit of amount is RMB)
SINOTRANS LIMITED156
V. CRITICAL ACCOUNTING JUDGMENTS AND KEY ASSUMPTIONS AND UNCERTAINTIES IN ACCOUNTING ESTIMATES (CONTINUED)
1. Key Assumptions and Uncertainties in Accounting Estimates (continued)1.10 Impairment of non-current assets other than financial assets (other than goodwill, long-
term equity investments)
The Group determines at the date of the statement of financial position whether there is any
indication that non-current assets other than financial assets may be impaired, and performs
impairment tests on those assets when there is an indication of impairment. In addition, intangible
assets with indefinite useful lives are tested for impairment annually. The recoverable amount of an
asset or asset groups is determined based on the higher of the value in use of the asset or group
of assets and net amount of its fair value less disposal expenses. In estimating its value in use, the
future cash flows of the asset or asset group are projected and determined using a discount rate
discounted to the present value of future cash flows. Management makes an accounting estimate
on the use of the asset and forecasts future cash flows on a reasonable and informed basis and
determines the present value of the future cash flows using a discount rate that reflects the time
value of money in the current market and the specific risks associated with the asset.
1.11 Determine the lease term of a lease contract with a renewal option
For a lease contract signed as a lessee with the renewal option, the Group uses judgment to
determine the lease term of the lease contract. The assessment of whether the Group reasonably
determines the exercise of this option affects the length of the lease term, which in turn has a
significant impact on the amount of lease liability and right-of-use asset recognised under the
lease.
1.12 Contingent liabilities
The Group is faced with numerous legal disputes in the course of its going concern, the outcome
of which is subject to a significant degree of uncertainty. When the economic benefits associated
with a particular legal dispute are considered to be likely to flow out and can be measured
reliably, the Group’s management makes provision for them based on professional legal advice.
Contingent liabilities faced by the Group, other than those which are considered to be highly
unlikely to result in an outflow of economic benefits, are disclosed in Note XII. “CONTINGENCIES”.
Management uses its judgment to determine whether a related legal dispute should be provided
for as a provision or disclosed as a contingent liability.
Chapter 10Notes to the Financial Statements
For the six months ended 30 June 2020(Unless otherwise indicated, the unit of amount is RMB)
157INTERIM REPORT 2020
VI. EXPLANATIONS ON THE CHANGES OF ACCOUNTING POLICIES
1. Changes of Accounting Policies and Their EffectsThe Ministry of Finance issued Interpretation of Accounting Standards for Business Enterprises No. 13
(Cai Kuai [2019] No. 21) on 10 December 2019, Interim Provisions on Accounting Treatment Related to
Carbon Emission Trading (Cai Kuai [2019] No. 22) on 16 December 2019, and Accounting Treatment
of Rent Concessions Related to the COVID-19 Epidemic (Cai Kuai [2020] No. 10) on 19 June 2020.
The Group has adopted the above interpretations and provisions for the preparation of the financial
statements for the six months end on 30 June 2020. Interpretation of the Accounting Standards
for Business Enterprises No. 13 and Interim Provisions on Accounting Treatment Related to Carbon
Emission Trading have no significant impact on the Group and the Company.
In accordance with the “Accounting Treatment of Rent Concessions Related to the COVID-19
Epidemic”, the Group adopts the simplified method for all rent concessions, such as rent reductions
and deferred payments, concluded between the Group as a party to a lease contract and a lessor
or lessee under an existing lease contract, directly caused by the COVID-19 epidemic, and does not
evaluate whether a lease change has occurred or whether a lease classification has been reevaluated.
From January-June 2020, the Group obtained rent concessions from the lessor as lessee in the amount
of RMB6.1329 million, increasing the total profit by RMB6.1329 million. The amount of rent concessions
granted by the Group as lessor to the lessee was RMB2.7708 million, decreasing the total profit by
RMB2.7708 million. The rent deferment concession granted by the Group as lessor to the lessee
involved an amount of RMB943.9 thousand, and the period of rent deferment was 1-3 months after the
rent payment date under the original lease agreement.
2. Accounting Estimate Change and Its ImpactAccording to the relevant provisions of “Accounting Standard for Business Enterprises No. 4 – Fixed
Assets”, at the end of each fiscal year, enterprises shall review the estimated useful lives, net residual
values and depreciation methods of fixed assets, and if the estimated useful lives and net residual
values of fixed assets differ from the original accounting estimates, adjustments shall be made
accordingly. In addition, in accordance with the relevant provisions of Notice of the Ministry of Finance
and the State Administration of Taxation on improving the enterprise income tax policy for accelerated
depreciation of fixed assets (Cai Shui [2014] No. 75), all fixed assets with a unit value of not more than
RMB5,000 held by enterprises are allowed to be deducted in the calculation of taxable income by one-
time inclusion of current costs, and depreciation shall no longer be calculated over a period of years.
In order to better match the depreciable lives of fixed assets with their actual useful lives, to more
accurately reflect the depreciation of fixed assets, and thus to more fairly and appropriately reflect the
Group’s financial position and operating results, and with reference to the common practice of relevant
companies in the same industry, the Group, upon approval at the 19th Meeting of the 2nd Board of
Directors of the Company held on 31 March 2020, has, from 1 April 2020 onwards, changed the useful
life of the building construction category to 30 years for steel structures, 25 years for steel concrete
structures and 20 years for brick concrete structures; changed the useful life of vehicles to 5 years; and
changed the fixed asset recognition criteria to RMB5,000. The useful lives and fixed asset recognition
criteria before and after this change are as follows.
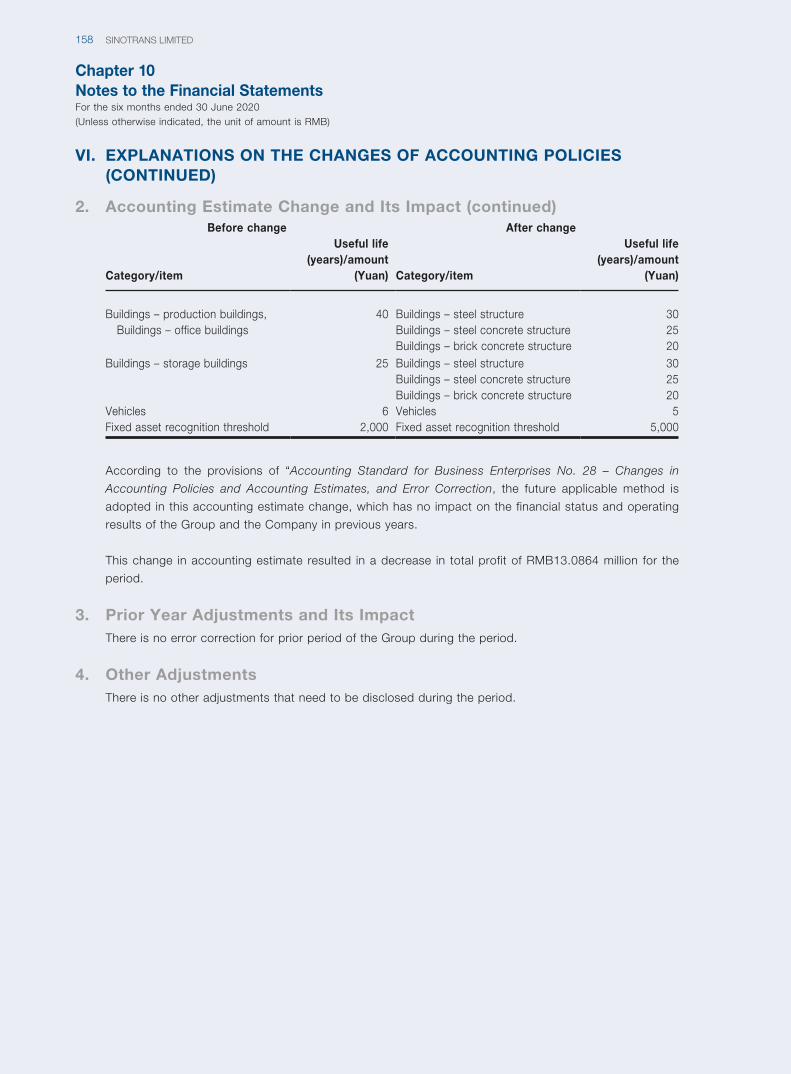
Chapter 10Notes to the Financial StatementsFor the six months ended 30 June 2020(Unless otherwise indicated, the unit of amount is RMB)
SINOTRANS LIMITED158
VI. EXPLANATIONS ON THE CHANGES OF ACCOUNTING POLICIES (CONTINUED)
2. Accounting Estimate Change and Its Impact (continued)Before change After change
Category/item
Useful life (years)/amount
(Yuan) Category/item
Useful life (years)/amount
(Yuan)
Buildings – production buildings, Buildings – office buildings
40 Buildings – steel structure 30Buildings – steel concrete structure 25Buildings – brick concrete structure 20
Buildings – storage buildings 25 Buildings – steel structure 30Buildings – steel concrete structure 25Buildings – brick concrete structure 20
Vehicles 6 Vehicles 5Fixed asset recognition threshold 2,000 Fixed asset recognition threshold 5,000
According to the provisions of “Accounting Standard for Business Enterprises No. 28 – Changes in
Accounting Policies and Accounting Estimates, and Error Correction, the future applicable method is
adopted in this accounting estimate change, which has no impact on the financial status and operating
results of the Group and the Company in previous years.
This change in accounting estimate resulted in a decrease in total profit of RMB13.0864 million for the
period.
3. Prior Year Adjustments and Its ImpactThere is no error correction for prior period of the Group during the period.
4. Other AdjustmentsThere is no other adjustments that need to be disclosed during the period.
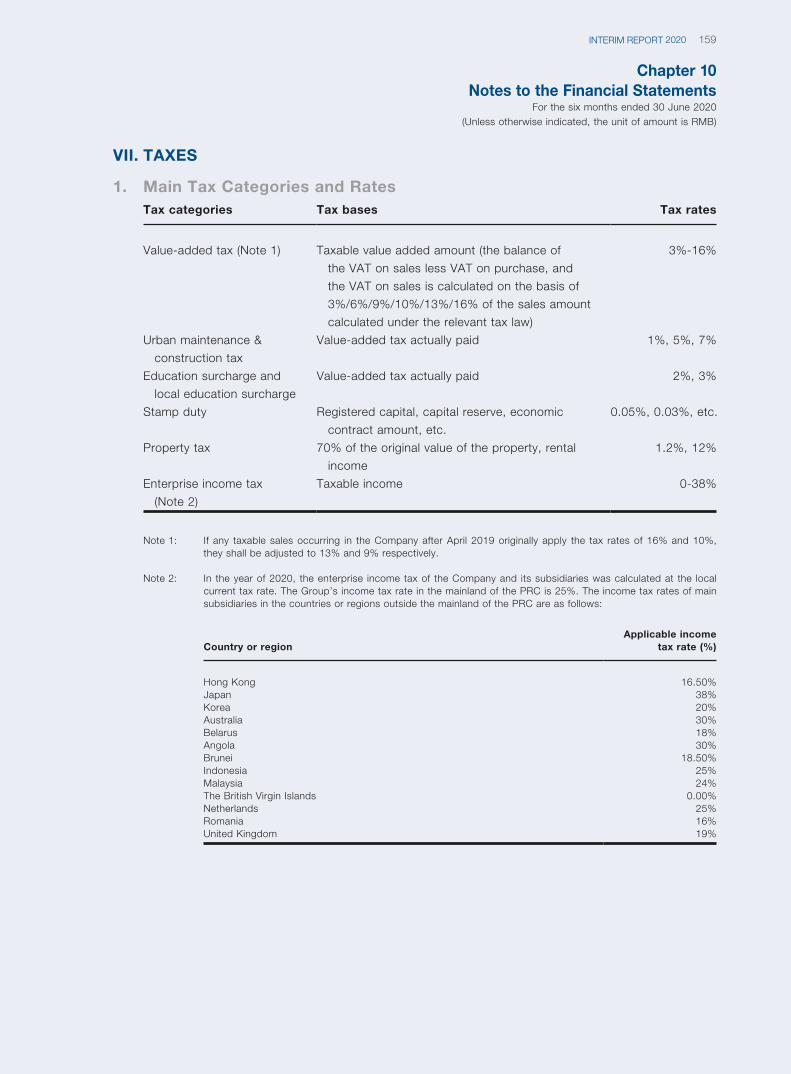
Chapter 10Notes to the Financial Statements
For the six months ended 30 June 2020(Unless otherwise indicated, the unit of amount is RMB)
159INTERIM REPORT 2020
VII. TAXES
1. Main Tax Categories and RatesTax categories Tax bases Tax rates
Value-added tax (Note 1) Taxable value added amount (the balance of
the VAT on sales less VAT on purchase, and
the VAT on sales is calculated on the basis of
3%/6%/9%/10%/13%/16% of the sales amount
calculated under the relevant tax law)
3%-16%
Urban maintenance &
construction tax
Value-added tax actually paid 1%, 5%, 7%
Education surcharge and
local education surcharge
Value-added tax actually paid 2%, 3%
Stamp duty Registered capital, capital reserve, economic
contract amount, etc.
0.05%, 0.03%, etc.
Property tax 70% of the original value of the property, rental
income
1.2%, 12%
Enterprise income tax
(Note 2)
Taxable income 0-38%
Note 1: If any taxable sales occurring in the Company after April 2019 originally apply the tax rates of 16% and 10%, they shall be adjusted to 13% and 9% respectively.
Note 2: In the year of 2020, the enterprise income tax of the Company and its subsidiaries was calculated at the local current tax rate. The Group’s income tax rate in the mainland of the PRC is 25%. The income tax rates of main subsidiaries in the countries or regions outside the mainland of the PRC are as follows:
Country or regionApplicable income
tax rate (%)
Hong Kong 16.50%Japan 38%Korea 20%Australia 30%Belarus 18%Angola 30%Brunei 18.50%Indonesia 25%Malaysia 24%The British Virgin Islands 0.00%Netherlands 25%Romania 16%United Kingdom 19%
Chapter 10Notes to the Financial StatementsFor the six months ended 30 June 2020(Unless otherwise indicated, the unit of amount is RMB)
SINOTRANS LIMITED160
VII. TAXES (CONTINUED)
2. Tax Preferences and Approvals2.1 Enterprise income tax
(1) According to the Notice on Tax Policy Issues concerning the In-depth Implementation of the
Western Development Strategy (Cai Shui [2011] No. 58) issued by the Ministry of Finance,
the General Administration of Customs and the State Taxation Administration on 27 July
2011 and the Announcement on Enterprise Income Tax Issues concerning the In-depth
Implementation of the Western Development Strategy (the Announcement No. 12 of 2012
of the State Taxation Administration) on 6 April 2012, from 1 January 2011 to 31 December
2020, the enterprises established in Western China whose main business is the industrial
projects specified in the Catalogue of Encouraging Industries in Western China and whose
main business revenue accounts for more than 70% of the total revenue of the enterprises in
the current year may pay their enterprise income tax at the reduced tax rate of 15%. During
the reporting period, some branches and subsidiaries of the Group located in Western China
enjoyed a preferential income tax rate of 15%.
(2) According to the Notice on Preferential Enterprise Income Tax Policies and Catalogue of
Preferences for Hengqin New Area of Guangdong Province, Pingtan Comprehensive
Experimental Zone of Fujian Province and Qianhai Shenzhen-Hong Kong Modern Service
Industry Cooperation Zone in Shenzhen (Cai Shui [2014] No. 26), the encouraging industries
in Hengqin New Area, Pingtan Comprehensive Experimental Zone and Qianhai Shenzhen-
Hong Kong Modern Service Industry Cooperation Zone are subject to an enterprise income
tax at the reduced tax rate of 15% from 1 January 2014 to 31 December 2020. The
Group’s subsidiaries including Shenzhen Sinotrans Electronic Commerce Co., Ltd. and China
Ocean Shipping Agency Shenzhen meet the conditions for encouraging industrial enterprises
established in Qianhai Shenzhen-Hong Kong Modern Service Industry Cooperation Zone in
Shenzhen during the reporting period and adopt the enterprise income tax rate of 15%.
(3) According to the Notice of the Ministry of Finance and the State Taxation Administration
on Implementing the Preferential Tax Reduction and Exemption Policy for Small and Micro
Enterprises (Cai Shui[2019] No.13), from 1 January 2019 to 31 December 2021, the income
of the small and micro enterprises shall be included in taxable income at a reduced ratio of
25% and they shall pay enterprise income tax at a tax rate of 20% for the portion of annual
taxable income not exceeding RMB1 million; the income of the small and micro enterprises
shall be included in taxable income at a reduced ratio of 50% and they shall pay enterprise
income tax at a tax rate of 20% for the portion of annual taxable income more than RMB1
million but no exceeding RMB3 million. Some subsidiaries of the Company enjoyed above-
mentioned tax preference during the reporting period.
(4) According to the Notice of the State Taxation Administration on the Issues Concerning the
Implementation of Income Tax Preferences for High-tech Enterprises (GSH [2009] No. 203),
E-Trans Information Development Co., Ltd. has been enjoying tax preferences for high-tech
enterprises at the reduced enterprise income tax rate of 15% since 2016.
Chapter 10Notes to the Financial Statements
For the six months ended 30 June 2020(Unless otherwise indicated, the unit of amount is RMB)
161INTERIM REPORT 2020
VII. TAXES (CONTINUED)
2. Tax Preferences and Approvals (continued)2.1 Enterprise income tax (continued)
(5) According to the Notice of the State Taxation Administration on the Implementation of
Several Tax Collection Issues under the Enterprise Income Tax Law (GSH [2010] No. 79)
and Article 26 of the Enterprise Income Tax Law, any dividends, bonuses and other equity
investment gains between resident enterprises are exempted from enterprise income tax.
The Group and its subsidiaries are exempted from enterprise income tax on dividends,
bonuses and other equity investment gains between resident enterprises.
(6) In accordance with the Decree No. 326 of the President of the Republic of Belarus dated 30
June 2014, the occupants in the Great Stone Industrial Park are exempted from income tax
on their profits from the sales of independently manufactured goods (projects, services) in
the Great Stone Industrial Park for ten calendar years from the date of registration in Belarus;
upon expiration of the period of ten calendar years from the date of registration, the profit
taxes are paid at half of the tax rate set out in the Decree of the President during the next
ten calendar years. In 2020, the profits from the sales of self-produced goods in the Great
Stone Industrial Park by China Merchants Great Stone Trade Logistics Co., Ltd. (hereinafter
referred to as “Great Stone Trade Logistics”) are exempted from enterprise income tax.
2.2 Value-added tax
(1) In accordance with the Notice on Comprehensively Launching a Pilot Project for the Levy
of Value-added Tax in Place of Business Tax (Cai Shui [2016] No.36), the Group and its
subsidiaries enjoy the tax preference of zero tax rate of the value-added taxes on their
international freight forwarding business during the period.
(2) In accordance with the Proclamation on the Issuance of the Interim Measures for
the Administration of the Levy of Value-added Tax on Taxpayers’ Real Estate Operating
Lease Services (Proclamation (2016) No. 16 of the State Taxation Administration), general
taxpayers may choose to apply a simple tax calculation method to calculate their tax payable
at the rate of 5% when leasing out any real estate acquired by them before 30 April 2016.
South China Branch of Sinoair and Beijing Sinotrans Airport Property Service Co., Ltd. under
the Group pay value-added taxes on their real estate operating leasing services at the rate of
5%.
(3) Any logistics auxiliary services (excluding warehousing services and receiving and distributing
services) sold to overseas units and completely consumed abroad are exempted from value
added tax. The cross-border taxable services of Sinoair and Sinotrans South China Co.,
Ltd. (hereinafter referred to as “Sinotrans South China”) are exempted from value added tax
during the period.
(4) Any storage services provided by domestic units and individuals whose storage location
is located abroad are exempted from valued-added tax. Any storage services provided by
Sinotrans South China whose storage location is located abroad are exempted from valued-
added tax during the period.
Chapter 10Notes to the Financial StatementsFor the six months ended 30 June 2020(Unless otherwise indicated, the unit of amount is RMB)
SINOTRANS LIMITED162
VII. TAXES (CONTINUED)
2. Tax Preferences and Approvals (continued)2.2 Value-added tax (continued)
(5) According to the requirements of the Announcement on the Policies related to Deepening
VAT Reforms (the Announcement No. 39 of 2019 of the Ministry of Finance, the State
Taxation Administration and the General Administration of Customs), from 1 April 2019
to 31 December 2021, the taxpayers whose sales from the provision of postal services,
telecommunication services, modern services, and living services account for more than
50% of their total sales are allowed to deduct taxable amount based on the deductible input
tax for the current period plus 10%. The eligible subsidiaries of the Group can enjoy this tax
preference.
(6) The value-added tax rate applicable to the Group’s subsidiaries in Belarus is 20%. In
accordance with the Decree No. 326 of the President of the Republic of Belarus dated 30
June 2014, the value-added tax on the project funds used by Great Stone Trade Logistics
for the construction of the Great Stone Industrial Park during the period shall be refunded.
2.3 Land use tax
(1) In accordance with the provisions of the Announcement of the Ministry of Finance and the
State Taxation Administration on the Continued Implementation of Preferential Policies for
Urban Land Use Tax on Storage Facility Lands for Bulk Commodities of Logistics Enterprises
(Cai Shui (2020) No. 16), from 1 January 2020 to 31 December 2022, the urban land use
tax on storage facility lands for bulk commodities owned by logistics enterprises (including
self-used and leased lands) shall be levied at the reduced rate of 50% of the applicable tax
standard for the land grade to which they belong.
The land use tax on the storage facility lands of Sinotrans Shanghai Haigang International
Logistics Co., Ltd., a subsidiary of the Group which meets the above requirements, was
levied at a reduced rate of 50% in 2020.
(2) In accordance with the Notice of the Ministry of Finance and the State Taxation
Administration on the Continued Implementation of Preferential Policies for Property Tax
and Urban Land Use Tax on Wholesale Markets for Agricultural Products and Farm Product
Markets (Cai Shui (2016) No. 1) and the Notice of the Ministry of Finance and the State
Taxation Administration on the Continued Implementation of Preferential Policies for Property
Tax and Urban Land Use Tax on Wholesale Markets for Agricultural Products and Farm
Product Markets (Cai Shui (2019) No. 12), from 1 January 2019 to 31 December 2021, the
property tax and the urban land use tax shall be temporarily exempted for the properties
and lands of the wholesale markets of agricultural products and agricultural trading markets
which are specifically used to operate agricultural products (including self-owned and
leased properties and lands, the same below). For the properties and lands of the wholesale
markets of agricultural products and farm product markets which are used to operate other
products at the same time, the property tax and the urban land use tax shall be levied and
exempted based on the proportion of the area of trading venue of other products to that
of agricultural products. In the years of 2019 and 2020, Shenyang Branch of Sinotrans
Northeast Co., Ltd. met such condition and was subject to a land use tax at a reduced rate
of 50%.
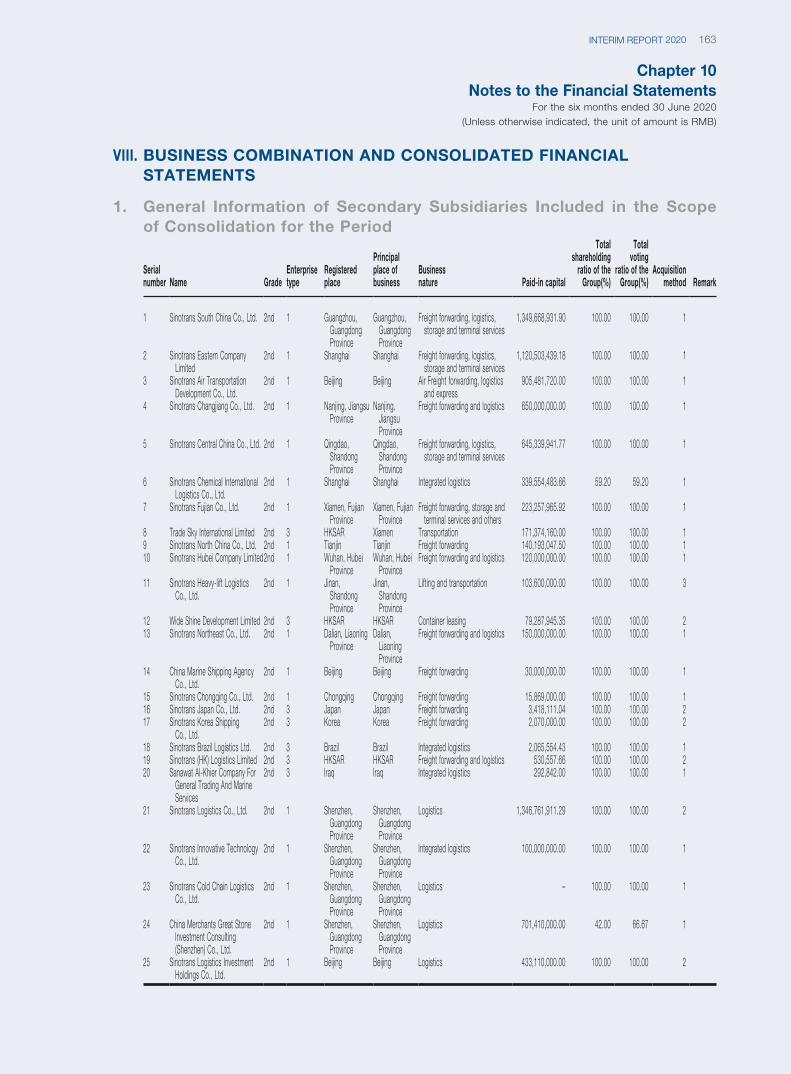
Chapter 10Notes to the Financial Statements
For the six months ended 30 June 2020(Unless otherwise indicated, the unit of amount is RMB)
163INTERIM REPORT 2020
VIII. BUSINESS COMBINATION AND CONSOLIDATED FINANCIAL STATEMENTS
1. General Information of Secondary Subsidiaries Included in the Scope of Consolidation for the Period
Serial number Name Grade
Enterprise type
Registered place
Principal place of business
Business nature Paid-in capital
Total shareholding
ratio of the Group(%)
Total voting
ratio of the Group(%)
Acquisition method Remark
1 Sinotrans South China Co., Ltd. 2nd 1 Guangzhou, Guangdong Province
Guangzhou, Guangdong Province
Freight forwarding, logistics, storage and terminal services
1,349,668,931.90 100.00 100.00 1
2 Sinotrans Eastern Company Limited
2nd 1 Shanghai Shanghai Freight forwarding, logistics, storage and terminal services
1,120,503,439.18 100.00 100.00 1
3 Sinotrans Air Transportation Development Co., Ltd.
2nd 1 Beijing Beijing Air Freight forwarding, logistics and express
905,481,720.00 100.00 100.00 1
4 Sinotrans Changjiang Co., Ltd. 2nd 1 Nanjing, Jiangsu Province
Nanjing, Jiangsu Province
Freight forwarding and logistics 650,000,000.00 100.00 100.00 1
5 Sinotrans Central China Co., Ltd. 2nd 1 Qingdao, Shandong Province
Qingdao, Shandong Province
Freight forwarding, logistics, storage and terminal services
645,339,941.77 100.00 100.00 1
6 Sinotrans Chemical International Logistics Co., Ltd.
2nd 1 Shanghai Shanghai Integrated logistics 339,554,483.66 59.20 59.20 1
7 Sinotrans Fujian Co., Ltd. 2nd 1 Xiamen, Fujian Province
Xiamen, Fujian Province
Freight forwarding, storage and terminal services and others
223,257,965.92 100.00 100.00 1
8 Trade Sky International Limited 2nd 3 HKSAR Xiamen Transportation 171,374,160.00 100.00 100.00 19 Sinotrans North China Co., Ltd. 2nd 1 Tianjin Tianjin Freight forwarding 140,193,047.50 100.00 100.00 110 Sinotrans Hubei Company Limited2nd 1 Wuhan, Hubei
ProvinceWuhan, Hubei
ProvinceFreight forwarding and logistics 120,000,000.00 100.00 100.00 1
11 Sinotrans Heavy-lift Logistics Co., Ltd.
2nd 1 Jinan, Shandong Province
Jinan, Shandong Province
Lifting and transportation 103,600,000.00 100.00 100.00 3
12 Wide Shine Development Limited 2nd 3 HKSAR HKSAR Container leasing 79,287,945.35 100.00 100.00 213 Sinotrans Northeast Co., Ltd. 2nd 1 Dalian, Liaoning
ProvinceDalian,
Liaoning Province
Freight forwarding and logistics 150,000,000.00 100.00 100.00 1
14 China Marine Shipping Agency Co., Ltd.
2nd 1 Beijing Beijing Freight forwarding 30,000,000.00 100.00 100.00 1
15 Sinotrans Chongqing Co., Ltd. 2nd 1 Chongqing Chongqing Freight forwarding 15,869,000.00 100.00 100.00 116 Sinotrans Japan Co., Ltd. 2nd 3 Japan Japan Freight forwarding 3,418,111.04 100.00 100.00 217 Sinotrans Korea Shipping
Co., Ltd.2nd 3 Korea Korea Freight forwarding 2,070,000.00 100.00 100.00 2
18 Sinotrans Brazil Logistics Ltd. 2nd 3 Brazil Brazil Integrated logistics 2,065,554.43 100.00 100.00 119 Sinotrans (HK) Logistics Limited 2nd 3 HKSAR HKSAR Freight forwarding and logistics 530,557.66 100.00 100.00 220 Sanawat Al-Khier Company For
General Trading And Marine Services
2nd 3 Iraq Iraq Integrated logistics 292,842.00 100.00 100.00 1
21 Sinotrans Logistics Co., Ltd. 2nd 1 Shenzhen, Guangdong Province
Shenzhen, Guangdong Province
Logistics 1,346,761,911.29 100.00 100.00 2
22 Sinotrans Innovative Technology Co., Ltd.
2nd 1 Shenzhen, Guangdong Province
Shenzhen, Guangdong Province
Integrated logistics 100,000,000.00 100.00 100.00 1
23 Sinotrans Cold Chain Logistics Co., Ltd.
2nd 1 Shenzhen, Guangdong Province
Shenzhen, Guangdong Province
Logistics – 100.00 100.00 1
24 China Merchants Great Stone Investment Consulting (Shenzhen) Co., Ltd.
2nd 1 Shenzhen, Guangdong Province
Shenzhen, Guangdong Province
Logistics 701,410,000.00 42.00 66.67 1
25 Sinotrans Logistics Investment Holdings Co., Ltd.
2nd 1 Beijing Beijing Logistics 433,110,000.00 100.00 100.00 2

Chapter 10Notes to the Financial StatementsFor the six months ended 30 June 2020(Unless otherwise indicated, the unit of amount is RMB)
SINOTRANS LIMITED164
VIII. BUSINESS COMBINATION AND CONSOLIDATED FINANCIAL STATEMENTS (CONTINUED)
1. General Information of Subsidiaries Included in the Scope of Consolidation for the Period (continued)Notes: Enterprise type: 1. domestic non-financial subsidiary; 2. domestic financial subsidiary; 3. overseas subsidiary; 4.
public institution; 5. infrastructure unit.
Acquisition method: 1.�establishment with investment; 2. business combination under common control; 3. business combination not under common control; 4. others.
2. Business Combination of the Group Not Under Common Control During the Period2.1 Companies of KLG Europe Holding B.V.
Name of the acquiree
Point of equity acquisition
Cost of equity acquisition
Method of equity acquisition
Date of acquisition
Determination basis of purchase date
Income of the acquiree from
the date of acquisition to the end of the
period
Net profit of the acquiree
from the date of acquisition to the end of the
period
Net cash flow of operating
activities of the acquiree from
the date of acquisition to the end of the
period
7 Companies 2020-1-1 2,920,708,824.80 Cash payment 1 January 2020 Date of actual acquisition of control over the acquiree
678,289,647.78 35,427,696.03 49,550,913.18
In order to implement the Company’s overseas strategies, build overseas channels and extend
the Company’s implementation ability in the European Union, on 26 September 2019, the 14th
Meeting of the 2nd Board of Directors of the Company considered and approved the “Proposal
on the Acquisition of the Equity Project of KLG Europe” and agreed to acquire the 100% equity
of the 7 Companies registered by KLG Europe Holding B.V., including Netherlands’ KLG Europe
Eersel B.V., KLG Europe Rotterdam B.V. and KLG Europe Venlo B.V., Romania’s KLG Invest
Europe SRL, KLG Europe Logistics SRL and KLG Trucking SRL, and KLG Europe Bradford
Limited in the United Kingdom (hereinafter collectively referred to as the “Target Company” or the
7 Companies, referred to regionally as the “UK Target Company”, the “Dutch Target Company”
and the “Romanian Target Company”). Pursuant to the aforementioned resolution of the Board of
Directors, the Company established SE Logistics Holding B.V. (SPV1), SE Netherlands Logistics
Holding B.V. (SPV2), SE Romania Logistics Holding B.V. (SPV3) in the Netherlands, and SPV1,
SPV2 and China Merchants Shipping and Enterprises Company Limited (a holding subsidiary of
the Company, acting as a guarantor of the transaction) signed the SHARE SALE AND PURCHASE
AGREEMENT with the shareholders of the target company on 27 September 2019, agreeing to:
1) The transaction price for the acquisition of 100% equity in the Target Company is expected
to be no more than EUR385,693,735 (approximately RMB3,005,904,124);
Chapter 10Notes to the Financial Statements
For the six months ended 30 June 2020(Unless otherwise indicated, the unit of amount is RMB)
165INTERIM REPORT 2020
VIII. BUSINESS COMBINATION AND CONSOLIDATED FINANCIAL STATEMENTS (CONTINUED)
2. Business Combination of the Group Not Under Common Control During the Period (continued)2.1 Companies of KLG Europe Holding B.V. (continued)
2) The transaction was closed in two steps, with the first step being the capital increase from
SPV1 to SPV2, the completion of the acquisition of 100% equity in the UK Target Company
and the Dutch Target Company by SPV2, and the completion of the acquisition of 100%
equity in the Romanian Target Company by SPV2 and SPV3, with SPV2 paying an estimated
total consideration of EUR282,980,226 (approximately RMB2,205,406,391). At the same
time, SPV2 issued 20% of its equity interest to KLG Europe Holding B.V.. Upon completion
of the first step of the closing, SPV2 held 100% equity interest in the Target Company,
SPV1 held 80% equity in SPV2 and KLG Europe Holding B.V. held 20% equity in SPV2. The
second step of the closing will be the acquisition by SPV1 of 20% equity in SPV2 from KLG
Europe Holding B.V.. The consideration for the second step is expected to be no more than
EUR100,000,000 (approximately RMB779,350,000).
On 21 October 2019 and 6 November 2019, the above-mentioned transactions passed
the antitrust review of the German Federal Agency for Enterprise Integration and the Dutch
Consumer and Market Authority, respectively. On 12 December 2019 (Beijing Time), SPV2
paid the purchase price of EUR282,980,226 for the first step of the closing as agreed in the
SHARE SALE AND PURCHASE AGREEMENT, completing the first step of the closing.
On 12 December 2019, SPV1, SPV2 and KLG Europe Holding B.V. entered into a
SHAREHOLDERS’ AGREEMENT. The Shareholders’ Agreement stipulates that KLG Europe
Holding B.V. and its appointed members of the Management Committee have a one-
vote veto right with respect to major management and operational decisions of the Target
Company until 31 December 2019.
On 1 January 2020, the validity period of the one-vote veto right held by the former
shareholders’ party and the appointed members of the Management Committee with respect
to the major management and operation decisions of the Target Company as agreed in the
aforementioned SHAREHOLDERS’ AGREEMENT ended, the Group and SPV1 were able to
control the major management and operation decisions of SPV2 and the Target Company
and enjoyed variable returns. Therefore, the Group considers 1 January 2020 as the date of
acquisition and the Target Company was included in the scope of consolidation with effect
from 1 January 2020.
On 3 June 2020 (Beijing Time), SPV1 paid EUR90,727,000 to KLG Europe Holding B.V. for
its 20% equity in SPV2, as agreed in the SHARE SALE AND PURCHASE AGREEMENT.
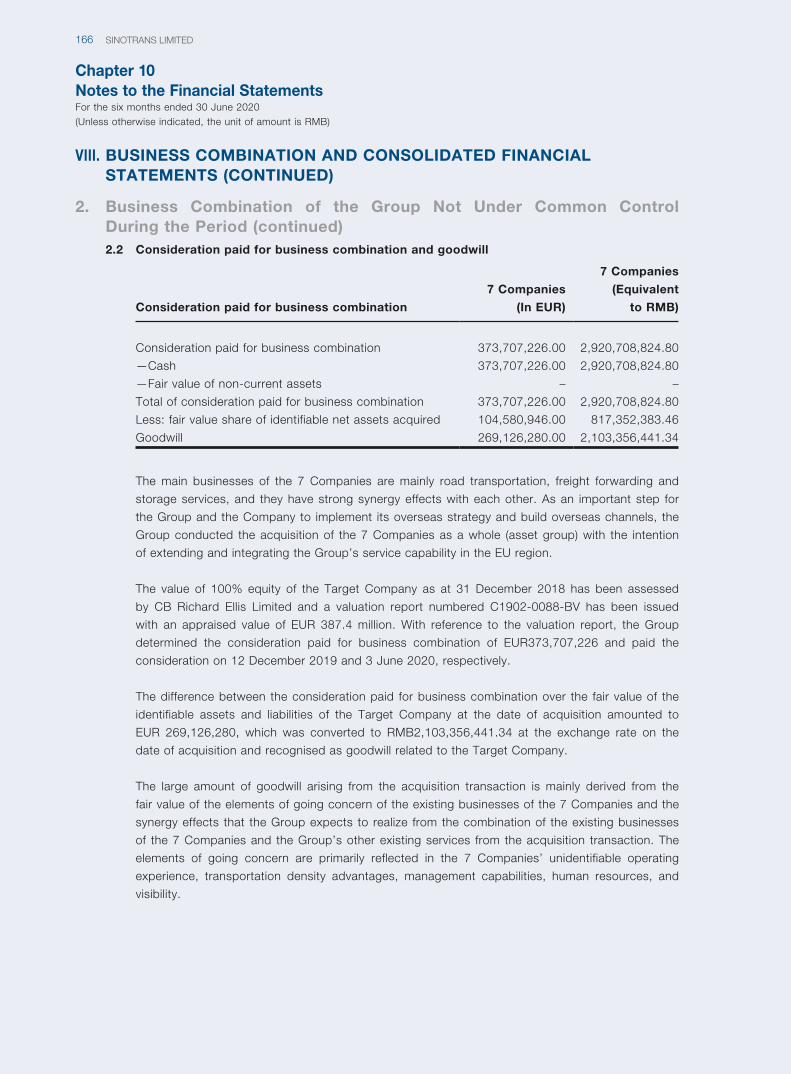
Chapter 10Notes to the Financial StatementsFor the six months ended 30 June 2020(Unless otherwise indicated, the unit of amount is RMB)
SINOTRANS LIMITED166
VIII. BUSINESS COMBINATION AND CONSOLIDATED FINANCIAL STATEMENTS (CONTINUED)
2. Business Combination of the Group Not Under Common Control During the Period (continued)2.2 Consideration paid for business combination and goodwill
Consideration paid for business combination
7 Companies
(In EUR)
7 Companies
(Equivalent
to RMB)
Consideration paid for business combination 373,707,226.00 2,920,708,824.80
—Cash 373,707,226.00 2,920,708,824.80
—Fair value of non-current assets – –
Total of consideration paid for business combination 373,707,226.00 2,920,708,824.80
Less: fair value share of identifiable net assets acquired 104,580,946.00 817,352,383.46
Goodwill 269,126,280.00 2,103,356,441.34
The main businesses of the 7 Companies are mainly road transportation, freight forwarding and
storage services, and they have strong synergy effects with each other. As an important step for
the Group and the Company to implement its overseas strategy and build overseas channels, the
Group conducted the acquisition of the 7 Companies as a whole (asset group) with the intention
of extending and integrating the Group’s service capability in the EU region.
The value of 100% equity of the Target Company as at 31 December 2018 has been assessed
by CB Richard Ellis Limited and a valuation report numbered C1902-0088-BV has been issued
with an appraised value of EUR 387.4 million. With reference to the valuation report, the Group
determined the consideration paid for business combination of EUR373,707,226 and paid the
consideration on 12 December 2019 and 3 June 2020, respectively.
The difference between the consideration paid for business combination over the fair value of the
identifiable assets and liabilities of the Target Company at the date of acquisition amounted to
EUR 269,126,280, which was converted to RMB2,103,356,441.34 at the exchange rate on the
date of acquisition and recognised as goodwill related to the Target Company.
The large amount of goodwill arising from the acquisition transaction is mainly derived from the
fair value of the elements of going concern of the existing businesses of the 7 Companies and the
synergy effects that the Group expects to realize from the combination of the existing businesses
of the 7 Companies and the Group’s other existing services from the acquisition transaction. The
elements of going concern are primarily reflected in the 7 Companies’ unidentifiable operating
experience, transportation density advantages, management capabilities, human resources, and
visibility.
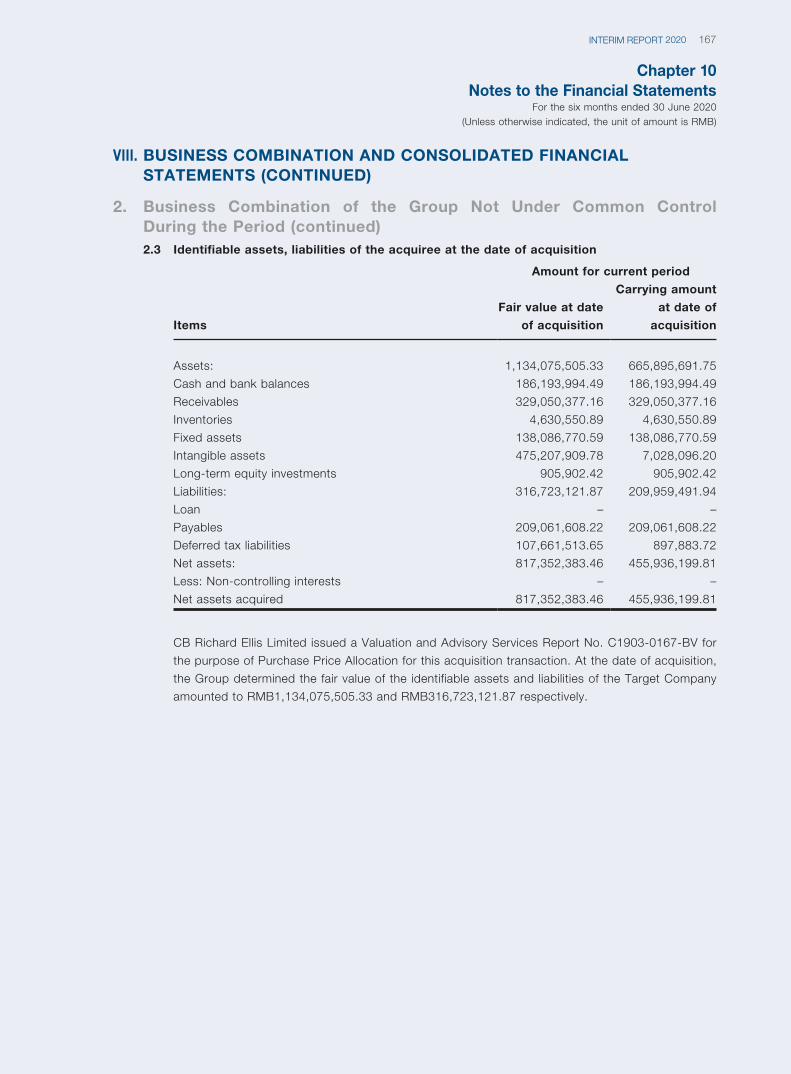
Chapter 10Notes to the Financial Statements
For the six months ended 30 June 2020(Unless otherwise indicated, the unit of amount is RMB)
167INTERIM REPORT 2020
VIII. BUSINESS COMBINATION AND CONSOLIDATED FINANCIAL STATEMENTS (CONTINUED)
2. Business Combination of the Group Not Under Common Control During the Period (continued)2.3 Identifiable assets, liabilities of the acquiree at the date of acquisition
Items
Amount for current period
Fair value at date
of acquisition
Carrying amount
at date of
acquisition
Assets: 1,134,075,505.33 665,895,691.75
Cash and bank balances 186,193,994.49 186,193,994.49
Receivables 329,050,377.16 329,050,377.16
Inventories 4,630,550.89 4,630,550.89
Fixed assets 138,086,770.59 138,086,770.59
Intangible assets 475,207,909.78 7,028,096.20
Long-term equity investments 905,902.42 905,902.42
Liabilities: 316,723,121.87 209,959,491.94
Loan – –
Payables 209,061,608.22 209,061,608.22
Deferred tax liabilities 107,661,513.65 897,883.72
Net assets: 817,352,383.46 455,936,199.81
Less: Non-controlling interests – –
Net assets acquired 817,352,383.46 455,936,199.81
CB Richard Ellis Limited issued a Valuation and Advisory Services Report No. C1903-0167-BV for
the purpose of Purchase Price Allocation for this acquisition transaction. At the date of acquisition,
the Group determined the fair value of the identifiable assets and liabilities of the Target Company
amounted to RMB1,134,075,505.33 and RMB316,723,121.87 respectively.
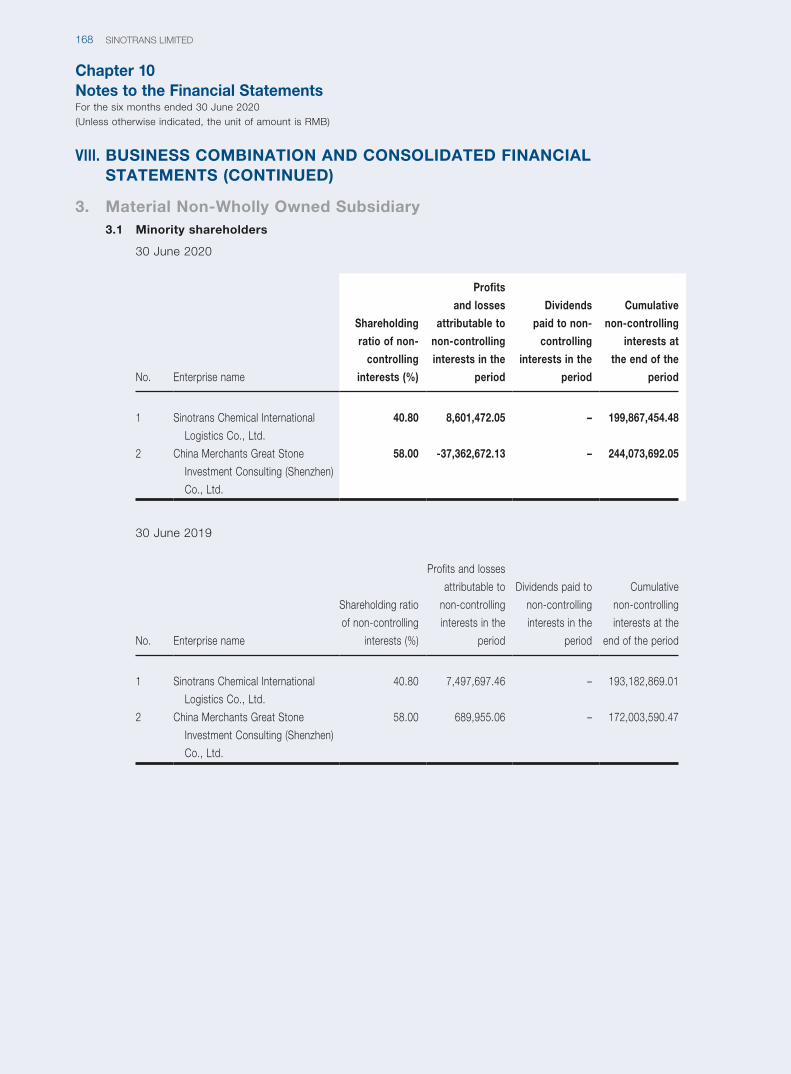
Chapter 10Notes to the Financial StatementsFor the six months ended 30 June 2020(Unless otherwise indicated, the unit of amount is RMB)
SINOTRANS LIMITED168
VIII. BUSINESS COMBINATION AND CONSOLIDATED FINANCIAL STATEMENTS (CONTINUED)
3. Material Non-Wholly Owned Subsidiary3.1 Minority shareholders
30 June 2020
No. Enterprise name
Shareholding
ratio of non-
controlling
interests (%)
Profits
and losses
attributable to
non-controlling
interests in the
period
Dividends
paid to non-
controlling
interests in the
period
Cumulative
non-controlling
interests at
the end of the
period
1 Sinotrans Chemical International
Logistics Co., Ltd.
40.80 8,601,472.05 – 199,867,454.48
2 China Merchants Great Stone
Investment Consulting (Shenzhen)
Co., Ltd.
58.00 -37,362,672.13 – 244,073,692.05
30 June 2019
No. Enterprise name
Shareholding ratio
of non-controlling
interests (%)
Profits and losses
attributable to
non-controlling
interests in the
period
Dividends paid to
non-controlling
interests in the
period
Cumulative
non-controlling
interests at the
end of the period
1 Sinotrans Chemical International
Logistics Co., Ltd.
40.80 7,497,697.46 – 193,182,869.01
2 China Merchants Great Stone
Investment Consulting (Shenzhen)
Co., Ltd.
58.00 689,955.06 – 172,003,590.47
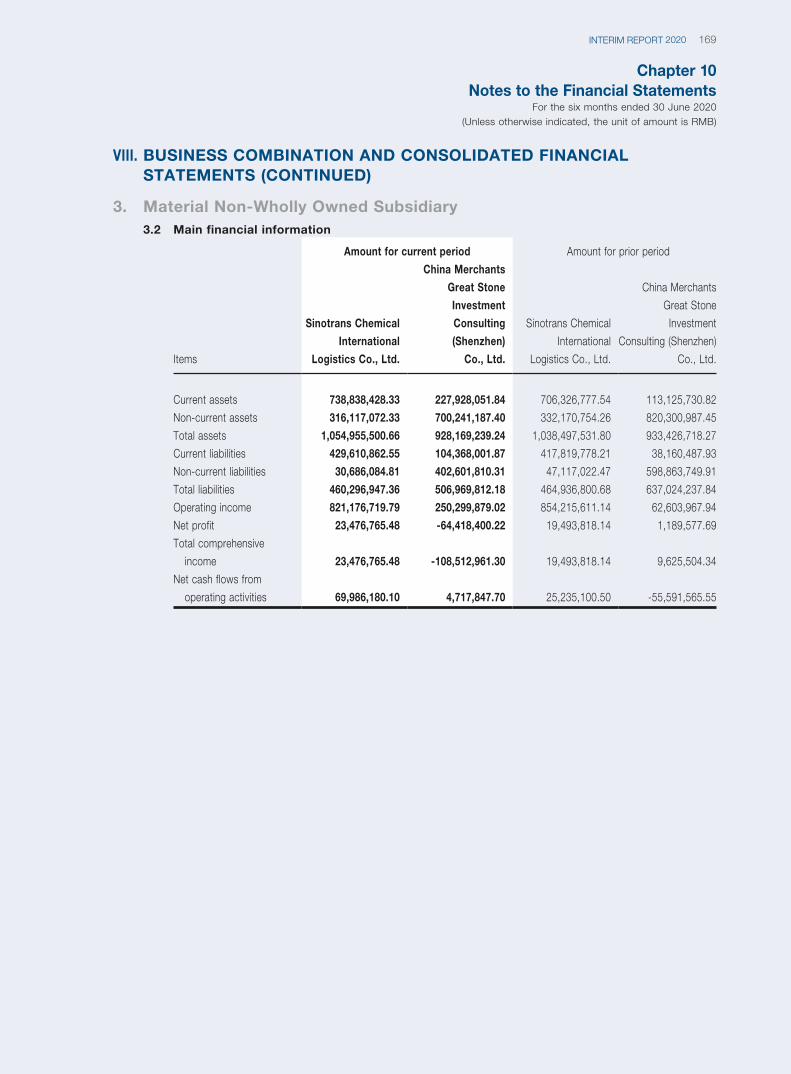
Chapter 10Notes to the Financial Statements
For the six months ended 30 June 2020(Unless otherwise indicated, the unit of amount is RMB)
169INTERIM REPORT 2020
VIII. BUSINESS COMBINATION AND CONSOLIDATED FINANCIAL STATEMENTS (CONTINUED)
3. Material Non-Wholly Owned Subsidiary3.2 Main financial information
Items
Amount for current period Amount for prior period
Sinotrans Chemical
International
Logistics Co., Ltd.
China Merchants
Great Stone
Investment
Consulting
(Shenzhen)
Co., Ltd.
Sinotrans Chemical
International
Logistics Co., Ltd.
China Merchants
Great Stone
Investment
Consulting (Shenzhen)
Co., Ltd.
Current assets 738,838,428.33 227,928,051.84 706,326,777.54 113,125,730.82
Non-current assets 316,117,072.33 700,241,187.40 332,170,754.26 820,300,987.45
Total assets 1,054,955,500.66 928,169,239.24 1,038,497,531.80 933,426,718.27
Current liabilities 429,610,862.55 104,368,001.87 417,819,778.21 38,160,487.93
Non-current liabilities 30,686,084.81 402,601,810.31 47,117,022.47 598,863,749.91
Total liabilities 460,296,947.36 506,969,812.18 464,936,800.68 637,024,237.84
Operating income 821,176,719.79 250,299,879.02 854,215,611.14 62,603,967.94
Net profit 23,476,765.48 -64,418,400.22 19,493,818.14 1,189,577.69
Total comprehensive
income 23,476,765.48 -108,512,961.30 19,493,818.14 9,625,504.34
Net cash flows from
operating activities 69,986,180.10 4,717,847.70 25,235,100.50 -55,591,565.55
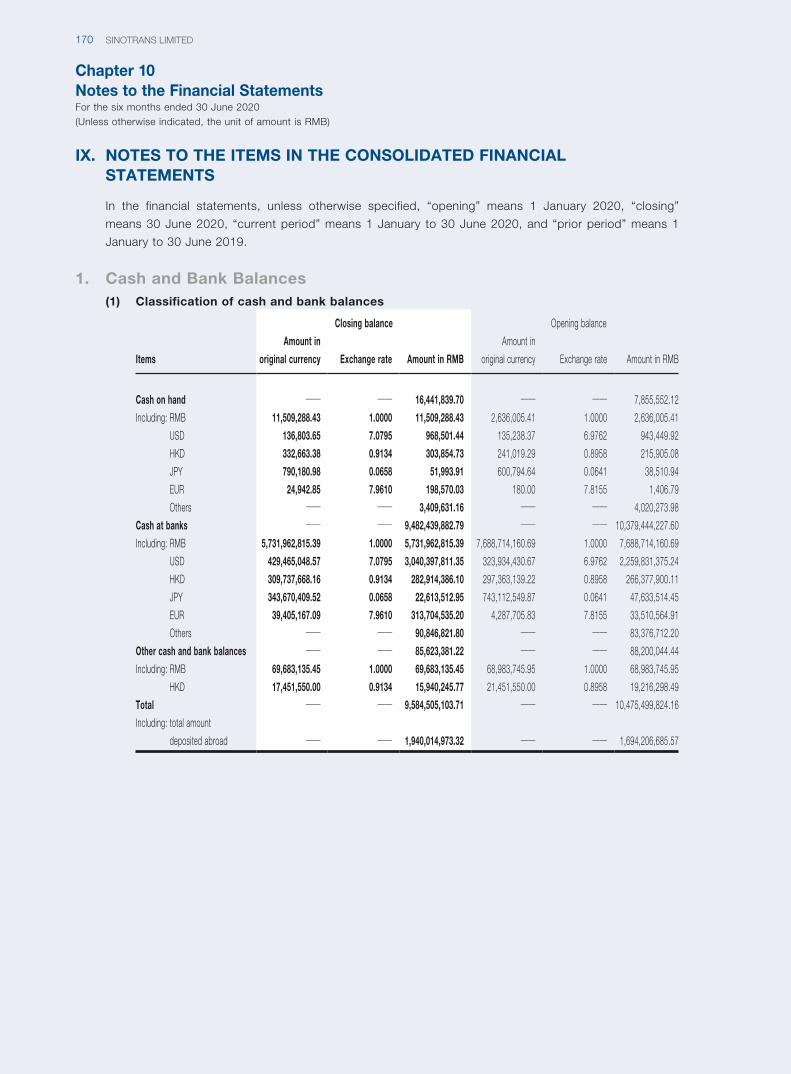
Chapter 10Notes to the Financial StatementsFor the six months ended 30 June 2020(Unless otherwise indicated, the unit of amount is RMB)
SINOTRANS LIMITED170
IX. NOTES TO THE ITEMS IN THE CONSOLIDATED FINANCIAL STATEMENTS
In the financial statements, unless otherwise specified, “opening” means 1 January 2020, “closing”
means 30 June 2020, “current period” means 1 January to 30 June 2020, and “prior period” means 1
January to 30 June 2019.
1. Cash and Bank Balances(1) Classification of cash and bank balances
Items
Closing balance Opening balance
Amount in
original currency Exchange rate Amount in RMB
Amount in
original currency Exchange rate Amount in RMB
Cash on hand —— —— 16,441,839.70 —— —— 7,855,552.12
Including: RMB 11,509,288.43 1.0000 11,509,288.43 2,636,005.41 1.0000 2,636,005.41
USD 136,803.65 7.0795 968,501.44 135,238.37 6.9762 943,449.92
HKD 332,663.38 0.9134 303,854.73 241,019.29 0.8958 215,905.08
JPY 790,180.98 0.0658 51,993.91 600,794.64 0.0641 38,510.94
EUR 24,942.85 7.9610 198,570.03 180.00 7.8155 1,406.79
Others —— —— 3,409,631.16 —— —— 4,020,273.98
Cash at banks —— —— 9,482,439,882.79 —— —— 10,379,444,227.60
Including: RMB 5,731,962,815.39 1.0000 5,731,962,815.39 7,688,714,160.69 1.0000 7,688,714,160.69
USD 429,465,048.57 7.0795 3,040,397,811.35 323,934,430.67 6.9762 2,259,831,375.24
HKD 309,737,668.16 0.9134 282,914,386.10 297,363,139.22 0.8958 266,377,900.11
JPY 343,670,409.52 0.0658 22,613,512.95 743,112,549.87 0.0641 47,633,514.45
EUR 39,405,167.09 7.9610 313,704,535.20 4,287,705.83 7.8155 33,510,564.91
Others —— —— 90,846,821.80 —— —— 83,376,712.20
Other cash and bank balances —— —— 85,623,381.22 —— —— 88,200,044.44
Including: RMB 69,683,135.45 1.0000 69,683,135.45 68,983,745.95 1.0000 68,983,745.95
HKD 17,451,550.00 0.9134 15,940,245.77 21,451,550.00 0.8958 19,216,298.49
Total —— —— 9,584,505,103.71 —— —— 10,475,499,824.16
Including: total amount
deposited abroad —— —— 1,940,014,973.32 —— —— 1,694,206,685.57
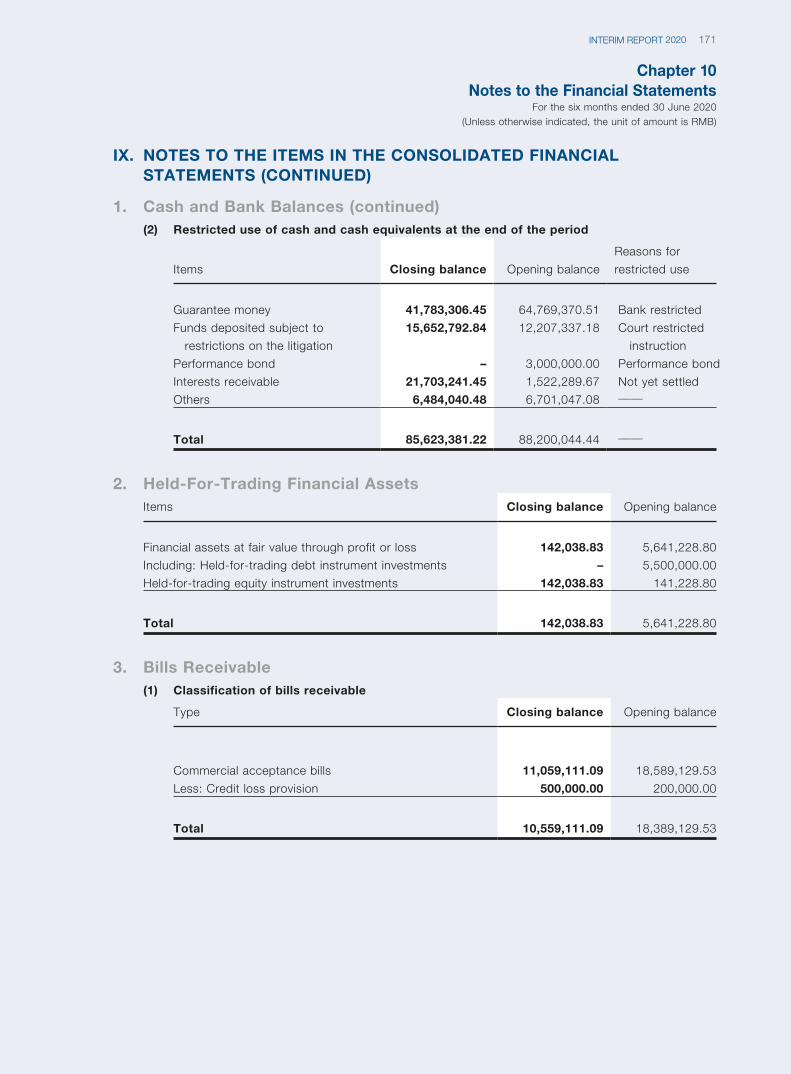
Chapter 10Notes to the Financial Statements
For the six months ended 30 June 2020(Unless otherwise indicated, the unit of amount is RMB)
171INTERIM REPORT 2020
IX. NOTES TO THE ITEMS IN THE CONSOLIDATED FINANCIAL STATEMENTS (CONTINUED)
1. Cash and Bank Balances (continued)(2) Restricted use of cash and cash equivalents at the end of the period
Items Closing balance Opening balance
Reasons for
restricted use
Guarantee money 41,783,306.45 64,769,370.51 Bank restricted
Funds deposited subject to
restrictions on the litigation
15,652,792.84 12,207,337.18 Court restricted
instruction
Performance bond – 3,000,000.00 Performance bond
Interests receivable 21,703,241.45 1,522,289.67 Not yet settled
Others 6,484,040.48 6,701,047.08 ——
Total 85,623,381.22 88,200,044.44 ——
2. Held-For-Trading Financial AssetsItems Closing balance Opening balance
Financial assets at fair value through profit or loss 142,038.83 5,641,228.80
Including: Held-for-trading debt instrument investments – 5,500,000.00
Held-for-trading equity instrument investments 142,038.83 141,228.80
Total 142,038.83 5,641,228.80
3. Bills Receivable(1) Classification of bills receivable
Type Closing balance Opening balance
Commercial acceptance bills 11,059,111.09 18,589,129.53
Less: Credit loss provision 500,000.00 200,000.00
Total 10,559,111.09 18,389,129.53
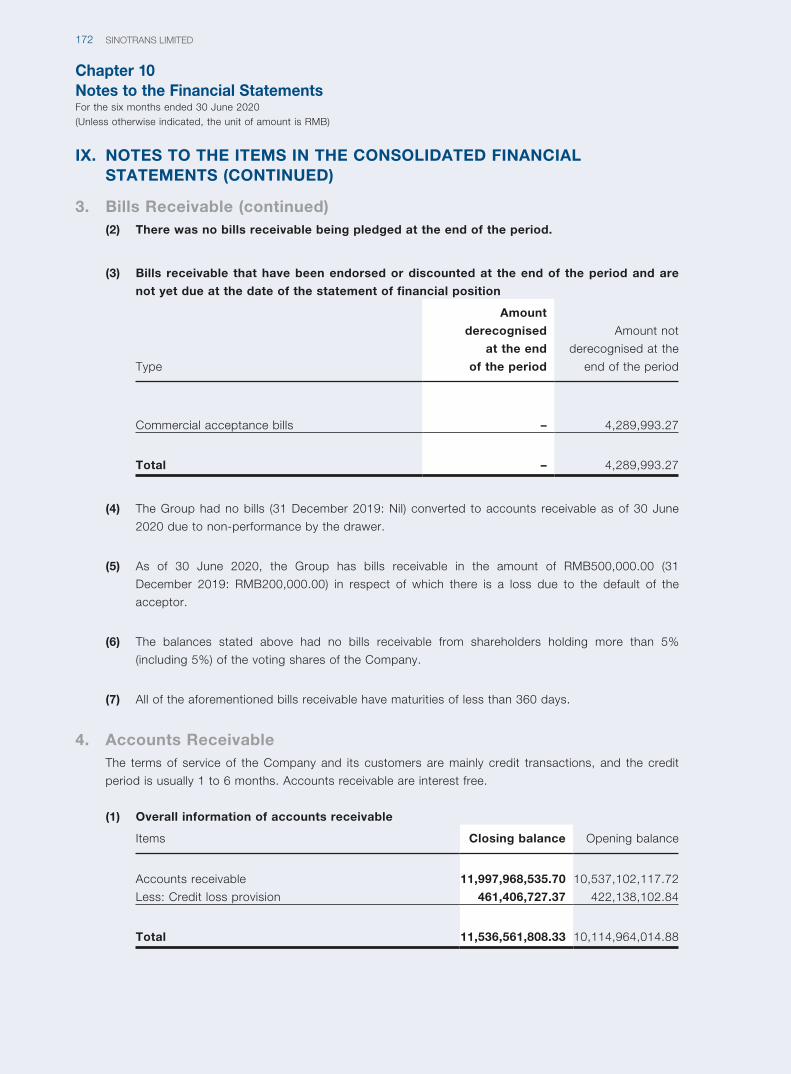
Chapter 10Notes to the Financial StatementsFor the six months ended 30 June 2020(Unless otherwise indicated, the unit of amount is RMB)
SINOTRANS LIMITED172
IX. NOTES TO THE ITEMS IN THE CONSOLIDATED FINANCIAL STATEMENTS (CONTINUED)
3. Bills Receivable (continued)(2) There was no bills receivable being pledged at the end of the period.
(3) Bills receivable that have been endorsed or discounted at the end of the period and are
not yet due at the date of the statement of financial position
Type
Amount
derecognised
at the end
of the period
Amount not
derecognised at the
end of the period
Commercial acceptance bills – 4,289,993.27
Total – 4,289,993.27
(4) The Group had no bills (31 December 2019: Nil) converted to accounts receivable as of 30 June
2020 due to non-performance by the drawer.
(5) As of 30 June 2020, the Group has bills receivable in the amount of RMB500,000.00 (31
December 2019: RMB200,000.00) in respect of which there is a loss due to the default of the
acceptor.
(6) The balances stated above had no bills receivable from shareholders holding more than 5%
(including 5%) of the voting shares of the Company.
(7) All of the aforementioned bills receivable have maturities of less than 360 days.
4. Accounts ReceivableThe terms of service of the Company and its customers are mainly credit transactions, and the credit
period is usually 1 to 6 months. Accounts receivable are interest free.
(1) Overall information of accounts receivable
Items Closing balance Opening balance
Accounts receivable 11,997,968,535.70 10,537,102,117.72
Less: Credit loss provision 461,406,727.37 422,138,102.84
Total 11,536,561,808.33 10,114,964,014.88
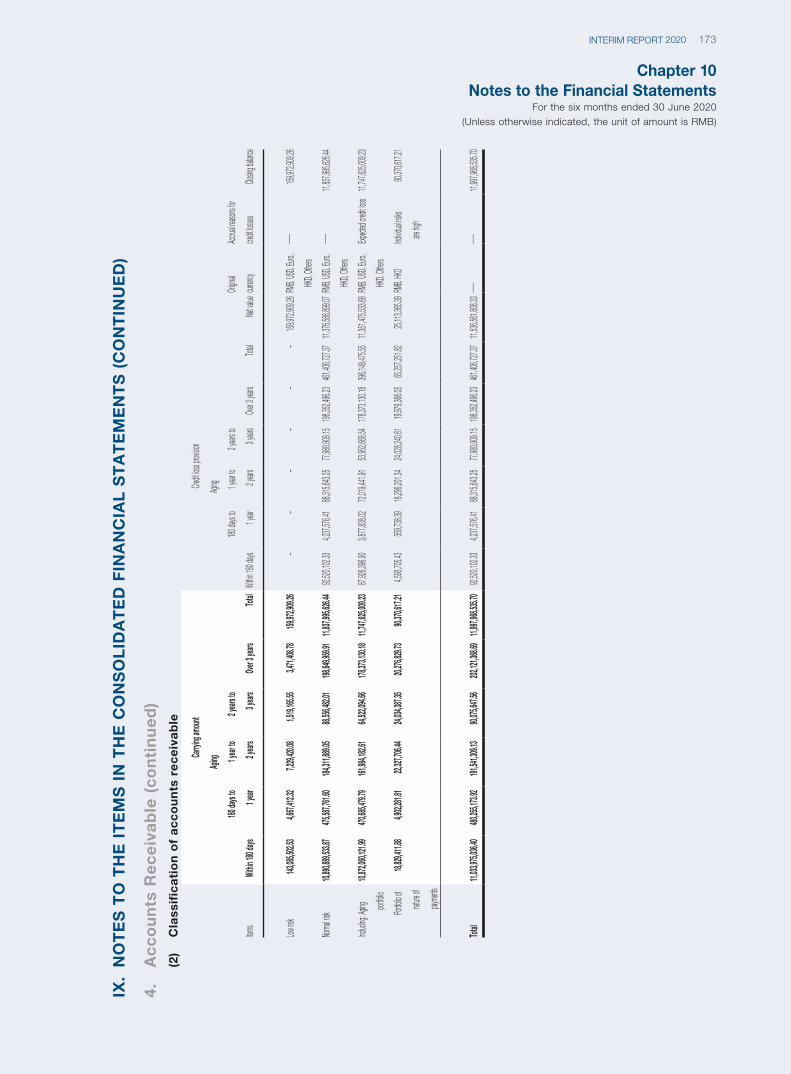
Chapter 10Notes to the Financial Statements
For the six months ended 30 June 2020(Unless otherwise indicated, the unit of amount is RMB)
173INTERIM REPORT 2020
IX.
NO
TE
S T
O T
HE
IT
EM
S I
N T
HE
CO
NS
OL
IDA
TE
D F
INA
NC
IAL
ST
AT
EM
EN
TS
(C
ON
TIN
UE
D)
4.
Ac
co
un
ts R
ec
eiv
ab
le (
co
nti
nu
ed
)(2
) C
lass
ific
ati
on
of
ac
co
un
ts r
ec
eiv
ab
le
Items
Carry
ing am
ount
Credit
loss pro
vision
Net va
lue
Origin
al
curren
cy
Accrua
l reaso
ns for
credit
losses
Closing
balan
ce
Aging
Total
Aging
Total
Within
180 d
ays
180 da
ys to
1 year
1 year
to
2 year
s
2 year
s to
3 year
sOv
er 3 y
ears
Within
180 d
ays
180 da
ys to
1 year
1 year
to
2 year
s
2 year
s to
3 year
sOve
r 3 yea
rs
Low ris
k143
,085,5
02.53
4,667,
412.32
7,229,
420.08
1,519,
165.55
3,471,
408.78
159,97
2,909.
26–
––
––
–159
,972,9
09.26
RMB,
USD,
Euro,
HKD,
Others
——159
,972,9
09.26
Norma
l risk
10,890
,889,5
33.87
475,58
7,761.
60184
,311,8
89.05
88,556
,482.0
1198
,649,9
59.91
11,837
,995,6
26.44
92,520
,102.3
34,2
37,576
.4188,
315,64
3.25
77,980
,909.1
5198
,352,4
96.23
461,40
6,727.
3711,
376,58
8,899.
07 RM
B, US
D, Eur
o,
HKD,
Others
——11,
837,99
5,626.
44
Includ
ing: Ag
ing
portf
olio
10,872
,060,1
21.99
470,68
5,479.
79161
,984,1
82.61
64,522
,094.6
6178
,373,1
30.18
11,747
,625,0
09.23
87,926
,396.9
03,8
77,838
.0272,
019,44
1.91
53,952
,668.5
4178
,373,1
30.18
396,14
9,475.
5511,
351,47
5,533.
68 RM
B, US
D, Eur
o,
HKD,
Others
Expect
ed cre
dit loss
11,747
,625,0
09.23
Portfol
io of
nature
of
payme
nts
18,829
,411.8
84,9
02,281
.8122,
327,70
6.44
24,034
,387.3
520,
276,82
9.73
90,370
,617.2
14,5
93,705
.43359
,738.3
916,
296,20
1.34
24,028
,240.6
119,
979,36
6.05
65,257
,251.8
225,
113,36
5.39
RMB,
HKD
Individ
ual ris
ks
are h
igh
90,370
,617.2
1
Total
11,033
,975,0
36.40
480,25
5,173.
92191
,541,3
09.13
90,075
,647.5
6202
,121,3
68.69
11,997
,968,5
35.70
92,520
,102.3
34,2
37,576
.4188,
315,64
3.25
77,980
,909.1
5198
,352,4
96.23
461,40
6,727.
3711,
536,56
1,808.
33 ——
——11,
997,96
8,535.
70
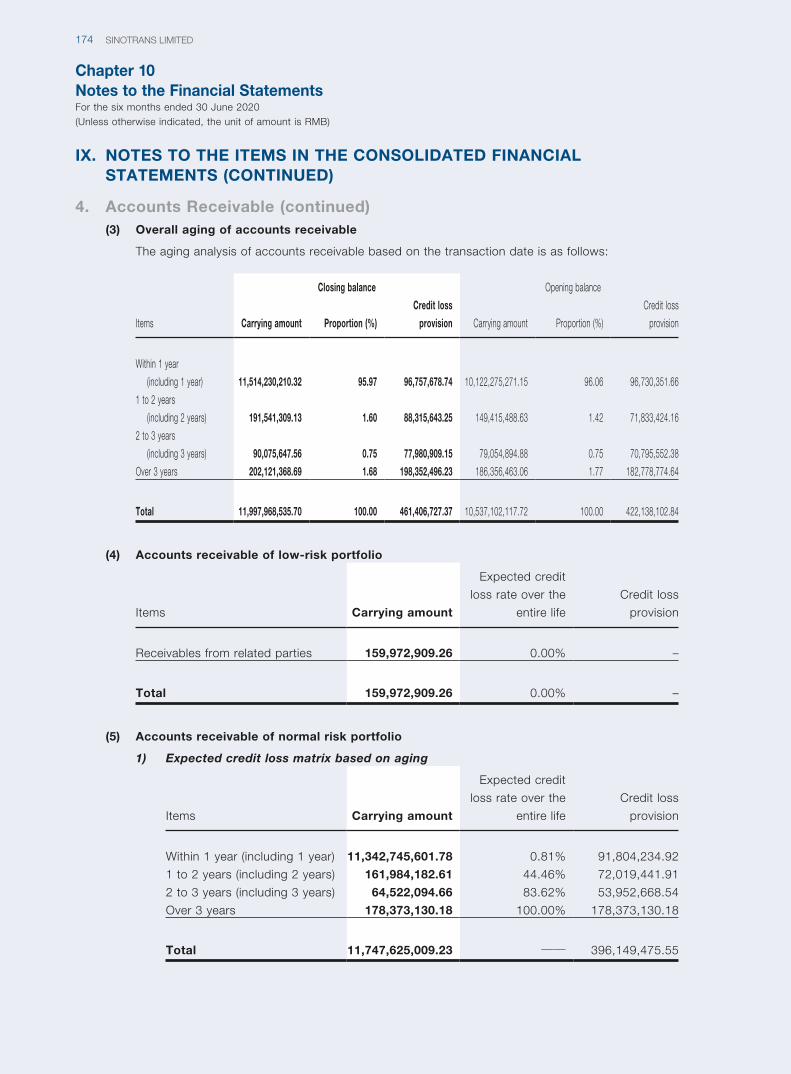
Chapter 10Notes to the Financial StatementsFor the six months ended 30 June 2020(Unless otherwise indicated, the unit of amount is RMB)
SINOTRANS LIMITED174
IX. NOTES TO THE ITEMS IN THE CONSOLIDATED FINANCIAL STATEMENTS (CONTINUED)
4. Accounts Receivable (continued)(3) Overall aging of accounts receivable
The aging analysis of accounts receivable based on the transaction date is as follows:
Items
Closing balance Opening balance
Carrying amount Proportion (%)
Credit loss
provision Carrying amount Proportion (%)
Credit loss
provision
Within 1 year
(including 1 year) 11,514,230,210.32 95.97 96,757,678.74 10,122,275,271.15 96.06 96,730,351.66
1 to 2 years
(including 2 years) 191,541,309.13 1.60 88,315,643.25 149,415,488.63 1.42 71,833,424.16
2 to 3 years
(including 3 years) 90,075,647.56 0.75 77,980,909.15 79,054,894.88 0.75 70,795,552.38
Over 3 years 202,121,368.69 1.68 198,352,496.23 186,356,463.06 1.77 182,778,774.64
Total 11,997,968,535.70 100.00 461,406,727.37 10,537,102,117.72 100.00 422,138,102.84
(4) Accounts receivable of low-risk portfolio
Items Carrying amount
Expected credit
loss rate over the
entire life
Credit loss
provision
Receivables from related parties 159,972,909.26 0.00% –
Total 159,972,909.26 0.00% –
(5) Accounts receivable of normal risk portfolio
1) Expected credit loss matrix based on aging
Items Carrying amount
Expected credit
loss rate over the
entire life
Credit loss
provision
Within 1 year (including 1 year) 11,342,745,601.78 0.81% 91,804,234.92
1 to 2 years (including 2 years) 161,984,182.61 44.46% 72,019,441.91
2 to 3 years (including 3 years) 64,522,094.66 83.62% 53,952,668.54
Over 3 years 178,373,130.18 100.00% 178,373,130.18
Total 11,747,625,009.23 —— 396,149,475.55
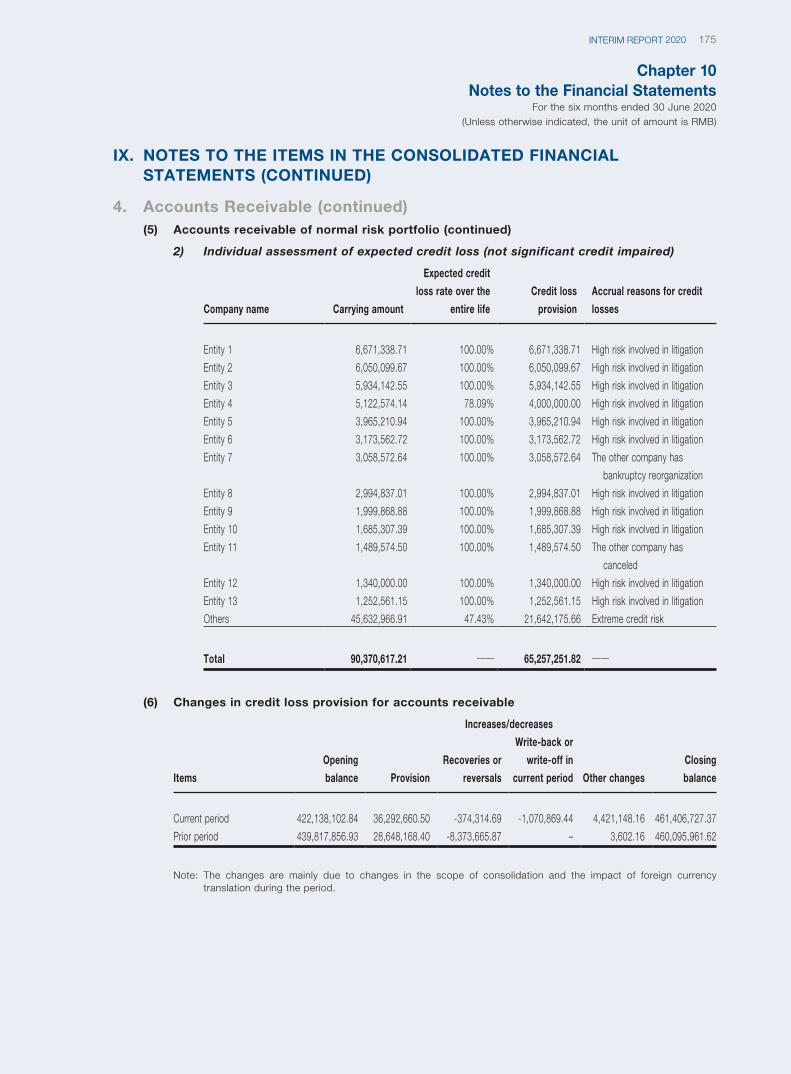
Chapter 10Notes to the Financial Statements
For the six months ended 30 June 2020(Unless otherwise indicated, the unit of amount is RMB)
175INTERIM REPORT 2020
IX. NOTES TO THE ITEMS IN THE CONSOLIDATED FINANCIAL STATEMENTS (CONTINUED)
4. Accounts Receivable (continued)(5) Accounts receivable of normal risk portfolio (continued)
2) Individual assessment of expected credit loss (not significant credit impaired)
Company name Carrying amount
Expected credit
loss rate over the
entire life
Credit loss
provision
Accrual reasons for credit
losses
Entity 1 6,671,338.71 100.00% 6,671,338.71 High risk involved in litigation
Entity 2 6,050,099.67 100.00% 6,050,099.67 High risk involved in litigation
Entity 3 5,934,142.55 100.00% 5,934,142.55 High risk involved in litigation
Entity 4 5,122,574.14 78.09% 4,000,000.00 High risk involved in litigation
Entity 5 3,965,210.94 100.00% 3,965,210.94 High risk involved in litigation
Entity 6 3,173,562.72 100.00% 3,173,562.72 High risk involved in litigation
Entity 7 3,058,572.64 100.00% 3,058,572.64 The other company has
bankruptcy reorganization
Entity 8 2,994,837.01 100.00% 2,994,837.01 High risk involved in litigation
Entity 9 1,999,868.88 100.00% 1,999,868.88 High risk involved in litigation
Entity 10 1,685,307.39 100.00% 1,685,307.39 High risk involved in litigation
Entity 11 1,489,574.50 100.00% 1,489,574.50 The other company has
canceled
Entity 12 1,340,000.00 100.00% 1,340,000.00 High risk involved in litigation
Entity 13 1,252,561.15 100.00% 1,252,561.15 High risk involved in litigation
Others 45,632,966.91 47.43% 21,642,175.66 Extreme credit risk
Total 90,370,617.21 —— 65,257,251.82 ——
(6) Changes in credit loss provision for accounts receivable
Items
Opening
balance
Increases/decreases
Closing
balanceProvision
Recoveries or
reversals
Write-back or
write-off in
current period Other changes
Current period 422,138,102.84 36,292,660.50 -374,314.69 -1,070,869.44 4,421,148.16 461,406,727.37
Prior period 439,817,856.93 28,648,168.40 -8,373,665.87 – 3,602.16 460,095,961.62
Note: The changes are mainly due to changes in the scope of consolidation and the impact of foreign currency translation during the period.
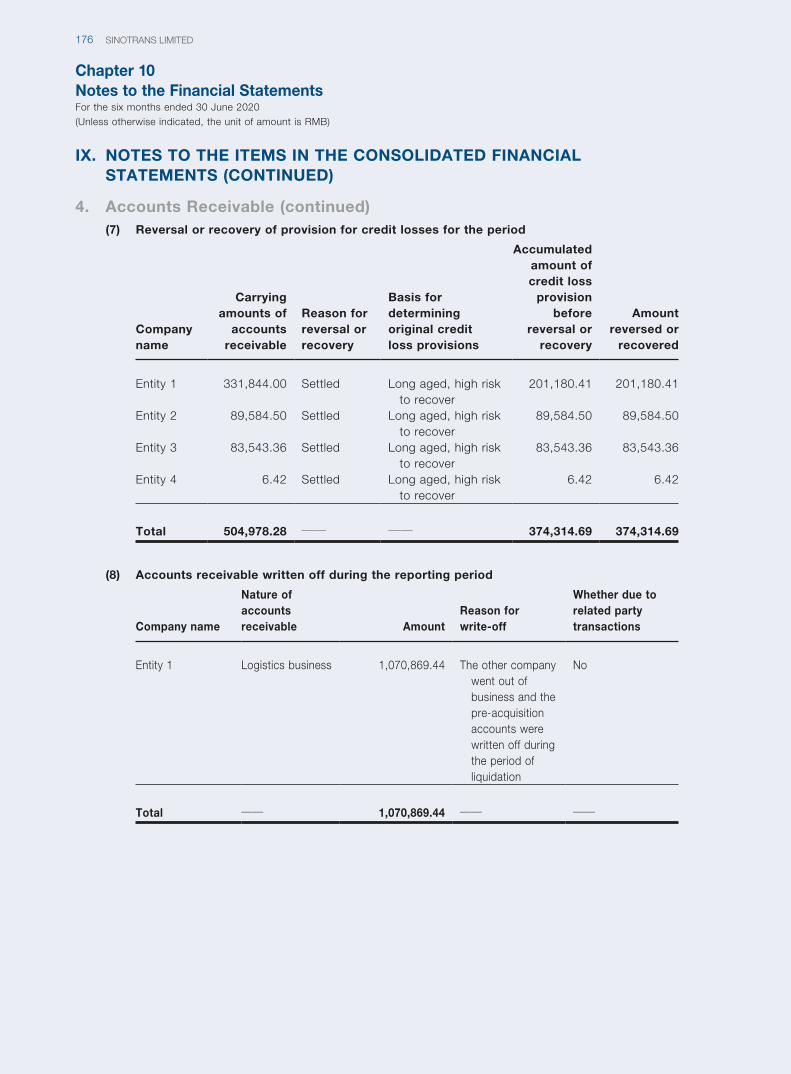
Chapter 10Notes to the Financial StatementsFor the six months ended 30 June 2020(Unless otherwise indicated, the unit of amount is RMB)
SINOTRANS LIMITED176
IX. NOTES TO THE ITEMS IN THE CONSOLIDATED FINANCIAL STATEMENTS (CONTINUED)
4. Accounts Receivable (continued)(7) Reversal or recovery of provision for credit losses for the period
Company name
Carrying amounts of
accounts receivable
Reason for reversal or recovery
Basis for determining original credit loss provisions
Accumulated amount of credit loss
provision before
reversal or recovery
Amount reversed or
recovered
Entity 1 331,844.00 Settled Long aged, high risk to recover
201,180.41 201,180.41
Entity 2 89,584.50 Settled Long aged, high risk to recover
89,584.50 89,584.50
Entity 3 83,543.36 Settled Long aged, high risk to recover
83,543.36 83,543.36
Entity 4 6.42 Settled Long aged, high risk to recover
6.42 6.42
Total 504,978.28 —— —— 374,314.69 374,314.69
(8) Accounts receivable written off during the reporting period
Company name
Nature of accounts receivable Amount
Reason for write-off
Whether due to related party transactions
Entity 1 Logistics business 1,070,869.44 The other company went out of business and the pre-acquisition accounts were written off during the period of liquidation
No
Total —— 1,070,869.44 —— ——
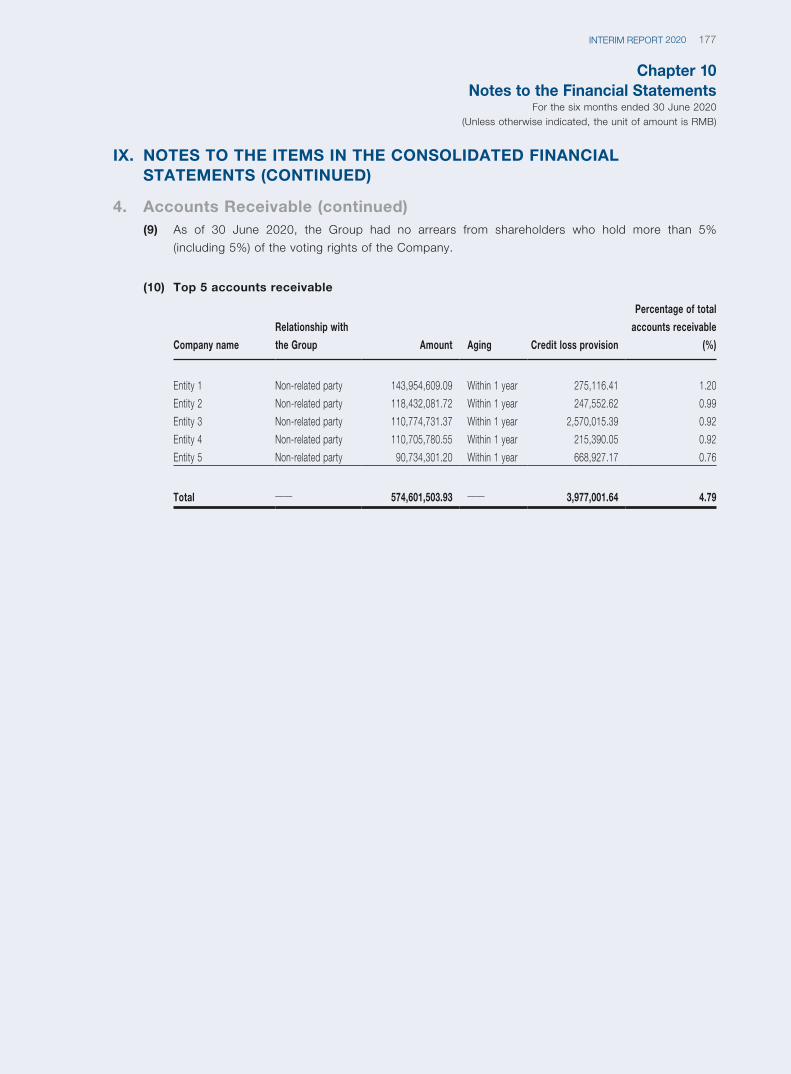
Chapter 10Notes to the Financial Statements
For the six months ended 30 June 2020(Unless otherwise indicated, the unit of amount is RMB)
177INTERIM REPORT 2020
IX. NOTES TO THE ITEMS IN THE CONSOLIDATED FINANCIAL STATEMENTS (CONTINUED)
4. Accounts Receivable (continued)(9) As of 30 June 2020, the Group had no arrears from shareholders who hold more than 5%
(including 5%) of the voting rights of the Company.
(10) Top 5 accounts receivable
Company name
Relationship with
the Group Amount Aging Credit loss provision
Percentage of total
accounts receivable
(%)
Entity 1 Non-related party 143,954,609.09 Within 1 year 275,116.41 1.20
Entity 2 Non-related party 118,432,081.72 Within 1 year 247,552.62 0.99
Entity 3 Non-related party 110,774,731.37 Within 1 year 2,570,015.39 0.92
Entity 4 Non-related party 110,705,780.55 Within 1 year 215,390.05 0.92
Entity 5 Non-related party 90,734,301.20 Within 1 year 668,927.17 0.76
Total —— 574,601,503.93 —— 3,977,001.64 4.79
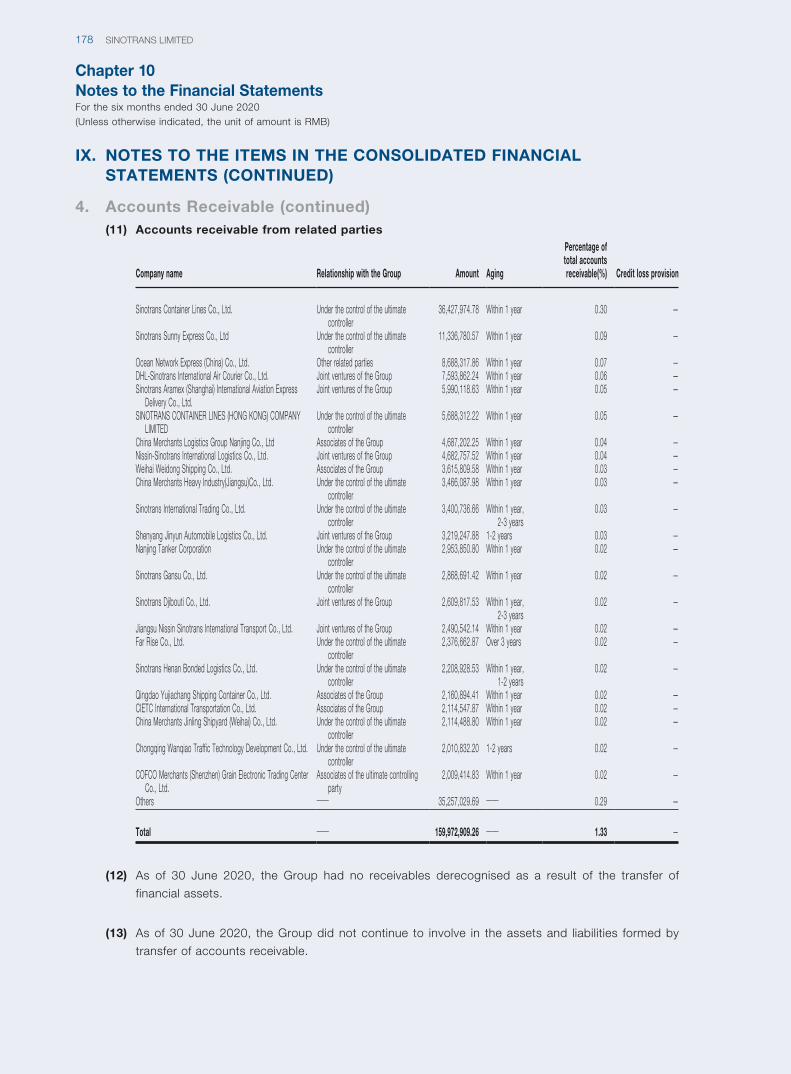
Chapter 10Notes to the Financial StatementsFor the six months ended 30 June 2020(Unless otherwise indicated, the unit of amount is RMB)
SINOTRANS LIMITED178
IX. NOTES TO THE ITEMS IN THE CONSOLIDATED FINANCIAL STATEMENTS (CONTINUED)
4. Accounts Receivable (continued)(11) Accounts receivable from related parties
Company name Relationship with the Group Amount Aging
Percentage of total accounts receivable(%) Credit loss provision
Sinotrans Container Lines Co., Ltd. Under the control of the ultimate controller
36,427,974.78 Within 1 year 0.30 —
Sinotrans Sunny Express Co., Ltd Under the control of the ultimate controller
11,336,780.57 Within 1 year 0.09 —
Ocean Network Express (China) Co., Ltd. Other related parties 8,688,317.86 Within 1 year 0.07 —DHL-Sinotrans International Air Courier Co., Ltd. Joint ventures of the Group 7,593,862.24 Within 1 year 0.06 —Sinotrans Aramex (Shanghai) International Aviation Express
Delivery Co., Ltd.Joint ventures of the Group 5,990,118.63 Within 1 year 0.05 —
SINOTRANS CONTAINER LINES (HONG KONG) COMPANY LIMITED
Under the control of the ultimate controller
5,688,312.22 Within 1 year 0.05 —
China Merchants Logistics Group Nanjing Co., Ltd Associates of the Group 4,687,202.25 Within 1 year 0.04 —Nissin-Sinotrans International Logistics Co., Ltd. Joint ventures of the Group 4,682,757.52 Within 1 year 0.04 —Weihai Weidong Shipping Co., Ltd. Associates of the Group 3,615,809.58 Within 1 year 0.03 —China Merchants Heavy Industry(Jiangsu)Co., Ltd. Under the control of the ultimate
controller3,466,087.98 Within 1 year 0.03 —
Sinotrans International Trading Co., Ltd. Under the control of the ultimate controller
3,400,736.66 Within 1 year, 2-3 years
0.03 —
Shenyang Jinyun Automobile Logistics Co., Ltd. Joint ventures of the Group 3,219,247.88 1-2 years 0.03 —Nanjing Tanker Corporation Under the control of the ultimate
controller2,953,850.80 Within 1 year 0.02 —
Sinotrans Gansu Co., Ltd. Under the control of the ultimate controller
2,868,691.42 Within 1 year 0.02 —
Sinotrans Djibouti Co., Ltd. Joint ventures of the Group 2,609,817.53 Within 1 year, 2-3 years
0.02 —
Jiangsu Nissin Sinotrans International Transport Co., Ltd. Joint ventures of the Group 2,490,542.14 Within 1 year 0.02 —Far Rise Co., Ltd. Under the control of the ultimate
controller2,376,662.87 Over 3 years 0.02 —
Sinotrans Henan Bonded Logistics Co., Ltd. Under the control of the ultimate controller
2,208,928.53 Within 1 year, 1-2 years
0.02 —
Qingdao Yujiachang Shipping Container Co., Ltd. Associates of the Group 2,160,894.41 Within 1 year 0.02 —CIETC International Transportation Co., Ltd. Associates of the Group 2,114,547.87 Within 1 year 0.02 —China Merchants Jinling Shipyard (Weihai) Co., Ltd. Under the control of the ultimate
controller2,114,488.80 Within 1 year 0.02 —
Chongqing Wanqiao Traffic Technology Development Co., Ltd. Under the control of the ultimate controller
2,010,832.20 1-2 years 0.02 —
COFCO Merchants (Shenzhen) Grain Electronic Trading Center Co., Ltd.
Associates of the ultimate controlling party
2,009,414.83 Within 1 year 0.02 —
Others —— 35,257,029.69 —— 0.29 —
Total —— 159,972,909.26 —— 1.33 —
(12) As of 30 June 2020, the Group had no receivables derecognised as a result of the transfer of
financial assets.
(13) As of 30 June 2020, the Group did not continue to involve in the assets and liabilities formed by
transfer of accounts receivable.
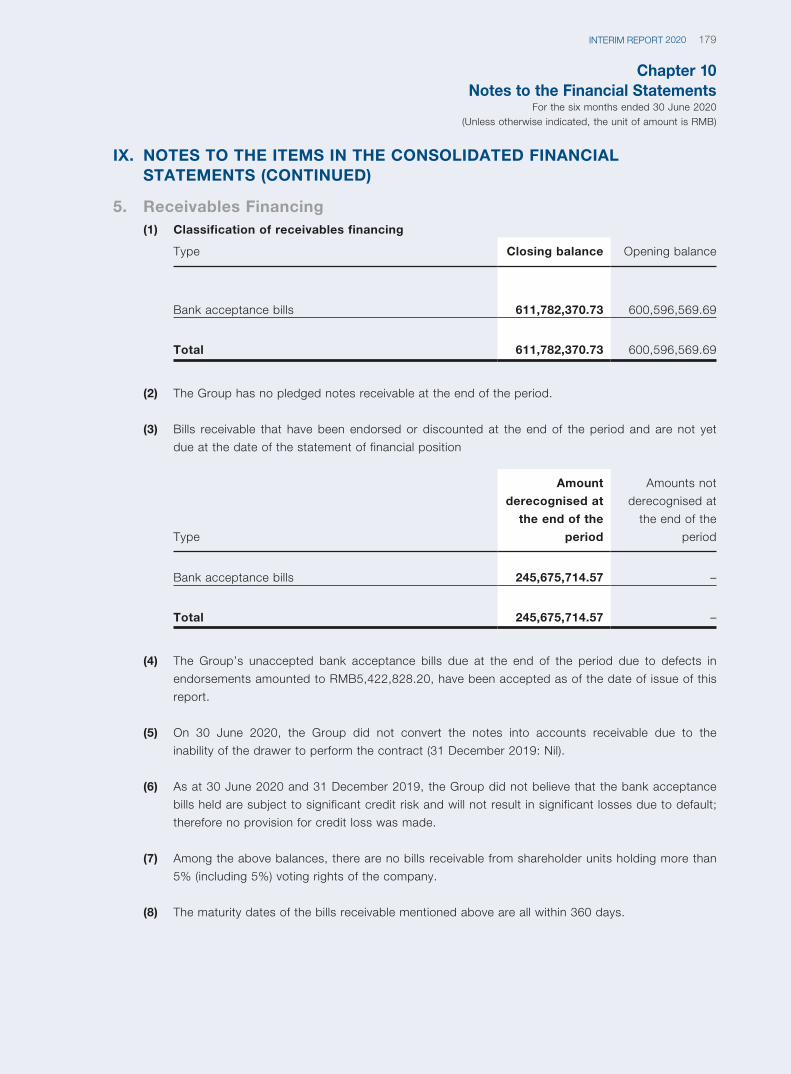
Chapter 10Notes to the Financial Statements
For the six months ended 30 June 2020(Unless otherwise indicated, the unit of amount is RMB)
179INTERIM REPORT 2020
IX. NOTES TO THE ITEMS IN THE CONSOLIDATED FINANCIAL STATEMENTS (CONTINUED)
5. Receivables Financing(1) Classification of receivables financing
Type Closing balance Opening balance
Bank acceptance bills 611,782,370.73 600,596,569.69
Total 611,782,370.73 600,596,569.69
(2) The Group has no pledged notes receivable at the end of the period.
(3) Bills receivable that have been endorsed or discounted at the end of the period and are not yet
due at the date of the statement of financial position
Type
Amount
derecognised at
the end of the
period
Amounts not
derecognised at
the end of the
period
Bank acceptance bills 245,675,714.57 –
Total 245,675,714.57 –
(4) The Group’s unaccepted bank acceptance bills due at the end of the period due to defects in
endorsements amounted to RMB5,422,828.20, have been accepted as of the date of issue of this
report.
(5) On 30 June 2020, the Group did not convert the notes into accounts receivable due to the
inability of the drawer to perform the contract (31 December 2019: Nil).
(6) As at 30 June 2020 and 31 December 2019, the Group did not believe that the bank acceptance
bills held are subject to significant credit risk and will not result in significant losses due to default;
therefore no provision for credit loss was made.
(7) Among the above balances, there are no bills receivable from shareholder units holding more than
5% (including 5%) voting rights of the company.
(8) The maturity dates of the bills receivable mentioned above are all within 360 days.
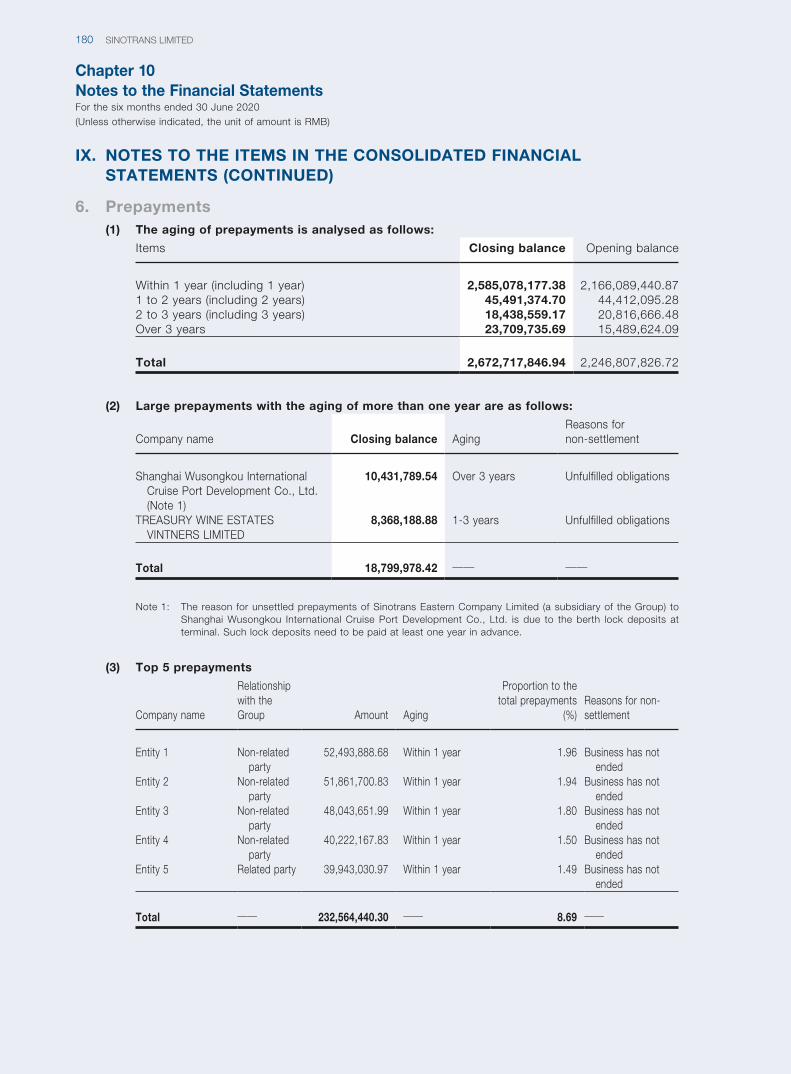
Chapter 10Notes to the Financial StatementsFor the six months ended 30 June 2020(Unless otherwise indicated, the unit of amount is RMB)
SINOTRANS LIMITED180
IX. NOTES TO THE ITEMS IN THE CONSOLIDATED FINANCIAL STATEMENTS (CONTINUED)
6. Prepayments(1) The aging of prepayments is analysed as follows:
Items Closing balance Opening balance
Within 1 year (including 1 year) 2,585,078,177.38 2,166,089,440.871 to 2 years (including 2 years) 45,491,374.70 44,412,095.282 to 3 years (including 3 years) 18,438,559.17 20,816,666.48Over 3 years 23,709,735.69 15,489,624.09
Total 2,672,717,846.94 2,246,807,826.72
(2) Large prepayments with the aging of more than one year are as follows:
Company name Closing balance AgingReasons for non-settlement
Shanghai Wusongkou International Cruise Port Development Co., Ltd. (Note 1)
10,431,789.54 Over 3 years Unfulfilled obligations
TREASURY WINE ESTATES VINTNERS LIMITED
8,368,188.88 1-3 years Unfulfilled obligations
Total 18,799,978.42 —— ——
Note 1: The reason for unsettled prepayments of Sinotrans Eastern Company Limited (a subsidiary of the Group) to Shanghai Wusongkou International Cruise Port Development Co., Ltd. is due to the berth lock deposits at terminal. Such lock deposits need to be paid at least one year in advance.
(3) Top 5 prepayments
Company name
Relationship with the Group Amount Aging
Proportion to the total prepayments
(%)Reasons for non-settlement
Entity 1 Non-related party
52,493,888.68 Within 1 year 1.96 Business has not ended
Entity 2 Non-related party
51,861,700.83 Within 1 year 1.94 Business has not ended
Entity 3 Non-related party
48,043,651.99 Within 1 year 1.80 Business has not ended
Entity 4 Non-related party
40,222,167.83 Within 1 year 1.50 Business has not ended
Entity 5 Related party 39,943,030.97 Within 1 year 1.49 Business has not ended
Total —— 232,564,440.30 —— 8.69 ——
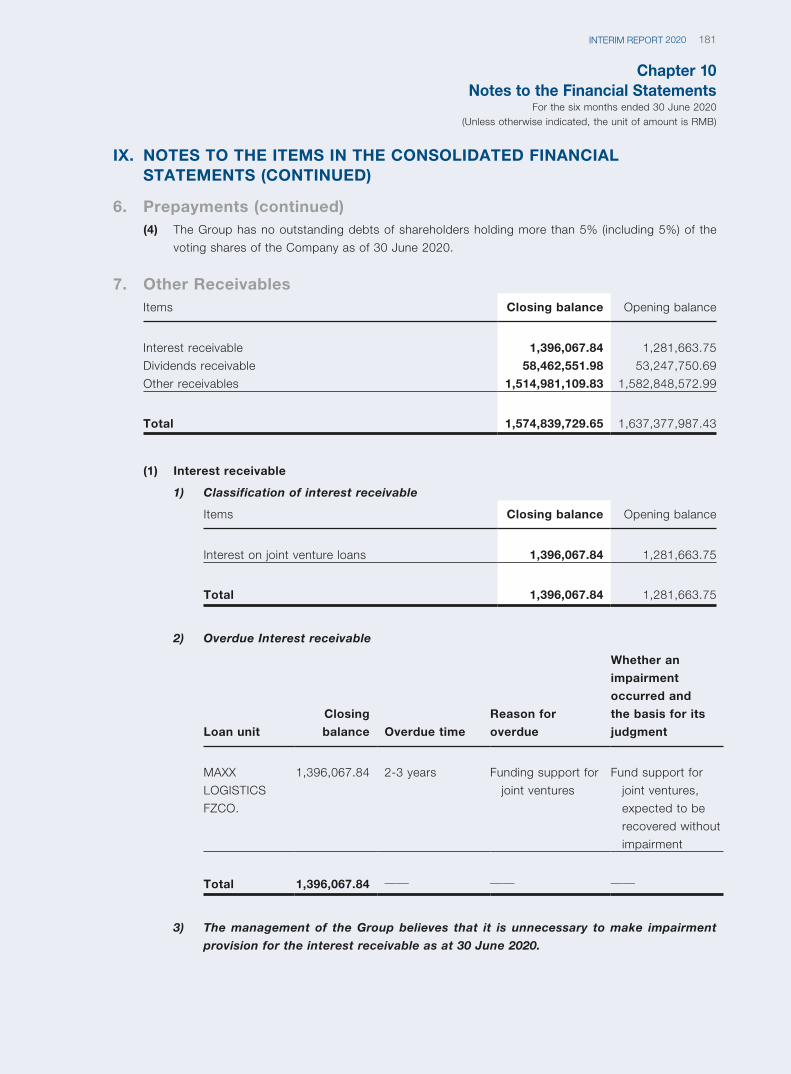
Chapter 10Notes to the Financial Statements
For the six months ended 30 June 2020(Unless otherwise indicated, the unit of amount is RMB)
181INTERIM REPORT 2020
IX. NOTES TO THE ITEMS IN THE CONSOLIDATED FINANCIAL STATEMENTS (CONTINUED)
6. Prepayments (continued)(4) The Group has no outstanding debts of shareholders holding more than 5% (including 5%) of the
voting shares of the Company as of 30 June 2020.
7. Other ReceivablesItems Closing balance Opening balance
Interest receivable 1,396,067.84 1,281,663.75
Dividends receivable 58,462,551.98 53,247,750.69
Other receivables 1,514,981,109.83 1,582,848,572.99
Total 1,574,839,729.65 1,637,377,987.43
(1) Interest receivable
1) Classification of interest receivable
Items Closing balance Opening balance
Interest on joint venture loans 1,396,067.84 1,281,663.75
Total 1,396,067.84 1,281,663.75
2) Overdue Interest receivable
Loan unit
Closing
balance Overdue time
Reason for
overdue
Whether an
impairment
occurred and
the basis for its
judgment
MAXX
LOGISTICS
FZCO.
1,396,067.84 2-3 years Funding support for
joint ventures
Fund support for
joint ventures,
expected to be
recovered without
impairment
Total 1,396,067.84 —— —— ——
3) The management of the Group believes that it is unnecessary to make impairment
provision for the interest receivable as at 30 June 2020.
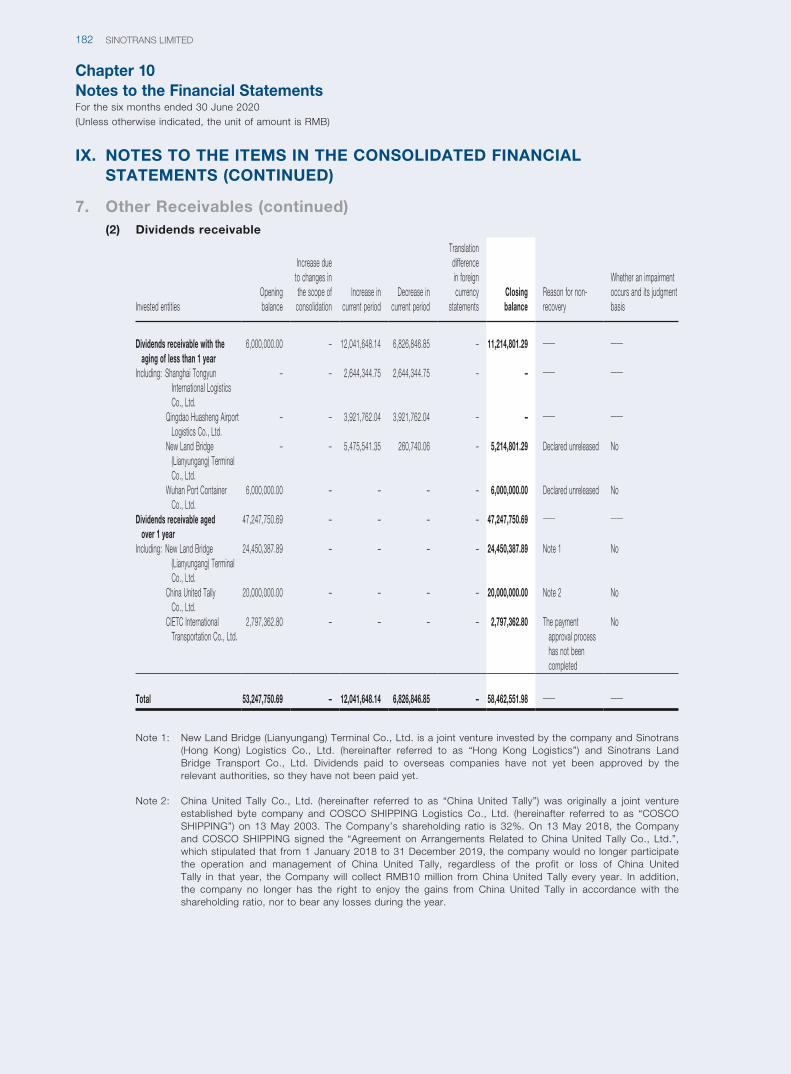
Chapter 10Notes to the Financial StatementsFor the six months ended 30 June 2020(Unless otherwise indicated, the unit of amount is RMB)
SINOTRANS LIMITED182
IX. NOTES TO THE ITEMS IN THE CONSOLIDATED FINANCIAL STATEMENTS (CONTINUED)
7. Other Receivables (continued)(2) Dividends receivable
Invested entitiesOpening balance
Increase due to changes in the scope of
consolidationIncrease in
current periodDecrease in
current period
Translation difference in foreign currency
statementsClosing balance
Reason for non-recovery
Whether an impairment occurs and its judgment basis
Dividends receivable with the aging of less than 1 year
6,000,000.00 – 12,041,648.14 6,826,846.85 – 11,214,801.29 —— ——
Including: Shanghai Tongyun International Logistics Co., Ltd.
– – 2,644,344.75 2,644,344.75 – – —— ——
Qingdao Huasheng Airport Logistics Co., Ltd.
– – 3,921,762.04 3,921,762.04 – – —— ——
New Land Bridge (Lianyungang) Terminal Co., Ltd.
– – 5,475,541.35 260,740.06 – 5,214,801.29 Declared unreleased No
Wuhan Port Container Co., Ltd.
6,000,000.00 – – – – 6,000,000.00 Declared unreleased No
Dividends receivable aged over 1 year
47,247,750.69 – – – – 47,247,750.69 —— ——
Including: New Land Bridge (Lianyungang) Terminal Co., Ltd.
24,450,387.89 – – – – 24,450,387.89 Note 1 No
China United Tally Co., Ltd.
20,000,000.00 – – – – 20,000,000.00 Note 2 No
CIETC International Transportation Co., Ltd.
2,797,362.80 – – – – 2,797,362.80 The payment approval process has not been completed
No
Total 53,247,750.69 – 12,041,648.14 6,826,846.85 – 58,462,551.98 —— ——
Note 1: New Land Bridge (Lianyungang) Terminal Co., Ltd. is a joint venture invested by the company and Sinotrans (Hong Kong) Logistics Co., Ltd. (hereinafter referred to as “Hong Kong Logistics”) and Sinotrans Land Bridge Transport Co., Ltd. Dividends paid to overseas companies have not yet been approved by the relevant authorities, so they have not been paid yet.
Note 2: China United Tally Co., Ltd. (hereinafter referred to as “China United Tally”) was originally a joint venture established byte company and COSCO SHIPPING Logistics Co., Ltd. (hereinafter referred to as “COSCO SHIPPING”) on 13 May 2003. The Company’s shareholding ratio is 32%. On 13 May 2018, the Company and COSCO SHIPPING signed the “Agreement on Arrangements Related to China United Tally Co., Ltd.”, which stipulated that from 1 January 2018 to 31 December 2019, the company would no longer participate the operation and management of China United Tally, regardless of the profit or loss of China United Tally in that year, the Company will collect RMB10 million from China United Tally every year. In addition, the company no longer has the right to enjoy the gains from China United Tally in accordance with the shareholding ratio, nor to bear any losses during the year.
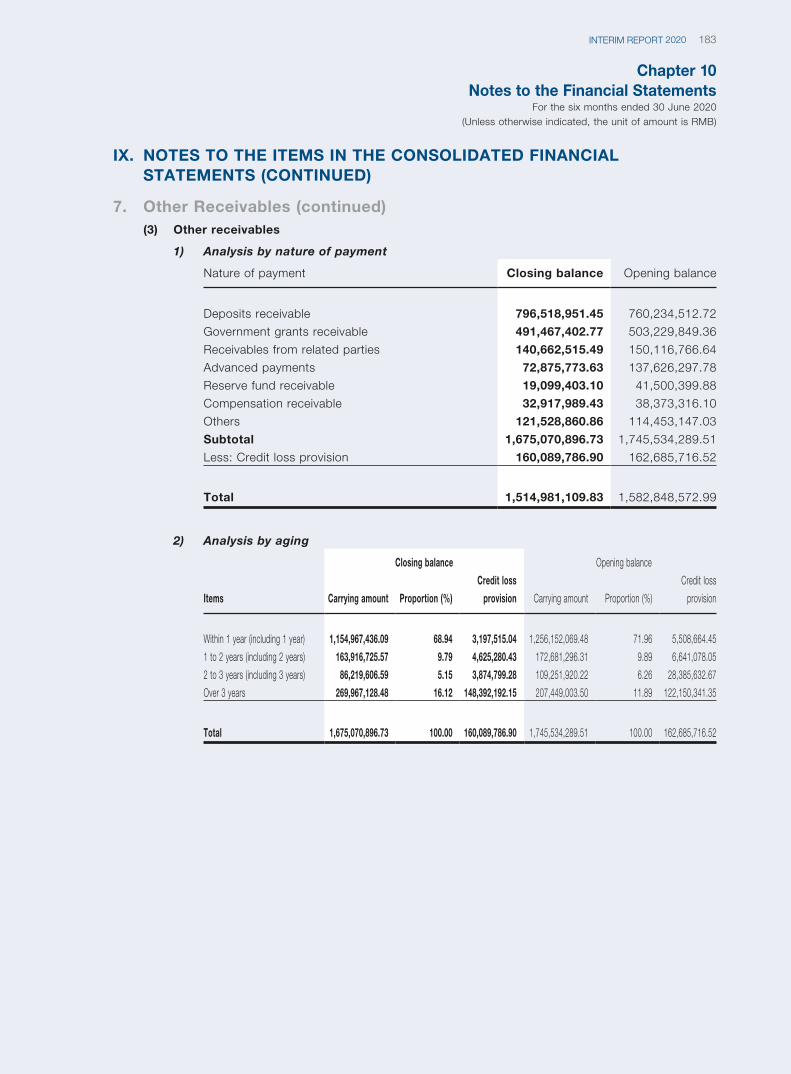
Chapter 10Notes to the Financial Statements
For the six months ended 30 June 2020(Unless otherwise indicated, the unit of amount is RMB)
183INTERIM REPORT 2020
IX. NOTES TO THE ITEMS IN THE CONSOLIDATED FINANCIAL STATEMENTS (CONTINUED)
7. Other Receivables (continued)(3) Other receivables
1) Analysis by nature of payment
Nature of payment Closing balance Opening balance
Deposits receivable 796,518,951.45 760,234,512.72
Government grants receivable 491,467,402.77 503,229,849.36
Receivables from related parties 140,662,515.49 150,116,766.64
Advanced payments 72,875,773.63 137,626,297.78
Reserve fund receivable 19,099,403.10 41,500,399.88
Compensation receivable 32,917,989.43 38,373,316.10
Others 121,528,860.86 114,453,147.03
Subtotal 1,675,070,896.73 1,745,534,289.51
Less: Credit loss provision 160,089,786.90 162,685,716.52
Total 1,514,981,109.83 1,582,848,572.99
2) Analysis by aging
Items
Closing balance Opening balance
Carrying amount Proportion (%)
Credit loss
provision Carrying amount Proportion (%)
Credit loss
provision
Within 1 year (including 1 year) 1,154,967,436.09 68.94 3,197,515.04 1,256,152,069.48 71.96 5,508,664.45
1 to 2 years (including 2 years) 163,916,725.57 9.79 4,625,280.43 172,681,296.31 9.89 6,641,078.05
2 to 3 years (including 3 years) 86,219,606.59 5.15 3,874,799.28 109,251,920.22 6.26 28,385,632.67
Over 3 years 269,967,128.48 16.12 148,392,192.15 207,449,003.50 11.89 122,150,341.35
Total 1,675,070,896.73 100.00 160,089,786.90 1,745,534,289.51 100.00 162,685,716.52
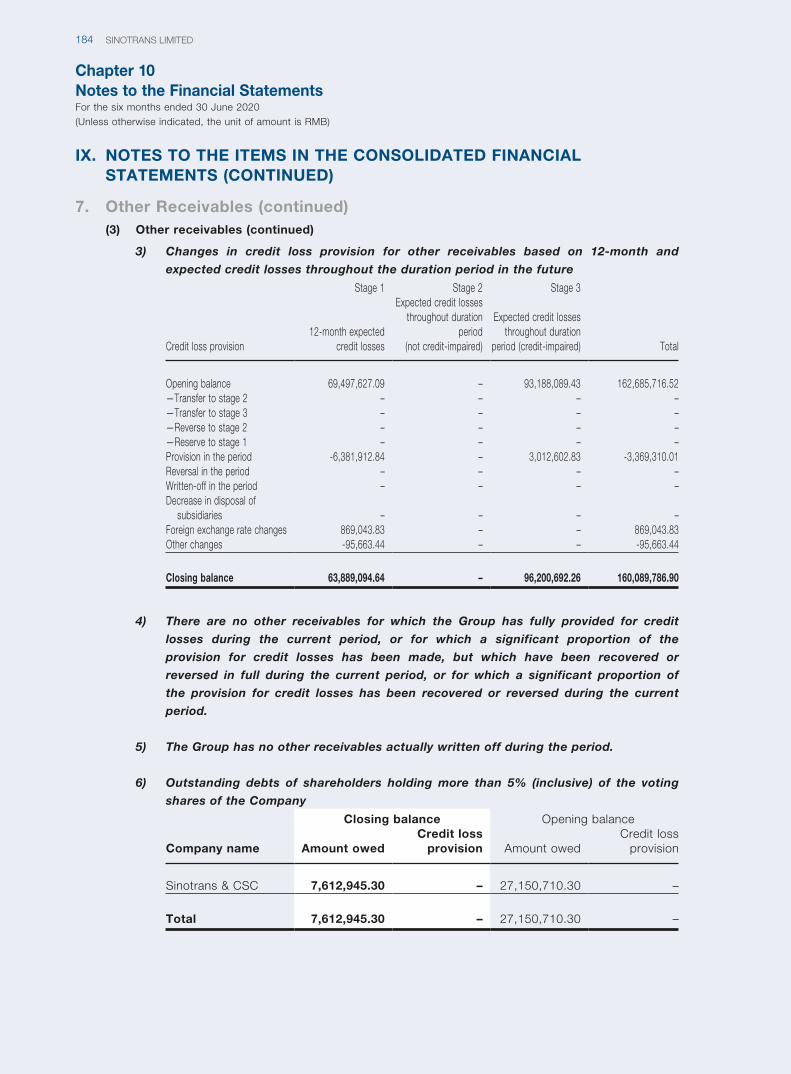
Chapter 10Notes to the Financial StatementsFor the six months ended 30 June 2020(Unless otherwise indicated, the unit of amount is RMB)
SINOTRANS LIMITED184
IX. NOTES TO THE ITEMS IN THE CONSOLIDATED FINANCIAL STATEMENTS (CONTINUED)
7. Other Receivables (continued)(3) Other receivables (continued)
3) Changes in credit loss provision for other receivables based on 12-month and
expected credit losses throughout the duration period in the future
Credit loss provision
Stage 1 Stage 2 Stage 3
Total12-month expected
credit losses
Expected credit losses throughout duration
period (not credit-impaired)
Expected credit losses throughout duration
period (credit-impaired)
Opening balance 69,497,627.09 – 93,188,089.43 162,685,716.52—Transfer to stage 2 – – – –—Transfer to stage 3 – – – –—Reverse to stage 2 – – – –—Reserve to stage 1 – – – –Provision in the period -6,381,912.84 – 3,012,602.83 -3,369,310.01Reversal in the period – – – –Written-off in the period – – – –Decrease in disposal of
subsidiaries – – – –Foreign exchange rate changes 869,043.83 – – 869,043.83Other changes -95,663.44 – – -95,663.44
Closing balance 63,889,094.64 – 96,200,692.26 160,089,786.90
4) There are no other receivables for which the Group has fully provided for credit
losses during the current period, or for which a significant proportion of the
provision for credit losses has been made, but which have been recovered or
reversed in full during the current period, or for which a significant proportion of
the provision for credit losses has been recovered or reversed during the current
period.
5) The Group has no other receivables actually written off during the period.
6) Outstanding debts of shareholders holding more than 5% (inclusive) of the voting
shares of the Company
Company name
Closing balance Opening balance
Amount owedCredit loss
provision Amount owedCredit loss
provision
Sinotrans & CSC 7,612,945.30 – 27,150,710.30 –
Total 7,612,945.30 – 27,150,710.30 –
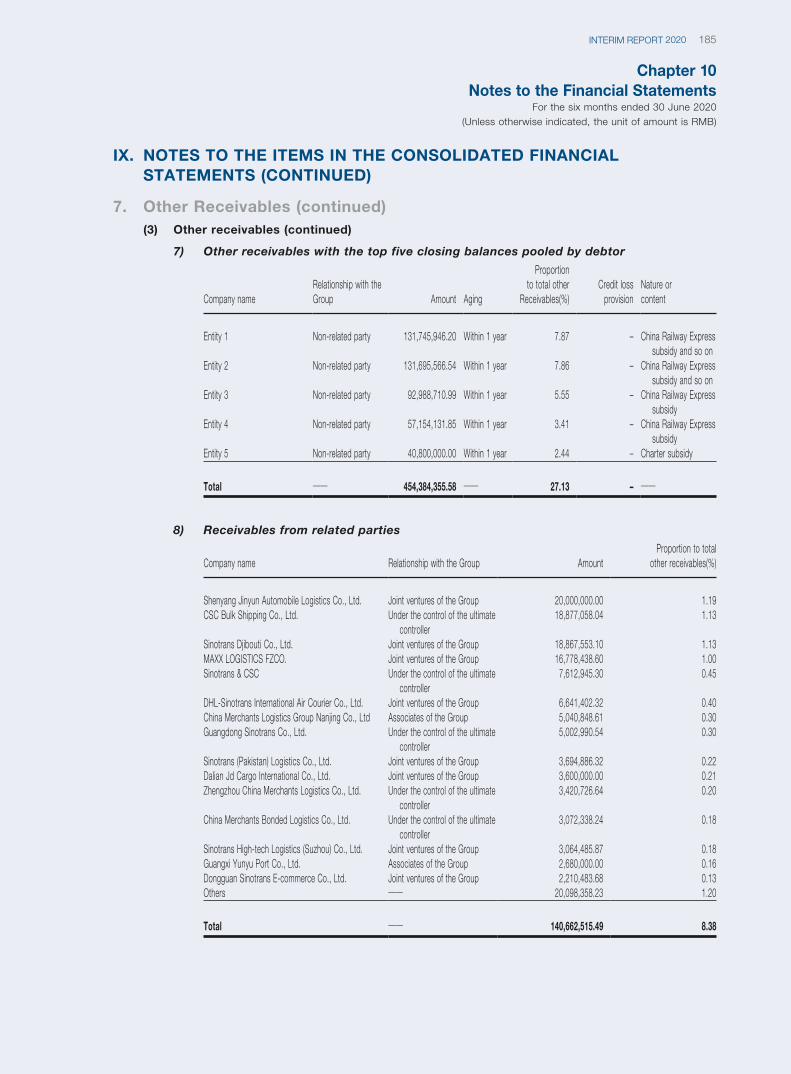
Chapter 10Notes to the Financial Statements
For the six months ended 30 June 2020(Unless otherwise indicated, the unit of amount is RMB)
185INTERIM REPORT 2020
IX. NOTES TO THE ITEMS IN THE CONSOLIDATED FINANCIAL STATEMENTS (CONTINUED)
7. Other Receivables (continued)(3) Other receivables (continued)
7) Other receivables with the top five closing balances pooled by debtor
Company nameRelationship with the Group Amount Aging
Proportion to total other
Receivables(%)Credit loss
provisionNature or content
Entity 1 Non-related party 131,745,946.20 Within 1 year 7.87 – China Railway Express subsidy and so on
Entity 2 Non-related party 131,695,566.54 Within 1 year 7.86 – China Railway Express subsidy and so on
Entity 3 Non-related party 92,988,710.99 Within 1 year 5.55 – China Railway Express subsidy
Entity 4 Non-related party 57,154,131.85 Within 1 year 3.41 – China Railway Express subsidy
Entity 5 Non-related party 40,800,000.00 Within 1 year 2.44 – Charter subsidy
Total —— 454,384,355.58 —— 27.13 – ——
8) Receivables from related parties
Company name Relationship with the Group AmountProportion to total
other receivables(%)
Shenyang Jinyun Automobile Logistics Co., Ltd. Joint ventures of the Group 20,000,000.00 1.19CSC Bulk Shipping Co., Ltd. Under the control of the ultimate
controller18,877,058.04 1.13
Sinotrans Djibouti Co., Ltd. Joint ventures of the Group 18,867,553.10 1.13MAXX LOGISTICS FZCO. Joint ventures of the Group 16,778,438.60 1.00Sinotrans & CSC Under the control of the ultimate
controller7,612,945.30 0.45
DHL-Sinotrans International Air Courier Co., Ltd. Joint ventures of the Group 6,641,402.32 0.40China Merchants Logistics Group Nanjing Co., Ltd Associates of the Group 5,040,848.61 0.30Guangdong Sinotrans Co., Ltd. Under the control of the ultimate
controller5,002,990.54 0.30
Sinotrans (Pakistan) Logistics Co., Ltd. Joint ventures of the Group 3,694,886.32 0.22Dalian Jd Cargo International Co., Ltd. Joint ventures of the Group 3,600,000.00 0.21Zhengzhou China Merchants Logistics Co., Ltd. Under the control of the ultimate
controller3,420,726.64 0.20
China Merchants Bonded Logistics Co., Ltd. Under the control of the ultimate controller
3,072,338.24 0.18
Sinotrans High-tech Logistics (Suzhou) Co., Ltd. Joint ventures of the Group 3,064,485.87 0.18Guangxi Yunyu Port Co., Ltd. Associates of the Group 2,680,000.00 0.16Dongguan Sinotrans E-commerce Co., Ltd. Joint ventures of the Group 2,210,483.68 0.13Others —— 20,098,358.23 1.20
Total —— 140,662,515.49 8.38
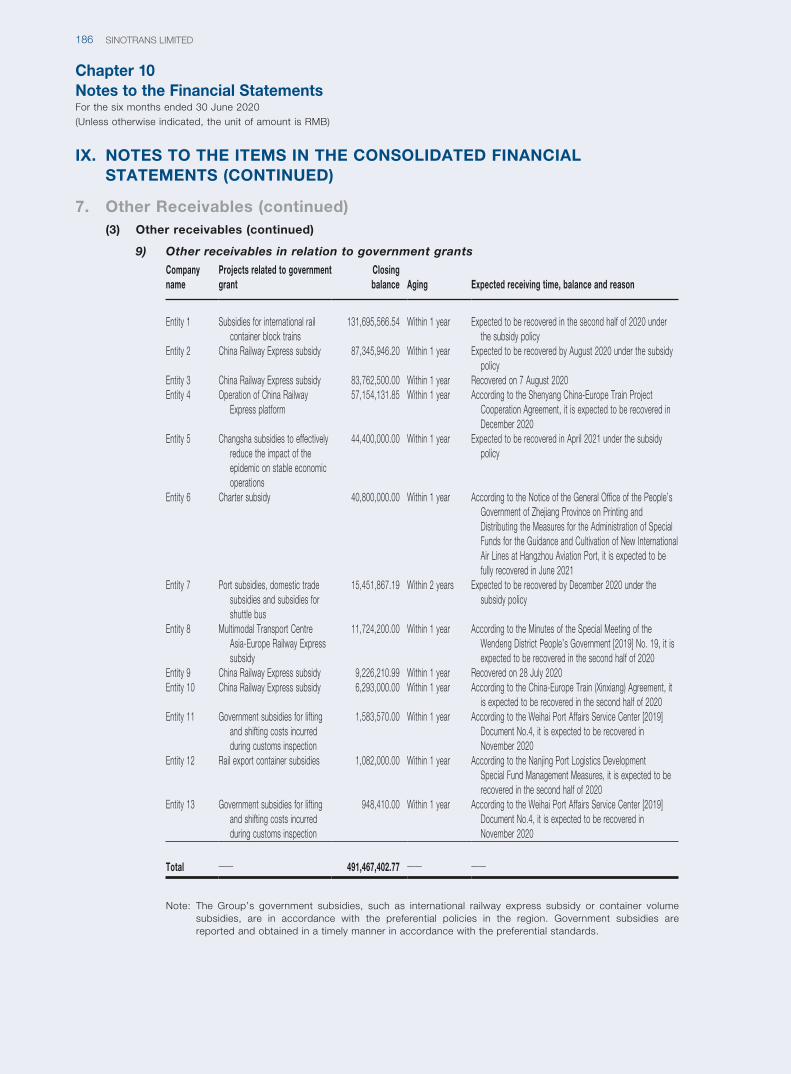
Chapter 10Notes to the Financial StatementsFor the six months ended 30 June 2020(Unless otherwise indicated, the unit of amount is RMB)
SINOTRANS LIMITED186
IX. NOTES TO THE ITEMS IN THE CONSOLIDATED FINANCIAL STATEMENTS (CONTINUED)
7. Other Receivables (continued)(3) Other receivables (continued)
9) Other receivables in relation to government grants
Company name
Projects related to government grant
Closing balance Aging Expected receiving time, balance and reason
Entity 1 Subsidies for international rail container block trains
131,695,566.54 Within 1 year Expected to be recovered in the second half of 2020 under the subsidy policy
Entity 2 China Railway Express subsidy 87,345,946.20 Within 1 year Expected to be recovered by August 2020 under the subsidy policy
Entity 3 China Railway Express subsidy 83,762,500.00 Within 1 year Recovered on 7 August 2020Entity 4 Operation of China Railway
Express platform57,154,131.85 Within 1 year According to the Shenyang China-Europe Train Project
Cooperation Agreement, it is expected to be recovered in December 2020
Entity 5 Changsha subsidies to effectively reduce the impact of the epidemic on stable economic operations
44,400,000.00 Within 1 year Expected to be recovered in April 2021 under the subsidy policy
Entity 6 Charter subsidy 40,800,000.00 Within 1 year According to the Notice of the General Office of the People’s Government of Zhejiang Province on Printing and Distributing the Measures for the Administration of Special Funds for the Guidance and Cultivation of New International Air Lines at Hangzhou Aviation Port, it is expected to be fully recovered in June 2021
Entity 7 Port subsidies, domestic trade subsidies and subsidies for shuttle bus
15,451,867.19 Within 2 years Expected to be recovered by December 2020 under the subsidy policy
Entity 8 Multimodal Transport Centre Asia-Europe Railway Express subsidy
11,724,200.00 Within 1 year According to the Minutes of the Special Meeting of the Wendeng District People’s Government [2019] No. 19, it is expected to be recovered in the second half of 2020
Entity 9 China Railway Express subsidy 9,226,210.99 Within 1 year Recovered on 28 July 2020Entity 10 China Railway Express subsidy 6,293,000.00 Within 1 year According to the China-Europe Train (Xinxiang) Agreement, it
is expected to be recovered in the second half of 2020Entity 11 Government subsidies for lifting
and shifting costs incurred during customs inspection
1,583,570.00 Within 1 year According to the Weihai Port Affairs Service Center [2019] Document No.4, it is expected to be recovered in November 2020
Entity 12 Rail export container subsidies 1,082,000.00 Within 1 year According to the Nanjing Port Logistics Development Special Fund Management Measures, it is expected to be recovered in the second half of 2020
Entity 13 Government subsidies for lifting and shifting costs incurred during customs inspection
948,410.00 Within 1 year According to the Weihai Port Affairs Service Center [2019] Document No.4, it is expected to be recovered in November 2020
Total —— 491,467,402.77 —— ——
Note: The Group’s government subsidies, such as international railway express subsidy or container volume subsidies, are in accordance with the preferential policies in the region. Government subsidies are reported and obtained in a timely manner in accordance with the preferential standards.
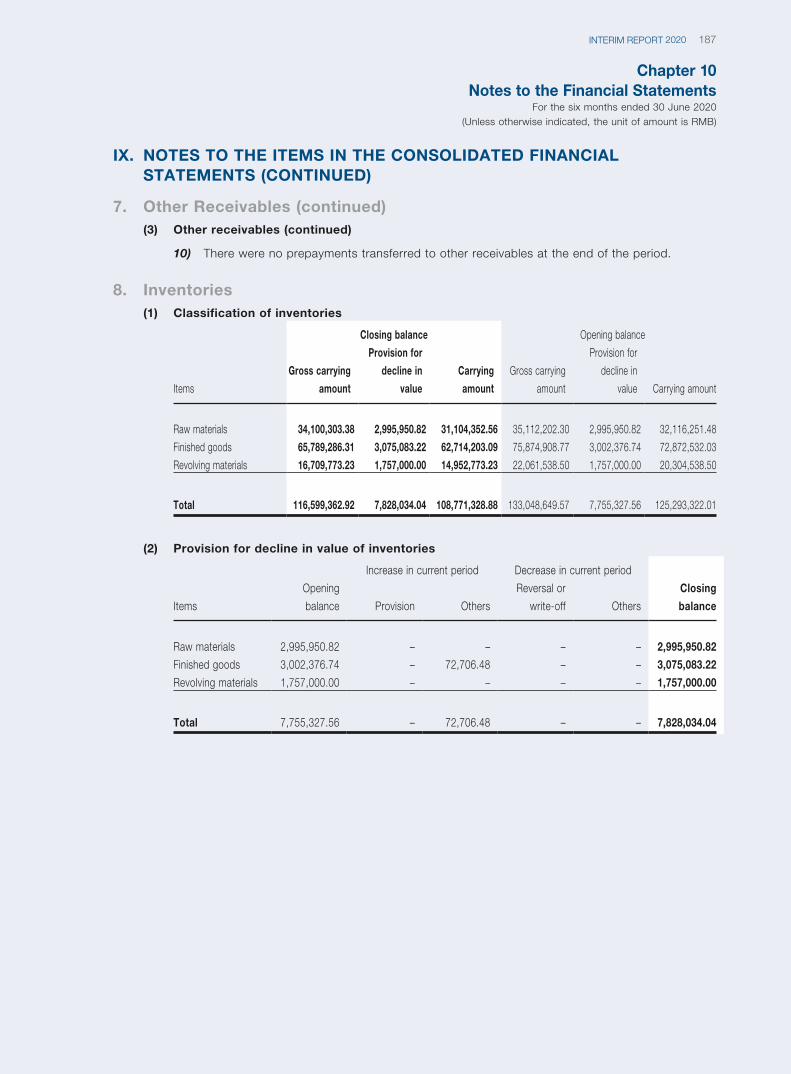
Chapter 10Notes to the Financial Statements
For the six months ended 30 June 2020(Unless otherwise indicated, the unit of amount is RMB)
187INTERIM REPORT 2020
IX. NOTES TO THE ITEMS IN THE CONSOLIDATED FINANCIAL STATEMENTS (CONTINUED)
7. Other Receivables (continued)(3) Other receivables (continued)
10) There were no prepayments transferred to other receivables at the end of the period.
8. Inventories(1) Classification of inventories
Items
Closing balance Opening balance
Gross carrying
amount
Provision for
decline in
value
Carrying
amount
Gross carrying
amount
Provision for
decline in
value Carrying amount
Raw materials 34,100,303.38 2,995,950.82 31,104,352.56 35,112,202.30 2,995,950.82 32,116,251.48
Finished goods 65,789,286.31 3,075,083.22 62,714,203.09 75,874,908.77 3,002,376.74 72,872,532.03
Revolving materials 16,709,773.23 1,757,000.00 14,952,773.23 22,061,538.50 1,757,000.00 20,304,538.50
Total 116,599,362.92 7,828,034.04 108,771,328.88 133,048,649.57 7,755,327.56 125,293,322.01
(2) Provision for decline in value of inventories
Items
Opening
balance
Increase in current period Decrease in current period
Closing
balanceProvision Others
Reversal or
write-off Others
Raw materials 2,995,950.82 – – – – 2,995,950.82
Finished goods 3,002,376.74 – 72,706.48 – – 3,075,083.22
Revolving materials 1,757,000.00 – – – – 1,757,000.00
Total 7,755,327.56 – 72,706.48 – – 7,828,034.04
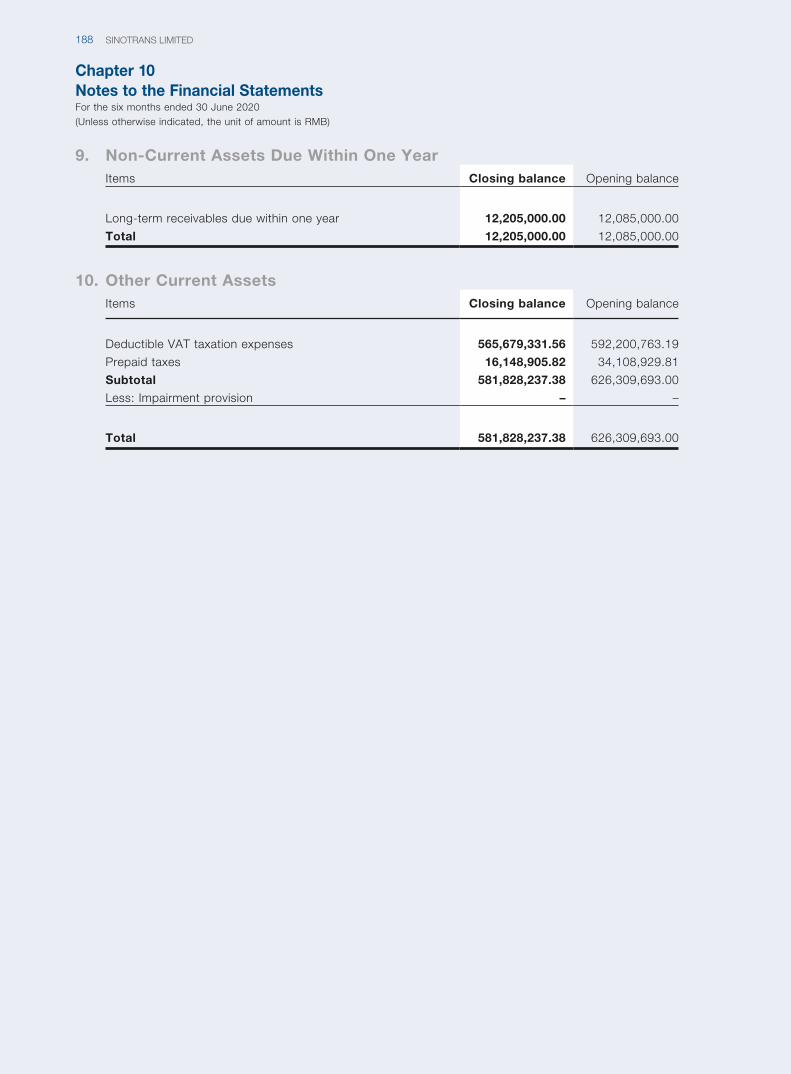
Chapter 10Notes to the Financial StatementsFor the six months ended 30 June 2020(Unless otherwise indicated, the unit of amount is RMB)
SINOTRANS LIMITED188
9. Non-Current Assets Due Within One YearItems Closing balance Opening balance
Long-term receivables due within one year 12,205,000.00 12,085,000.00
Total 12,205,000.00 12,085,000.00
10. Other Current AssetsItems Closing balance Opening balance
Deductible VAT taxation expenses 565,679,331.56 592,200,763.19
Prepaid taxes 16,148,905.82 34,108,929.81
Subtotal 581,828,237.38 626,309,693.00
Less: Impairment provision – –
Total 581,828,237.38 626,309,693.00
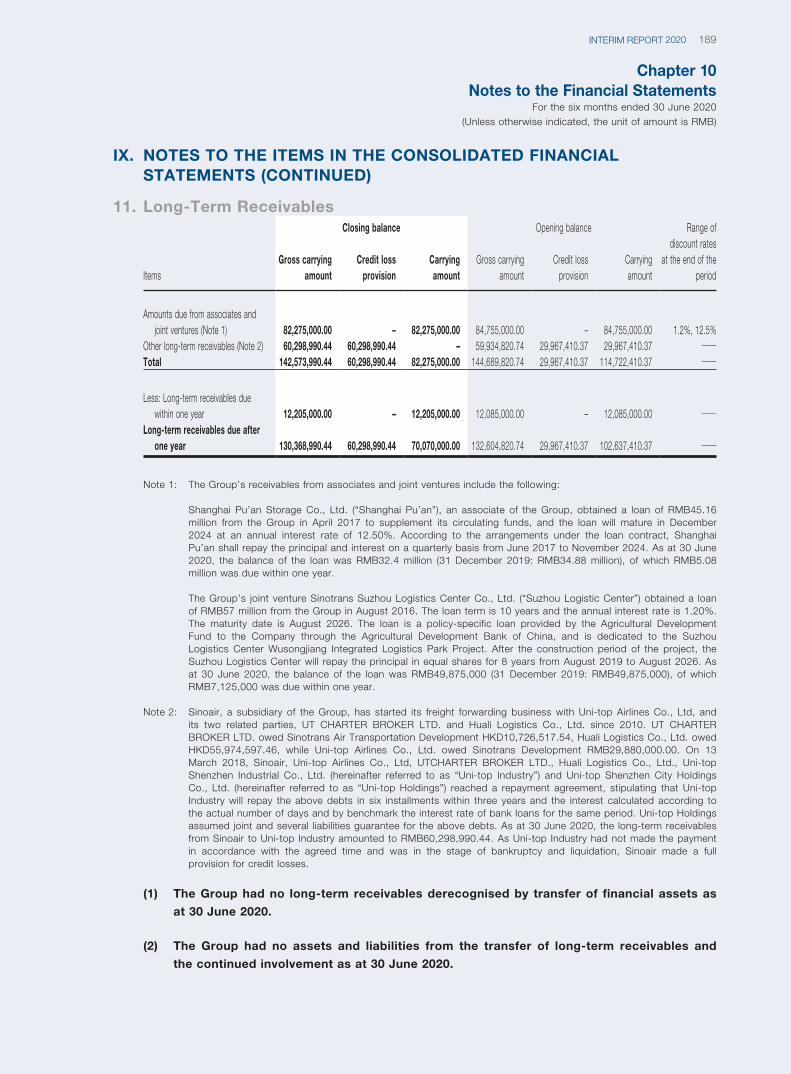
Chapter 10Notes to the Financial Statements
For the six months ended 30 June 2020(Unless otherwise indicated, the unit of amount is RMB)
189INTERIM REPORT 2020
IX. NOTES TO THE ITEMS IN THE CONSOLIDATED FINANCIAL STATEMENTS (CONTINUED)
11. Long-Term Receivables
Items
Closing balance Opening balance Range of discount rates
at the end of the period
Gross carrying amount
Credit loss provision
Carrying amount
Gross carrying amount
Credit loss provision
Carrying amount
Amounts due from associates and joint ventures (Note 1) 82,275,000.00 – 82,275,000.00 84,755,000.00 – 84,755,000.00 1.2%, 12.5%
Other long-term receivables (Note 2) 60,298,990.44 60,298,990.44 – 59,934,820.74 29,967,410.37 29,967,410.37 ——Total 142,573,990.44 60,298,990.44 82,275,000.00 144,689,820.74 29,967,410.37 114,722,410.37 ——
Less: Long-term receivables due within one year 12,205,000.00 – 12,205,000.00 12,085,000.00 – 12,085,000.00 ——
Long-term receivables due after one year 130,368,990.44 60,298,990.44 70,070,000.00 132,604,820.74 29,967,410.37 102,637,410.37 ——
Note 1: The Group’s receivables from associates and joint ventures include the following:
Shanghai Pu’an Storage Co., Ltd. (“Shanghai Pu’an”), an associate of the Group, obtained a loan of RMB45.16 million from the Group in April 2017 to supplement its circulating funds, and the loan will mature in December 2024 at an annual interest rate of 12.50%. According to the arrangements under the loan contract, Shanghai Pu’an shall repay the principal and interest on a quarterly basis from June 2017 to November 2024. As at 30 June 2020, the balance of the loan was RMB32.4 million (31 December 2019: RMB34.88 million), of which RMB5.08 million was due within one year.
The Group’s joint venture Sinotrans Suzhou Logistics Center Co., Ltd. (“Suzhou Logistic Center”) obtained a loan of RMB57 million from the Group in August 2016. The loan term is 10 years and the annual interest rate is 1.20%. The maturity date is August 2026. The loan is a policy-specific loan provided by the Agricultural Development Fund to the Company through the Agricultural Development Bank of China, and is dedicated to the Suzhou Logistics Center Wusongjiang Integrated Logistics Park Project. After the construction period of the project, the Suzhou Logistics Center will repay the principal in equal shares for 8 years from August 2019 to August 2026. As at 30 June 2020, the balance of the loan was RMB49,875,000 (31 December 2019: RMB49,875,000), of which RMB7,125,000 was due within one year.
Note 2: Sinoair, a subsidiary of the Group, has started its freight forwarding business with Uni-top Airlines Co., Ltd, and its two related parties, UT CHARTER BROKER LTD. and Huali Logistics Co., Ltd. since 2010. UT CHARTER BROKER LTD. owed Sinotrans Air Transportation Development HKD10,726,517.54, Huali Logistics Co., Ltd. owed HKD55,974,597.46, while Uni-top Airlines Co., Ltd. owed Sinotrans Development RMB29,880,000.00. On 13 March 2018, Sinoair, Uni-top Airlines Co., Ltd, UTCHARTER BROKER LTD., Huali Logistics Co., Ltd., Uni-top Shenzhen Industrial Co., Ltd. (hereinafter referred to as “Uni-top Industry”) and Uni-top Shenzhen City Holdings Co., Ltd. (hereinafter referred to as “Uni-top Holdings”) reached a repayment agreement, stipulating that Uni-top Industry will repay the above debts in six installments within three years and the interest calculated according to the actual number of days and by benchmark the interest rate of bank loans for the same period. Uni-top Holdings assumed joint and several liabilities guarantee for the above debts. As at 30 June 2020, the long-term receivables from Sinoair to Uni-top Industry amounted to RMB60,298,990.44. As Uni-top Industry had not made the payment in accordance with the agreed time and was in the stage of bankruptcy and liquidation, Sinoair made a full provision for credit losses.
(1) The Group had no long-term receivables derecognised by transfer of financial assets as
at 30 June 2020.
(2) The Group had no assets and liabilities from the transfer of long-term receivables and
the continued involvement as at 30 June 2020.
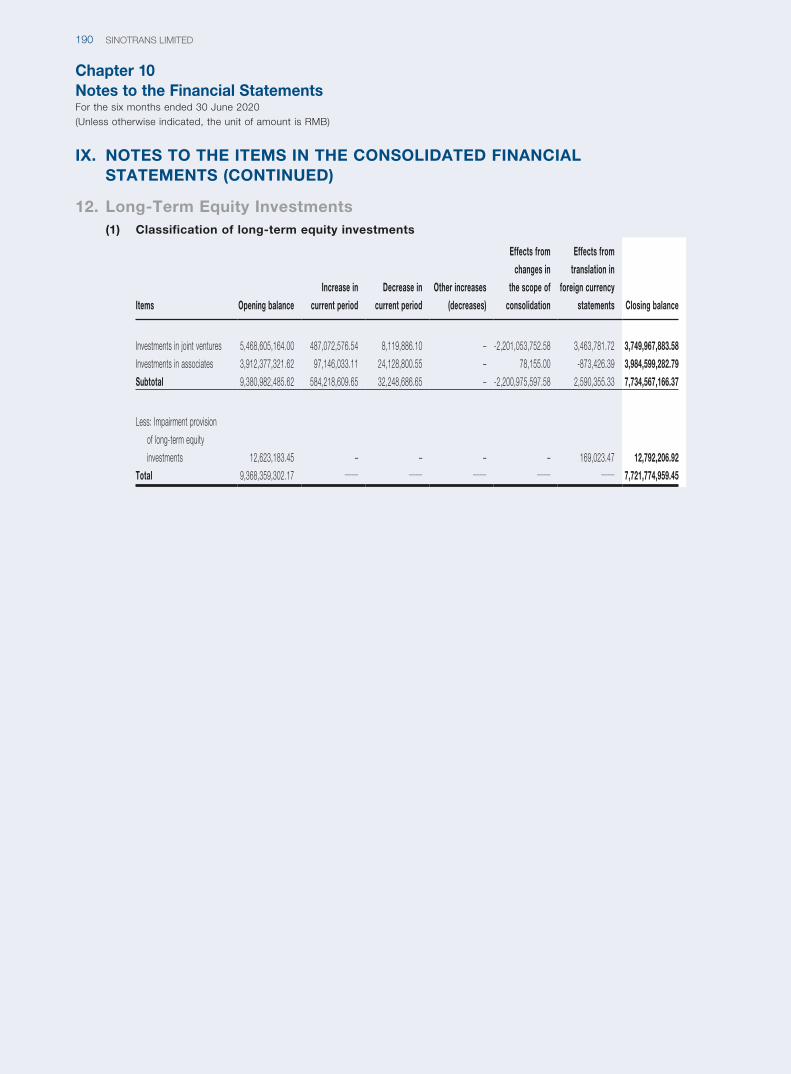
Chapter 10Notes to the Financial StatementsFor the six months ended 30 June 2020(Unless otherwise indicated, the unit of amount is RMB)
SINOTRANS LIMITED190
IX. NOTES TO THE ITEMS IN THE CONSOLIDATED FINANCIAL STATEMENTS (CONTINUED)
12. Long-Term Equity Investments(1) Classification of long-term equity investments
Items Opening balance
Increase in
current period
Decrease in
current period
Other increases
(decreases)
Effects from
changes in
the scope of
consolidation
Effects from
translation in
foreign currency
statements Closing balance
Investments in joint ventures 5,468,605,164.00 487,072,576.54 8,119,886.10 – -2,201,053,752.58 3,463,781.72 3,749,967,883.58
Investments in associates 3,912,377,321.62 97,146,033.11 24,128,800.55 – 78,155.00 -873,426.39 3,984,599,282.79
Subtotal 9,380,982,485.62 584,218,609.65 32,248,686.65 – -2,200,975,597.58 2,590,355.33 7,734,567,166.37
Less: Impairment provision
of long-term equity
investments 12,623,183.45 – – – – 169,023.47 12,792,206.92
Total 9,368,359,302.17 —— —— —— —— —— 7,721,774,959.45
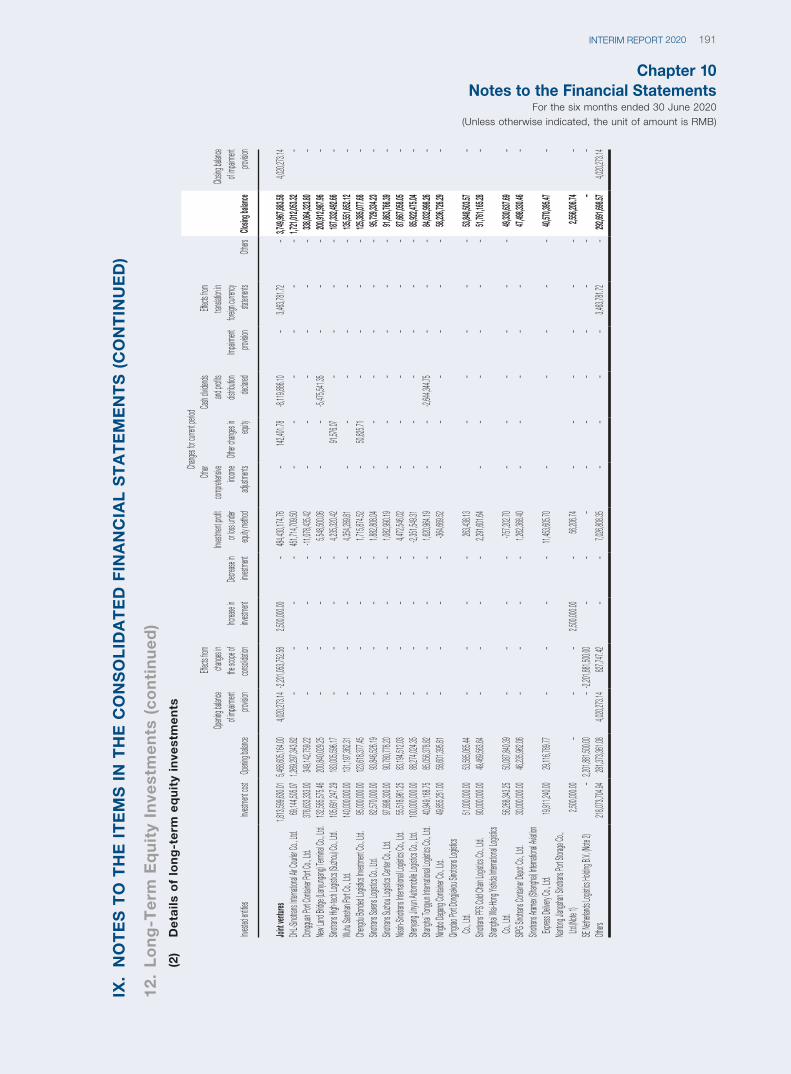
Chapter 10Notes to the Financial Statements
For the six months ended 30 June 2020(Unless otherwise indicated, the unit of amount is RMB)
191INTERIM REPORT 2020
IX.
NO
TE
S T
O T
HE
IT
EM
S I
N T
HE
CO
NS
OL
IDA
TE
D F
INA
NC
IAL
ST
AT
EM
EN
TS
(C
ON
TIN
UE
D)
12.
Lo
ng
-Te
rm E
qu
ity
Inve
stm
en
ts (
co
nti
nu
ed
)(2
) D
eta
ils o
f lo
ng
-te
rm e
qu
ity
inve
stm
en
ts
Investe
d entit
iesInve
stment
cost
Openi
ng bal
ance
Openi
ng bal
ance
of imp
airment
pro
vision
Effects
from
change
s in
the sc
ope of
consoli
dation
Change
s for cu
rrent pe
riod
Closin
g bala
nce
Closing
balan
ce of i
mpairm
ent
provisi
onInc
rease
in inve
stment
Decrea
se in
investm
ent
Investm
ent pro
fit or l
oss un
der
equity
metho
d
Other
compre
hensive
inc
ome
adjust
ments
Other c
hanges
in equ
ity
Cash d
ividend
s and
profits
distrib
ution
declare
dImp
airment
pro
vision
Effects
from
translat
ion in
foreign
curren
cy sta
tement
sOth
ers
Joint
ventur
es1,8
13,599
,630.0
15,4
68,605
,164.0
04,0
20,273
.14-2,2
01,053
,752.5
82,5
00,000
.00–
484,43
0,174.
76–
142,40
1.78
-8,119,
886.10
–3,4
63,781
.72–
3,749,
967,88
3.58
4,020,
273.14
DHL-S
inotran
s Intern
ational
Air Co
urier C
o., Ltd
.69,
144,50
5.07
1,269,
297,34
3.82
––
––
451,71
4,709.
50–
––
––
–1,7
21,012
,053.3
2–
Donggu
an Por
t Cont
ainer P
ort Co
., Ltd.
376,63
3,333.
00349
,142,7
59.22
––
––
-11,07
8,435.
42–
––
––
–338
,064,3
23.80
–New
Land
Bridge
(Lianyu
ngang)
Termi
nal Co
., Ltd.
132,58
5,575.
46200
,840,0
29.25
––
––
5,548,
500.06
––
-5,475,
541.35
––
–200
,912,9
87.96
–Sin
otrans
High-te
ch Log
istics (S
uzhou)
Co., L
td.105
,691,2
47.29
183,00
5,596.
17–
––
–4,2
35,320
.4291,
576.07
––
––
187,33
2,492.
66–
Wuhu
Sansha
n Port
Co., L
td.140
,000,0
00.00
131,19
7,362.
31–
––
–4,3
54,289
.81–
––
––
–135
,551,6
52.12
–Che
ngdu B
onded
Logistic
s Inves
tment C
o., Ltd
.95,
000,00
0.00
123,61
8,377.
45–
––
–1,7
15,874
.52–
50,825
.71–
––
–125
,385,0
77.68
–Sin
otrans
Sarens
Logist
ics Co
., Ltd.
82,570
,000.0
093,
846,52
6.19
––
––
1,882,
808.04
––
––
––
95,729
,334.2
3–
Sinotra
ns Suz
hou Lo
gistics
Center
Co., L
td.97,
898,30
0.00
90,780
,776.2
0–
––
–1,0
82,990
.19–
––
––
–91,
863,76
6.39
–Nis
sin-Sin
otrans
Interna
tional L
ogistic
s Co.,
Ltd.
55,518
,961.2
583,
194,51
2.03
––
––
4,472,
546.02
––
––
––
87,667
,058.0
5–
Shenya
ng Jiny
un Aut
omobi
le Logi
stics C
o., Ltd
.100
,000,0
00.00
88,274
,024.3
5–
––
–-2,3
51,549
.31–
––
––
–85,
922,47
5.04
–Sha
nghai T
ongyun
Intern
ational
Logist
ics Co
., Ltd.
40,949
,168.7
585,
056,37
8.82
––
––
1,620,
964.19
––
-2,644,
344.75
––
–84,
032,99
8.26
–Nin
gbo Da
gang C
ontain
er Co.,
Ltd.
49,855
,251.0
058,
601,39
5.81
––
––
-364,6
69.52
––
––
––
58,236
,726.2
9–
Qingda
o Port
Dongjia
kou Sin
otrans
Logistic
s Co
., Ltd.
51,000
,000.0
053,
585,06
5.44
––
––
263,43
8.13
––
––
–53,
848,50
3.57
–Sin
otrans
PFS Co
ld Chai
n Logi
stics C
o., Ltd
.90,
000,00
0.00
49,469
,563.6
4–
––
–2,2
91,601
.64–
––
––
–51,
761,16
5.28
–Sha
nghai W
ai-Hong
Yishid
a Intern
ational
Logist
ics Co
., Ltd.
56,268
,343.2
550,
087,84
0.39
––
––
-757,2
02.70
––
––
––
49,330
,637.6
9–
SIPG S
inotran
s Cont
ainer D
epot C
o., Ltd
.30,
000,00
0.00
46,235
,962.0
6–
––
–1,2
62,368
.40–
––
––
47,498
,330.4
6–
Sinotra
ns Ara
mex (S
hangha
i) Intern
ational
Aviatio
n Exp
ress D
elivery
Co., L
td.19,
911,24
0.00
29,116
,789.7
7–
––
–11,
453,60
5.70
––
––
–40,
570,39
5.47
–Nan
tong J
iangsh
an Sin
otrans
Port S
torage
Co.,
Ltd.(No
te 1)
2,500,
000.00
––
–2,5
00,000
.00–
56,206
.74–
––
––
–2,5
56,206
.74–
SE Net
herlan
ds Log
istics H
olding
B.V. (
Note 2
)–
2,201,
881,50
0.00
–-2,2
01,881
,500.0
0–
––
––
––
––
––
Others
218,07
3,704.
94281
,373,3
61.08
4,020,
273.14
827,74
7.42
––
7,026,
808.35
––
––
3,463,
781.72
–292
,691,6
98.57
4,020,
273.14
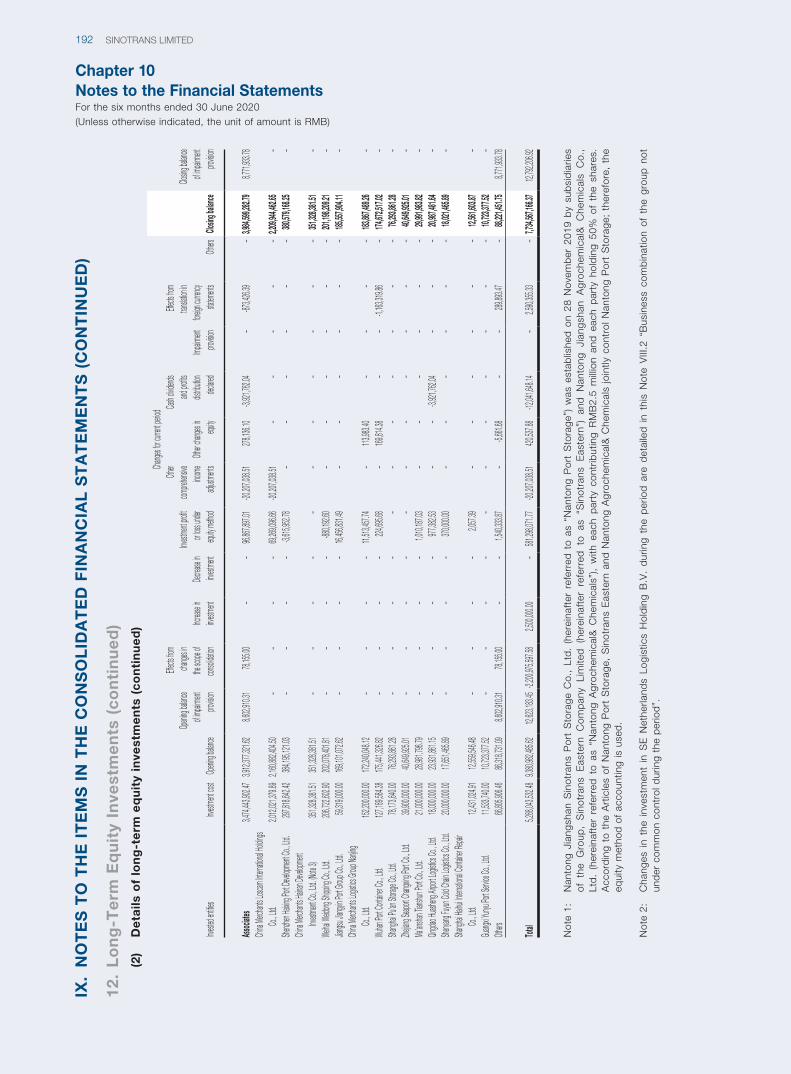
Chapter 10Notes to the Financial StatementsFor the six months ended 30 June 2020(Unless otherwise indicated, the unit of amount is RMB)
SINOTRANS LIMITED192
Investe
d entit
iesInve
stment
cost
Openi
ng bal
ance
Openi
ng bal
ance
of imp
airment
pro
vision
Effects
from
change
s in
the sc
ope of
consoli
dation
Change
s for cu
rrent pe
riod
Closin
g bala
nce
Closing
balan
ce of i
mpairm
ent
provisi
onInc
rease
in inve
stment
Decrea
se in
investm
ent
Investm
ent pro
fit or l
oss un
der
equity
metho
d
Other
compre
hensive
inc
ome
adjust
ments
Other c
hanges
in equ
ity
Cash d
ividend
s and
profits
distrib
ution
declare
dImp
airment
pro
vision
Effects
from
translat
ion in
foreign
curren
cy sta
tement
sOth
ers
Associ
ates
3,474,
443,90
2.47
3,912,
377,32
1.62
8,602,
910.31
78,155
.00–
–96,
867,89
7.01
-20,20
7,038.
51278
,136.1
0-3,9
21,762
.04–
-873,4
26.39
–3,9
84,599
,282.7
98,7
71,933
.78Chi
na Me
rchant
s Losc
am Int
ernatio
nal Ho
ldings
Co., L
td.2,0
12,021
,379.8
92,1
60,882
,404.5
0–
––
–69,
269,09
6.66
-20,20
7,038.
51–
––
––
2,209,
944,46
2.65
–She
nzhen
Haixing
Port D
evelop
ment C
o., Ltd
.297
,818,6
42.42
384,19
5,121.
03–
––
–-3,6
15,952
.78–
––
––
–380
,579,1
68.25
–Chi
na Me
rchant
s Hain
an Dev
elopm
ent
Investm
ent Co
., Ltd.
(Note 3
)351
,328,3
81.51
351,32
8,381.
51–
––
––
––
––
––
351,32
8,381.
51–
Weiha
i Weid
ong Sh
ipping
Co., L
td.206
,722,6
02.90
202,07
8,401.
81–
––
–-88
0,192.
60–
––
––
–201
,198,2
09.21
–Jian
gsu Jia
ngyin P
ort Gro
up Co
., Ltd.
59,319
,000.0
0169
,101,0
72.62
––
––
16,456
,831.4
9–
––
––
–185
,557,9
04.11
–Chi
na Me
rchant
s Logi
stics G
roup N
anjing
Co
., Ltd.
152,20
0,000.
00172
,240,0
48.12
––
––
11,513
,457.7
4–
113,98
3.40
––
––
183,86
7,489.
26–
Wuhan
Port C
ontain
er Co.,
Ltd.
127,18
9,584.
38175
,441,3
26.82
––
––
224,69
5.68
–169
,814.3
8–
–-1,1
63,319
.86–
174,67
2,517.
02–
Shangh
ai Pu’a
n Stora
ge Co
., Ltd.
78,173
,640.0
076,
293,86
1.28
––
––
––
––
––
–76,
293,86
1.28
–Zhe
jiang S
eaport
Changx
ing Po
rt Co.,
Ltd.
39,900
,000.0
040,
649,92
5.01
––
––
––
––
––
–40,
649,92
5.01
–Ma
’ansha
n Tian
shun P
ort Co
., Ltd.
21,000
,000.0
028,
981,79
6.79
––
––
1,010,
187.03
––
––
––
29,991
,983.8
2–
Qingda
o Huas
heng A
irport L
ogistic
s Co.,
Ltd.
18,000
,000.0
023,
931,86
1.15
––
––
977,38
2.53
––
-3,921,
762.04
––
–20,
987,48
1.64
–She
nyang
Fuyun
Cold C
hain L
ogistic
s Co.,
Ltd.
20,000
,000.0
017,
651,46
5.89
––
––
370,00
0.00
––
––
––
18,021
,465.8
9–
Shangh
ai Haih
ui Inte
rnation
al Cont
ainer R
epair
Co., L
td.12,
431,02
4.91
12,559
,546.4
8–
––
–2,0
57.39
––
––
––
12,561
,603.8
7–
Guang
xi Yuny
u Port
Service
Co., L
td.11,
533,74
0.00
10,723
,377.5
2–
––
––
––
––
––
10,723
,377.5
2–
Others
66,805
,906.4
686,
318,73
1.09
8,602,
910.31
78,155
.00–
–1,5
40,333
.87–
-5,661.
68–
–289
,893.4
7–
88,221
,451.7
58,7
71,933
.78
Total
5,288,
043,53
2.48
9,380,
982,48
5.62
12,623
,183.4
5-2,2
00,975
,597.5
82,5
00,000
.00–
581,29
8,071.
77-20
,207,0
38.51
420,53
7.88
-12,04
1,648.
14–
2,590,
355.33
–
7,734,
567,16
6.37
12,792
,206.9
2
Not
e 1:
N
anto
ng J
iang
shan
Sin
otra
ns P
ort
Sto
rage
Co.
, Lt
d.
(her
eina
fter
ref
erre
d t
o as
“N
anto
ng P
ort
Sto
rage
”) w
as e
stab
lishe
d o
n 28
Nov
emb
er 2
019
by
sub
sid
iarie
s of
the
Gro
up,
Sin
otra
ns E
aste
rn C
omp
any
Lim
ited
(he
rein
afte
r re
ferr
ed t
o as
“S
inot
rans
Eas
tern
”) a
nd N
anto
ng J
iang
shan
Agr
oche
mic
al&
Che
mic
als
Co.
, Lt
d.
(her
eina
fter
ref
erre
d t
o as
“N
anto
ng A
groc
hem
ical
& C
hem
ical
s”),
with
eac
h p
arty
con
trib
utin
g R
MB
2.5
mill
ion
and
eac
h p
arty
hol
din
g 50
% o
f th
e sh
ares
. A
ccor
din
g to
the
Art
icle
s of
Nan
tong
Por
t S
tora
ge,
Sin
otra
ns E
aste
rn a
nd N
anto
ng A
groc
hem
ical
& C
hem
ical
s jo
intly
con
trol
Nan
tong
Por
t S
tora
ge;
ther
efor
e, t
he
equi
ty m
etho
d o
f ac
coun
ting
is u
sed
.
Not
e 2:
C
hang
es i
n th
e in
vest
men
t in
SE
Net
herla
nds
Logi
stic
s H
old
ing
B.V
. d
urin
g th
e p
erio
d a
re d
etai
led
in
this
Not
e V
III.2
“B
usin
ess
com
bin
atio
n of
the
gro
up n
ot
und
er c
omm
on c
ontr
ol d
urin
g th
e p
erio
d”.
IX.
NO
TE
S T
O T
HE
IT
EM
S I
N T
HE
CO
NS
OL
IDA
TE
D F
INA
NC
IAL
ST
AT
EM
EN
TS
(C
ON
TIN
UE
D)
12.
Lo
ng
-Te
rm E
qu
ity
Inve
stm
en
ts (
co
nti
nu
ed
)(2
) D
eta
ils o
f lo
ng
-te
rm e
qu
ity
inve
stm
en
ts (
co
nti
nu
ed
)
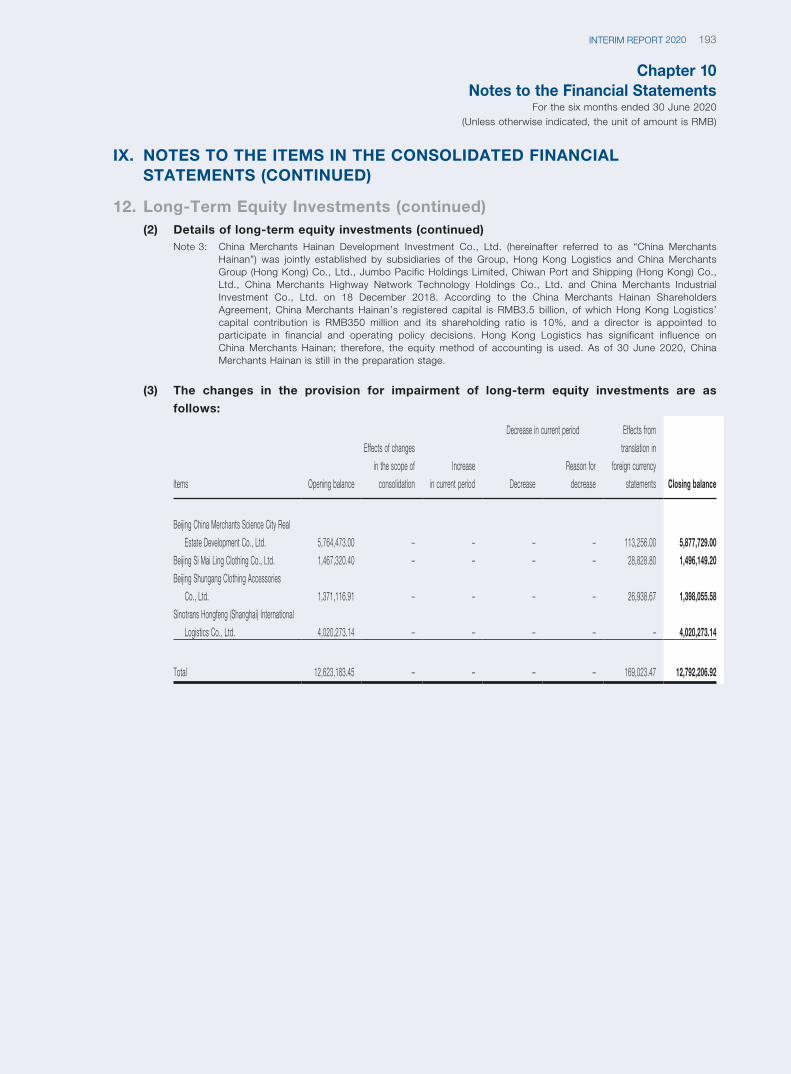
Chapter 10Notes to the Financial Statements
For the six months ended 30 June 2020(Unless otherwise indicated, the unit of amount is RMB)
193INTERIM REPORT 2020
IX. NOTES TO THE ITEMS IN THE CONSOLIDATED FINANCIAL STATEMENTS (CONTINUED)
12. Long-Term Equity Investments (continued)(2) Details of long-term equity investments (continued)
Note 3: China Merchants Hainan Development Investment Co., Ltd. (hereinafter referred to as “China Merchants Hainan”) was jointly established by subsidiaries of the Group, Hong Kong Logistics and China Merchants Group (Hong Kong) Co., Ltd., Jumbo Pacific Holdings Limited, Chiwan Port and Shipping (Hong Kong) Co., Ltd., China Merchants Highway Network Technology Holdings Co., Ltd. and China Merchants Industrial Investment Co., Ltd. on 18 December 2018. According to the China Merchants Hainan Shareholders Agreement, China Merchants Hainan’s registered capital is RMB3.5 billion, of which Hong Kong Logistics’ capital contribution is RMB350 million and its shareholding ratio is 10%, and a director is appointed to participate in financial and operating policy decisions. Hong Kong Logistics has significant influence on China Merchants Hainan; therefore, the equity method of accounting is used. As of 30 June 2020, China Merchants Hainan is still in the preparation stage.
(3) The changes in the provision for impairment of long-term equity investments are as
follows:
Items Opening balance
Effects of changes
in the scope of
consolidation
Increase
in current period
Decrease in current period Effects from
translation in
foreign currency
statements Closing balanceDecrease
Reason for
decrease
Beijing China Merchants Science City Real
Estate Development Co., Ltd. 5,764,473.00 – – – – 113,256.00 5,877,729.00
Beijing Si Mai Ling Clothing Co., Ltd. 1,467,320.40 – – – – 28,828.80 1,496,149.20
Beijing Shungang Clothing Accessories
Co., Ltd. 1,371,116.91 – – – – 26,938.67 1,398,055.58
Sinotrans Hongfeng (Shanghai) International
Logistics Co., Ltd. 4,020,273.14 – – – – – 4,020,273.14
Total 12,623,183.45 – – – – 169,023.47 12,792,206.92
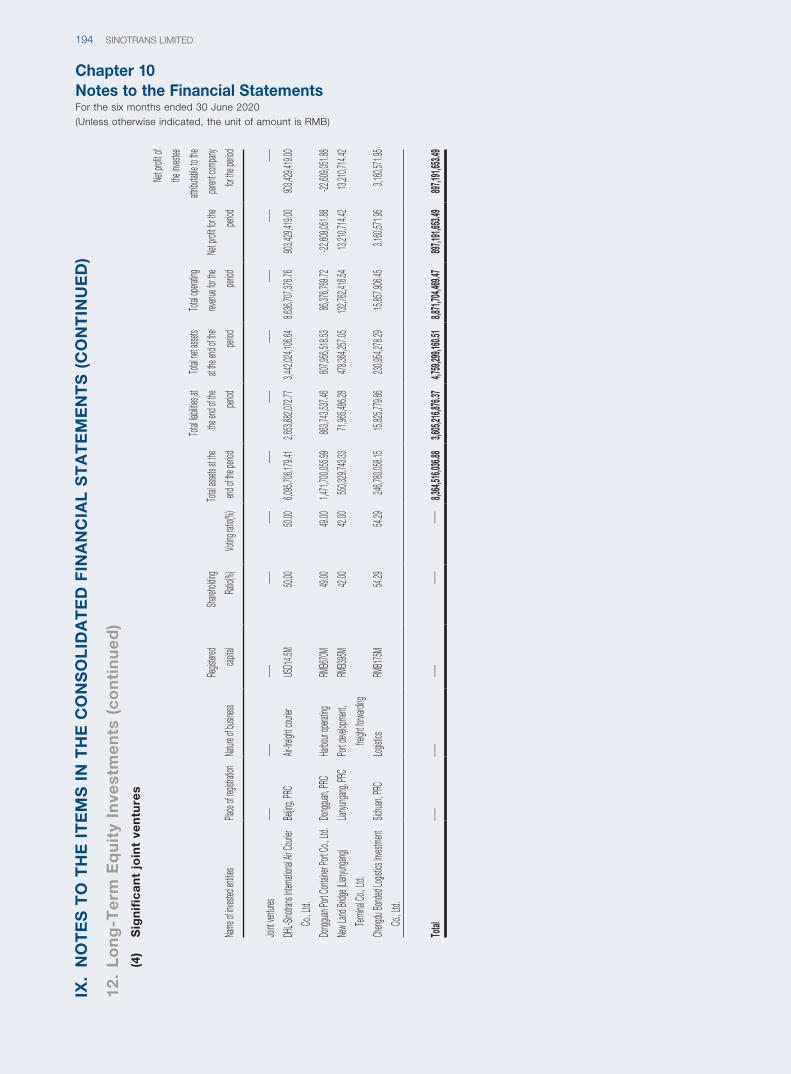
Chapter 10Notes to the Financial StatementsFor the six months ended 30 June 2020(Unless otherwise indicated, the unit of amount is RMB)
SINOTRANS LIMITED194
IX.
NO
TE
S T
O T
HE
IT
EM
S I
N T
HE
CO
NS
OL
IDA
TE
D F
INA
NC
IAL
ST
AT
EM
EN
TS
(C
ON
TIN
UE
D)
12.
Lo
ng
-Te
rm E
qu
ity
Inve
stm
en
ts (
co
nti
nu
ed
)(4
) S
ign
ific
an
t jo
int
ven
ture
s
Name
of inv
ested
entitie
sPla
ce of
registr
ation
Natur
e of b
usines
s
Regis
tered
capital
Share
holdin
g
Ratio(
%)Vo
ting ra
tio(%)
Total a
ssets a
t the
end of
the p
eriod
Total l
iabilitie
s at
the en
d of th
e
period
Total n
et ass
ets
at the
end o
f the
period
Total o
peratin
g
revenu
e for th
e
period
Net p
rofit fo
r the
period
Net p
rofit o
f
the inv
estee
attribu
table t
o the
parent
comp
any
for th
e perio
d
Joint
ventur
es——
————
————
————
————
————
DHL-S
inotra
ns Inte
rnation
al Air C
ourier
Co., L
td.
Beijin
g, PR
CAir
-freigh
t cour
ierUS
D14.5
M50.
0050.
006,0
95,706
,179.4
1 2,6
53,682
,072.7
7 3,4
42,024
,106.6
4 8,6
36,707
,376.7
6 903
,429,4
19.00
903,42
9,419.
00
Dongg
uan Po
rt Cont
ainer
Port C
o., Lt
d.Do
ngguan
, PRC
Harbo
ur op
erating
RMB6
70M49.
0049.
001,4
71,700
,055.9
9863
,743,5
37.46
607,95
6,518.
53 86,
376,76
9.72
-22,60
9,051.
88 -22
,609,0
51.88
New L
and Br
idge (L
ianyun
gang)
Termin
al Co.,
Ltd.
Lianyu
ngang,
PRC
Port d
evelop
ment,
freight
forwa
rding
RMB3
95M42.
0042.
00550
,329,7
43.33
71,965
,486.2
8 478
,364,2
57.05
132,76
2,416.
54 13,
210,71
4.42
13,210
,714.4
2
Cheng
du Bo
nded L
ogistic
s Inves
tment
Co., L
td.
Sichua
n, PR
CLog
istics
RMB1
75M54.
2954.
29246
,780,0
58.15
15,825
,779.8
6 230
,954,2
78.29
15,857
,906.4
5 3,1
60,571
.95
3,160,
571.95
Total
————
————
——8,3
64,516
,036.8
8 3,6
05,216
,876.3
74,7
59,299
,160.5
18,8
71,704
,469.4
7 897
,191,6
53.49
897,19
1,653.
49
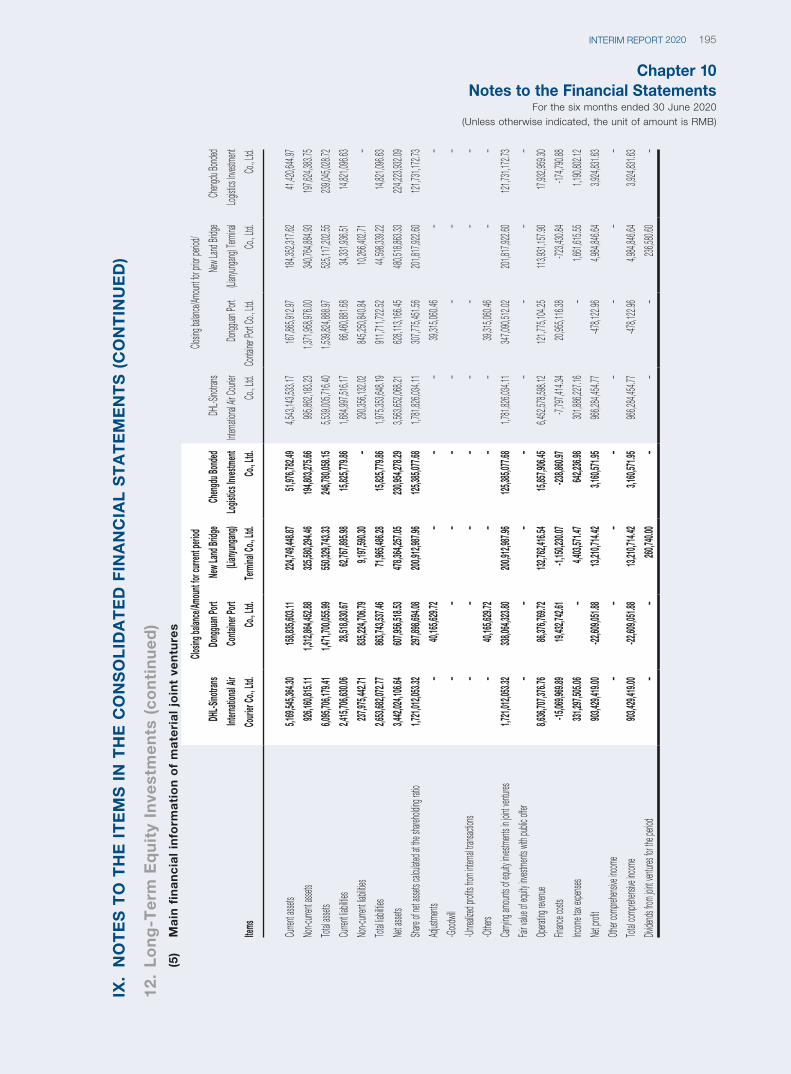
Chapter 10Notes to the Financial Statements
For the six months ended 30 June 2020(Unless otherwise indicated, the unit of amount is RMB)
195INTERIM REPORT 2020
IX.
NO
TE
S T
O T
HE
IT
EM
S I
N T
HE
CO
NS
OL
IDA
TE
D F
INA
NC
IAL
ST
AT
EM
EN
TS
(C
ON
TIN
UE
D)
12.
Lo
ng
-Te
rm E
qu
ity
Inve
stm
en
ts (
co
nti
nu
ed
)(5
) M
ain
fin
an
cia
l in
form
ati
on
of
ma
teri
al
join
t ve
ntu
res
Items
Closin
g bala
nce/A
moun
t for c
urren
t peri
odClo
sing b
alance
/Amoun
t for p
rior pe
riod/
DHL-S
inotra
ns
Intern
ation
al Air
Couri
er Co
., Ltd.
Dong
guan
Port
Conta
iner P
ort
Co., L
td.
New L
and B
ridge
(Lian
yunga
ng)
Term
inal C
o., Lt
d.
Chen
gdu B
onde
d
Logis
tics I
nvestm
ent
Co., L
td.
DHL-S
inotra
ns
Interna
tional A
ir Cour
ier
Co., L
td.
Dongg
uan Po
rt
Conta
iner P
ort Co
., Ltd.
New L
and Br
idge
(Lianyu
ngang)
Term
inal
Co., L
td.
Cheng
du Bo
nded
Logisti
cs Inv
estme
nt
Co., L
td.
Curre
nt ass
ets5,1
69,545
,364.3
0158
,835,6
03.11
224,74
9,448.
87 51,
976,78
2.49
4,543,
143,53
3.17
167,86
5,912.
97184
,352,3
17.62
41,420
,644.9
7
Non-c
urrent
asset
s926
,160,8
15.11
1,312,
864,45
2.88
325,58
0,294.
46 194
,803,2
75.66
995,86
2,183.
231,3
71,958
,976.0
0340
,764,8
84.93
197,62
4,383.
75
Total a
ssets
6,095,
706,17
9.41
1,471,
700,05
5.99
550,32
9,743.
33 246
,780,0
58.15
5,539,
005,71
6.40
1,539,
824,88
8.97
525,11
7,202.
55239
,045,0
28.72
Curre
nt liab
ilities
2,415,
706,63
0.06
28,518
,830.6
762,
767,89
5.98
15,825
,779.8
6 1,6
84,997
,516.1
766,
460,88
1.68
34,331
,936.5
114,
821,09
6.63
Non-c
urrent
liabili
ties237
,975,4
42.71
835,22
4,706.
799,1
97,590
.30
–290
,356,1
32.02
845,25
0,840.
8410,
266,40
2.71
–
Total l
iabilitie
s2,6
53,682
,072.7
7 863
,743,5
37.46
71,965
,486.2
8 15,
825,77
9.86
1,975,
353,64
8.19
911,71
1,722.
5244,
598,33
9.22
14,821
,096.6
3
Net a
ssets
3,442,
024,10
6.64
607,95
6,518.
53478
,364,2
57.05
230,95
4,278.
29 3,5
63,652
,068.2
1628
,113,1
66.45
480,51
8,863.
33224
,223,9
32.09
Share
of ne
t asse
ts calc
ulated
at th
e shar
eholdin
g ratio
1,721,
012,05
3.32
297,89
8,694.
08200
,912,9
87.96
125,38
5,077.
68 1,7
81,826
,034.1
1307
,775,4
51.56
201,81
7,922.
60121
,731,1
72.73
Adjus
tment
s–
40,165
,629.7
2–
––
39,315
,060.4
6–
–
-Good
will
––
––
––
––
-Unrea
lized p
rofits
from
interna
l trans
action
s–
––
––
––
–
-Other
s–
40,165
,629.7
2–
––
39,315
,060.4
6 –
–
Carryi
ng am
ounts o
f equity
invest
ments
in join
t ventu
res1,7
21,012
,053.3
2338
,064,3
23.80
200,91
2,987.
96 125
,385,0
77.68
1,781,
826,03
4.11
347,09
0,512.
02201
,817,9
22.60
121,73
1,172.
73
Fair va
lue of
equity
invest
ments
with
public
offer
––
––
––
––
Opera
ting re
venue
8,636,
707,37
6.76
86,376
,769.7
2132
,762,4
16.54
15,857
,906.4
5 6,4
52,578
,598.1
2121
,775,1
04.25
113,93
1,157.
9017,
932,95
9.30
Financ
e cost
s-15
,069,9
69.89
19,432
,742.6
1-1,
150,23
0.07
-238,8
60.97
-7,797
,414.3
420,
955,11
6.38
-723,4
30.84
-174,7
90.88
Incom
e tax
expens
es331
,297,5
05.06
–4,4
03,571
.47642
,236.9
8 301
,886,2
27.16
–1,6
61,615
.551,1
90,802
.12
Net p
rofit
903,42
9,419.
00-22
,609,0
51.88
13,210
,714.4
23,1
60,571
.95
966,28
4,454.
77-47
8,122.
964,9
84,846
.643,9
24,831
.63
Other
compre
hensiv
e incom
e–
––
––
––
–
Total c
ompre
hensiv
e incom
e903
,429,4
19.00
-22,60
9,051.
8813,
210,71
4.42
3,160,
571.95
966
,284,4
54.77
-478,1
22.96
4,984,
846.64
3,924,
831.63
Divide
nds fro
m join
t ventu
res fo
r the p
eriod
––
260,74
0.00
––
–236
,580.6
0–
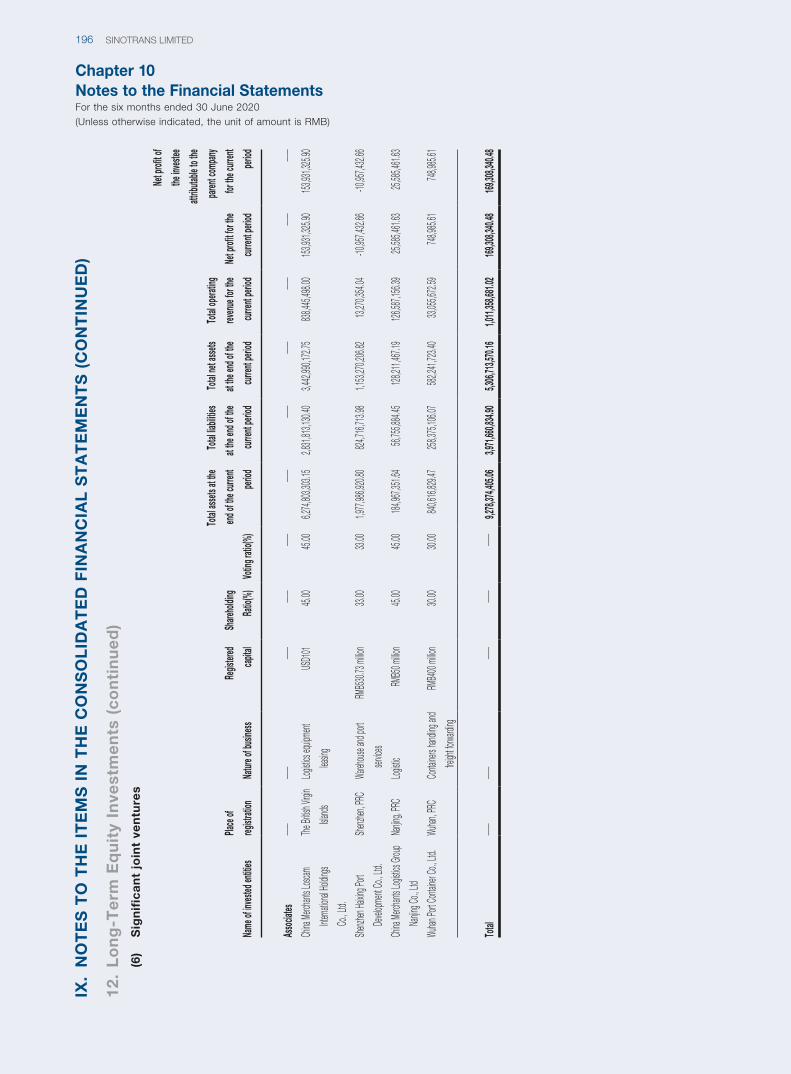
Chapter 10Notes to the Financial StatementsFor the six months ended 30 June 2020(Unless otherwise indicated, the unit of amount is RMB)
SINOTRANS LIMITED196
IX.
NO
TE
S T
O T
HE
IT
EM
S I
N T
HE
CO
NS
OL
IDA
TE
D F
INA
NC
IAL
ST
AT
EM
EN
TS
(C
ON
TIN
UE
D)
12.
Lo
ng
-Te
rm E
qu
ity
Inve
stm
en
ts (
co
nti
nu
ed
)(6
) S
ign
ific
an
t jo
int
ven
ture
s
Name
of in
vested
entiti
es
Place
of
regist
ration
Natur
e of b
usine
ss
Regis
tered
capit
al
Share
holdi
ng
Ratio
(%)
Votin
g rati
o(%)
Total
asset
s at th
e
end o
f the c
urren
t
perio
d
Total
liabil
ities
at the
end o
f the
curre
nt pe
riod
Total
net a
ssets
at the
end o
f the
curre
nt pe
riod
Total
opera
ting
reven
ue fo
r the
curre
nt pe
riod
Net p
rofit f
or the
curre
nt pe
riod
Net p
rofit o
f
the in
vestee
attrib
utable
to th
e
paren
t com
pany
for th
e curr
ent
perio
d
Asso
ciates
————
————
————
————
————
——Ch
ina M
erchan
ts Losc
am
Interna
tional H
olding
s
Co., L
td.
The Br
itish V
irgin
Islands
Logisti
cs equ
ipment
leasin
g
USD1
0145.
0045.
006,2
74,803
,303.1
5 2,8
31,813
,130.4
0 3,4
42,990
,172.7
5 838
,445,4
98.00
153,93
1,325.
90 153
,931,3
25.90
Shenz
hen Ha
ixing P
ort
Devel
opme
nt Co
., Ltd.
Shenz
hen, P
RCWa
rehous
e and
port
servic
es
RMB5
30.73
million
33.00
33.00
1,977,
986,92
0.80
824,71
6,713.
98 1,1
53,270
,206.8
2 13,
270,35
4.04
-10,95
7,432.
66 -10
,957,4
32.66
China
Merc
hants L
ogistic
s Grou
p
Nanjin
g Co.,
Ltd
Nanjin
g, PR
CLog
istic
RMB5
0 millio
n45.
0045.
00184
,967,3
51.64
56,755
,884.4
5 128
,211,4
67.19
126,58
7,156.
39 25,
585,46
1.63
25,585
,461.6
3
Wuhan
Port C
ontain
er Co
., Ltd.
Wuhan
, PRC
Conta
iners
handlin
g and
freight
forwa
rding
RMB4
00 mil
lion30.
0030.
00840
,616,8
29.47
258,37
5,106.
07 582
,241,7
23.40
33,055
,672.5
9 748
,985.6
1 748
,985.6
1
Total
————
————
——9,2
78,374
,405.0
6 3,9
71,660
,834.9
0 5,3
06,713
,570.1
6 1,0
11,358
,681.0
2 169
,308,3
40.48
169,30
8,340.
48
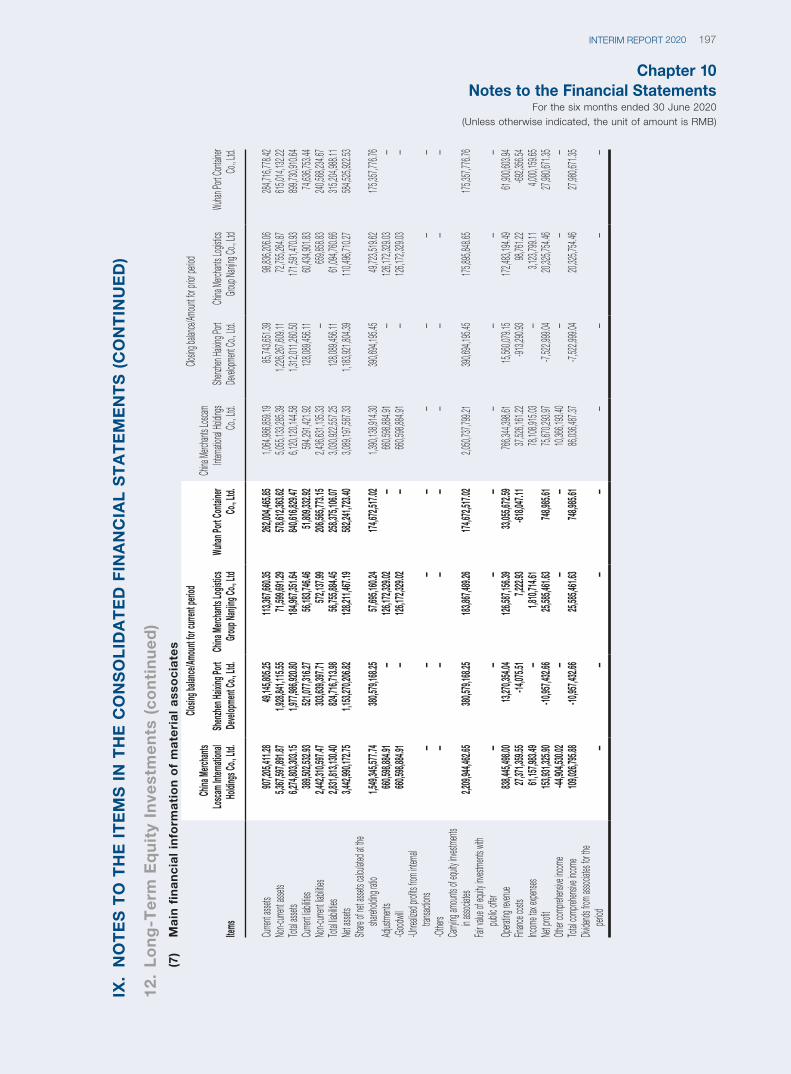
Chapter 10Notes to the Financial Statements
For the six months ended 30 June 2020(Unless otherwise indicated, the unit of amount is RMB)
197INTERIM REPORT 2020
IX.
NO
TE
S T
O T
HE
IT
EM
S I
N T
HE
CO
NS
OL
IDA
TE
D F
INA
NC
IAL
ST
AT
EM
EN
TS
(C
ON
TIN
UE
D)
12.
Lo
ng
-Te
rm E
qu
ity
Inve
stm
en
ts (
co
nti
nu
ed
)(7
) M
ain
fin
an
cia
l in
form
ati
on
of
ma
teri
al
ass
oc
iate
s
Items
Closin
g bala
nce/A
moun
t for c
urren
t peri
odClo
sing b
alance
/Amoun
t for p
rior pe
riodCh
ina M
ercha
nts
Losca
m Int
ernati
onal
Holdi
ngs C
o., Lt
d.Sh
enzhe
n Haix
ing Po
rt De
velop
ment
Co., L
td.Ch
ina M
ercha
nts Lo
gistic
s Gr
oup N
anjin
g Co.,
Ltd
Wuha
n Port
Conta
iner
Co., L
td.
China
Merc
hants L
oscam
Inte
rnation
al Hold
ings
Co., L
td.Sh
enzhen
Haixin
g Port
De
velop
ment
Co., L
td.Ch
ina M
erchan
ts Logi
stics
Group
Nanjin
g Co.,
Ltd
Wuhan
Port C
ontain
er Co
., Ltd.
Curre
nt ass
ets907
,205,4
11.28
49,145
,805.2
5113
,367,6
60.35
262,00
4,465.
85 1,0
64,986
,859.1
985,
743,65
1.39
98,836
,206.0
6284
,716,7
78.42
Non-c
urrent
asset
s5,3
67,597
,891.8
7 1,9
28,841
,115.5
571,
599,69
1.29
578,61
2,363.
62 5,0
55,133
,285.3
91,2
26,267
,609.1
172,
755,26
4.87
615,01
4,132.
22Tot
al asse
ts6,2
74,803
,303.1
5 1,9
77,986
,920.8
0184
,967,3
51.64
840,61
6,829.
47 6,1
20,120
,144.5
81,3
12,011
,260.5
0171
,591,4
70.93
899,73
0,910.
64Cu
rrent
liabilitie
s389
,502,5
32.93
521,07
7,316.
2756,
183,74
6.46
51,809
,332.9
2 594
,291,4
21.92
128,08
9,456.
1160,
434,90
1.83
74,636
,753.4
4No
n-curr
ent lia
bilities
2,442,
310,59
7.47
303,63
9,397.
71572
,137.9
9 206
,565,7
73.15
2,436,
631,13
5.33
—659
,858.8
3240
,568,2
34.67
Total l
iabilitie
s2,8
31,813
,130.4
0 824
,716,7
13.98
56,755
,884.4
5 258
,375,1
06.07
3,030,
922,55
7.25
128,08
9,456.
1161,
094,76
0.66
315,20
4,988.
11Ne
t asse
ts3,4
42,990
,172.7
5 1,1
53,270
,206.8
2128
,211,4
67.19
582,24
1,723.
40 3,0
89,197
,587.3
31,1
83,921
,804.3
9110
,496,7
10.27
584,52
5,922.
53Sh
are of
net a
ssets c
alcula
ted at
the
shareh
olding
ratio
1,549,
345,57
7.74
380,57
9,168.
2557,
695,16
0.24
174,67
2,517.
02 1,3
90,138
,914.3
0390
,694,1
95.45
49,723
,519.6
2175
,357,7
76.76
Adjus
tment
s660
,598,8
84.91
—126
,172,3
29.02
—660
,598,8
84.91
—126
,172,3
29.03
—-Go
odwil
l660
,598,8
84.91
—126
,172,3
29.02
—660
,598,8
84.91
—126
,172,3
29.03
—-Un
realize
d prof
its fro
m inte
rnal
transa
ctions
——
——
——
——
-Other
s—
——
——
——
—Ca
rrying
amoun
ts of eq
uity inv
estme
nts
in asso
ciates
2,209,
944,46
2.65
380,57
9,168.
25183
,867,4
89.26
174,67
2,517.
02 2,0
50,737
,799.2
1390
,694,1
95.45
175,89
5,848.
65175
,357,7
76.76
Fair va
lue of
equity
invest
ments
with
public
offer
——
——
——
——
Opera
ting re
venue
838,44
5,498.
00 13,
270,35
4.04
126,58
7,156.
39 33,
055,67
2.59
766,34
4,398.
6115,
560,07
9.15
172,48
3,194.
4961,
900,60
3.94
Financ
e cost
s27,
371,35
9.55
-14,07
5.51
7,222.
93 -61
8,047.
11 37,
526,16
1.22
-913,2
90.93
98,761
.22-69
2,356.
54Inc
ome t
ax exp
enses
61,157
,983.4
9 —
1,810,
714.61
78,
108,91
5.03
—3,1
23,799
.114,0
00,159
.65Ne
t prof
it153
,931,3
25.90
-10,95
7,432.
6625,
585,46
1.63
748,98
5.61
75,670
,293.9
7-7,
522,99
9.04
20,325
,754.4
627,
980,67
1.35
Other
compre
hensiv
e incom
e-44
,904,5
30.02
——
—10,
366,19
3.40
——
—Tot
al com
prehen
sive in
come
109,02
6,795.
88 -10
,957,4
32.66
25,585
,461.6
3 748
,985.6
1 86,
036,48
7.37
-7,522
,999.0
420,
325,75
4.46
27,980
,671.3
5Div
idends
from
associ
ates fo
r the
period
——
——
——
——
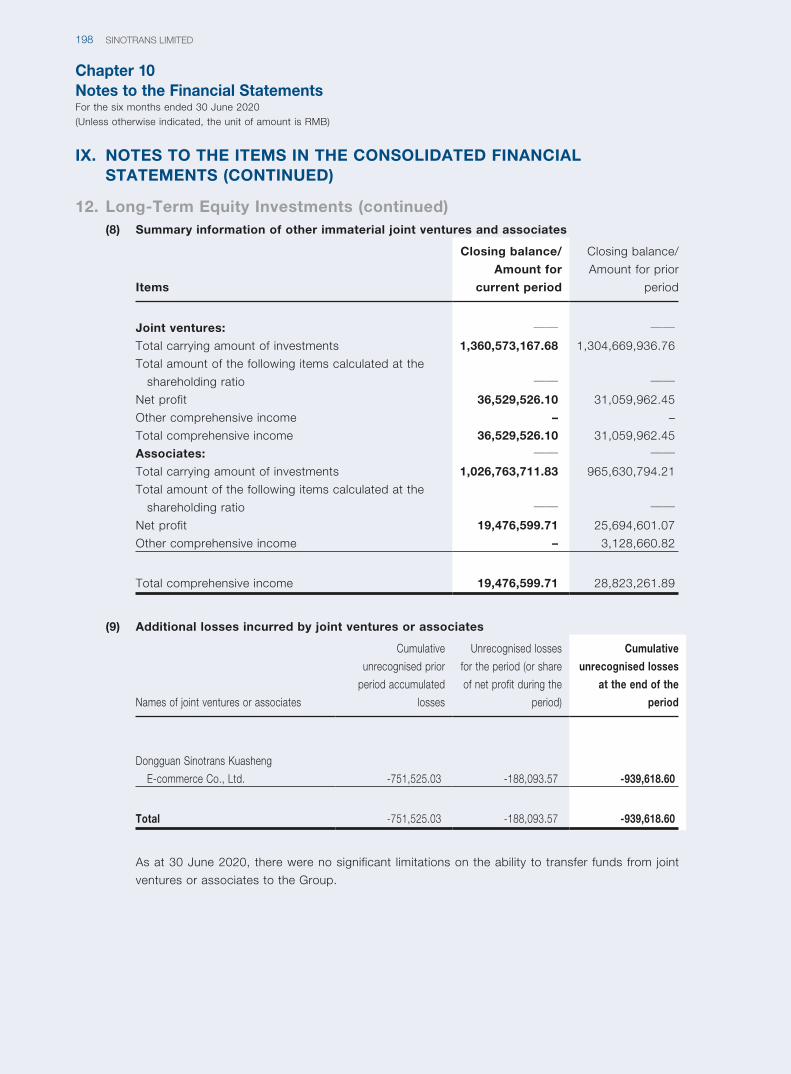
Chapter 10Notes to the Financial StatementsFor the six months ended 30 June 2020(Unless otherwise indicated, the unit of amount is RMB)
SINOTRANS LIMITED198
IX. NOTES TO THE ITEMS IN THE CONSOLIDATED FINANCIAL STATEMENTS (CONTINUED)
12. Long-Term Equity Investments (continued)(8) Summary information of other immaterial joint ventures and associates
Items
Closing balance/
Amount for
current period
Closing balance/
Amount for prior
period
Joint ventures: —— ——Total carrying amount of investments 1,360,573,167.68 1,304,669,936.76
Total amount of the following items calculated at the
shareholding ratio —— ——Net profit 36,529,526.10 31,059,962.45
Other comprehensive income – –
Total comprehensive income 36,529,526.10 31,059,962.45
Associates: —— ——Total carrying amount of investments 1,026,763,711.83 965,630,794.21
Total amount of the following items calculated at the
shareholding ratio —— ——Net profit 19,476,599.71 25,694,601.07
Other comprehensive income – 3,128,660.82
Total comprehensive income 19,476,599.71 28,823,261.89
(9) Additional losses incurred by joint ventures or associates
Names of joint ventures or associates
Cumulative
unrecognised prior
period accumulated
losses
Unrecognised losses
for the period (or share
of net profit during the
period)
Cumulative
unrecognised losses
at the end of the
period
Dongguan Sinotrans Kuasheng
E-commerce Co., Ltd. -751,525.03 -188,093.57 -939,618.60
Total -751,525.03 -188,093.57 -939,618.60
As at 30 June 2020, there were no significant limitations on the ability to transfer funds from joint
ventures or associates to the Group.
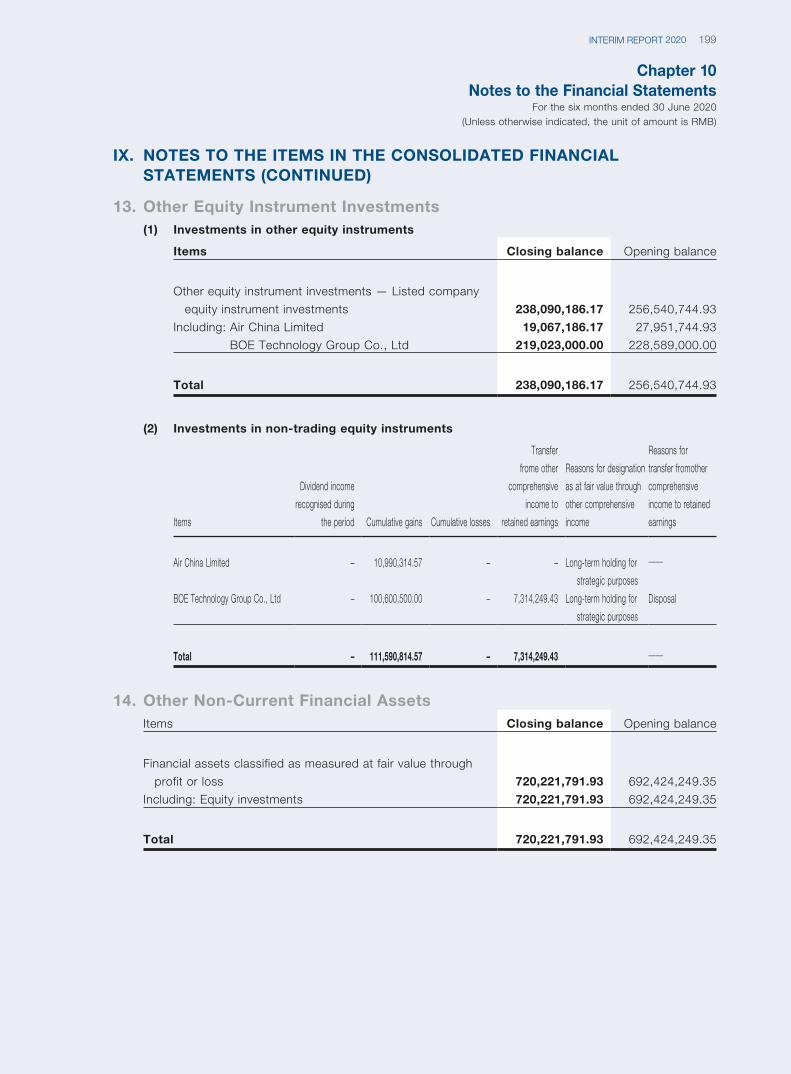
Chapter 10Notes to the Financial Statements
For the six months ended 30 June 2020(Unless otherwise indicated, the unit of amount is RMB)
199INTERIM REPORT 2020
IX. NOTES TO THE ITEMS IN THE CONSOLIDATED FINANCIAL STATEMENTS (CONTINUED)
13. Other Equity Instrument Investments(1) Investments in other equity instruments
Items Closing balance Opening balance
Other equity instrument investments — Listed company
equity instrument investments 238,090,186.17 256,540,744.93
Including: Air China Limited 19,067,186.17 27,951,744.93
BOE Technology Group Co., Ltd 219,023,000.00 228,589,000.00
Total 238,090,186.17 256,540,744.93
(2) Investments in non-trading equity instruments
Items
Dividend income
recognised during
the period Cumulative gains Cumulative losses
Transfer
frome other
comprehensive
income to
retained earnings
Reasons for designation
as at fair value through
other comprehensive
income
Reasons for
transfer fromother
comprehensive
income to retained
earnings
Air China Limited – 10,990,314.57 – – Long-term holding for
strategic purposes
——
BOE Technology Group Co., Ltd – 100,600,500.00 – 7,314,249.43 Long-term holding for
strategic purposes
Disposal
Total – 111,590,814.57 – 7,314,249.43 ——
14. Other Non-Current Financial AssetsItems Closing balance Opening balance
Financial assets classified as measured at fair value through
profit or loss 720,221,791.93 692,424,249.35
Including: Equity investments 720,221,791.93 692,424,249.35
Total 720,221,791.93 692,424,249.35
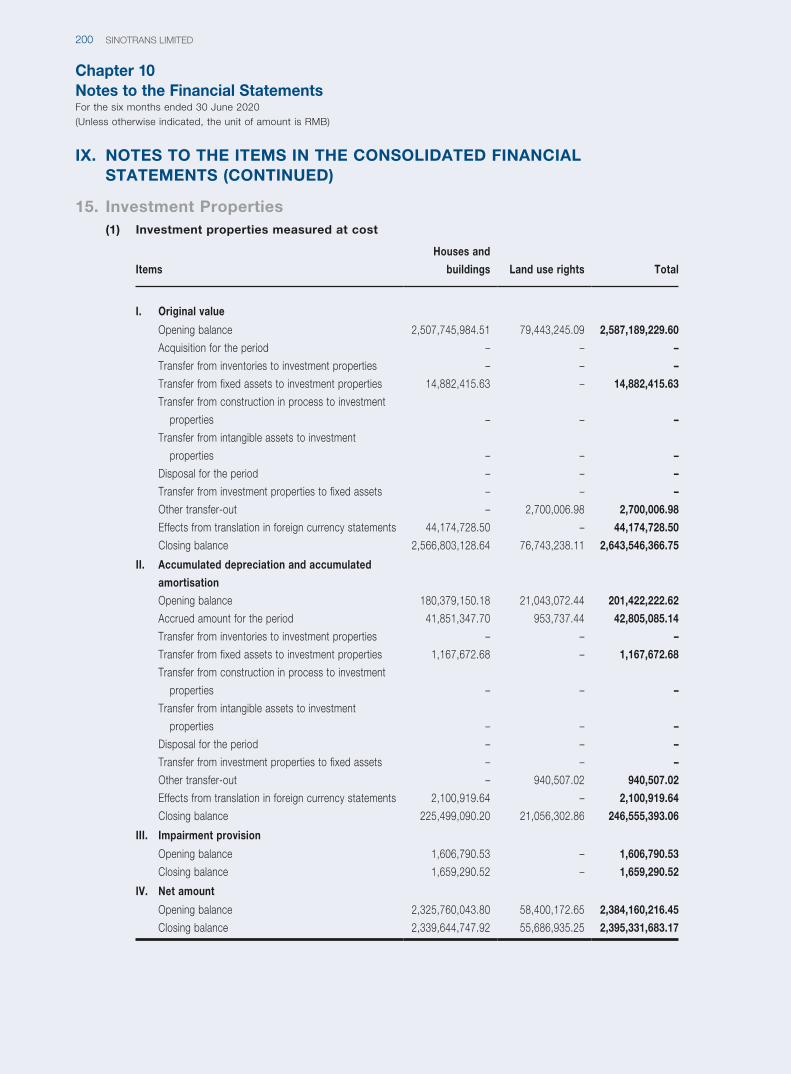
Chapter 10Notes to the Financial StatementsFor the six months ended 30 June 2020(Unless otherwise indicated, the unit of amount is RMB)
SINOTRANS LIMITED200
IX. NOTES TO THE ITEMS IN THE CONSOLIDATED FINANCIAL STATEMENTS (CONTINUED)
15. Investment Properties(1) Investment properties measured at cost
Items
Houses and
buildings Land use rights Total
I. Original value
Opening balance 2,507,745,984.51 79,443,245.09 2,587,189,229.60
Acquisition for the period – – –
Transfer from inventories to investment properties – – –
Transfer from fixed assets to investment properties 14,882,415.63 – 14,882,415.63
Transfer from construction in process to investment
properties – – –
Transfer from intangible assets to investment
properties – – –
Disposal for the period – – –
Transfer from investment properties to fixed assets – – –
Other transfer-out – 2,700,006.98 2,700,006.98
Effects from translation in foreign currency statements 44,174,728.50 – 44,174,728.50
Closing balance 2,566,803,128.64 76,743,238.11 2,643,546,366.75
II. Accumulated depreciation and accumulated
amortisation
Opening balance 180,379,150.18 21,043,072.44 201,422,222.62
Accrued amount for the period 41,851,347.70 953,737.44 42,805,085.14
Transfer from inventories to investment properties – – –
Transfer from fixed assets to investment properties 1,167,672.68 – 1,167,672.68
Transfer from construction in process to investment
properties – – –
Transfer from intangible assets to investment
properties – – –
Disposal for the period – – –
Transfer from investment properties to fixed assets – – –
Other transfer-out – 940,507.02 940,507.02
Effects from translation in foreign currency statements 2,100,919.64 – 2,100,919.64
Closing balance 225,499,090.20 21,056,302.86 246,555,393.06
III. Impairment provision
Opening balance 1,606,790.53 – 1,606,790.53
Closing balance 1,659,290.52 – 1,659,290.52
IV. Net amount
Opening balance 2,325,760,043.80 58,400,172.65 2,384,160,216.45
Closing balance 2,339,644,747.92 55,686,935.25 2,395,331,683.17
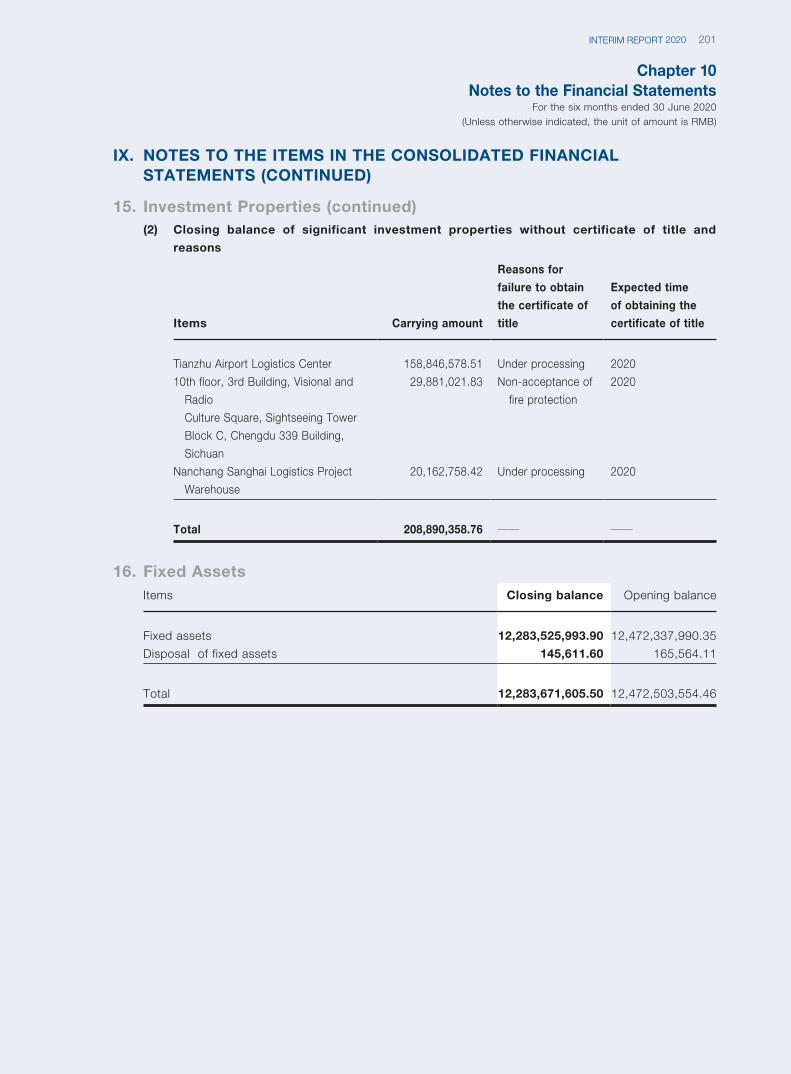
Chapter 10Notes to the Financial Statements
For the six months ended 30 June 2020(Unless otherwise indicated, the unit of amount is RMB)
201INTERIM REPORT 2020
IX. NOTES TO THE ITEMS IN THE CONSOLIDATED FINANCIAL STATEMENTS (CONTINUED)
15. Investment Properties (continued)(2) Closing balance of significant investment properties without certificate of title and
reasons
Items Carrying amount
Reasons for
failure to obtain
the certificate of
title
Expected time
of obtaining the
certificate of title
Tianzhu Airport Logistics Center 158,846,578.51 Under processing 2020
10th floor, 3rd Building, Visional and
Radio
Culture Square, Sightseeing Tower
Block C, Chengdu 339 Building,
Sichuan
29,881,021.83 Non-acceptance of
fire protection
2020
Nanchang Sanghai Logistics Project
Warehouse
20,162,758.42 Under processing 2020
Total 208,890,358.76 —— ——
16. Fixed AssetsItems Closing balance Opening balance
Fixed assets 12,283,525,993.90 12,472,337,990.35
Disposal of fixed assets 145,611.60 165,564.11
Total 12,283,671,605.50 12,472,503,554.46
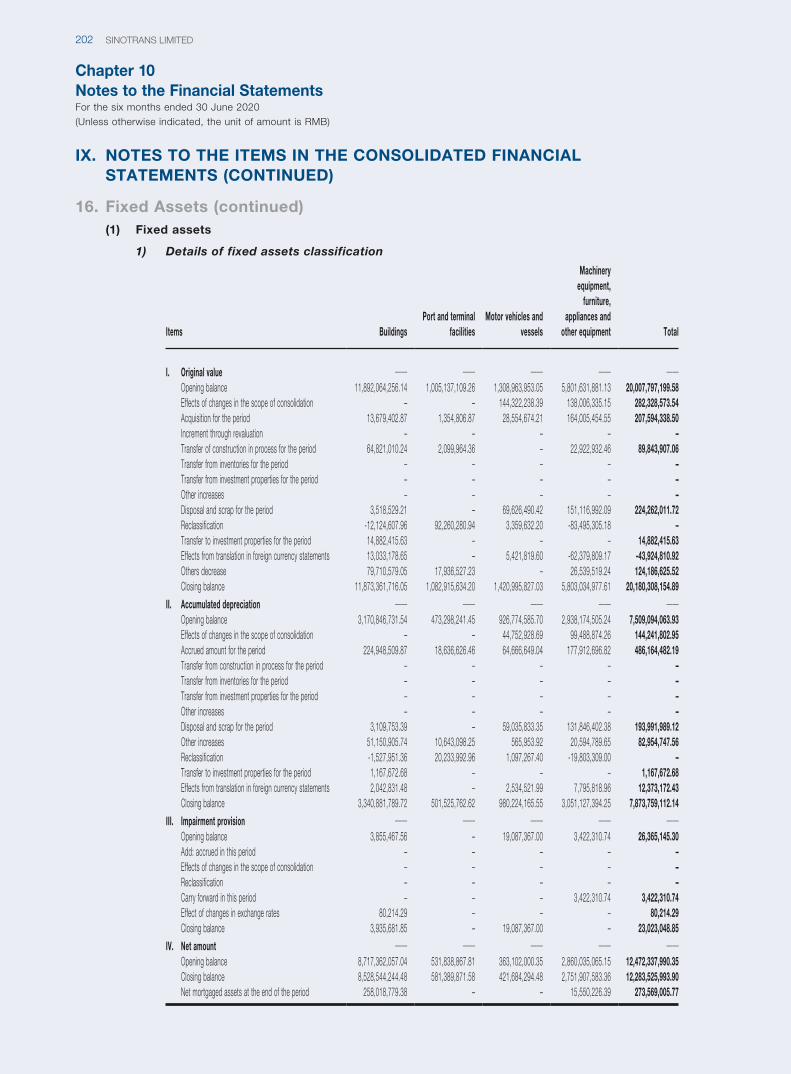
Chapter 10Notes to the Financial StatementsFor the six months ended 30 June 2020(Unless otherwise indicated, the unit of amount is RMB)
SINOTRANS LIMITED202
IX. NOTES TO THE ITEMS IN THE CONSOLIDATED FINANCIAL STATEMENTS (CONTINUED)
16. Fixed Assets (continued)(1) Fixed assets
1) Details of fixed assets classification
Items BuildingsPort and terminal
facilitiesMotor vehicles and
vessels
Machinery equipment,
furniture, appliances and
other equipment Total
I. Original value —— —— —— —— ——Opening balance 11,892,064,256.14 1,005,137,109.26 1,308,963,953.05 5,801,631,881.13 20,007,797,199.58Effects of changes in the scope of consolidation – – 144,322,238.39 138,006,335.15 282,328,573.54Acquisition for the period 13,679,402.87 1,354,806.87 28,554,674.21 164,005,454.55 207,594,338.50Increment through revaluation – – – – –Transfer of construction in process for the period 64,821,010.24 2,099,964.36 – 22,922,932.46 89,843,907.06Transfer from inventories for the period – – – – –Transfer from investment properties for the period – – – – –Other increases – – – – –Disposal and scrap for the period 3,518,529.21 – 69,626,490.42 151,116,992.09 224,262,011.72Reclassification -12,124,607.96 92,260,280.94 3,359,632.20 -83,495,305.18 –Transfer to investment properties for the period 14,882,415.63 – – – 14,882,415.63Effects from translation in foreign currency statements 13,033,178.65 – 5,421,819.60 -62,379,809.17 -43,924,810.92Others decrease 79,710,579.05 17,936,527.23 – 26,539,519.24 124,186,625.52Closing balance 11,873,361,716.05 1,082,915,634.20 1,420,995,827.03 5,803,034,977.61 20,180,308,154.89
II. Accumulated depreciation —— —— —— —— ——Opening balance 3,170,846,731.54 473,298,241.45 926,774,585.70 2,938,174,505.24 7,509,094,063.93Effects of changes in the scope of consolidation – – 44,752,928.69 99,488,874.26 144,241,802.95Accrued amount for the period 224,948,509.87 18,636,626.46 64,666,649.04 177,912,696.82 486,164,482.19Transfer from construction in process for the period – – – – –Transfer from inventories for the period – – – – –Transfer from investment properties for the period – – – – –Other increases – – – – –Disposal and scrap for the period 3,109,753.39 – 59,035,833.35 131,846,402.38 193,991,989.12Other increases 51,150,905.74 10,643,098.25 565,953.92 20,594,789.65 82,954,747.56Reclassification -1,527,951.36 20,233,992.96 1,097,267.40 -19,803,309.00 –Transfer to investment properties for the period 1,167,672.68 – – – 1,167,672.68Effects from translation in foreign currency statements 2,042,831.48 – 2,534,521.99 7,795,818.96 12,373,172.43Closing balance 3,340,881,789.72 501,525,762.62 980,224,165.55 3,051,127,394.25 7,873,759,112.14
III. Impairment provision —— —— —— —— ——Opening balance 3,855,467.56 – 19,087,367.00 3,422,310.74 26,365,145.30Add: accrued in this period – – – – –Effects of changes in the scope of consolidation – – – – –Reclassification – – – – –Carry forward in this period – – – 3,422,310.74 3,422,310.74Effect of changes in exchange rates 80,214.29 – – – 80,214.29Closing balance 3,935,681.85 – 19,087,367.00 – 23,023,048.85
IV. Net amount —— —— —— —— ——Opening balance 8,717,362,057.04 531,838,867.81 363,102,000.35 2,860,035,065.15 12,472,337,990.35Closing balance 8,528,544,244.48 581,389,871.58 421,684,294.48 2,751,907,583.36 12,283,525,993.90Net mortgaged assets at the end of the period 258,018,779.38 – – 15,550,226.39 273,569,005.77
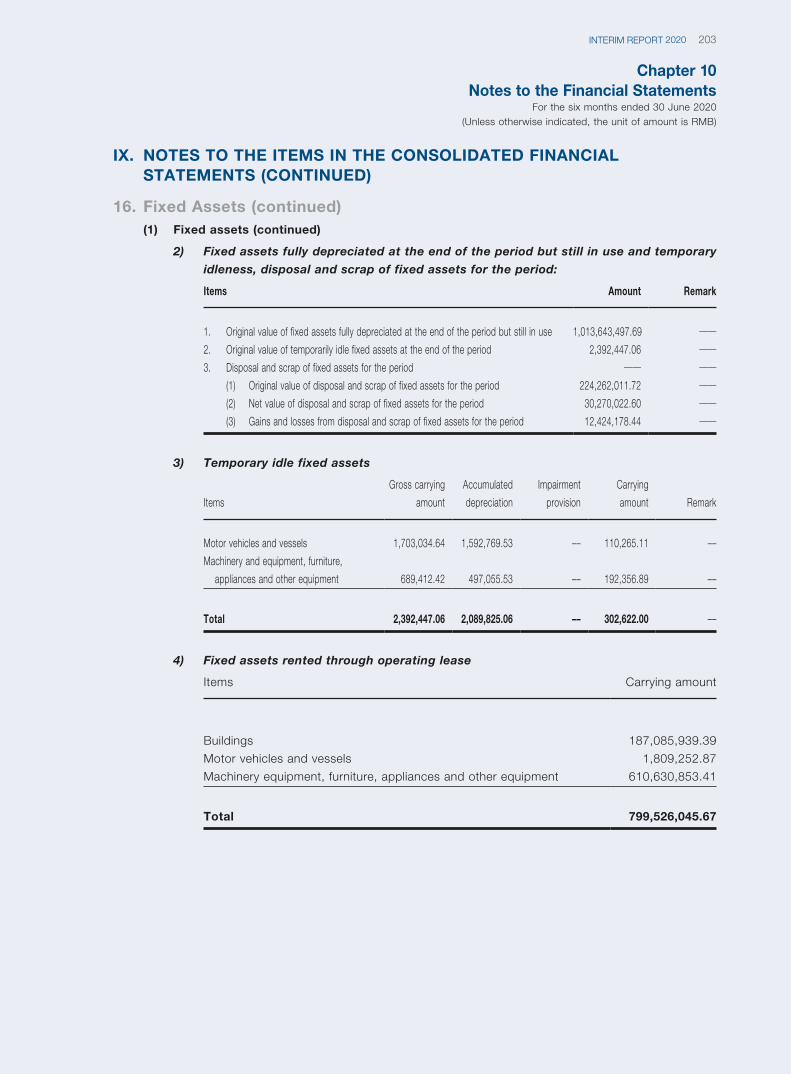
Chapter 10Notes to the Financial Statements
For the six months ended 30 June 2020(Unless otherwise indicated, the unit of amount is RMB)
203INTERIM REPORT 2020
IX. NOTES TO THE ITEMS IN THE CONSOLIDATED FINANCIAL STATEMENTS (CONTINUED)
16. Fixed Assets (continued)(1) Fixed assets (continued)
2) Fixed assets fully depreciated at the end of the period but still in use and temporary
idleness, disposal and scrap of fixed assets for the period:
Items Amount Remark
1. Original value of fixed assets fully depreciated at the end of the period but still in use 1,013,643,497.69 ——2. Original value of temporarily idle fixed assets at the end of the period 2,392,447.06 ——3. Disposal and scrap of fixed assets for the period —— ——
(1) Original value of disposal and scrap of fixed assets for the period 224,262,011.72 ——(2) Net value of disposal and scrap of fixed assets for the period 30,270,022.60 ——(3) Gains and losses from disposal and scrap of fixed assets for the period 12,424,178.44 ——
3) Temporary idle fixed assets
Items
Gross carrying
amount
Accumulated
depreciation
Impairment
provision
Carrying
amount Remark
Motor vehicles and vessels 1,703,034.64 1,592,769.53 –– 110,265.11 ––
Machinery and equipment, furniture,
appliances and other equipment 689,412.42 497,055.53 –– 192,356.89 ––
Total 2,392,447.06 2,089,825.06 –– 302,622.00 ––
4) Fixed assets rented through operating lease
Items Carrying amount
Buildings 187,085,939.39
Motor vehicles and vessels 1,809,252.87
Machinery equipment, furniture, appliances and other equipment 610,630,853.41
Total 799,526,045.67
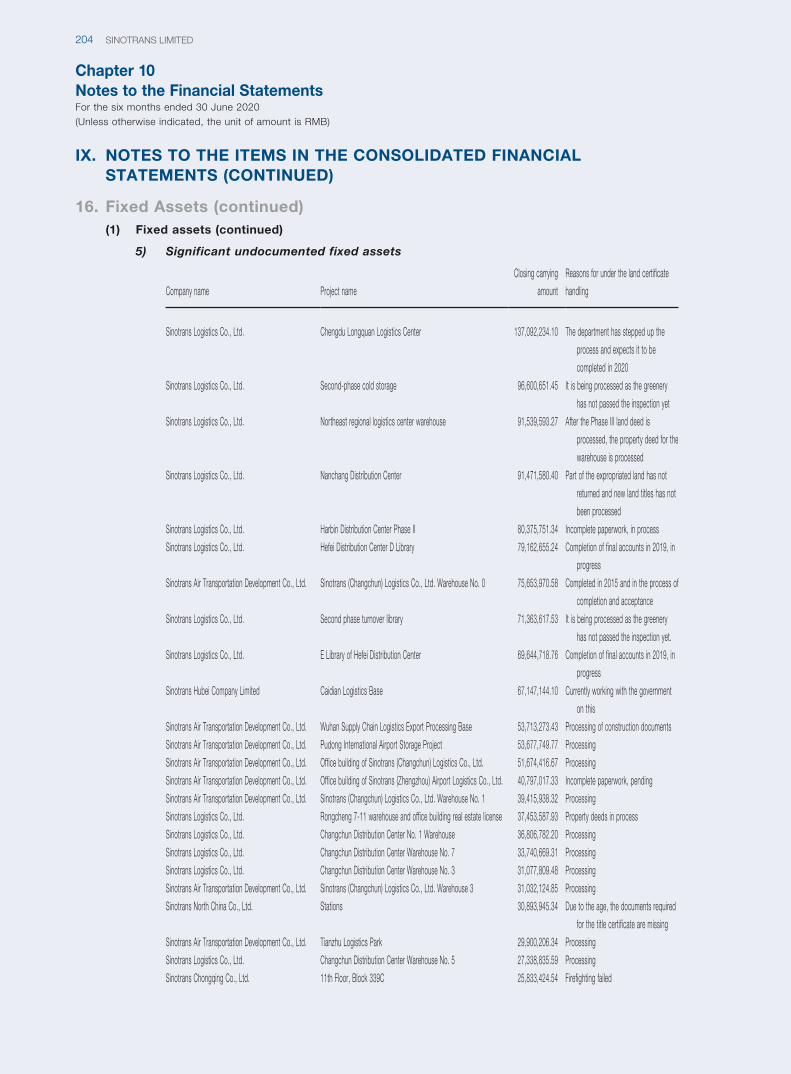
Chapter 10Notes to the Financial StatementsFor the six months ended 30 June 2020(Unless otherwise indicated, the unit of amount is RMB)
SINOTRANS LIMITED204
IX. NOTES TO THE ITEMS IN THE CONSOLIDATED FINANCIAL STATEMENTS (CONTINUED)
16. Fixed Assets (continued)(1) Fixed assets (continued)
5) Significant undocumented fixed assets
Company name Project name
Closing carrying
amount
Reasons for under the land certificate
handling
Sinotrans Logistics Co., Ltd. Chengdu Longquan Logistics Center 137,092,234.10 The department has stepped up the
process and expects it to be
completed in 2020
Sinotrans Logistics Co., Ltd. Second-phase cold storage 96,600,651.45 It is being processed as the greenery
has not passed the inspection yet
Sinotrans Logistics Co., Ltd. Northeast regional logistics center warehouse 91,539,593.27 After the Phase III land deed is
processed, the property deed for the
warehouse is processed
Sinotrans Logistics Co., Ltd. Nanchang Distribution Center 91,471,580.40 Part of the expropriated land has not
returned and new land titles has not
been processed
Sinotrans Logistics Co., Ltd. Harbin Distribution Center Phase II 80,375,751.34 Incomplete paperwork, in process
Sinotrans Logistics Co., Ltd. Hefei Distribution Center D Library 79,162,655.24 Completion of final accounts in 2019, in
progress
Sinotrans Air Transportation Development Co., Ltd. Sinotrans (Changchun) Logistics Co., Ltd. Warehouse No. 0 75,653,970.58 Completed in 2015 and in the process of
completion and acceptance
Sinotrans Logistics Co., Ltd. Second phase turnover library 71,363,617.53 It is being processed as the greenery
has not passed the inspection yet.
Sinotrans Logistics Co., Ltd. E Library of Hefei Distribution Center 69,644,718.76 Completion of final accounts in 2019, in
progress
Sinotrans Hubei Company Limited Caidian Logistics Base 67,147,144.10 Currently working with the government
on this
Sinotrans Air Transportation Development Co., Ltd. Wuhan Supply Chain Logistics Export Processing Base 53,713,273.43 Processing of construction documents
Sinotrans Air Transportation Development Co., Ltd. Pudong International Airport Storage Project 53,677,749.77 Processing
Sinotrans Air Transportation Development Co., Ltd. Office building of Sinotrans (Changchun) Logistics Co., Ltd. 51,674,416.67 Processing
Sinotrans Air Transportation Development Co., Ltd. Office building of Sinotrans (Zhengzhou) Airport Logistics Co., Ltd. 40,797,017.33 Incomplete paperwork, pending
Sinotrans Air Transportation Development Co., Ltd. Sinotrans (Changchun) Logistics Co., Ltd. Warehouse No. 1 39,415,938.32 Processing
Sinotrans Logistics Co., Ltd. Rongcheng 7-11 warehouse and office building real estate license 37,453,587.93 Property deeds in process
Sinotrans Logistics Co., Ltd. Changchun Distribution Center No. 1 Warehouse 36,806,782.20 Processing
Sinotrans Logistics Co., Ltd. Changchun Distribution Center Warehouse No. 7 33,740,669.31 Processing
Sinotrans Logistics Co., Ltd. Changchun Distribution Center Warehouse No. 3 31,077,809.48 Processing
Sinotrans Air Transportation Development Co., Ltd. Sinotrans (Changchun) Logistics Co., Ltd. Warehouse 3 31,032,124.85 Processing
Sinotrans North China Co., Ltd. Stations 30,893,945.34 Due to the age, the documents required
for the title certificate are missing
Sinotrans Air Transportation Development Co., Ltd. Tianzhu Logistics Park 29,900,206.34 Processing
Sinotrans Logistics Co., Ltd. Changchun Distribution Center Warehouse No. 5 27,338,835.59 Processing
Sinotrans Chongqing Co., Ltd. 11th Floor, Block 339C 25,833,424.54 Firefighting failed
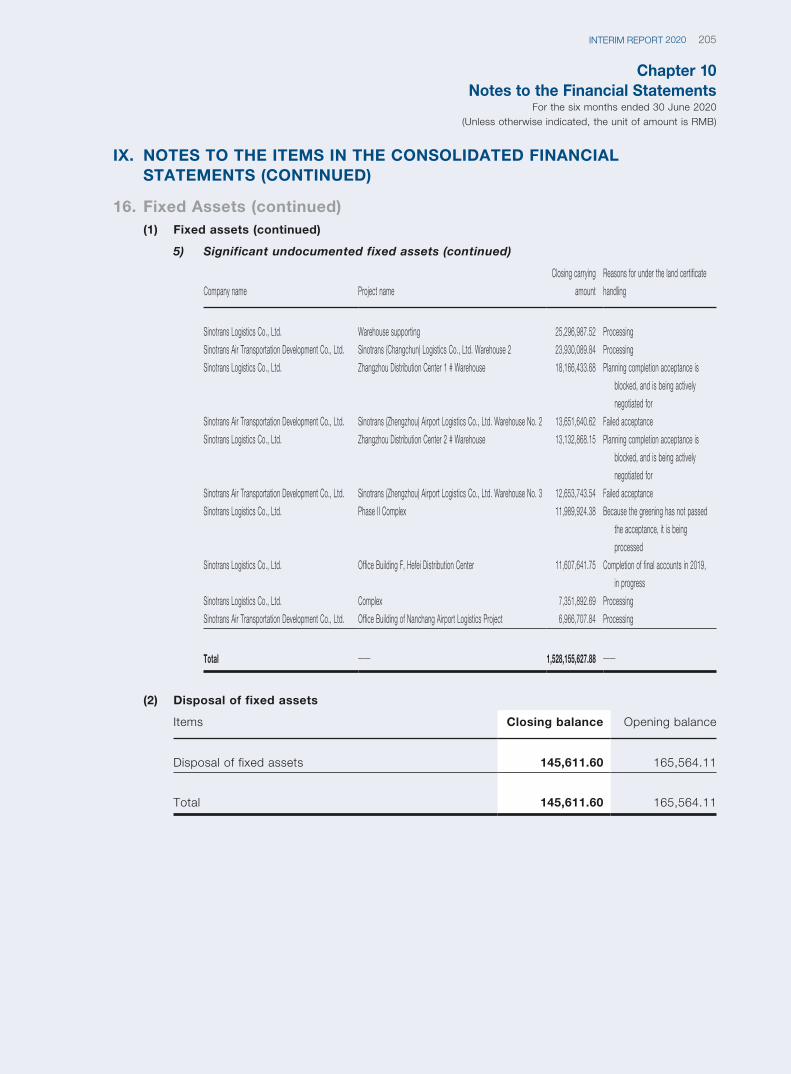
Chapter 10Notes to the Financial Statements
For the six months ended 30 June 2020(Unless otherwise indicated, the unit of amount is RMB)
205INTERIM REPORT 2020
Company name Project name
Closing carrying
amount
Reasons for under the land certificate
handling
Sinotrans Logistics Co., Ltd. Warehouse supporting 25,296,987.52 Processing
Sinotrans Air Transportation Development Co., Ltd. Sinotrans (Changchun) Logistics Co., Ltd. Warehouse 2 23,930,089.84 Processing
Sinotrans Logistics Co., Ltd. Zhangzhou Distribution Center 1 # Warehouse 18,166,433.68 Planning completion acceptance is
blocked, and is being actively
negotiated for
Sinotrans Air Transportation Development Co., Ltd. Sinotrans (Zhengzhou) Airport Logistics Co., Ltd. Warehouse No. 2 13,651,640.62 Failed acceptance
Sinotrans Logistics Co., Ltd. Zhangzhou Distribution Center 2 # Warehouse 13,132,868.15 Planning completion acceptance is
blocked, and is being actively
negotiated for
Sinotrans Air Transportation Development Co., Ltd. Sinotrans (Zhengzhou) Airport Logistics Co., Ltd. Warehouse No. 3 12,653,743.54 Failed acceptance
Sinotrans Logistics Co., Ltd. Phase II Complex 11,989,924.38 Because the greening has not passed
the acceptance, it is being
processed
Sinotrans Logistics Co., Ltd. Office Building F, Hefei Distribution Center 11,607,641.75 Completion of final accounts in 2019,
in progress
Sinotrans Logistics Co., Ltd. Complex 7,351,892.69 Processing
Sinotrans Air Transportation Development Co., Ltd. Office Building of Nanchang Airport Logistics Project 6,966,707.84 Processing
Total —— 1,528,155,627.88 ——
(2) Disposal of fixed assets
Items Closing balance Opening balance
Disposal of fixed assets 145,611.60 165,564.11
Total 145,611.60 165,564.11
IX. NOTES TO THE ITEMS IN THE CONSOLIDATED FINANCIAL STATEMENTS (CONTINUED)
16. Fixed Assets (continued)(1) Fixed assets (continued)
5) Significant undocumented fixed assets (continued)

Chapter 10Notes to the Financial StatementsFor the six months ended 30 June 2020(Unless otherwise indicated, the unit of amount is RMB)
SINOTRANS LIMITED206
IX. NOTES TO THE ITEMS IN THE CONSOLIDATED FINANCIAL STATEMENTS (CONTINUED)
17. Construction in Progress(1) Details of construction in progress
Items
Closing balance Opening balance
Gross
carrying amount
Impairment
provision Carrying amount
Gross carrying
amount
Impairment
provision Carrying amount
Public Terminal in High-tech Zone of
Jiangmen City 809,658,579.05 – 809,658,579.05 719,533,510.25 – 719,533,510.25
Shaanxi Company Distribution Center 321,241,978.42 – 321,241,978.42 303,032,478.96 – 303,032,478.96
Guangxi Nanning Distribution Center 189,427,229.11 – 189,427,229.11 187,952,748.08 – 187,952,748.08
Meishan Consolidation Procurement
Logistics Center Project 183,029,954.17 – 183,029,954.17 112,611,217.69 – 112,611,217.69
Qingdao Logistics Center Project 155,614,073.81 – 155,614,073.81 154,865,130.17 – 154,865,130.17
Jiaozhou Smart Logistics Warehouse 89,645,825.85 – 89,645,825.85 68,574,183.53 – 68,574,183.53
Sinotrans Tianjin Airport Comprehensive
Logistics Base Project 70,781,488.54 – 70,781,488.54 63,798,704.06 – 63,798,704.06
Comprehensive Bonded Zone Storage
Project 50,148,779.21 – 50,148,779.21 49,182,519.14 – 49,182,519.14
Lianyungang Shanghe Logistics Park
Project 43,411,384.62 – 43,411,384.62 31,179,159.59 – 31,179,159.59
Hengxi warehouse 41,985,093.53 – 41,985,093.53 40,729,157.25 – 40,729,157.25
Hefei Airport Logistics Center Project 39,754,072.54 – 39,754,072.54 39,230,123.02 – 39,230,123.02
Sinotrans Changchun Logistics Center
Project 35,945,276.13 – 35,945,276.13 28,182,233.22 – 28,182,233.22
Shanghai Cold Chain Logistics Phase I
Project 31,108,547.72 – 31,108,547.72 5,070,683.22 – 5,070,683.22
Yunnan Company Distribution Center 26,227,813.36 – 26,227,813.36 20,203,674.12 – 20,203,674.12
Zhengzhou Airport Logistics Park
Warehouse1 23,483,962.14 – 23,483,962.14 23,483,962.14 – 23,483,962.14
Jinzhou Warehouse 21,923,133.51 – 21,923,133.51 21,532,603.51 – 21,532,603.51
Fangchenggang Dongwan Phase II
Project 21,206,225.97 – 21,206,225.97 21,133,540.83 – 21,133,540.83
Sinotrans Chengdu Qingbaijiang Cold
Chain Logistics Park Project 20,180,364.35 – 20,180,364.35 5,588,339.36 – 5,588,339.36
Dockside 500-day shoreline modification
and expansion declaration project 20,110,131.00 – 20,110,131.00 9,351,569.68 – 9,351,569.68
Cold storage 17,827,790.20 – 17,827,790.20 15,450,093.99 – 15,450,093.99
Other projects 210,209,105.66 20,822,000.00 189,387,105.66 254,633,311.54 20,822,000.00 233,811,311.54
Total 2,422,920,808.89 20,822,000.00 2,402,098,808.89 2,175,318,943.35 20,822,000.00 2,154,496,943.35
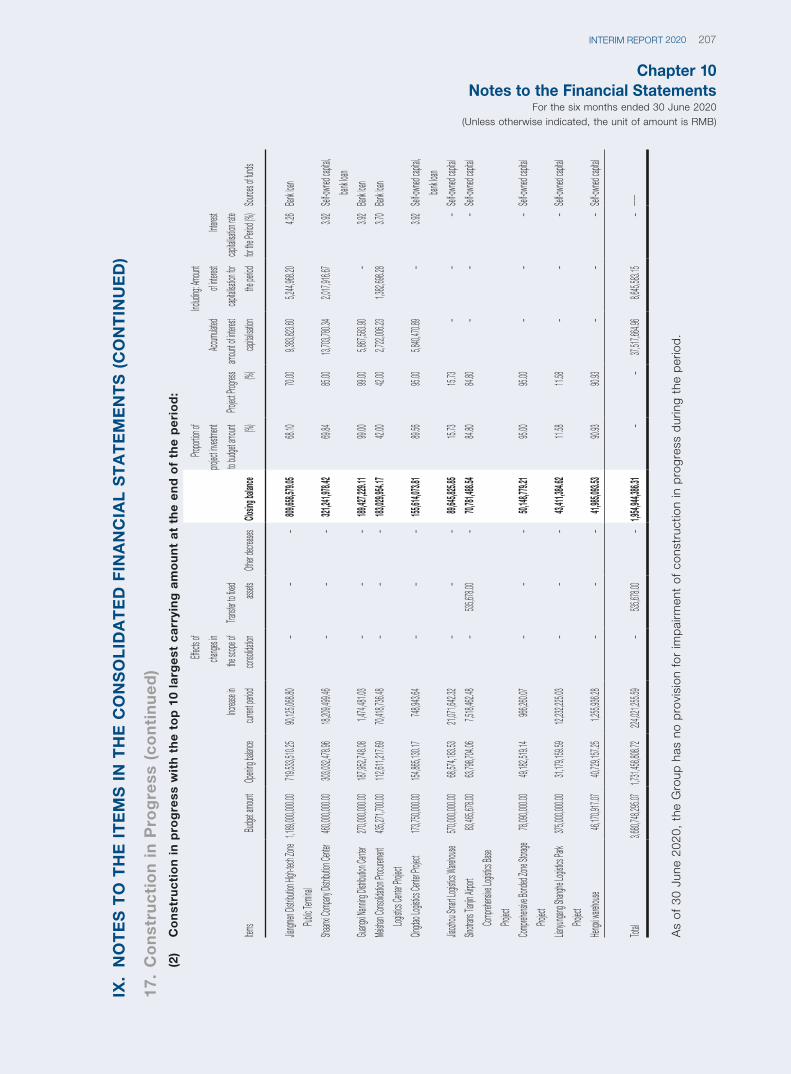
Chapter 10Notes to the Financial Statements
For the six months ended 30 June 2020(Unless otherwise indicated, the unit of amount is RMB)
207INTERIM REPORT 2020
IX.
NO
TE
S T
O T
HE
IT
EM
S I
N T
HE
CO
NS
OL
IDA
TE
D F
INA
NC
IAL
ST
AT
EM
EN
TS
(C
ON
TIN
UE
D)
17.
Co
nst
ruc
tio
n i
n P
rog
ress
(c
on
tin
ue
d)
(2)
Co
nst
ruc
tio
n i
n p
rog
ress
wit
h t
he
to
p 1
0 la
rge
st c
arr
yin
g a
mo
un
t a
t th
e e
nd
of
the
pe
rio
d:
Items
Budget
amoun
tOp
ening
balanc
e
Increa
se in
curren
t period
Effects
of
change
s in
the sc
ope of
consoli
dation
Transf
er to fi
xed
assets
Other d
ecreas
esClo
sing b
alance
Propor
tion of
project
invest
ment
to budg
et amo
unt
(%)
Project
Progr
ess
(%)
Accum
ulated
amoun
t of int
erest
capitali
sation
Includ
ing: Am
ount
of inte
rest
capitali
sation
for
the pe
riod
Interes
t
capitali
sation
rate
for the
Period
(%)
Source
s of fu
nds
Jiangm
en Dis
tributio
n High
-tech Z
one
Public T
ermina
l
1,189,
000,00
0.00
719,53
3,510.
2590,
125,06
8.80
––
–809
,658,5
79.05
68.10
70.00
9,383,
823.60
5,244,
968.20
4.26
Bank lo
an
Shaanx
i Comp
any Dis
tributio
n Cent
er460
,000,0
00.00
303,03
2,478.
9618,
209,49
9.46
––
–321
,241,9
78.42
69.84
85.00
13,703
,780.3
42,0
17,916
.673.9
2Sel
f-owned
capita
l,
bank lo
an
Guang
xi Nann
ing Dis
tributio
n Cent
er270
,000,0
00.00
187,95
2,748.
081,4
74,481
.03–
––
189,42
7,229.
1199.
0099.
005,8
67,583
.90–
3.92
Bank lo
an
Meisha
n Cons
olidatio
n Proc
ureme
nt
Logistic
s Cent
er Proje
ct
435,27
1,700.
00112
,611,2
17.69
70,418
,736.4
8–
––
183,02
9,954.
1742.
0042.
002,7
22,006
.231,3
82,698
.283.7
0Ban
k loan
Qingda
o Logi
stics C
enter P
roject
173,75
0,000.
00154
,865,1
30.17
748,94
3.64
––
–155
,614,0
73.81
89.56
95.00
5,840,
470.89
–3.9
2Sel
f-owned
capita
l,
bank lo
an
Jiaozho
u Sma
rt Logi
stics W
arehou
se570
,000,0
00.00
68,574
,183.5
321,
071,64
2.32
––
–89,
645,82
5.85
15.73
15.73
––
–Sel
f-owned
capita
l
Sinotra
ns Tia
njin Air
port
Comp
rehens
ive Log
istics B
ase
Project
83,465
,678.0
063,
798,70
4.06
7,518,
462.48
–535
,678.0
0–
70,781
,488.5
484.
8084.
80–
––
Self-ow
ned ca
pital
Comp
rehens
ive Bon
ded Zo
ne Sto
rage
Project
78,090
,000.0
049,
182,51
9.14
966,26
0.07
––
–50,
148,77
9.21
95.00
95.00
––
–Sel
f-owned
capita
l
Lianyu
ngang
Shangh
e Logi
stics P
ark
Project
375,00
0,000.
0031,
179,15
9.59
12,232
,225.0
3–
––
43,411
,384.6
211.
5811.
58–
––
Self-ow
ned ca
pital
Hengxi
wareh
ouse
46,170
,917.0
740,
729,15
7.25
1,255,
936.28
––
–41,
985,09
3.53
90.93
90.93
––
–Sel
f-owned
capita
l
Total
3,680,
748,29
5.07
1,731,
458,80
8.72
224,02
1,255.
59–
535,67
8.00
–1,9
54,944
,386.3
1–
–37,
517,66
4.96
8,645,
583.15
–——
As
of 3
0 Ju
ne 2
020,
the
Gro
up h
as n
o p
rovi
sion
for
imp
airm
ent
of c
onst
ruct
ion
in p
rogr
ess
dur
ing
the
per
iod
.
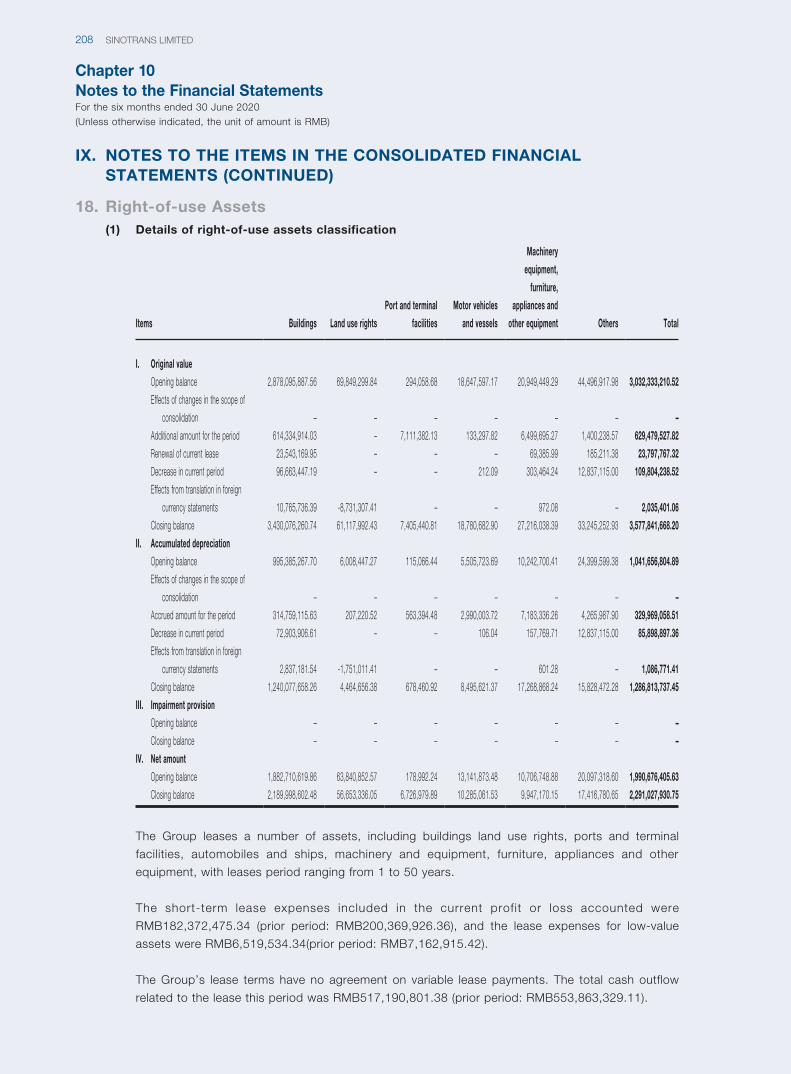
Chapter 10Notes to the Financial StatementsFor the six months ended 30 June 2020(Unless otherwise indicated, the unit of amount is RMB)
SINOTRANS LIMITED208
IX. NOTES TO THE ITEMS IN THE CONSOLIDATED FINANCIAL STATEMENTS (CONTINUED)
18. Right-of-use Assets(1) Details of right-of-use assets classification
Items Buildings Land use rights
Port and terminal
facilities
Motor vehicles
and vessels
Machinery
equipment,
furniture,
appliances and
other equipment Others Total
I. Original value
Opening balance 2,878,095,887.56 69,849,299.84 294,058.68 18,647,597.17 20,949,449.29 44,496,917.98 3,032,333,210.52
Effects of changes in the scope of
consolidation – – – – – – –
Additional amount for the period 614,334,914.03 – 7,111,382.13 133,297.82 6,499,695.27 1,400,238.57 629,479,527.82
Renewal of current lease 23,543,169.95 – – – 69,385.99 185,211.38 23,797,767.32
Decrease in current period 96,663,447.19 – – 212.09 303,464.24 12,837,115.00 109,804,238.52
Effects from translation in foreign
currency statements 10,765,736.39 -8,731,307.41 – – 972.08 – 2,035,401.06
Closing balance 3,430,076,260.74 61,117,992.43 7,405,440.81 18,780,682.90 27,216,038.39 33,245,252.93 3,577,841,668.20
II. Accumulated depreciation
Opening balance 995,385,267.70 6,008,447.27 115,066.44 5,505,723.69 10,242,700.41 24,399,599.38 1,041,656,804.89
Effects of changes in the scope of
consolidation – – – – – – –
Accrued amount for the period 314,759,115.63 207,220.52 563,394.48 2,990,003.72 7,183,336.26 4,265,987.90 329,969,058.51
Decrease in current period 72,903,906.61 – – 106.04 157,769.71 12,837,115.00 85,898,897.36
Effects from translation in foreign
currency statements 2,837,181.54 -1,751,011.41 – – 601.28 – 1,086,771.41
Closing balance 1,240,077,658.26 4,464,656.38 678,460.92 8,495,621.37 17,268,868.24 15,828,472.28 1,286,813,737.45
III. Impairment provision
Opening balance – – – – – – –
Closing balance – – – – – – –
IV. Net amount
Opening balance 1,882,710,619.86 63,840,852.57 178,992.24 13,141,873.48 10,706,748.88 20,097,318.60 1,990,676,405.63
Closing balance 2,189,998,602.48 56,653,336.05 6,726,979.89 10,285,061.53 9,947,170.15 17,416,780.65 2,291,027,930.75
The Group leases a number of assets, including buildings land use rights, ports and terminal
facilities, automobiles and ships, machinery and equipment, furniture, appliances and other
equipment, with leases period ranging from 1 to 50 years.
The short-term lease expenses included in the current profit or loss accounted were
RMB182,372,475.34 (prior period: RMB200,369,926.36), and the lease expenses for low-value
assets were RMB6,519,534.34(prior period: RMB7,162,915.42).
The Group’s lease terms have no agreement on variable lease payments. The total cash outflow
related to the lease this period was RMB517,190,801.38 (prior period: RMB553,863,329.11).
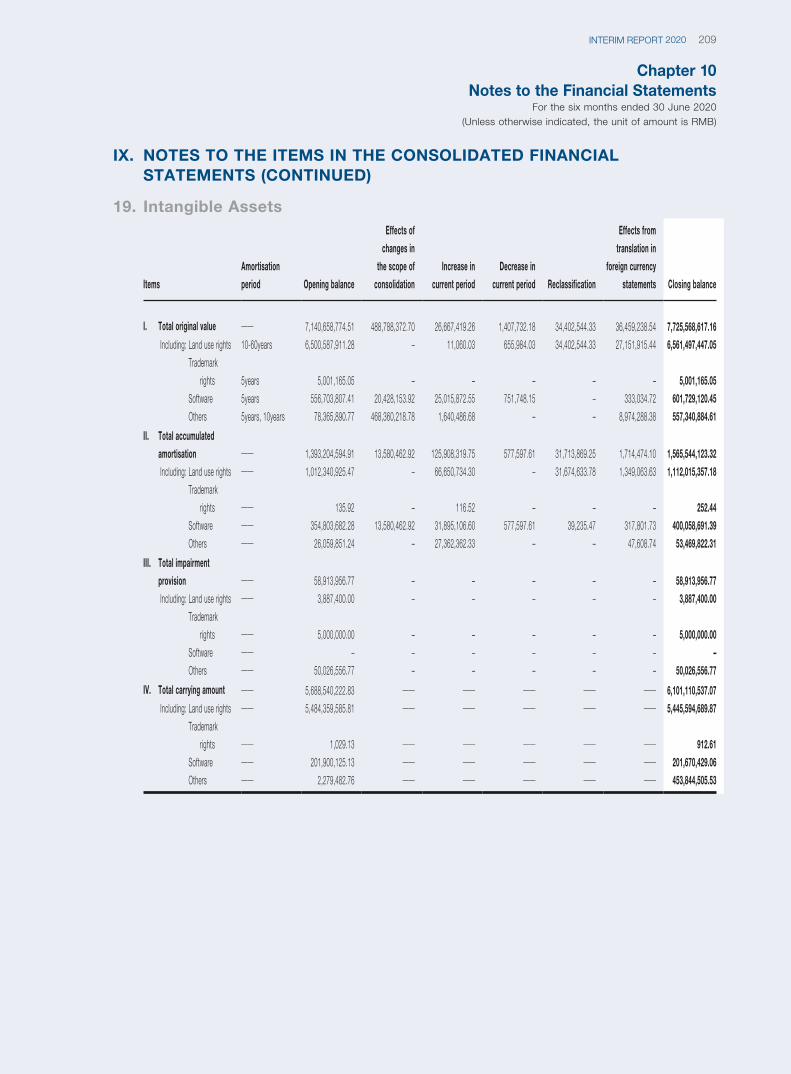
Chapter 10Notes to the Financial Statements
For the six months ended 30 June 2020(Unless otherwise indicated, the unit of amount is RMB)
209INTERIM REPORT 2020
IX. NOTES TO THE ITEMS IN THE CONSOLIDATED FINANCIAL STATEMENTS (CONTINUED)
19. Intangible Assets
Items
Amortisation
period Opening balance
Effects of
changes in
the scope of
consolidation
Increase in
current period
Decrease in
current period Reclassification
Effects from
translation in
foreign currency
statements Closing balance
I. Total original value —— 7,140,658,774.51 488,788,372.70 26,667,419.26 1,407,732.18 34,402,544.33 36,459,238.54 7,725,568,617.16
Including: Land use rights 10-60years 6,500,587,911.28 – 11,060.03 655,984.03 34,402,544.33 27,151,915.44 6,561,497,447.05
Trademark
rights 5years 5,001,165.05 – – – – – 5,001,165.05
Software 5years 556,703,807.41 20,428,153.92 25,015,872.55 751,748.15 – 333,034.72 601,729,120.45
Others 5years, 10years 78,365,890.77 468,360,218.78 1,640,486.68 – – 8,974,288.38 557,340,884.61
II. Total accumulated
amortisation —— 1,393,204,594.91 13,580,462.92 125,908,319.75 577,597.61 31,713,869.25 1,714,474.10 1,565,544,123.32
Including: Land use rights —— 1,012,340,925.47 – 66,650,734.30 – 31,674,633.78 1,349,063.63 1,112,015,357.18
Trademark
rights —— 135.92 – 116.52 – – – 252.44
Software —— 354,803,682.28 13,580,462.92 31,895,106.60 577,597.61 39,235.47 317,801.73 400,058,691.39
Others —— 26,059,851.24 – 27,362,362.33 – – 47,608.74 53,469,822.31
III. Total impairment
provision —— 58,913,956.77 – – – – – 58,913,956.77
Including: Land use rights —— 3,887,400.00 – – – – – 3,887,400.00
Trademark
rights —— 5,000,000.00 – – – – – 5,000,000.00
Software —— – – – – – – –
Others —— 50,026,556.77 – – – – – 50,026,556.77
IV. Total carrying amount —— 5,688,540,222.83 —— —— —— —— —— 6,101,110,537.07
Including: Land use rights —— 5,484,359,585.81 —— —— —— —— —— 5,445,594,689.87
Trademark
rights —— 1,029.13 —— —— —— —— —— 912.61
Software —— 201,900,125.13 —— —— —— —— —— 201,670,429.06
Others —— 2,279,482.76 —— —— —— —— —— 453,844,505.53
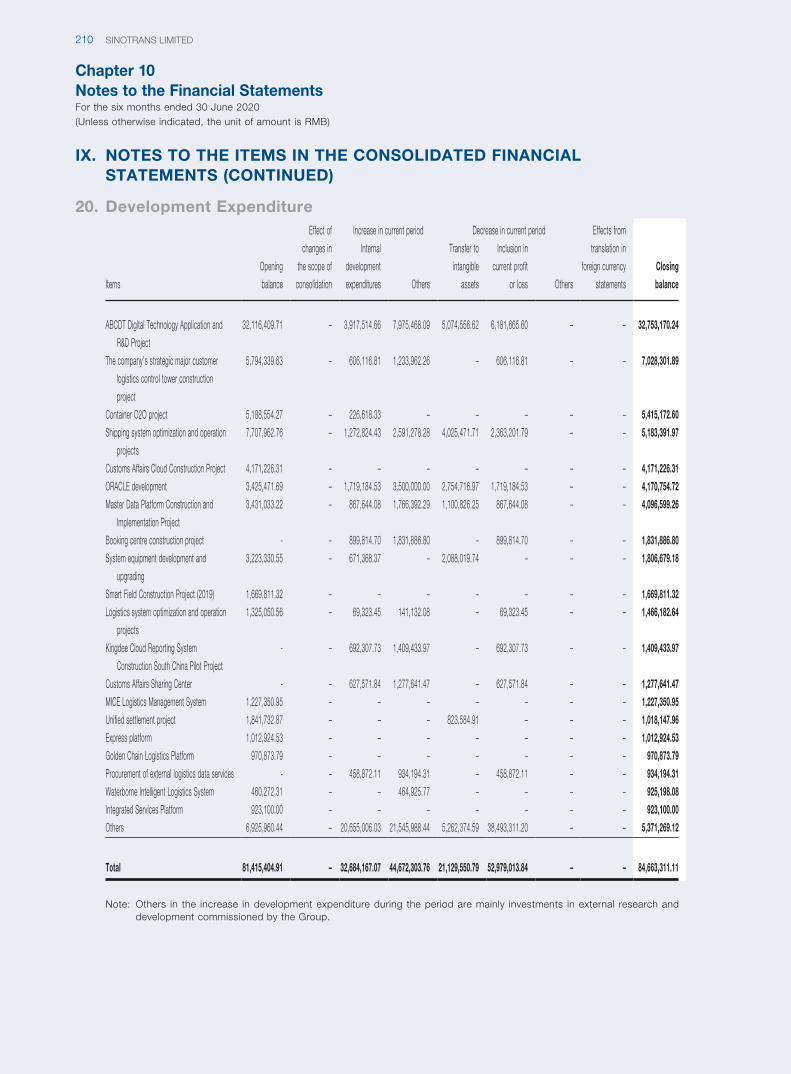
Chapter 10Notes to the Financial StatementsFor the six months ended 30 June 2020(Unless otherwise indicated, the unit of amount is RMB)
SINOTRANS LIMITED210
IX. NOTES TO THE ITEMS IN THE CONSOLIDATED FINANCIAL STATEMENTS (CONTINUED)
20. Development Expenditure
Items
Opening
balance
Effect of
changes in
the scope of
consolidation
Increase in current period Decrease in current period Effects from
translation in
foreign currency
statements
Closing
balance
Internal
development
expenditures Others
Transfer to
intangible
assets
Inclusion in
current profit
or loss Others
ABCDT Digital Technology Application and
R&D Project
32,116,409.71 – 3,917,514.66 7,975,468.09 5,074,556.62 6,181,665.60 – – 32,753,170.24
The company’s strategic major customer
logistics control tower construction
project
5,794,339.63 – 606,116.81 1,233,962.26 – 606,116.81 – – 7,028,301.89
Container O2O project 5,188,554.27 – 226,618.33 – – – – – 5,415,172.60
Shipping system optimization and operation
projects
7,707,962.76 – 1,272,824.43 2,591,278.28 4,025,471.71 2,363,201.79 – – 5,183,391.97
Customs Affairs Cloud Construction Project 4,171,226.31 – – – – – – – 4,171,226.31
ORACLE development 3,425,471.69 – 1,719,184.53 3,500,000.00 2,754,716.97 1,719,184.53 – – 4,170,754.72
Master Data Platform Construction and
Implementation Project
3,431,033.22 – 867,644.08 1,766,392.29 1,100,826.25 867,644.08 – – 4,096,599.26
Booking centre construction project - – 899,814.70 1,831,886.80 – 899,814.70 – – 1,831,886.80
System equipment development and
upgrading
3,223,330.55 – 671,368.37 – 2,088,019.74 – – – 1,806,679.18
Smart Field Construction Project (2019) 1,669,811.32 – – – – – – – 1,669,811.32
Logistics system optimization and operation
projects
1,325,050.56 – 69,323.45 141,132.08 – 69,323.45 – – 1,466,182.64
Kingdee Cloud Reporting System
Construction South China Pilot Project
- – 692,307.73 1,409,433.97 – 692,307.73 – – 1,409,433.97
Customs Affairs Sharing Center - – 627,571.84 1,277,641.47 – 627,571.84 – – 1,277,641.47
MICE Logistics Management System 1,227,350.95 – – – – – – – 1,227,350.95
Unified settlement project 1,841,732.87 – – – 823,584.91 – – – 1,018,147.96
Express platform 1,012,924.53 – – – – – – – 1,012,924.53
Golden Chain Logistics Platform 970,873.79 – – – – – – – 970,873.79
Procurement of external logistics data services - – 458,872.11 934,194.31 – 458,872.11 – – 934,194.31
Waterborne Intelligent Logistics System 460,272.31 – – 464,925.77 – – – – 925,198.08
Integrated Services Platform 923,100.00 – – – – – – – 923,100.00
Others 6,925,960.44 – 20,655,006.03 21,545,988.44 5,262,374.59 38,493,311.20 – – 5,371,269.12
Total 81,415,404.91 – 32,684,167.07 44,672,303.76 21,129,550.79 52,979,013.84 – – 84,663,311.11
Note: Others in the increase in development expenditure during the period are mainly investments in external research and development commissioned by the Group.
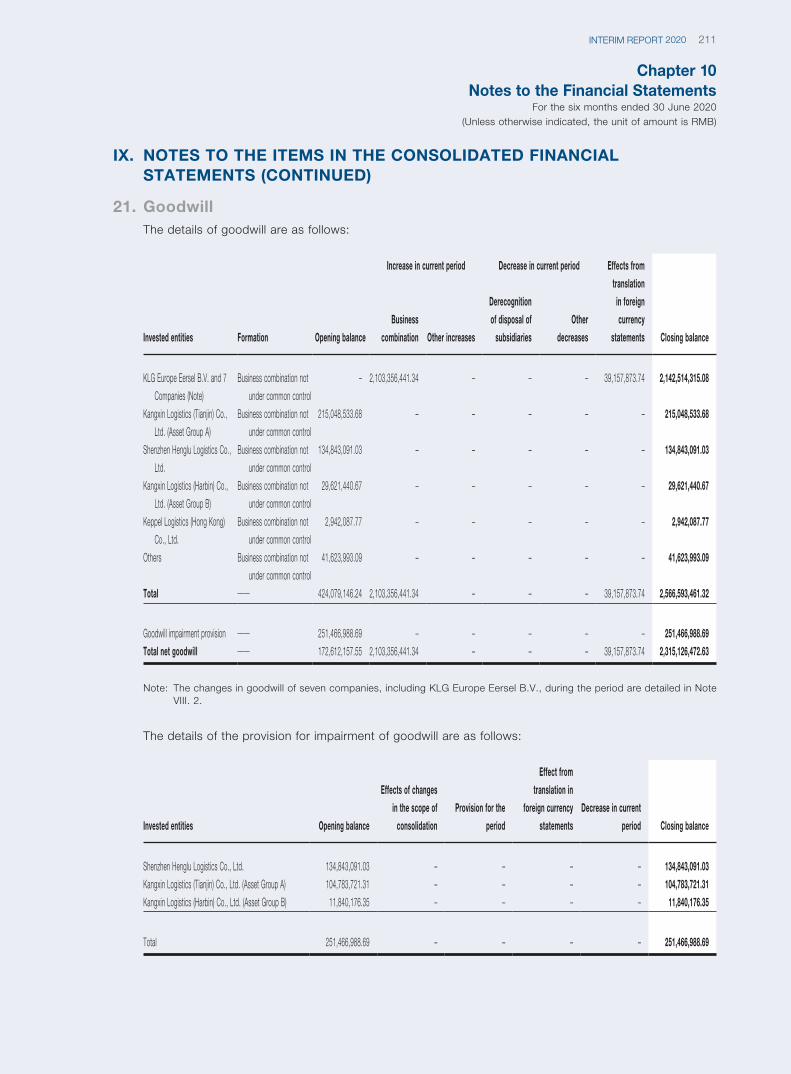
Chapter 10Notes to the Financial Statements
For the six months ended 30 June 2020(Unless otherwise indicated, the unit of amount is RMB)
211INTERIM REPORT 2020
IX. NOTES TO THE ITEMS IN THE CONSOLIDATED FINANCIAL STATEMENTS (CONTINUED)
21. GoodwillThe details of goodwill are as follows:
Invested entities Formation Opening balance
Increase in current period Decrease in current period Effects from
translation
in foreign
currency
statements Closing balance
Business
combination Other increases
Derecognition
of disposal of
subsidiaries
Other
decreases
KLG Europe Eersel B.V. and 7
Companies (Note)
Business combination not
under common control
– 2,103,356,441.34 – – – 39,157,873.74 2,142,514,315.08
Kangxin Logistics (Tianjin) Co.,
Ltd. (Asset Group A)
Business combination not
under common control
215,048,533.68 – – – – – 215,048,533.68
Shenzhen Henglu Logistics Co.,
Ltd.
Business combination not
under common control
134,843,091.03 – – – – – 134,843,091.03
Kangxin Logistics (Harbin) Co.,
Ltd. (Asset Group B)
Business combination not
under common control
29,621,440.67 – – – – – 29,621,440.67
Keppel Logistics (Hong Kong)
Co., Ltd.
Business combination not
under common control
2,942,087.77 – – – – – 2,942,087.77
Others Business combination not
under common control
41,623,993.09 – – – – – 41,623,993.09
Total —— 424,079,146.24 2,103,356,441.34 – – – 39,157,873.74 2,566,593,461.32
Goodwill impairment provision —— 251,466,988.69 – – – – – 251,466,988.69
Total net goodwill —— 172,612,157.55 2,103,356,441.34 – – – 39,157,873.74 2,315,126,472.63
Note: The changes in goodwill of seven companies, including KLG Europe Eersel B.V., during the period are detailed in Note VIII. 2.
The details of the provision for impairment of goodwill are as follows:
Invested entities Opening balance
Effects of changes
in the scope of
consolidation
Provision for the
period
Effect from
translation in
foreign currency
statements
Decrease in current
period Closing balance
Shenzhen Henglu Logistics Co., Ltd. 134,843,091.03 – – – – 134,843,091.03
Kangxin Logistics (Tianjin) Co., Ltd. (Asset Group A) 104,783,721.31 – – – – 104,783,721.31
Kangxin Logistics (Harbin) Co., Ltd. (Asset Group B) 11,840,176.35 – – – – 11,840,176.35
Total 251,466,988.69 – – – – 251,466,988.69
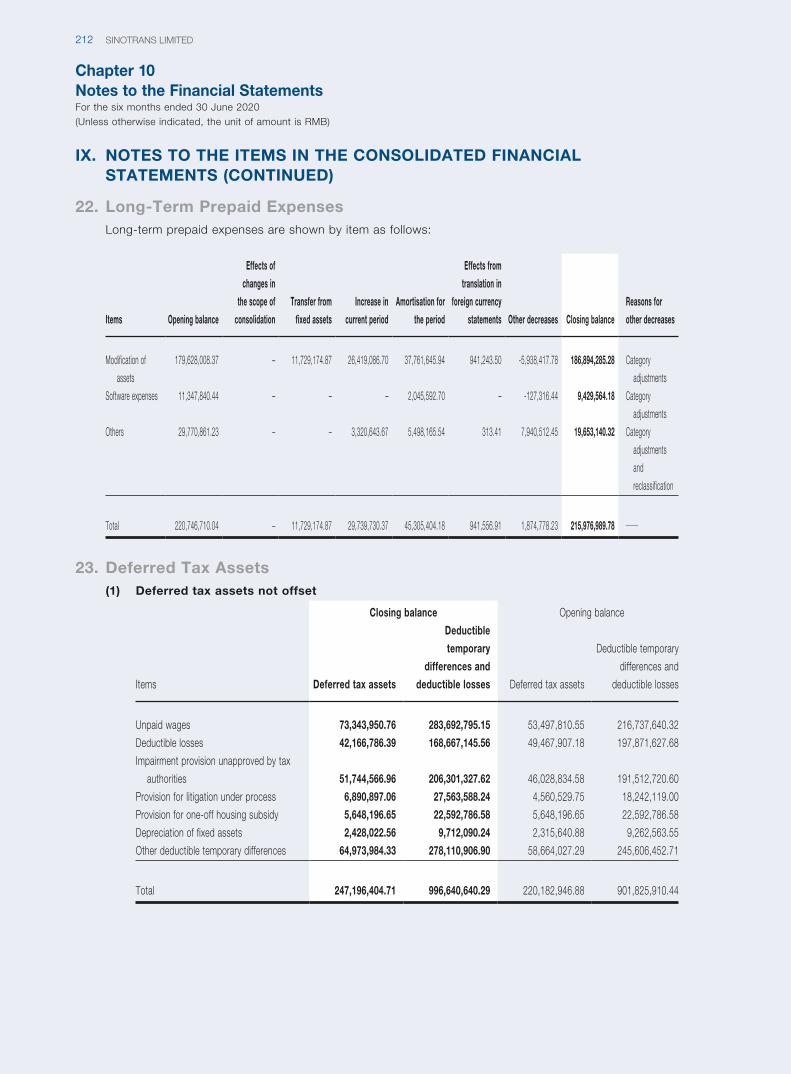
Chapter 10Notes to the Financial StatementsFor the six months ended 30 June 2020(Unless otherwise indicated, the unit of amount is RMB)
SINOTRANS LIMITED212
IX. NOTES TO THE ITEMS IN THE CONSOLIDATED FINANCIAL STATEMENTS (CONTINUED)
22. Long-Term Prepaid ExpensesLong-term prepaid expenses are shown by item as follows:
Items Opening balance
Effects of
changes in
the scope of
consolidation
Transfer from
fixed assets
Increase in
current period
Amortisation for
the period
Effects from
translation in
foreign currency
statements Other decreases Closing balance
Reasons for
other decreases
Modification of
assets
179,628,008.37 – 11,729,174.87 26,419,086.70 37,761,645.94 941,243.50 -5,938,417.78 186,894,285.28 Category
adjustments
Software expenses 11,347,840.44 – – – 2,045,592.70 – -127,316.44 9,429,564.18 Category
adjustments
Others 29,770,861.23 – – 3,320,643.67 5,498,165.54 313.41 7,940,512.45 19,653,140.32 Category
adjustments
and
reclassification
Total 220,746,710.04 – 11,729,174.87 29,739,730.37 45,305,404.18 941,556.91 1,874,778.23 215,976,989.78 ——
23. Deferred Tax Assets(1) Deferred tax assets not offset
Items
Closing balance Opening balance
Deferred tax assets
Deductible
temporary
differences and
deductible losses Deferred tax assets
Deductible temporary
differences and
deductible losses
Unpaid wages 73,343,950.76 283,692,795.15 53,497,810.55 216,737,640.32
Deductible losses 42,166,786.39 168,667,145.56 49,467,907.18 197,871,627.68
Impairment provision unapproved by tax
authorities 51,744,566.96 206,301,327.62 46,028,834.58 191,512,720.60
Provision for litigation under process 6,890,897.06 27,563,588.24 4,560,529.75 18,242,119.00
Provision for one-off housing subsidy 5,648,196.65 22,592,786.58 5,648,196.65 22,592,786.58
Depreciation of fixed assets 2,428,022.56 9,712,090.24 2,315,640.88 9,262,563.55
Other deductible temporary differences 64,973,984.33 278,110,906.90 58,664,027.29 245,606,452.71
Total 247,196,404.71 996,640,640.29 220,182,946.88 901,825,910.44
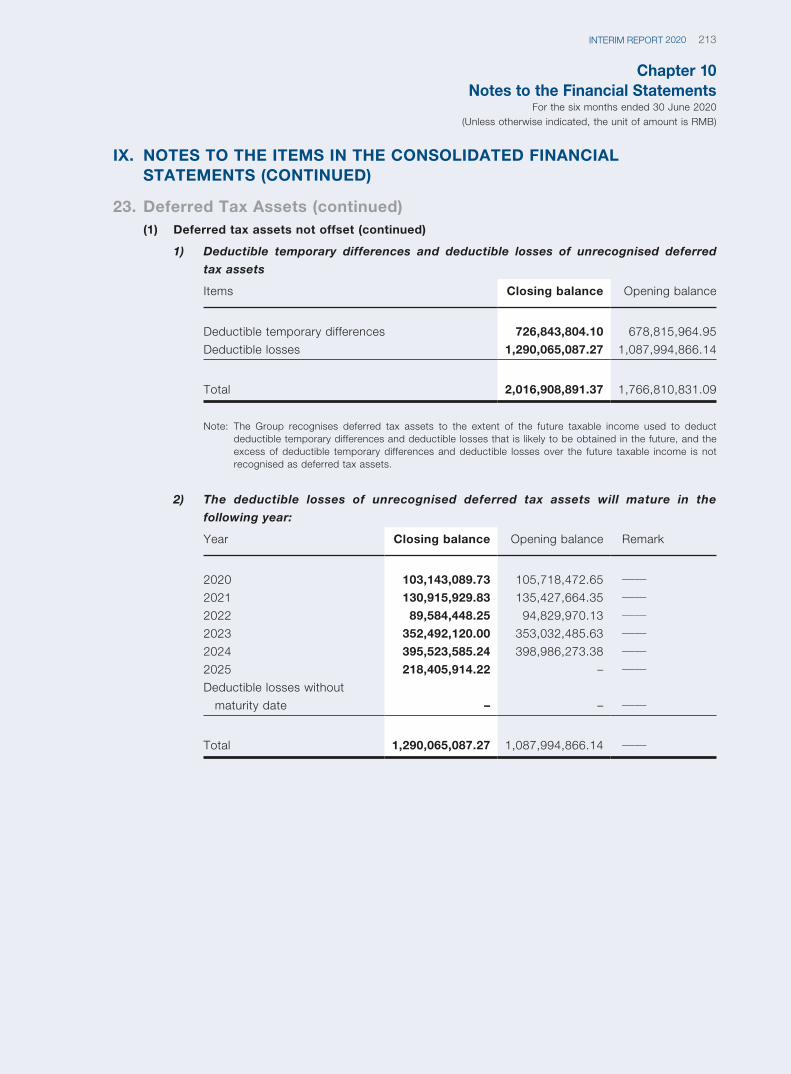
Chapter 10Notes to the Financial Statements
For the six months ended 30 June 2020(Unless otherwise indicated, the unit of amount is RMB)
213INTERIM REPORT 2020
IX. NOTES TO THE ITEMS IN THE CONSOLIDATED FINANCIAL STATEMENTS (CONTINUED)
23. Deferred Tax Assets (continued)(1) Deferred tax assets not offset (continued)
1) Deductible temporary differences and deductible losses of unrecognised deferred
tax assets
Items Closing balance Opening balance
Deductible temporary differences 726,843,804.10 678,815,964.95
Deductible losses 1,290,065,087.27 1,087,994,866.14
Total 2,016,908,891.37 1,766,810,831.09
Note: The Group recognises deferred tax assets to the extent of the future taxable income used to deduct deductible temporary differences and deductible losses that is likely to be obtained in the future, and the excess of deductible temporary differences and deductible losses over the future taxable income is not recognised as deferred tax assets.
2) The deductible losses of unrecognised deferred tax assets will mature in the
following year:
Year Closing balance Opening balance Remark
2020 103,143,089.73 105,718,472.65 ——2021 130,915,929.83 135,427,664.35 ——2022 89,584,448.25 94,829,970.13 ——2023 352,492,120.00 353,032,485.63 ——2024 395,523,585.24 398,986,273.38 ——2025 218,405,914.22 – ——Deductible losses without
maturity date – – ——
Total 1,290,065,087.27 1,087,994,866.14 ——
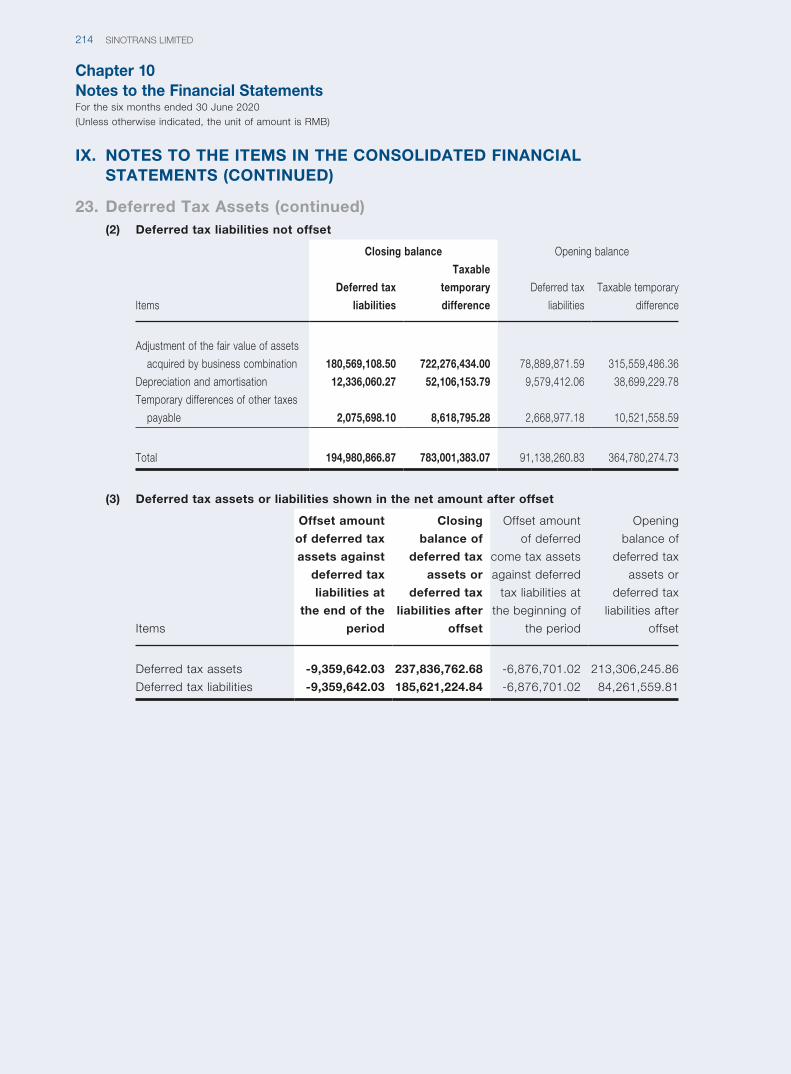
Chapter 10Notes to the Financial StatementsFor the six months ended 30 June 2020(Unless otherwise indicated, the unit of amount is RMB)
SINOTRANS LIMITED214
IX. NOTES TO THE ITEMS IN THE CONSOLIDATED FINANCIAL STATEMENTS (CONTINUED)
23. Deferred Tax Assets (continued)(2) Deferred tax liabilities not offset
Items
Closing balance Opening balance
Deferred tax
liabilities
Taxable
temporary
difference
Deferred tax
liabilities
Taxable temporary
difference
Adjustment of the fair value of assets
acquired by business combination 180,569,108.50 722,276,434.00 78,889,871.59 315,559,486.36
Depreciation and amortisation 12,336,060.27 52,106,153.79 9,579,412.06 38,699,229.78
Temporary differences of other taxes
payable 2,075,698.10 8,618,795.28 2,668,977.18 10,521,558.59
Total 194,980,866.87 783,001,383.07 91,138,260.83 364,780,274.73
(3) Deferred tax assets or liabilities shown in the net amount after offset
Items
Offset amount
of deferred tax
assets against
deferred tax
liabilities at
the end of the
period
Closing
balance of
deferred tax
assets or
deferred tax
liabilities after
offset
Offset amount
of deferred
come tax assets
against deferred
tax liabilities at
the beginning of
the period
Opening
balance of
deferred tax
assets or
deferred tax
liabilities after
offset
Deferred tax assets -9,359,642.03 237,836,762.68 -6,876,701.02 213,306,245.86
Deferred tax liabilities -9,359,642.03 185,621,224.84 -6,876,701.02 84,261,559.81
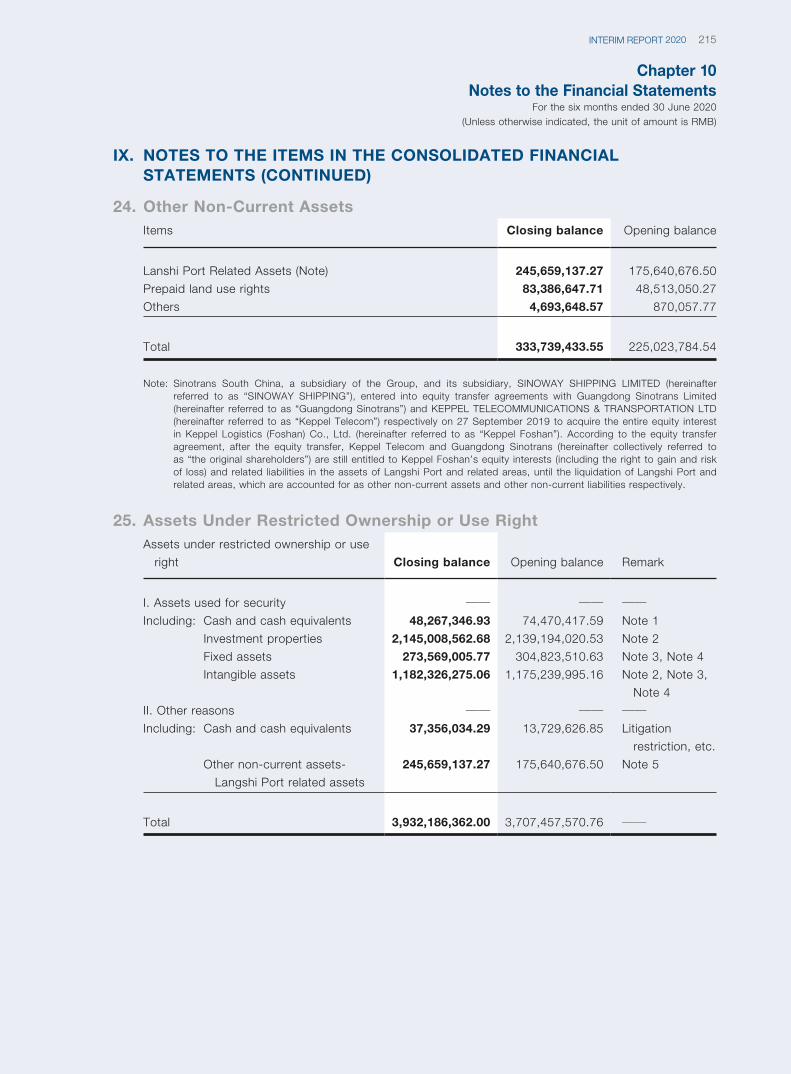
Chapter 10Notes to the Financial Statements
For the six months ended 30 June 2020(Unless otherwise indicated, the unit of amount is RMB)
215INTERIM REPORT 2020
IX. NOTES TO THE ITEMS IN THE CONSOLIDATED FINANCIAL STATEMENTS (CONTINUED)
24. Other Non-Current AssetsItems Closing balance Opening balance
Lanshi Port Related Assets (Note) 245,659,137.27 175,640,676.50
Prepaid land use rights 83,386,647.71 48,513,050.27
Others 4,693,648.57 870,057.77
Total 333,739,433.55 225,023,784.54
Note: Sinotrans South China, a subsidiary of the Group, and its subsidiary, SINOWAY SHIPPING LIMITED (hereinafter referred to as “SINOWAY SHIPPING”), entered into equity transfer agreements with Guangdong Sinotrans Limited (hereinafter referred to as “Guangdong Sinotrans”) and KEPPEL TELECOMMUNICATIONS & TRANSPORTATION LTD (hereinafter referred to as “Keppel Telecom”) respectively on 27 September 2019 to acquire the entire equity interest in Keppel Logistics (Foshan) Co., Ltd. (hereinafter referred to as “Keppel Foshan”). According to the equity transfer agreement, after the equity transfer, Keppel Telecom and Guangdong Sinotrans (hereinafter collectively referred to as “the original shareholders”) are still entitled to Keppel Foshan’s equity interests (including the right to gain and risk of loss) and related liabilities in the assets of Langshi Port and related areas, until the liquidation of Langshi Port and related areas, which are accounted for as other non-current assets and other non-current liabilities respectively.
25. Assets Under Restricted Ownership or Use RightAssets under restricted ownership or use
right Closing balance Opening balance Remark
I. Assets used for security —— —— ——Including: Cash and cash equivalents 48,267,346.93 74,470,417.59 Note 1
Investment properties 2,145,008,562.68 2,139,194,020.53 Note 2
Fixed assets 273,569,005.77 304,823,510.63 Note 3, Note 4
Intangible assets 1,182,326,275.06 1,175,239,995.16 Note 2, Note 3,
Note 4
II. Other reasons —— —— ——Including: Cash and cash equivalents 37,356,034.29 13,729,626.85 Litigation
restriction, etc.
Other non-current assets-
Langshi Port related assets
245,659,137.27 175,640,676.50 Note 5
Total 3,932,186,362.00 3,707,457,570.76 ——
Chapter 10Notes to the Financial StatementsFor the six months ended 30 June 2020(Unless otherwise indicated, the unit of amount is RMB)
SINOTRANS LIMITED216
IX. NOTES TO THE ITEMS IN THE CONSOLIDATED FINANCIAL STATEMENTS (CONTINUED)
25. Assets Under Restricted Ownership or Use Right (continued)Note 1: The assets under restricted use right at the end of the period mainly included deposit for letter of guarantee and
performance guarantee, as detailed in Note IX. 1.
Note 2: In order to meet the financing needs of the construction of the Hong Kong “Tsing Yi 181 Project” logistics center, Global Traffic Limited (“Global Traffic”), a subsidiary of the Group, entered an agreement with the China Development Bank to obtain bank facility of HKD2.9 billion. China Merchants Group (Hong Kong) Co., Ltd., a related party of the Group, provided full guarantees. At the same time, Global Traffic and China Development Bank signed a debenture on 26 June 2015, in which Global Traffic was the charger, who (i) pledged the real estate rights and interests of 181 plots owned by Global Traffic by the first charge; (ii) pledged the existing or future business, property, assets, goodwill, rights and income of Hong Kong Global Traffic with floating charges, (iii) pledged of 181 land parcels by the form of construction mortgage; (iv) secured of the equipment of Global Traffic with the first fixed charge and its rights, interests, ownership and rights and interests under the relevant contract as mortgages for long-term loans.
Note 3: Sinotrans Shanghai Cold Chain Logistics Co., Ltd., a subsidiary of the Group, borrowed from China Construction Bank. According to the contract HFDZJZ (2009) No. 018811, the Company’s fixed assets of RMB172,447,069.22 and intangible assets such as land use rights of RMB37,768,567.60 were pledged as collateral. At the same time, Shanghai Sinotrans Cold Chain Transportation Co., Ltd. provides joint liability guarantee.
Note 4: Sinotrans Chemical International Logistics Co., Ltd. (hereinafter referred to as “Chemical Logistics”), a subsidiary of the Group, used fixed assets with a carrying amount of RMB52,453,303.79 and intangible assets with a carrying amount of RMB31,211,002.08 as collateral for long-term loans of Nantong Sinotrans Chemical Logistics Co., Ltd.; fixed assets with a carrying amount of RMB48,668,632.76 and intangible assets with a carrying amount of RMB16,717,290.94 were used as short-term loan collateral for Chemical Logistics.
Note 5: See details in Note IX.24 “OTHER NON-CURRENT ASSETS”.
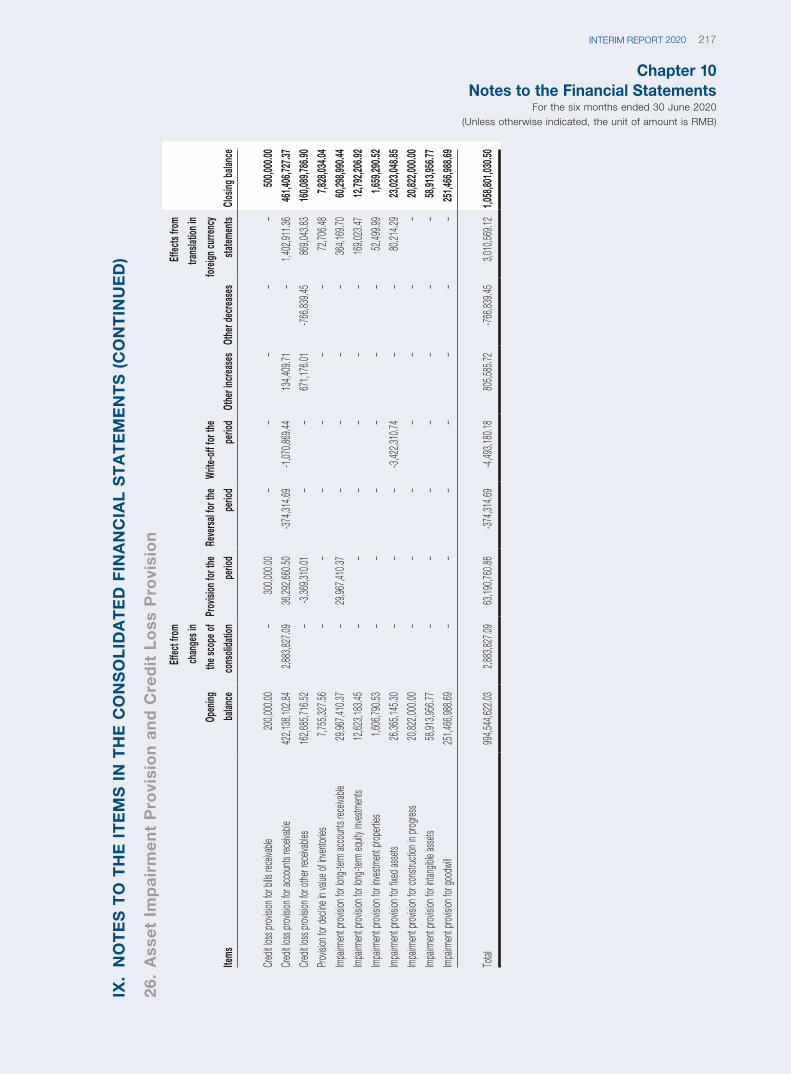
Chapter 10Notes to the Financial Statements
For the six months ended 30 June 2020(Unless otherwise indicated, the unit of amount is RMB)
217INTERIM REPORT 2020
IX.
NO
TE
S T
O T
HE
IT
EM
S I
N T
HE
CO
NS
OL
IDA
TE
D F
INA
NC
IAL
ST
AT
EM
EN
TS
(C
ON
TIN
UE
D)
26.
Ass
et
Imp
air
me
nt
Pro
visi
on
an
d C
red
it L
oss
Pro
visi
on
Items
Open
ing
balan
ce
Effec
t fro
m
chan
ges i
n
the s
cope
of
cons
olida
tion
Prov
ision
for t
he
perio
d
Reve
rsal fo
r the
perio
d
Write
-off
for t
he
perio
dOt
her i
ncre
ases
Othe
r dec
reas
es
Effec
ts fro
m
trans
lation
in
fore
ign cu
rrenc
y
statem
ents
Clos
ing ba
lance
Cred
it los
s prov
ision f
or bil
ls rec
eivab
le20
0,000
.00–
300,0
00.00
––
––
–50
0,000
.00
Cred
it los
s prov
ision f
or ac
coun
ts rec
eivab
le42
2,138
,102.8
42,8
83,82
7.09
36,29
2,660
.50-37
4,314
.69-1,
070,8
69.44
134,4
09.71
–1,4
02,91
1.36
461,4
06,72
7.37
Cred
it los
s prov
ision f
or oth
er rec
eivab
les16
2,685
,716.5
2–
-3,36
9,310
.01–
–67
1,176
.01-76
6,839
.4586
9,043
.8316
0,089
,786.9
0
Prov
ision f
or de
cline i
n valu
e of in
vento
ries
7,755
,327.5
6–
––
––
–72
,706.4
87,8
28,03
4.04
Impa
irmen
t prov
ision f
or lon
g-term
acco
unts
receiv
able
29,96
7,410
.37–
29,96
7,410
.37–
––
–36
4,169
.7060
,298,9
90.44
Impa
irmen
t prov
ision f
or lon
g-term
equit
y inv
estm
ents
12,62
3,183
.45–
––
––
–16
9,023
.4712
,792,2
06.92
Impa
irmen
t prov
ision f
or inv
estm
ent p
ropert
ies1,6
06,79
0.53
––
––
––
52,49
9.99
1,659
,290.5
2
Impa
irmen
t prov
ision f
or fix
ed as
sets
26,36
5,145
.30–
––
-3,42
2,310
.74–
–80
,214.2
923
,023,0
48.85
Impa
irmen
t prov
ision f
or co
nstru
ction
in pr
ogres
s20
,822,0
00.00
––
––
––
–20
,822,0
00.00
Impa
irmen
t prov
ision f
or int
angib
le as
sets
58,91
3,956
.77–
––
––
––
58,91
3,956
.77
Impa
irmen
t prov
ision f
or go
odwil
l25
1,466
,988.6
9–
––
––
––
251,4
66,98
8.69
Total
994,5
44,62
2.03
2,883
,827.0
963
,190,7
60.86
-374,3
14.69
-4,49
3,180
.1880
5,585
.72-76
6,839
.453,0
10,56
9.12
1,058
,801,0
30.50
Chapter 10Notes to the Financial StatementsFor the six months ended 30 June 2020(Unless otherwise indicated, the unit of amount is RMB)
SINOTRANS LIMITED218
IX. NOTES TO THE ITEMS IN THE CONSOLIDATED FINANCIAL STATEMENTS (CONTINUED)
27. Short-Term Borrowings(1) Classification of short-term borrowings
Category Closing balance Opening balance
Credit loan 2,120,983,750.00 1,197,378,957.50
Mortgage loan 5,004,229.17 5,005,437.50
Total 2,125,987,979.17 1,202,384,395.00
The Group had no short-term borrowings due as at the end of the period.
28. Bills PayableCategory Closing balance Opening balance
Bank acceptance bills 121,052,287.85 –
Commercial acceptance bills – –
Total 121,052,287.85 –
29. Accounts Payable(1) Details of accounts payable
Aging
Closing balance Opening balance
Amount Proportion (%) Amount Proportion (%)
Within 1 year (including 1 year) 9,095,048,532.10 95.27 8,590,260,463.00 93.92
1 to 2 years (including 2 years) 211,418,281.09 2.21 302,299,511.04 3.30
2 to 3 years (including 3 years) 84,421,741.16 0.88 98,291,199.19 1.07
Over 3 years 156,397,662.35 1.64 156,194,853.88 1.71
Total 9,547,286,216.70 100.00 9,147,046,027.11 100.00
The above aging analysis of accounts payable is based on the time of purchasing goods or
receiving services.
Chapter 10Notes to the Financial Statements
For the six months ended 30 June 2020(Unless otherwise indicated, the unit of amount is RMB)
219INTERIM REPORT 2020
IX. NOTES TO THE ITEMS IN THE CONSOLIDATED FINANCIAL STATEMENTS (CONTINUED)
29. Accounts Payable (continued)(2) Significant accounts payable with the aging of more than one year
Company name Amount owed Aging
Reasons
for non-
repayment
Entity 1 17,702,426.85 1-2 years, 2-3 years and
Over 3 years
Unsettled
Entity 2 17,700,325.49 1-2 years, 2-3 years and
Over 3 years
Unsettled
Entity 3 14,127,615.02 1-2 years, 2-3 years and
Over 3 years
Unsettled
Entity 4 13,150,909.19 Within 3 years Unsettled
Entity 5 12,196,249.35 2-3 years and Over 3 years Unsettled
Entity 6 12,045,021.44 1-2 years, 2-3 years and
Over 3 years
Unsettled
Entity 7 11,339,646.23 Within 3 years Unsettled
Entity 8 8,822,253.39 1-2 years, 2-3 years and
Over 3 years
Unsettled
Entity 9 7,965,601.16 Within 3 years Unsettled
Entity 10 7,615,690.82 2-3 years and Over 3 years Unsettled
Entity 11 7,197,827.50 Over 3 years Unsettled
Entity 12 7,094,939.97 Over 3 years Unsettled
Entity 13 6,905,604.53 1 -2 years Unsettled
Entity 14 5,056,586.61 Within 3 years Unsettled
Total 148,920,697.55 —— ——
(3) There had no accounts payable to shareholders holding more than 5% (including 5%) of the voting
shares of the Company.
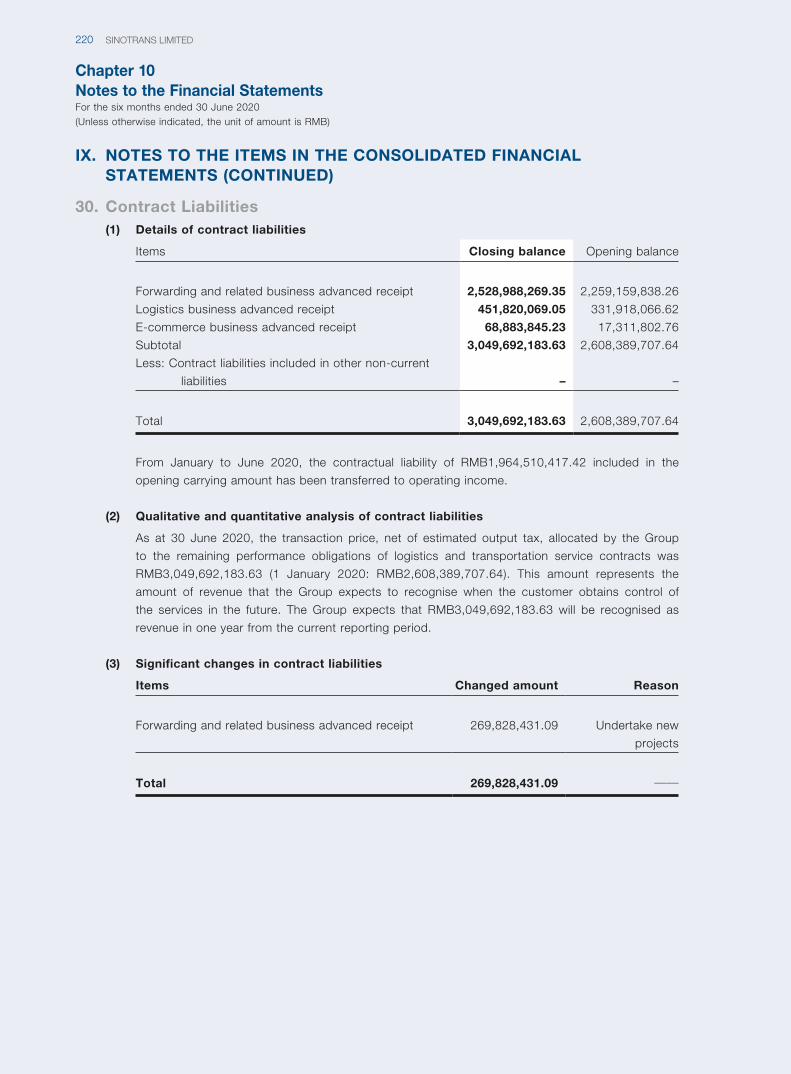
Chapter 10Notes to the Financial StatementsFor the six months ended 30 June 2020(Unless otherwise indicated, the unit of amount is RMB)
SINOTRANS LIMITED220
IX. NOTES TO THE ITEMS IN THE CONSOLIDATED FINANCIAL STATEMENTS (CONTINUED)
30. Contract Liabilities(1) Details of contract liabilities
Items Closing balance Opening balance
Forwarding and related business advanced receipt 2,528,988,269.35 2,259,159,838.26
Logistics business advanced receipt 451,820,069.05 331,918,066.62
E-commerce business advanced receipt 68,883,845.23 17,311,802.76
Subtotal 3,049,692,183.63 2,608,389,707.64
Less: Contract liabilities included in other non-current
liabilities – –
Total 3,049,692,183.63 2,608,389,707.64
From January to June 2020, the contractual liability of RMB1,964,510,417.42 included in the
opening carrying amount has been transferred to operating income.
(2) Qualitative and quantitative analysis of contract liabilities
As at 30 June 2020, the transaction price, net of estimated output tax, allocated by the Group
to the remaining performance obligations of logistics and transportation service contracts was
RMB3,049,692,183.63 (1 January 2020: RMB2,608,389,707.64). This amount represents the
amount of revenue that the Group expects to recognise when the customer obtains control of
the services in the future. The Group expects that RMB3,049,692,183.63 will be recognised as
revenue in one year from the current reporting period.
(3) Significant changes in contract liabilities
Items Changed amount Reason
Forwarding and related business advanced receipt 269,828,431.09 Undertake new
projects
Total 269,828,431.09 ——
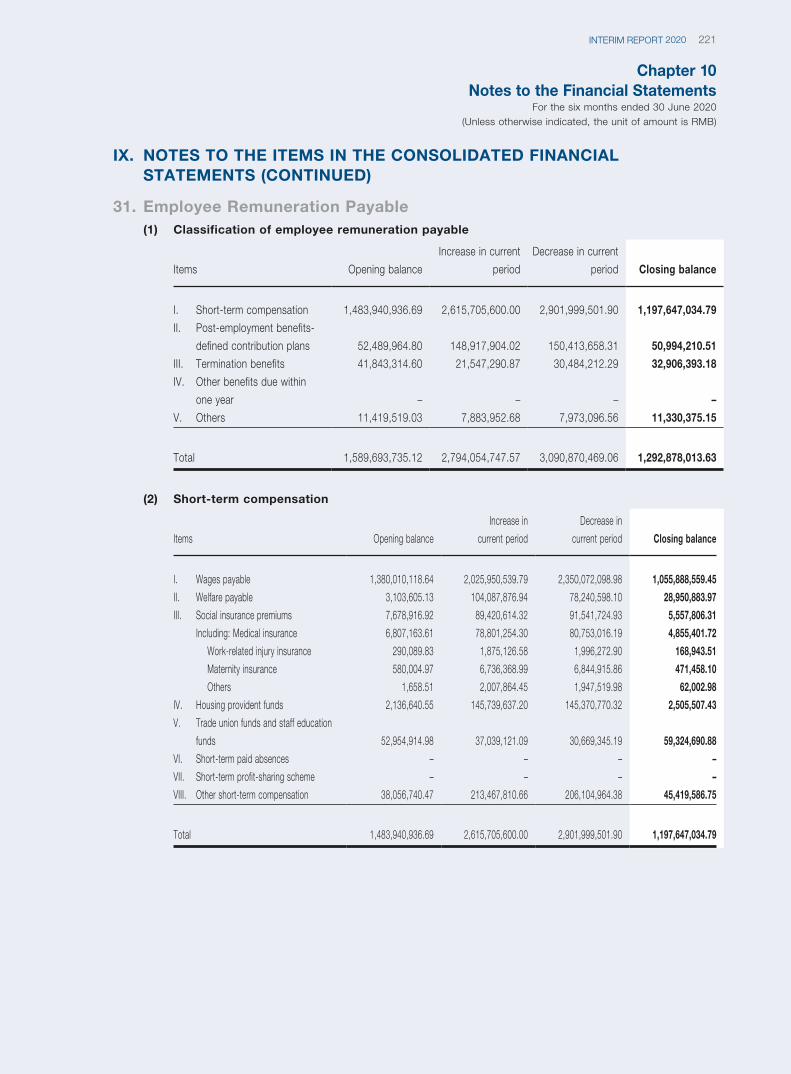
Chapter 10Notes to the Financial Statements
For the six months ended 30 June 2020(Unless otherwise indicated, the unit of amount is RMB)
221INTERIM REPORT 2020
IX. NOTES TO THE ITEMS IN THE CONSOLIDATED FINANCIAL STATEMENTS (CONTINUED)
31. Employee Remuneration Payable(1) Classification of employee remuneration payable
Items Opening balance
Increase in current
period
Decrease in current
period Closing balance
I. Short-term compensation 1,483,940,936.69 2,615,705,600.00 2,901,999,501.90 1,197,647,034.79
II. Post-employment benefits-
defined contribution plans 52,489,964.80 148,917,904.02 150,413,658.31 50,994,210.51
III. Termination benefits 41,843,314.60 21,547,290.87 30,484,212.29 32,906,393.18
IV. Other benefits due within
one year – – – –
V. Others 11,419,519.03 7,883,952.68 7,973,096.56 11,330,375.15
Total 1,589,693,735.12 2,794,054,747.57 3,090,870,469.06 1,292,878,013.63
(2) Short-term compensation
Items Opening balance
Increase in
current period
Decrease in
current period Closing balance
I. Wages payable 1,380,010,118.64 2,025,950,539.79 2,350,072,098.98 1,055,888,559.45
II. Welfare payable 3,103,605.13 104,087,876.94 78,240,598.10 28,950,883.97
III. Social insurance premiums 7,678,916.92 89,420,614.32 91,541,724.93 5,557,806.31
Including: Medical insurance 6,807,163.61 78,801,254.30 80,753,016.19 4,855,401.72
Work-related injury insurance 290,089.83 1,875,126.58 1,996,272.90 168,943.51
Maternity insurance 580,004.97 6,736,368.99 6,844,915.86 471,458.10
Others 1,658.51 2,007,864.45 1,947,519.98 62,002.98
IV. Housing provident funds 2,136,640.55 145,739,637.20 145,370,770.32 2,505,507.43
V. Trade union funds and staff education
funds 52,954,914.98 37,039,121.09 30,669,345.19 59,324,690.88
VI. Short-term paid absences – – – –
VII. Short-term profit-sharing scheme – – – –
VIII. Other short-term compensation 38,056,740.47 213,467,810.66 206,104,964.38 45,419,586.75
Total 1,483,940,936.69 2,615,705,600.00 2,901,999,501.90 1,197,647,034.79
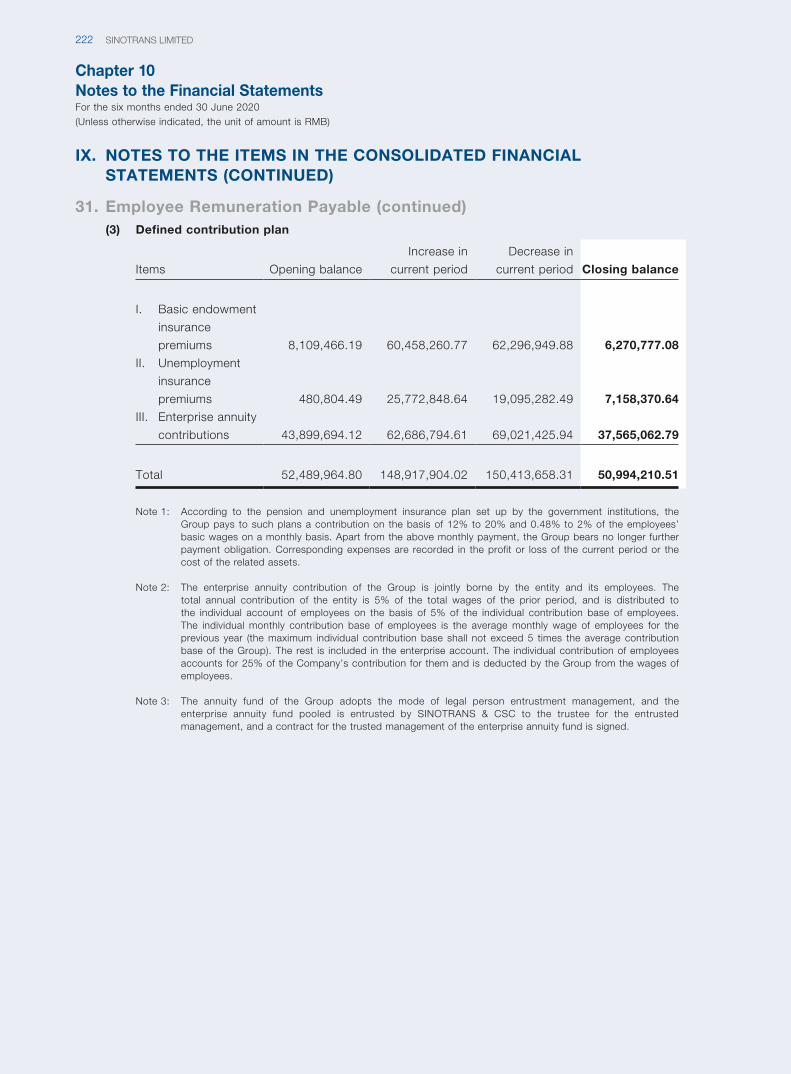
Chapter 10Notes to the Financial StatementsFor the six months ended 30 June 2020(Unless otherwise indicated, the unit of amount is RMB)
SINOTRANS LIMITED222
IX. NOTES TO THE ITEMS IN THE CONSOLIDATED FINANCIAL STATEMENTS (CONTINUED)
31. Employee Remuneration Payable (continued)(3) Defined contribution plan
Items Opening balance
Increase in
current period
Decrease in
current period Closing balance
I. Basic endowment
insurance
premiums 8,109,466.19 60,458,260.77 62,296,949.88 6,270,777.08
II. Unemployment
insurance
premiums 480,804.49 25,772,848.64 19,095,282.49 7,158,370.64
III. Enterprise annuity
contributions 43,899,694.12 62,686,794.61 69,021,425.94 37,565,062.79
Total 52,489,964.80 148,917,904.02 150,413,658.31 50,994,210.51
Note 1: According to the pension and unemployment insurance plan set up by the government institutions, the Group pays to such plans a contribution on the basis of 12% to 20% and 0.48% to 2% of the employees’ basic wages on a monthly basis. Apart from the above monthly payment, the Group bears no longer further payment obligation. Corresponding expenses are recorded in the profit or loss of the current period or the cost of the related assets.
Note 2: The enterprise annuity contribution of the Group is jointly borne by the entity and its employees. The total annual contribution of the entity is 5% of the total wages of the prior period, and is distributed to the individual account of employees on the basis of 5% of the individual contribution base of employees. The individual monthly contribution base of employees is the average monthly wage of employees for the previous year (the maximum individual contribution base shall not exceed 5 times the average contribution base of the Group). The rest is included in the enterprise account. The individual contribution of employees accounts for 25% of the Company’s contribution for them and is deducted by the Group from the wages of employees.
Note 3: The annuity fund of the Group adopts the mode of legal person entrustment management, and the enterprise annuity fund pooled is entrusted by SINOTRANS & CSC to the trustee for the entrusted management, and a contract for the trusted management of the enterprise annuity fund is signed.
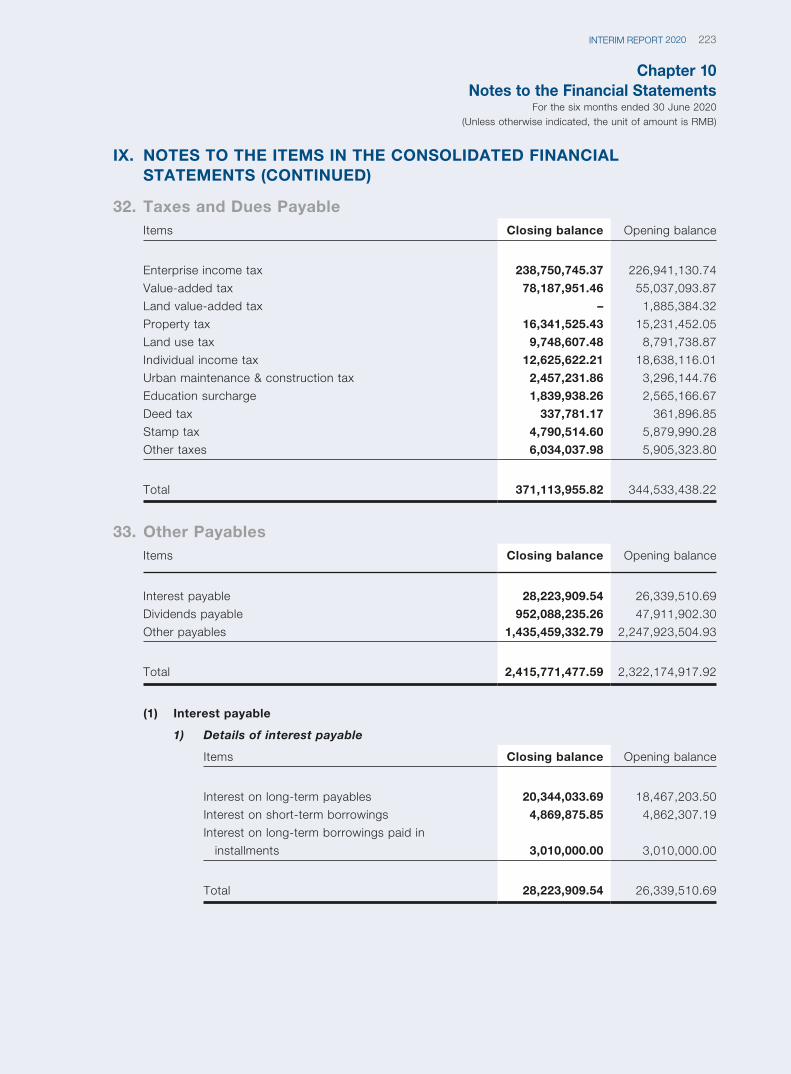
Chapter 10Notes to the Financial Statements
For the six months ended 30 June 2020(Unless otherwise indicated, the unit of amount is RMB)
223INTERIM REPORT 2020
IX. NOTES TO THE ITEMS IN THE CONSOLIDATED FINANCIAL STATEMENTS (CONTINUED)
32. Taxes and Dues PayableItems Closing balance Opening balance
Enterprise income tax 238,750,745.37 226,941,130.74
Value-added tax 78,187,951.46 55,037,093.87
Land value-added tax – 1,885,384.32
Property tax 16,341,525.43 15,231,452.05
Land use tax 9,748,607.48 8,791,738.87
Individual income tax 12,625,622.21 18,638,116.01
Urban maintenance & construction tax 2,457,231.86 3,296,144.76
Education surcharge 1,839,938.26 2,565,166.67
Deed tax 337,781.17 361,896.85
Stamp tax 4,790,514.60 5,879,990.28
Other taxes 6,034,037.98 5,905,323.80
Total 371,113,955.82 344,533,438.22
33. Other PayablesItems Closing balance Opening balance
Interest payable 28,223,909.54 26,339,510.69
Dividends payable 952,088,235.26 47,911,902.30
Other payables 1,435,459,332.79 2,247,923,504.93
Total 2,415,771,477.59 2,322,174,917.92
(1) Interest payable
1) Details of interest payable
Items Closing balance Opening balance
Interest on long-term payables 20,344,033.69 18,467,203.50
Interest on short-term borrowings 4,869,875.85 4,862,307.19
Interest on long-term borrowings paid in
installments 3,010,000.00 3,010,000.00
Total 28,223,909.54 26,339,510.69
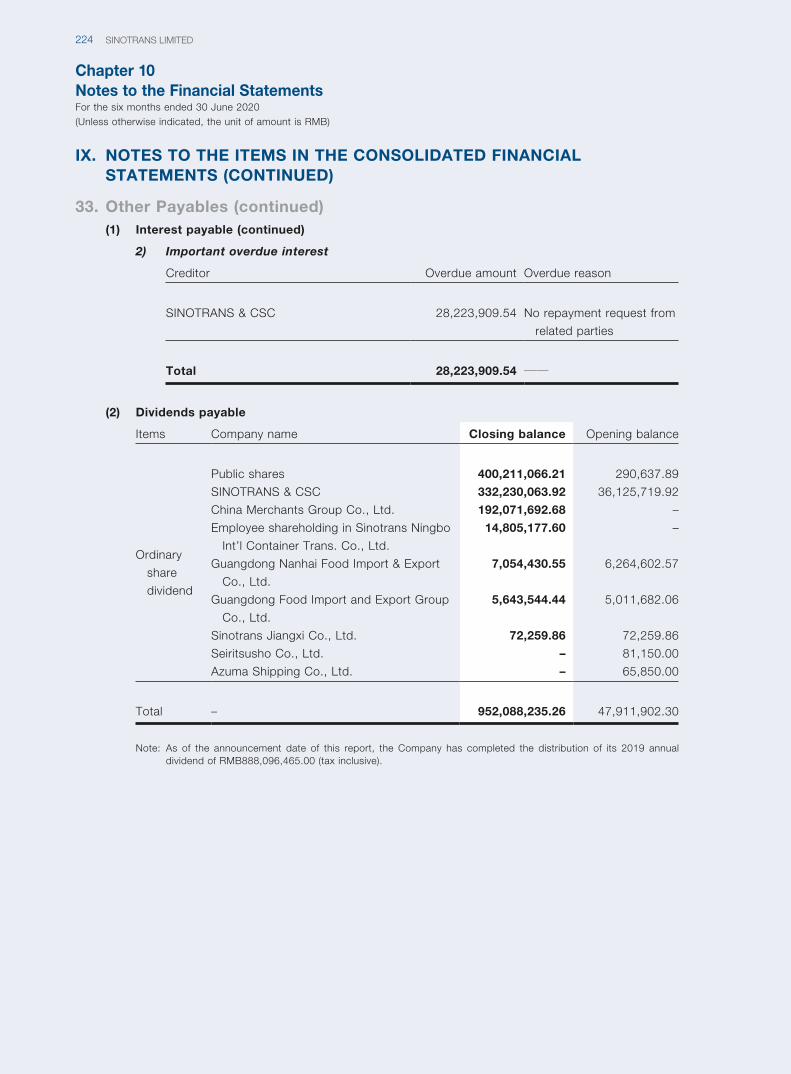
Chapter 10Notes to the Financial StatementsFor the six months ended 30 June 2020(Unless otherwise indicated, the unit of amount is RMB)
SINOTRANS LIMITED224
IX. NOTES TO THE ITEMS IN THE CONSOLIDATED FINANCIAL STATEMENTS (CONTINUED)
33. Other Payables (continued)(1) Interest payable (continued)
2) Important overdue interest
Creditor Overdue amount Overdue reason
SINOTRANS & CSC 28,223,909.54 No repayment request from
related parties
Total 28,223,909.54 ——
(2) Dividends payable
Items Company name Closing balance Opening balance
Ordinary
share
dividend
Public shares 400,211,066.21 290,637.89
SINOTRANS & CSC 332,230,063.92 36,125,719.92
China Merchants Group Co., Ltd. 192,071,692.68 –
Employee shareholding in Sinotrans Ningbo
Int’l Container Trans. Co., Ltd.
14,805,177.60 –
Guangdong Nanhai Food Import & Export
Co., Ltd.
7,054,430.55 6,264,602.57
Guangdong Food Import and Export Group
Co., Ltd.
5,643,544.44 5,011,682.06
Sinotrans Jiangxi Co., Ltd. 72,259.86 72,259.86
Seiritsusho Co., Ltd. – 81,150.00
Azuma Shipping Co., Ltd. – 65,850.00
Total – 952,088,235.26 47,911,902.30
Note: As of the announcement date of this report, the Company has completed the distribution of its 2019 annual dividend of RMB888,096,465.00 (tax inclusive).
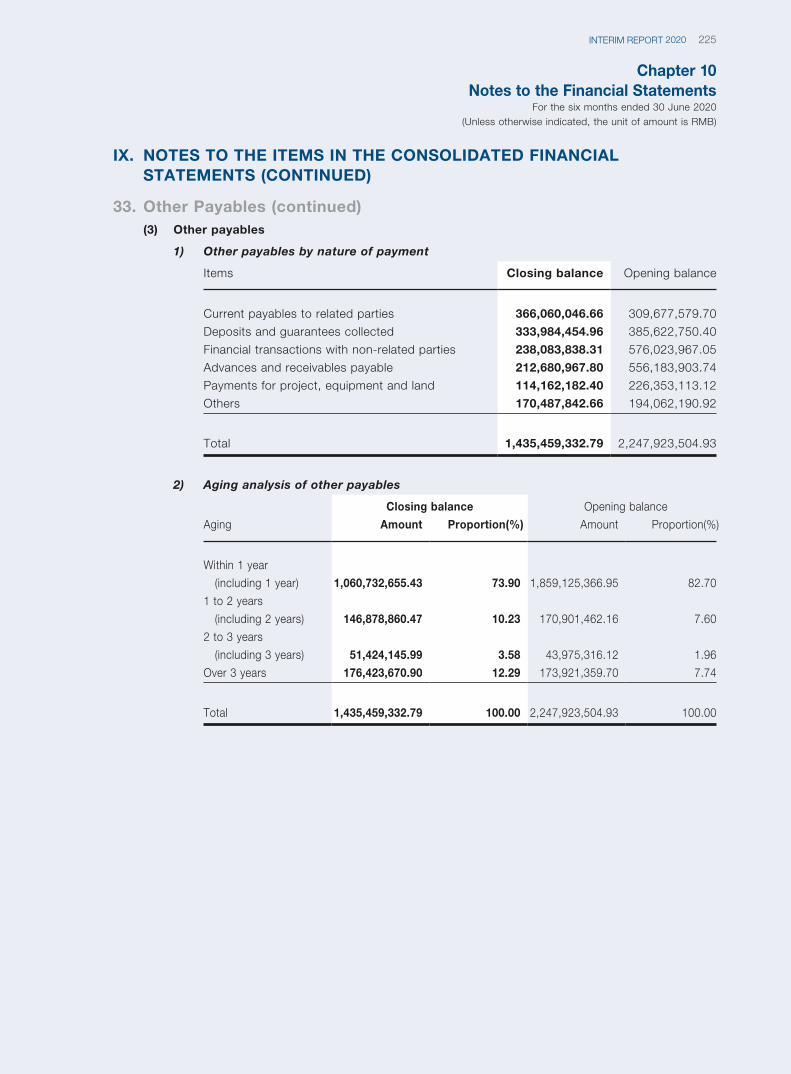
Chapter 10Notes to the Financial Statements
For the six months ended 30 June 2020(Unless otherwise indicated, the unit of amount is RMB)
225INTERIM REPORT 2020
IX. NOTES TO THE ITEMS IN THE CONSOLIDATED FINANCIAL STATEMENTS (CONTINUED)
33. Other Payables (continued)(3) Other payables
1) Other payables by nature of payment
Items Closing balance Opening balance
Current payables to related parties 366,060,046.66 309,677,579.70
Deposits and guarantees collected 333,984,454.96 385,622,750.40
Financial transactions with non-related parties 238,083,838.31 576,023,967.05
Advances and receivables payable 212,680,967.80 556,183,903.74
Payments for project, equipment and land 114,162,182.40 226,353,113.12
Others 170,487,842.66 194,062,190.92
Total 1,435,459,332.79 2,247,923,504.93
2) Aging analysis of other payables
Aging
Closing balance Opening balance
Amount Proportion(%) Amount Proportion(%)
Within 1 year
(including 1 year) 1,060,732,655.43 73.90 1,859,125,366.95 82.70
1 to 2 years
(including 2 years) 146,878,860.47 10.23 170,901,462.16 7.60
2 to 3 years
(including 3 years) 51,424,145.99 3.58 43,975,316.12 1.96
Over 3 years 176,423,670.90 12.29 173,921,359.70 7.74
Total 1,435,459,332.79 100.00 2,247,923,504.93 100.00
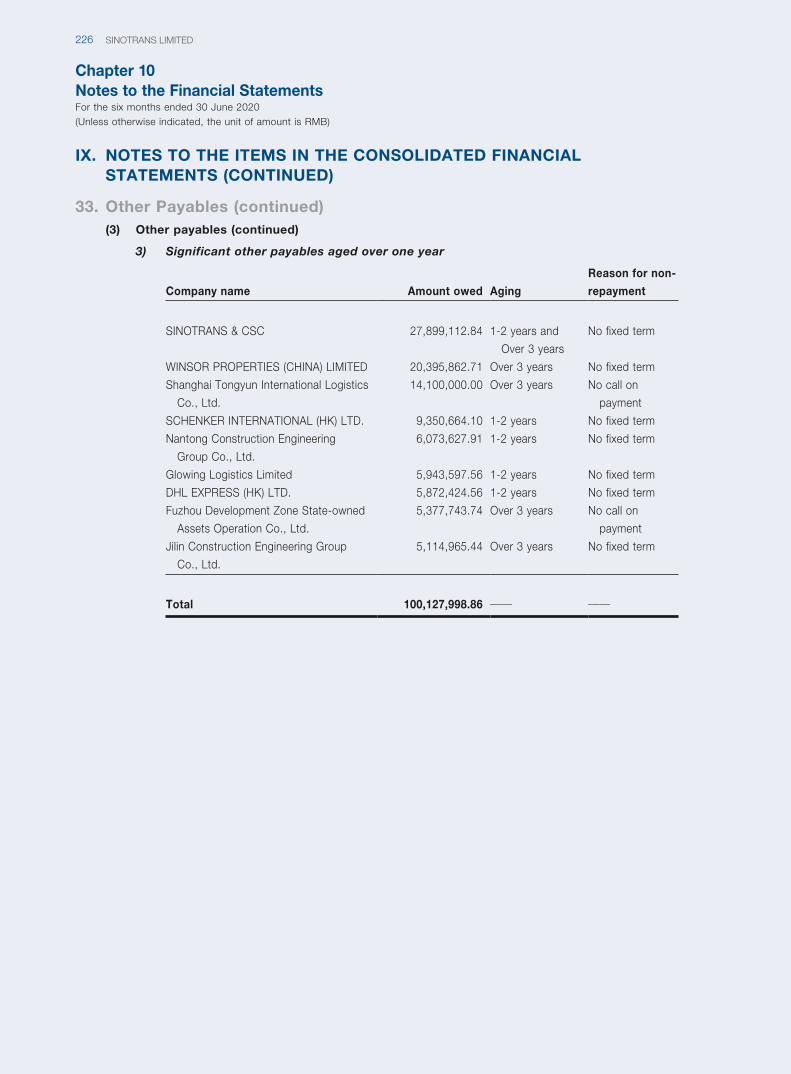
Chapter 10Notes to the Financial StatementsFor the six months ended 30 June 2020(Unless otherwise indicated, the unit of amount is RMB)
SINOTRANS LIMITED226
IX. NOTES TO THE ITEMS IN THE CONSOLIDATED FINANCIAL STATEMENTS (CONTINUED)
33. Other Payables (continued)(3) Other payables (continued)
3) Significant other payables aged over one year
Company name Amount owed Aging
Reason for non-
repayment
SINOTRANS & CSC 27,899,112.84 1-2 years and
Over 3 years
No fixed term
WINSOR PROPERTIES (CHINA) LIMITED 20,395,862.71 Over 3 years No fixed term
Shanghai Tongyun International Logistics
Co., Ltd.
14,100,000.00 Over 3 years No call on
payment
SCHENKER INTERNATIONAL (HK) LTD. 9,350,664.10 1-2 years No fixed term
Nantong Construction Engineering
Group Co., Ltd.
6,073,627.91 1-2 years No fixed term
Glowing Logistics Limited 5,943,597.56 1-2 years No fixed term
DHL EXPRESS (HK) LTD. 5,872,424.56 1-2 years No fixed term
Fuzhou Development Zone State-owned
Assets Operation Co., Ltd.
5,377,743.74 Over 3 years No call on
payment
Jilin Construction Engineering Group
Co., Ltd.
5,114,965.44 Over 3 years No fixed term
Total 100,127,998.86 —— ——
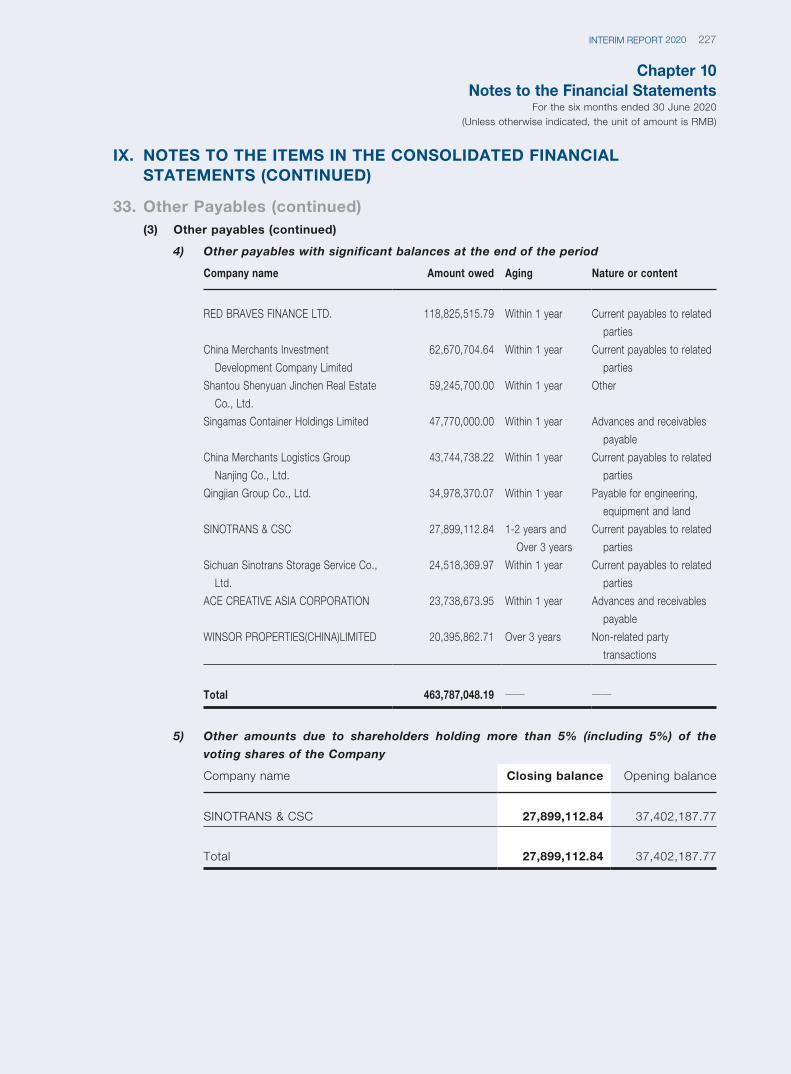
Chapter 10Notes to the Financial Statements
For the six months ended 30 June 2020(Unless otherwise indicated, the unit of amount is RMB)
227INTERIM REPORT 2020
IX. NOTES TO THE ITEMS IN THE CONSOLIDATED FINANCIAL STATEMENTS (CONTINUED)
33. Other Payables (continued)(3) Other payables (continued)
4) Other payables with significant balances at the end of the period
Company name Amount owed Aging Nature or content
RED BRAVES FINANCE LTD. 118,825,515.79 Within 1 year Current payables to related
parties
China Merchants Investment
Development Company Limited
62,670,704.64 Within 1 year Current payables to related
parties
Shantou Shenyuan Jinchen Real Estate
Co., Ltd.
59,245,700.00 Within 1 year Other
Singamas Container Holdings Limited 47,770,000.00 Within 1 year Advances and receivables
payable
China Merchants Logistics Group
Nanjing Co., Ltd.
43,744,738.22 Within 1 year Current payables to related
parties
Qingjian Group Co., Ltd. 34,978,370.07 Within 1 year Payable for engineering,
equipment and land
SINOTRANS & CSC 27,899,112.84 1-2 years and
Over 3 years
Current payables to related
parties
Sichuan Sinotrans Storage Service Co.,
Ltd.
24,518,369.97 Within 1 year Current payables to related
parties
ACE CREATIVE ASIA CORPORATION 23,738,673.95 Within 1 year Advances and receivables
payable
WINSOR PROPERTIES(CHINA)LIMITED 20,395,862.71 Over 3 years Non-related party
transactions
Total 463,787,048.19 —— ——
5) Other amounts due to shareholders holding more than 5% (including 5%) of the
voting shares of the Company
Company name Closing balance Opening balance
SINOTRANS & CSC 27,899,112.84 37,402,187.77
Total 27,899,112.84 37,402,187.77
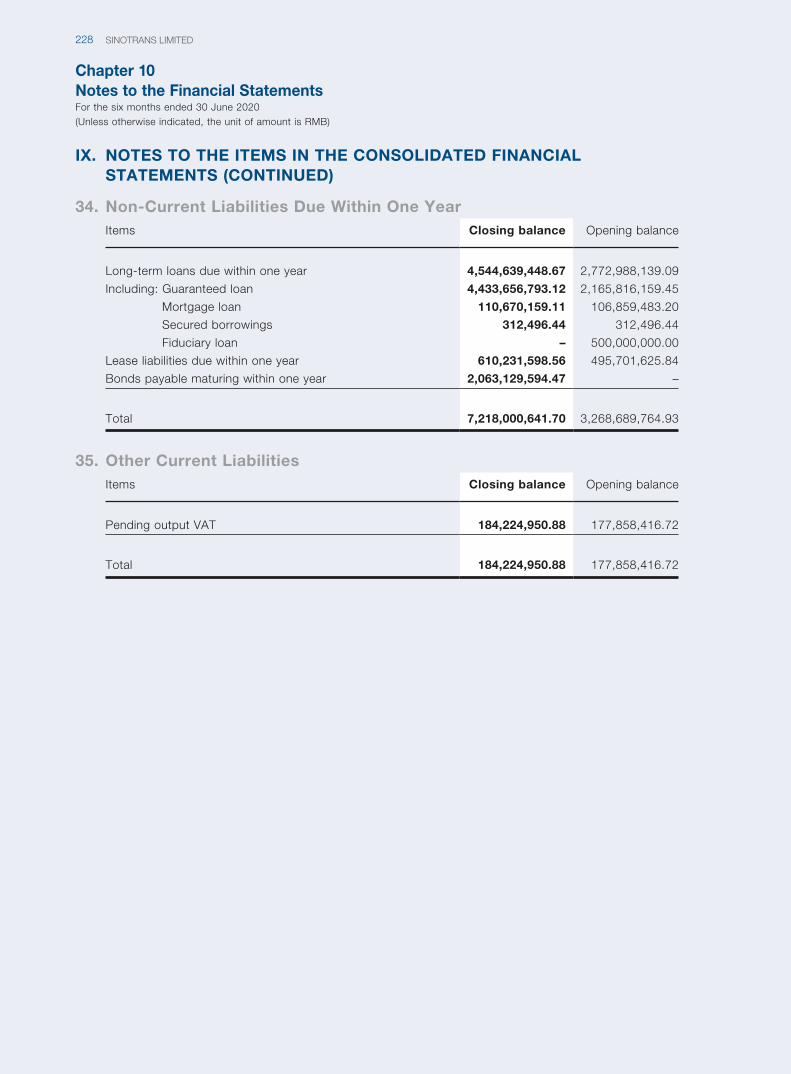
Chapter 10Notes to the Financial StatementsFor the six months ended 30 June 2020(Unless otherwise indicated, the unit of amount is RMB)
SINOTRANS LIMITED228
IX. NOTES TO THE ITEMS IN THE CONSOLIDATED FINANCIAL STATEMENTS (CONTINUED)
34. Non-Current Liabilities Due Within One YearItems Closing balance Opening balance
Long-term loans due within one year 4,544,639,448.67 2,772,988,139.09
Including: Guaranteed loan 4,433,656,793.12 2,165,816,159.45
Mortgage loan 110,670,159.11 106,859,483.20
Secured borrowings 312,496.44 312,496.44
Fiduciary loan – 500,000,000.00
Lease liabilities due within one year 610,231,598.56 495,701,625.84
Bonds payable maturing within one year 2,063,129,594.47 –
Total 7,218,000,641.70 3,268,689,764.93
35. Other Current LiabilitiesItems Closing balance Opening balance
Pending output VAT 184,224,950.88 177,858,416.72
Total 184,224,950.88 177,858,416.72
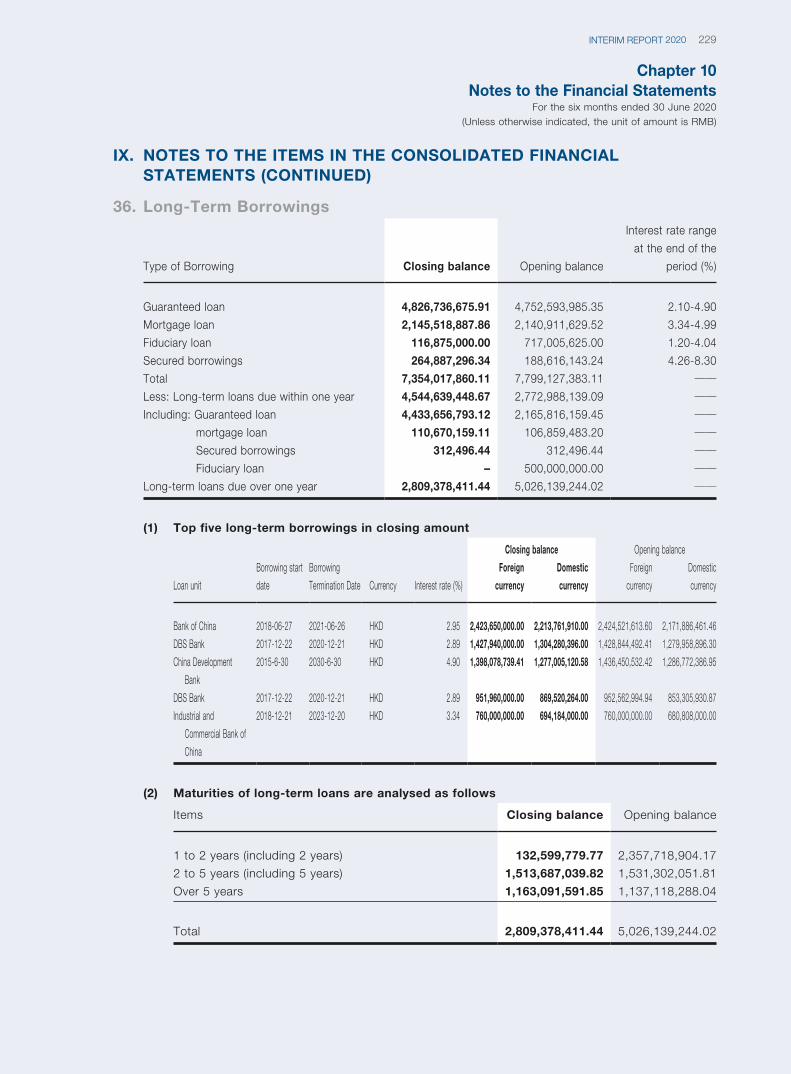
Chapter 10Notes to the Financial Statements
For the six months ended 30 June 2020(Unless otherwise indicated, the unit of amount is RMB)
229INTERIM REPORT 2020
IX. NOTES TO THE ITEMS IN THE CONSOLIDATED FINANCIAL STATEMENTS (CONTINUED)
36. Long-Term Borrowings
Type of Borrowing Closing balance Opening balance
Interest rate range
at the end of the
period (%)
Guaranteed loan 4,826,736,675.91 4,752,593,985.35 2.10-4.90
Mortgage loan 2,145,518,887.86 2,140,911,629.52 3.34-4.99
Fiduciary loan 116,875,000.00 717,005,625.00 1.20-4.04
Secured borrowings 264,887,296.34 188,616,143.24 4.26-8.30
Total 7,354,017,860.11 7,799,127,383.11 ——Less: Long-term loans due within one year 4,544,639,448.67 2,772,988,139.09 ——Including: Guaranteed loan 4,433,656,793.12 2,165,816,159.45 ——
mortgage loan 110,670,159.11 106,859,483.20 ——Secured borrowings 312,496.44 312,496.44 ——Fiduciary loan – 500,000,000.00 ——
Long-term loans due over one year 2,809,378,411.44 5,026,139,244.02 ——
(1) Top five long-term borrowings in closing amount
Loan unit
Borrowing start
date
Borrowing
Termination Date Currency Interest rate (%)
Closing balance Opening balance
Foreign
currency
Domestic
currency
Foreign
currency
Domestic
currency
Bank of China 2018-06-27 2021-06-26 HKD 2.95 2,423,650,000.00 2,213,761,910.00 2,424,521,613.60 2,171,886,461.46
DBS Bank 2017-12-22 2020-12-21 HKD 2.89 1,427,940,000.00 1,304,280,396.00 1,428,844,492.41 1,279,958,896.30
China Development
Bank
2015-6-30 2030-6-30 HKD 4.90 1,398,078,739.41 1,277,005,120.58 1,436,450,532.42 1,286,772,386.95
DBS Bank 2017-12-22 2020-12-21 HKD 2.89 951,960,000.00 869,520,264.00 952,562,994.94 853,305,930.87
Industrial and
Commercial Bank of
China
2018-12-21 2023-12-20 HKD 3.34 760,000,000.00 694,184,000.00 760,000,000.00 680,808,000.00
(2) Maturities of long-term loans are analysed as follows
Items Closing balance Opening balance
1 to 2 years (including 2 years) 132,599,779.77 2,357,718,904.17
2 to 5 years (including 5 years) 1,513,687,039.82 1,531,302,051.81
Over 5 years 1,163,091,591.85 1,137,118,288.04
Total 2,809,378,411.44 5,026,139,244.02
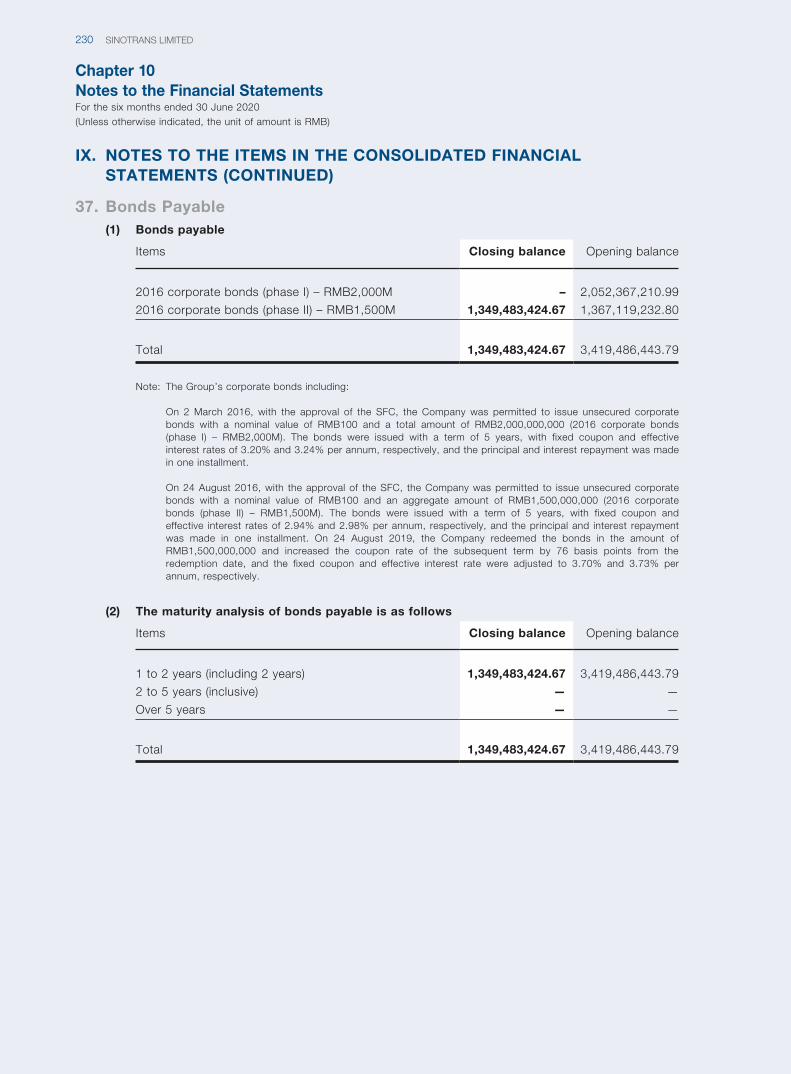
Chapter 10Notes to the Financial StatementsFor the six months ended 30 June 2020(Unless otherwise indicated, the unit of amount is RMB)
SINOTRANS LIMITED230
IX. NOTES TO THE ITEMS IN THE CONSOLIDATED FINANCIAL STATEMENTS (CONTINUED)
37. Bonds Payable(1) Bonds payable
Items Closing balance Opening balance
2016 corporate bonds (phase I) – RMB2,000M – 2,052,367,210.99
2016 corporate bonds (phase II) – RMB1,500M 1,349,483,424.67 1,367,119,232.80
Total 1,349,483,424.67 3,419,486,443.79
Note: The Group’s corporate bonds including:
On 2 March 2016, with the approval of the SFC, the Company was permitted to issue unsecured corporate bonds with a nominal value of RMB100 and a total amount of RMB2,000,000,000 (2016 corporate bonds (phase I) – RMB2,000M). The bonds were issued with a term of 5 years, with fixed coupon and effective interest rates of 3.20% and 3.24% per annum, respectively, and the principal and interest repayment was made in one installment.
On 24 August 2016, with the approval of the SFC, the Company was permitted to issue unsecured corporate bonds with a nominal value of RMB100 and an aggregate amount of RMB1,500,000,000 (2016 corporate bonds (phase II) – RMB1,500M). The bonds were issued with a term of 5 years, with fixed coupon and effective interest rates of 2.94% and 2.98% per annum, respectively, and the principal and interest repayment was made in one installment. On 24 August 2019, the Company redeemed the bonds in the amount of RMB1,500,000,000 and increased the coupon rate of the subsequent term by 76 basis points from the redemption date, and the fixed coupon and effective interest rate were adjusted to 3.70% and 3.73% per annum, respectively.
(2) The maturity analysis of bonds payable is as follows
Items Closing balance Opening balance
1 to 2 years (including 2 years) 1,349,483,424.67 3,419,486,443.79
2 to 5 years (inclusive) — —
Over 5 years — —
Total 1,349,483,424.67 3,419,486,443.79
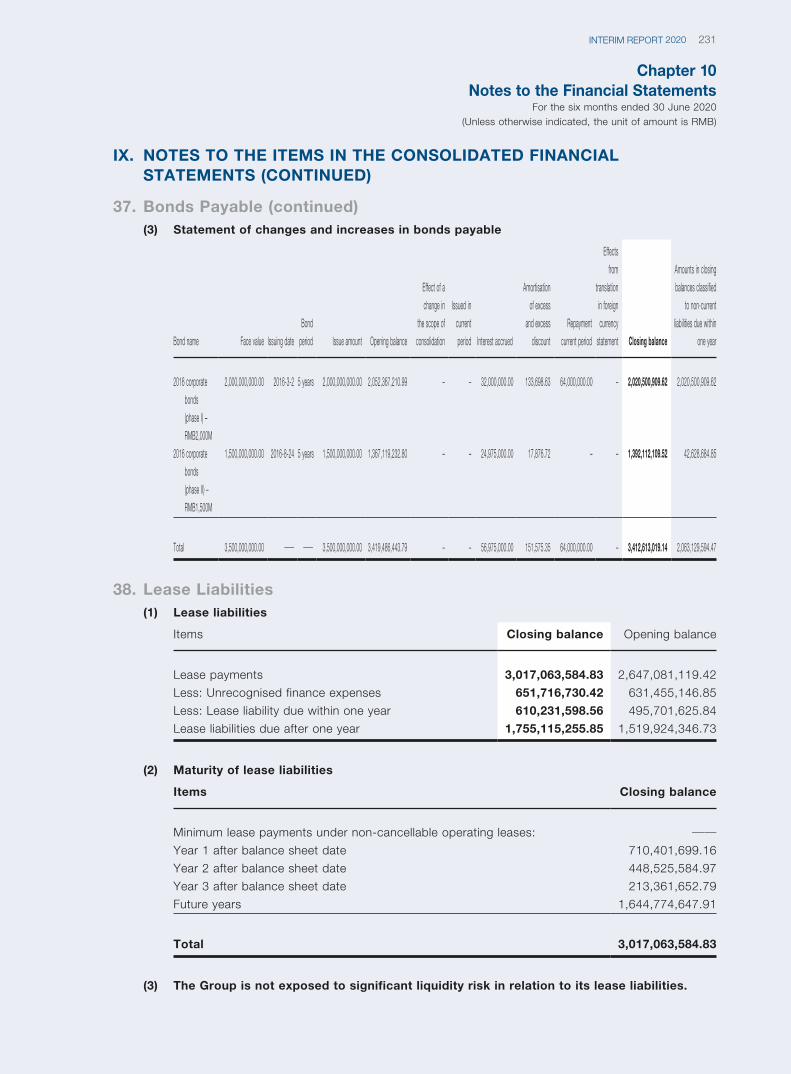
Chapter 10Notes to the Financial Statements
For the six months ended 30 June 2020(Unless otherwise indicated, the unit of amount is RMB)
231INTERIM REPORT 2020
IX. NOTES TO THE ITEMS IN THE CONSOLIDATED FINANCIAL STATEMENTS (CONTINUED)
37. Bonds Payable (continued)(3) Statement of changes and increases in bonds payable
Bond name Face value Issuing date
Bond
period Issue amount Opening balance
Effect of a
change in
the scope of
consolidation
Issued in
current
period Interest accrued
Amortisation
of excess
and excess
discount
Repayment
current period
Effects
from
translation
in foreign
currency
statement Closing balance
Amounts in closing
balances classified
to non-current
liabilities due within
one year
2016 corporate
bonds
(phase I) –
RMB2,000M
2,000,000,000.00 2016-3-2 5 years 2,000,000,000.00 2,052,367,210.99 – – 32,000,000.00 133,698.63 64,000,000.00 – 2,020,500,909.62 2,020,500,909.62
2016 corporate
bonds
(phase II) –
RMB1,500M
1,500,000,000.00 2016-8-24 5 years 1,500,000,000.00 1,367,119,232.80 – – 24,975,000.00 17,876.72 – – 1,392,112,109.52 42,628,684.85
Total 3,500,000,000.00 —— —— 3,500,000,000.00 3,419,486,443.79 – – 56,975,000.00 151,575.35 64,000,000.00 – 3,412,613,019.14 2,063,129,594.47
38. Lease Liabilities(1) Lease liabilities
Items Closing balance Opening balance
Lease payments 3,017,063,584.83 2,647,081,119.42
Less: Unrecognised finance expenses 651,716,730.42 631,455,146.85
Less: Lease liability due within one year 610,231,598.56 495,701,625.84
Lease liabilities due after one year 1,755,115,255.85 1,519,924,346.73
(2) Maturity of lease liabilities
Items Closing balance
Minimum lease payments under non-cancellable operating leases: ——Year 1 after balance sheet date 710,401,699.16
Year 2 after balance sheet date 448,525,584.97
Year 3 after balance sheet date 213,361,652.79
Future years 1,644,774,647.91
Total 3,017,063,584.83
(3) The Group is not exposed to significant liquidity risk in relation to its lease liabilities.
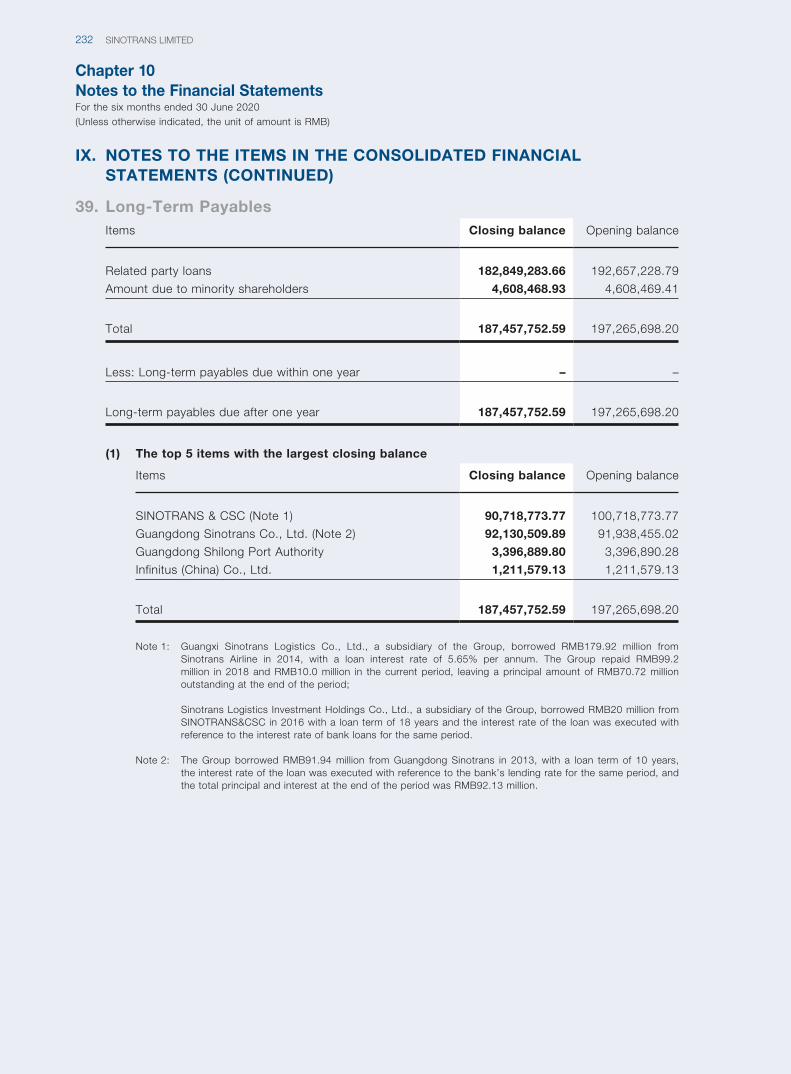
Chapter 10Notes to the Financial StatementsFor the six months ended 30 June 2020(Unless otherwise indicated, the unit of amount is RMB)
SINOTRANS LIMITED232
IX. NOTES TO THE ITEMS IN THE CONSOLIDATED FINANCIAL STATEMENTS (CONTINUED)
39. Long-Term PayablesItems Closing balance Opening balance
Related party loans 182,849,283.66 192,657,228.79
Amount due to minority shareholders 4,608,468.93 4,608,469.41
Total 187,457,752.59 197,265,698.20
Less: Long-term payables due within one year – –
Long-term payables due after one year 187,457,752.59 197,265,698.20
(1) The top 5 items with the largest closing balance
Items Closing balance Opening balance
SINOTRANS & CSC (Note 1) 90,718,773.77 100,718,773.77
Guangdong Sinotrans Co., Ltd. (Note 2) 92,130,509.89 91,938,455.02
Guangdong Shilong Port Authority 3,396,889.80 3,396,890.28
Infinitus (China) Co., Ltd. 1,211,579.13 1,211,579.13
Total 187,457,752.59 197,265,698.20
Note 1: Guangxi Sinotrans Logistics Co., Ltd., a subsidiary of the Group, borrowed RMB179.92 million from Sinotrans Airline in 2014, with a loan interest rate of 5.65% per annum. The Group repaid RMB99.2 million in 2018 and RMB10.0 million in the current period, leaving a principal amount of RMB70.72 million outstanding at the end of the period;
Sinotrans Logistics Investment Holdings Co., Ltd., a subsidiary of the Group, borrowed RMB20 million from SINOTRANS&CSC in 2016 with a loan term of 18 years and the interest rate of the loan was executed with reference to the interest rate of bank loans for the same period.
Note 2: The Group borrowed RMB91.94 million from Guangdong Sinotrans in 2013, with a loan term of 10 years, the interest rate of the loan was executed with reference to the bank’s lending rate for the same period, and the total principal and interest at the end of the period was RMB92.13 million.
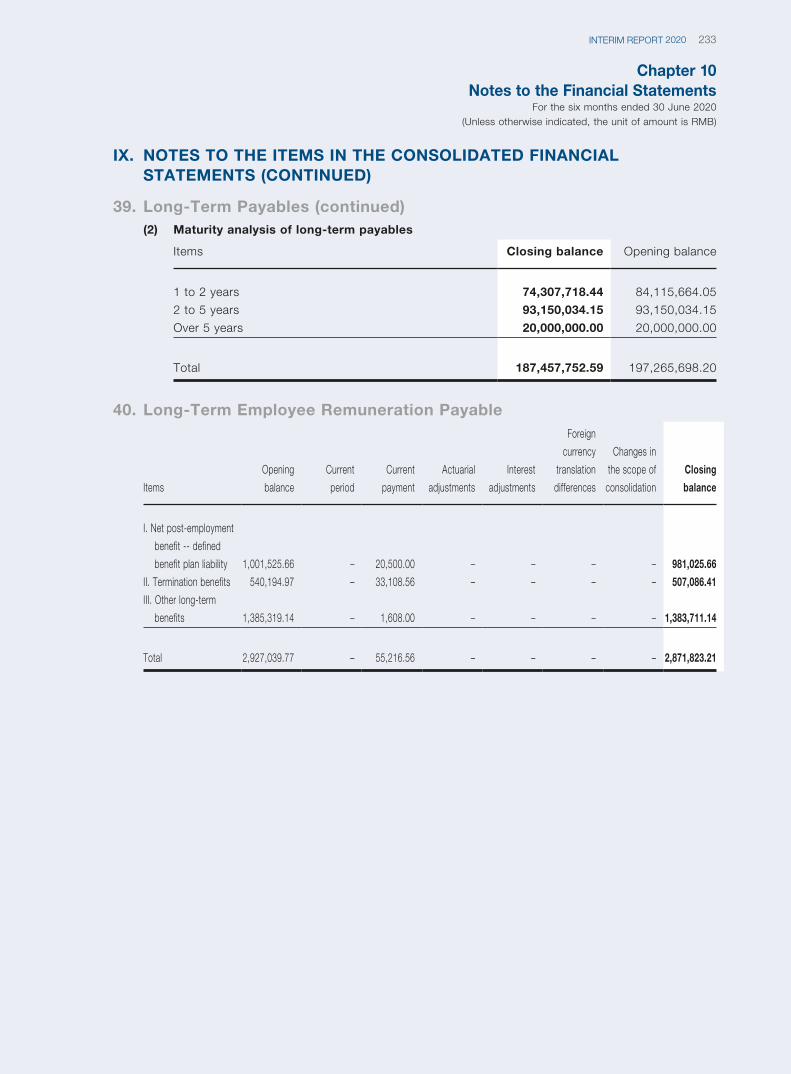
Chapter 10Notes to the Financial Statements
For the six months ended 30 June 2020(Unless otherwise indicated, the unit of amount is RMB)
233INTERIM REPORT 2020
IX. NOTES TO THE ITEMS IN THE CONSOLIDATED FINANCIAL STATEMENTS (CONTINUED)
39. Long-Term Payables (continued)(2) Maturity analysis of long-term payables
Items Closing balance Opening balance
1 to 2 years 74,307,718.44 84,115,664.05
2 to 5 years 93,150,034.15 93,150,034.15
Over 5 years 20,000,000.00 20,000,000.00
Total 187,457,752.59 197,265,698.20
40. Long-Term Employee Remuneration Payable
Items
Opening
balance
Current
period
Current
payment
Actuarial
adjustments
Interest
adjustments
Foreign
currency
translation
differences
Changes in
the scope of
consolidation
Closing
balance
I. Net post-employment
benefit -- defined
benefit plan liability 1,001,525.66 – 20,500.00 – – – – 981,025.66
II. Termination benefits 540,194.97 – 33,108.56 – – – – 507,086.41
III. Other long-term
benefits 1,385,319.14 – 1,608.00 – – – – 1,383,711.14
Total 2,927,039.77 – 55,216.56 – – – – 2,871,823.21
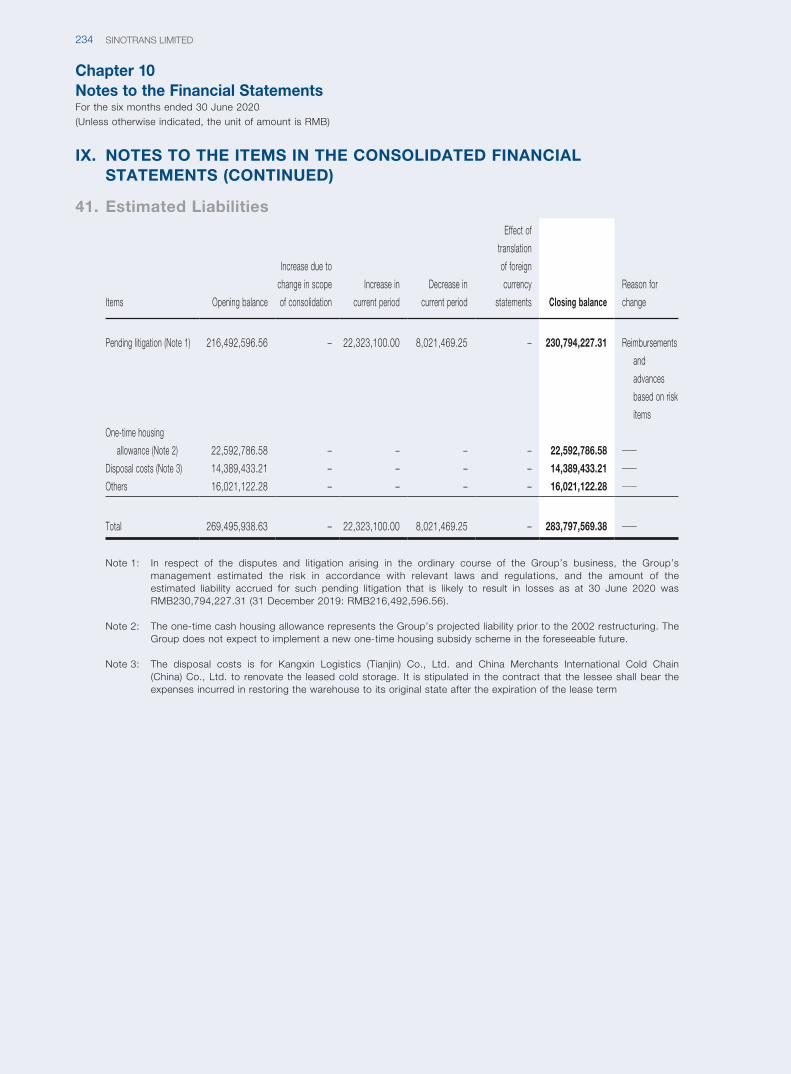
Chapter 10Notes to the Financial StatementsFor the six months ended 30 June 2020(Unless otherwise indicated, the unit of amount is RMB)
SINOTRANS LIMITED234
IX. NOTES TO THE ITEMS IN THE CONSOLIDATED FINANCIAL STATEMENTS (CONTINUED)
41. Estimated Liabilities
Items Opening balance
Increase due to
change in scope
of consolidation
Increase in
current period
Decrease in
current period
Effect of
translation
of foreign
currency
statements Closing balance
Reason for
change
Pending litigation (Note 1) 216,492,596.56 – 22,323,100.00 8,021,469.25 – 230,794,227.31 Reimbursements
and
advances
based on risk
items
One-time housing
allowance (Note 2) 22,592,786.58 – – – – 22,592,786.58 ——Disposal costs (Note 3) 14,389,433.21 – – – – 14,389,433.21 ——Others 16,021,122.28 – – – – 16,021,122.28 ——
Total 269,495,938.63 – 22,323,100.00 8,021,469.25 – 283,797,569.38 ——
Note 1: In respect of the disputes and litigation arising in the ordinary course of the Group’s business, the Group’s management estimated the risk in accordance with relevant laws and regulations, and the amount of the estimated liability accrued for such pending litigation that is likely to result in losses as at 30 June 2020 was RMB230,794,227.31 (31 December 2019: RMB216,492,596.56).
Note 2: The one-time cash housing allowance represents the Group’s projected liability prior to the 2002 restructuring. The Group does not expect to implement a new one-time housing subsidy scheme in the foreseeable future.
Note 3: The disposal costs is for Kangxin Logistics (Tianjin) Co., Ltd. and China Merchants International Cold Chain (China) Co., Ltd. to renovate the leased cold storage. It is stipulated in the contract that the lessee shall bear the expenses incurred in restoring the warehouse to its original state after the expiration of the lease term
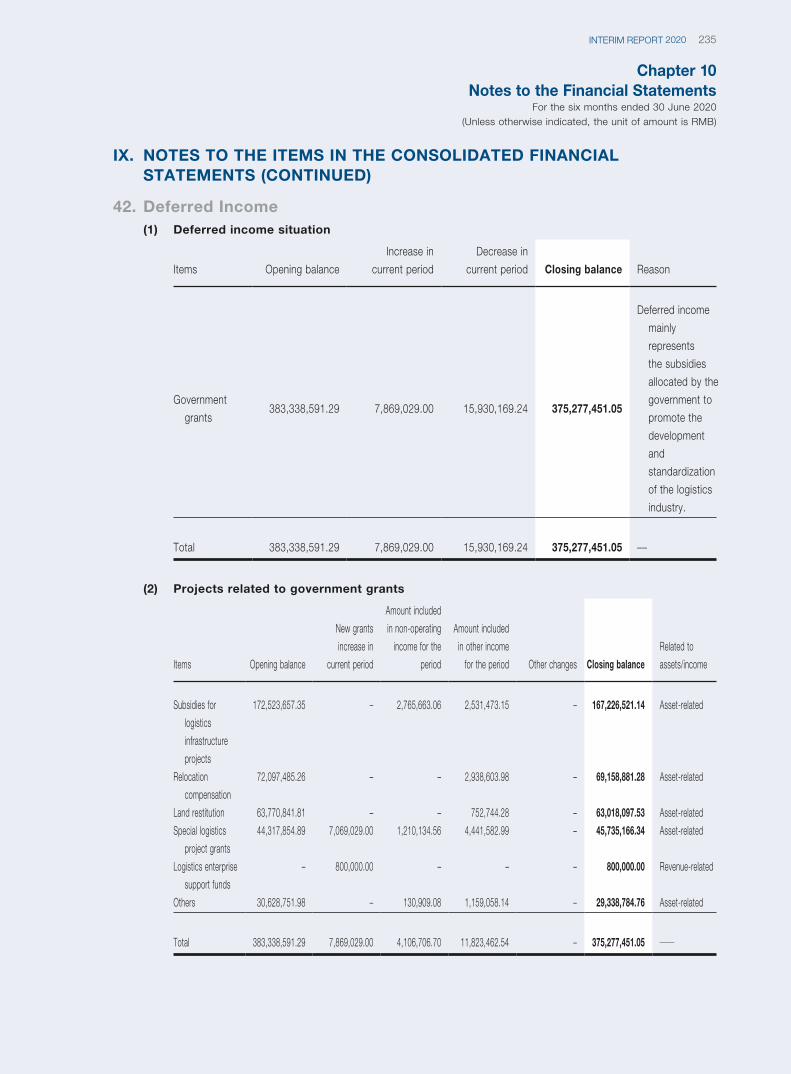
Chapter 10Notes to the Financial Statements
For the six months ended 30 June 2020(Unless otherwise indicated, the unit of amount is RMB)
235INTERIM REPORT 2020
IX. NOTES TO THE ITEMS IN THE CONSOLIDATED FINANCIAL STATEMENTS (CONTINUED)
42. Deferred Income(1) Deferred income situation
Items Opening balance
Increase in
current period
Decrease in
current period Closing balance Reason
Government
grants383,338,591.29 7,869,029.00 15,930,169.24 375,277,451.05
Deferred income
mainly
represents
the subsidies
allocated by the
government to
promote the
development
and
standardization
of the logistics
industry.
Total 383,338,591.29 7,869,029.00 15,930,169.24 375,277,451.05 ––
(2) Projects related to government grants
Items Opening balance
New grants
increase in
current period
Amount included
in non-operating
income for the
period
Amount included
in other income
for the period Other changes Closing balance
Related to
assets/income
Subsidies for
logistics
infrastructure
projects
172,523,657.35 – 2,765,663.06 2,531,473.15 – 167,226,521.14 Asset-related
Relocation
compensation
72,097,485.26 – – 2,938,603.98 – 69,158,881.28 Asset-related
Land restitution 63,770,841.81 – – 752,744.28 – 63,018,097.53 Asset-related
Special logistics
project grants
44,317,854.89 7,069,029.00 1,210,134.56 4,441,582.99 – 45,735,166.34 Asset-related
Logistics enterprise
support funds
– 800,000.00 – – – 800,000.00 Revenue-related
Others 30,628,751.98 – 130,909.08 1,159,058.14 – 29,338,784.76 Asset-related
Total 383,338,591.29 7,869,029.00 4,106,706.70 11,823,462.54 – 375,277,451.05 ——
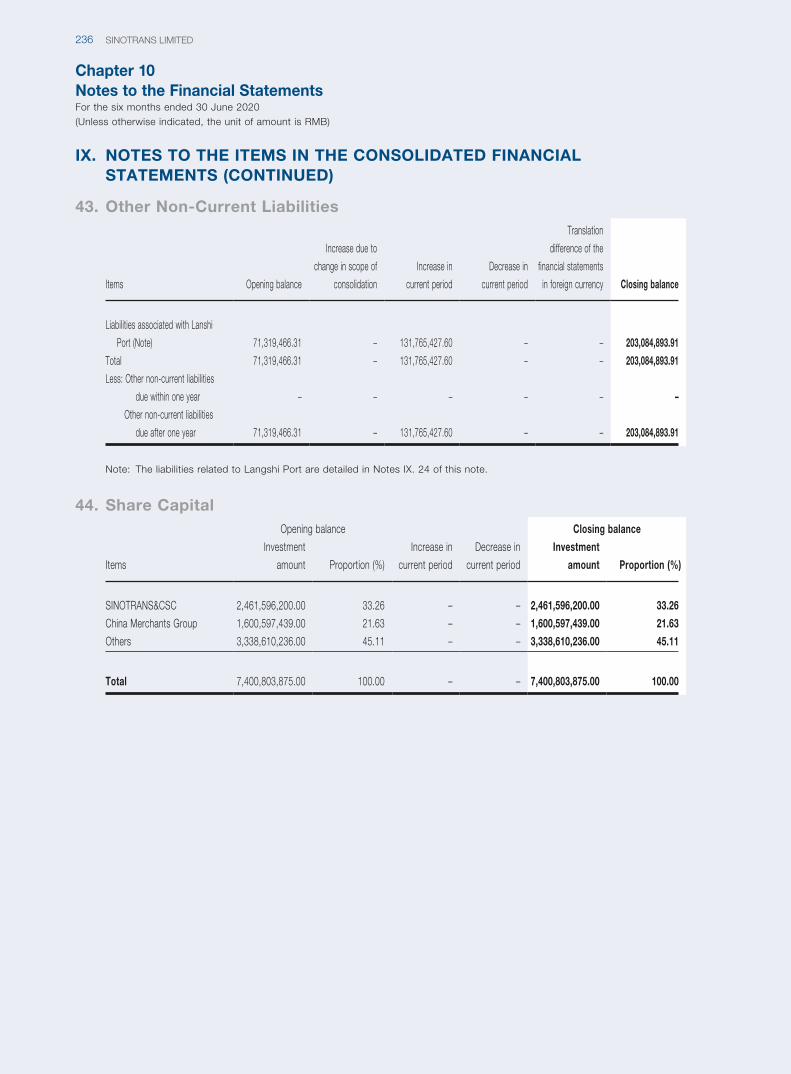
Chapter 10Notes to the Financial StatementsFor the six months ended 30 June 2020(Unless otherwise indicated, the unit of amount is RMB)
SINOTRANS LIMITED236
IX. NOTES TO THE ITEMS IN THE CONSOLIDATED FINANCIAL STATEMENTS (CONTINUED)
43. Other Non-Current Liabilities
Items Opening balance
Increase due to
change in scope of
consolidation
Increase in
current period
Decrease in
current period
Translation
difference of the
financial statements
in foreign currency Closing balance
Liabilities associated with Lanshi
Port (Note) 71,319,466.31 – 131,765,427.60 – – 203,084,893.91
Total 71,319,466.31 – 131,765,427.60 – – 203,084,893.91
Less: Other non-current liabilities
due within one year – – – – – –
Other non-current liabilities
due after one year 71,319,466.31 – 131,765,427.60 – – 203,084,893.91
Note: The liabilities related to Langshi Port are detailed in Notes IX. 24 of this note.
44. Share Capital
Items
Opening balance
Increase in
current period
Decrease in
current period
Closing balance
Investment
amount Proportion (%)
Investment
amount Proportion (%)
SINOTRANS&CSC 2,461,596,200.00 33.26 – – 2,461,596,200.00 33.26
China Merchants Group 1,600,597,439.00 21.63 – – 1,600,597,439.00 21.63
Others 3,338,610,236.00 45.11 – – 3,338,610,236.00 45.11
Total 7,400,803,875.00 100.00 – – 7,400,803,875.00 100.00
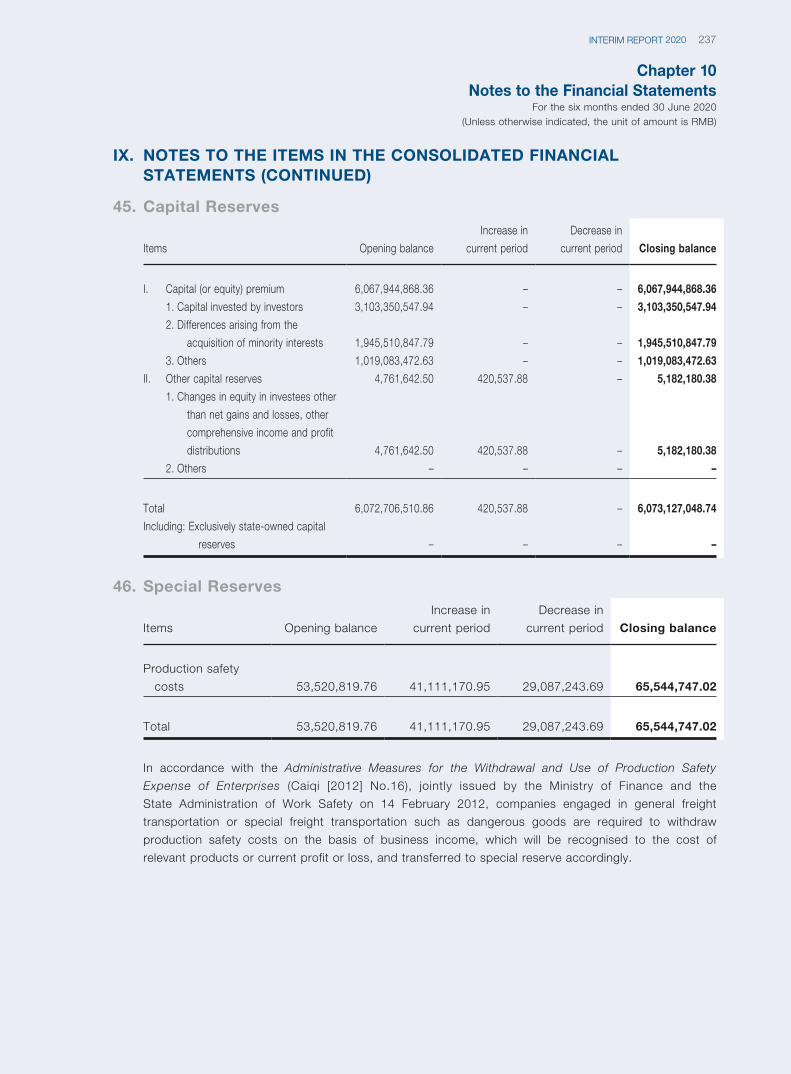
Chapter 10Notes to the Financial Statements
For the six months ended 30 June 2020(Unless otherwise indicated, the unit of amount is RMB)
237INTERIM REPORT 2020
IX. NOTES TO THE ITEMS IN THE CONSOLIDATED FINANCIAL STATEMENTS (CONTINUED)
45. Capital Reserves
Items Opening balance
Increase in
current period
Decrease in
current period Closing balance
I. Capital (or equity) premium 6,067,944,868.36 – – 6,067,944,868.36
1. Capital invested by investors 3,103,350,547.94 – – 3,103,350,547.94
2. Differences arising from the
acquisition of minority interests 1,945,510,847.79 – – 1,945,510,847.79
3. Others 1,019,083,472.63 – – 1,019,083,472.63
II. Other capital reserves 4,761,642.50 420,537.88 – 5,182,180.38
1. Changes in equity in investees other
than net gains and losses, other
comprehensive income and profit
distributions 4,761,642.50 420,537.88 – 5,182,180.38
2. Others – – – –
Total 6,072,706,510.86 420,537.88 – 6,073,127,048.74
Including: Exclusively state-owned capital
reserves – – – –
46. Special Reserves
Items Opening balance
Increase in
current period
Decrease in
current period Closing balance
Production safety
costs 53,520,819.76 41,111,170.95 29,087,243.69 65,544,747.02
Total 53,520,819.76 41,111,170.95 29,087,243.69 65,544,747.02
In accordance with the Administrative Measures for the Withdrawal and Use of Production Safety
Expense of Enterprises (Caiqi [2012] No.16), jointly issued by the Ministry of Finance and the
State Administration of Work Safety on 14 February 2012, companies engaged in general freight
transportation or special freight transportation such as dangerous goods are required to withdraw
production safety costs on the basis of business income, which will be recognised to the cost of
relevant products or current profit or loss, and transferred to special reserve accordingly.
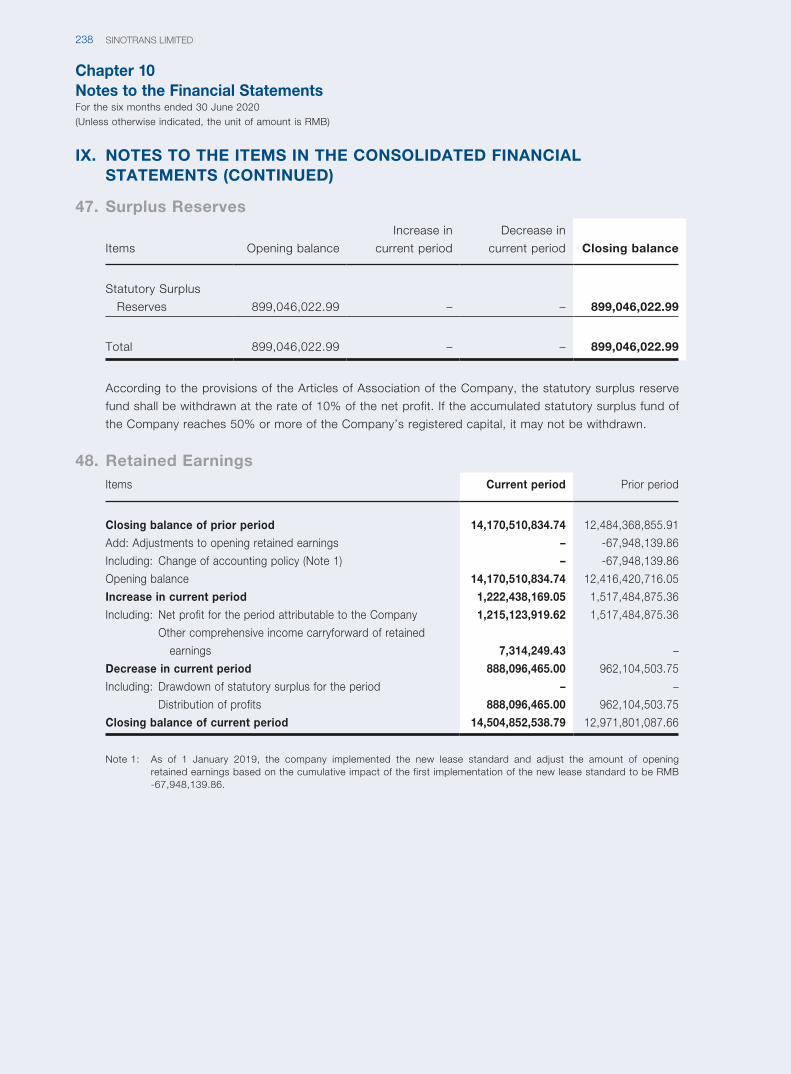
Chapter 10Notes to the Financial StatementsFor the six months ended 30 June 2020(Unless otherwise indicated, the unit of amount is RMB)
SINOTRANS LIMITED238
IX. NOTES TO THE ITEMS IN THE CONSOLIDATED FINANCIAL STATEMENTS (CONTINUED)
47. Surplus Reserves
Items Opening balance
Increase in
current period
Decrease in
current period Closing balance
Statutory Surplus
Reserves 899,046,022.99 – – 899,046,022.99
Total 899,046,022.99 – – 899,046,022.99
According to the provisions of the Articles of Association of the Company, the statutory surplus reserve
fund shall be withdrawn at the rate of 10% of the net profit. If the accumulated statutory surplus fund of
the Company reaches 50% or more of the Company’s registered capital, it may not be withdrawn.
48. Retained EarningsItems Current period Prior period
Closing balance of prior period 14,170,510,834.74 12,484,368,855.91
Add: Adjustments to opening retained earnings – -67,948,139.86
Including: Change of accounting policy (Note 1) – -67,948,139.86
Opening balance 14,170,510,834.74 12,416,420,716.05
Increase in current period 1,222,438,169.05 1,517,484,875.36
Including: Net profit for the period attributable to the Company 1,215,123,919.62 1,517,484,875.36
Other comprehensive income carryforward of retained
earnings 7,314,249.43 –
Decrease in current period 888,096,465.00 962,104,503.75
Including: Drawdown of statutory surplus for the period – –
Distribution of profits 888,096,465.00 962,104,503.75
Closing balance of current period 14,504,852,538.79 12,971,801,087.66
Note 1: As of 1 January 2019, the company implemented the new lease standard and adjust the amount of opening retained earnings based on the cumulative impact of the first implementation of the new lease standard to be RMB -67,948,139.86.
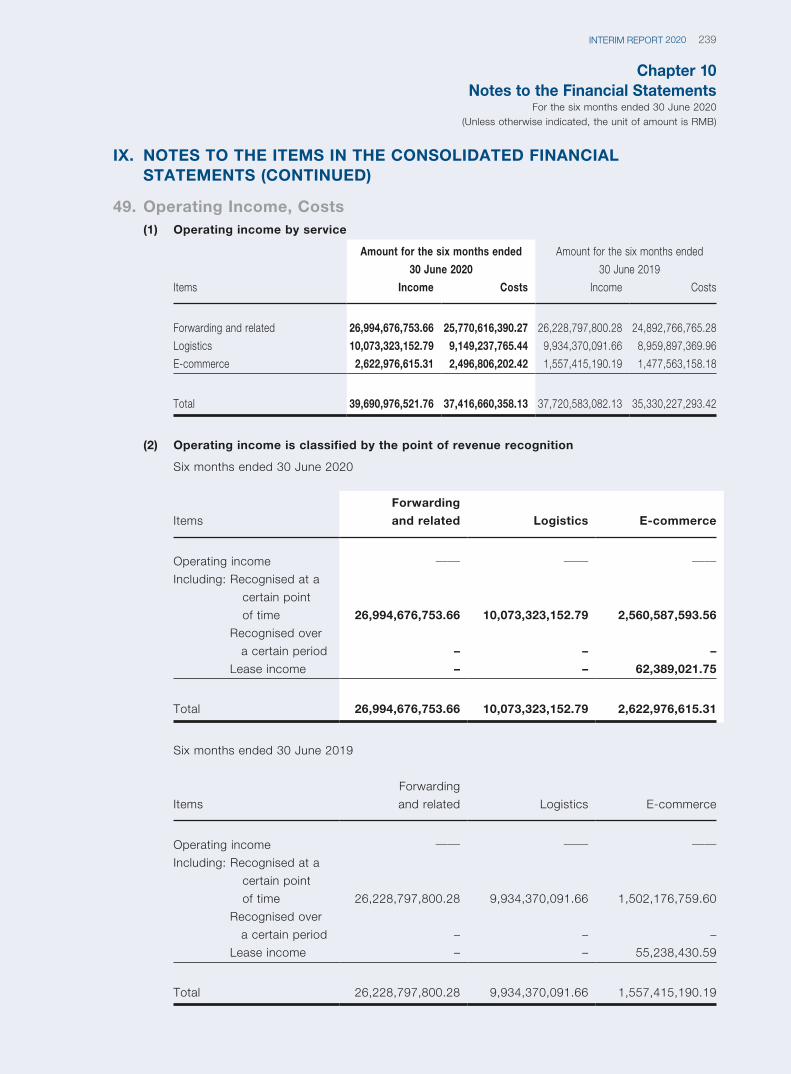
Chapter 10Notes to the Financial Statements
For the six months ended 30 June 2020(Unless otherwise indicated, the unit of amount is RMB)
239INTERIM REPORT 2020
IX. NOTES TO THE ITEMS IN THE CONSOLIDATED FINANCIAL STATEMENTS (CONTINUED)
49. Operating Income, Costs(1) Operating income by service
Items
Amount for the six months ended
30 June 2020
Amount for the six months ended
30 June 2019
Income Costs Income Costs
Forwarding and related 26,994,676,753.66 25,770,616,390.27 26,228,797,800.28 24,892,766,765.28
Logistics 10,073,323,152.79 9,149,237,765.44 9,934,370,091.66 8,959,897,369.96
E-commerce 2,622,976,615.31 2,496,806,202.42 1,557,415,190.19 1,477,563,158.18
Total 39,690,976,521.76 37,416,660,358.13 37,720,583,082.13 35,330,227,293.42
(2) Operating income is classified by the point of revenue recognition
Six months ended 30 June 2020
Items
Forwarding
and related Logistics E-commerce
Operating income —— —— ——Including: Recognised at a
certain point
of time 26,994,676,753.66 10,073,323,152.79 2,560,587,593.56
Recognised over
a certain period – – –
Lease income – – 62,389,021.75
Total 26,994,676,753.66 10,073,323,152.79 2,622,976,615.31
Six months ended 30 June 2019
Items
Forwarding
and related Logistics E-commerce
Operating income —— —— ——Including: Recognised at a
certain point
of time 26,228,797,800.28 9,934,370,091.66 1,502,176,759.60
Recognised over
a certain period – – –
Lease income – – 55,238,430.59
Total 26,228,797,800.28 9,934,370,091.66 1,557,415,190.19
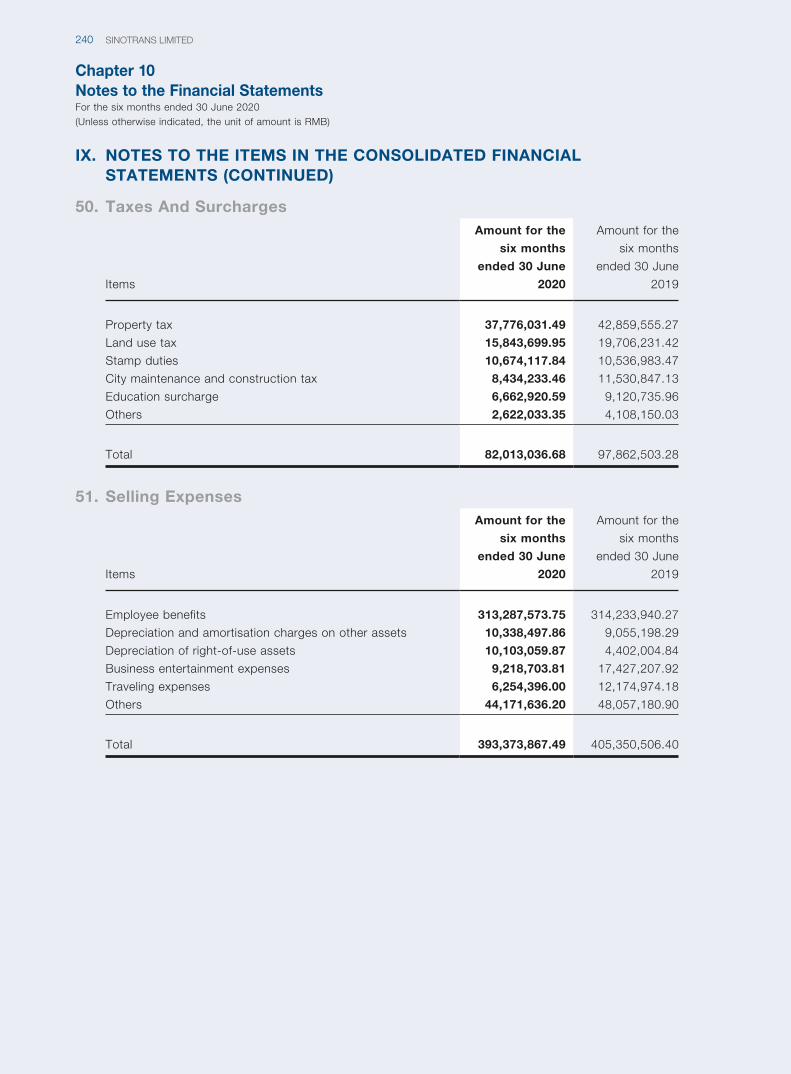
Chapter 10Notes to the Financial StatementsFor the six months ended 30 June 2020(Unless otherwise indicated, the unit of amount is RMB)
SINOTRANS LIMITED240
IX. NOTES TO THE ITEMS IN THE CONSOLIDATED FINANCIAL STATEMENTS (CONTINUED)
50. Taxes And Surcharges
Items
Amount for the
six months
ended 30 June
2020
Amount for the
six months
ended 30 June
2019
Property tax 37,776,031.49 42,859,555.27
Land use tax 15,843,699.95 19,706,231.42
Stamp duties 10,674,117.84 10,536,983.47
City maintenance and construction tax 8,434,233.46 11,530,847.13
Education surcharge 6,662,920.59 9,120,735.96
Others 2,622,033.35 4,108,150.03
Total 82,013,036.68 97,862,503.28
51. Selling Expenses
Items
Amount for the
six months
ended 30 June
2020
Amount for the
six months
ended 30 June
2019
Employee benefits 313,287,573.75 314,233,940.27
Depreciation and amortisation charges on other assets 10,338,497.86 9,055,198.29
Depreciation of right-of-use assets 10,103,059.87 4,402,004.84
Business entertainment expenses 9,218,703.81 17,427,207.92
Traveling expenses 6,254,396.00 12,174,974.18
Others 44,171,636.20 48,057,180.90
Total 393,373,867.49 405,350,506.40
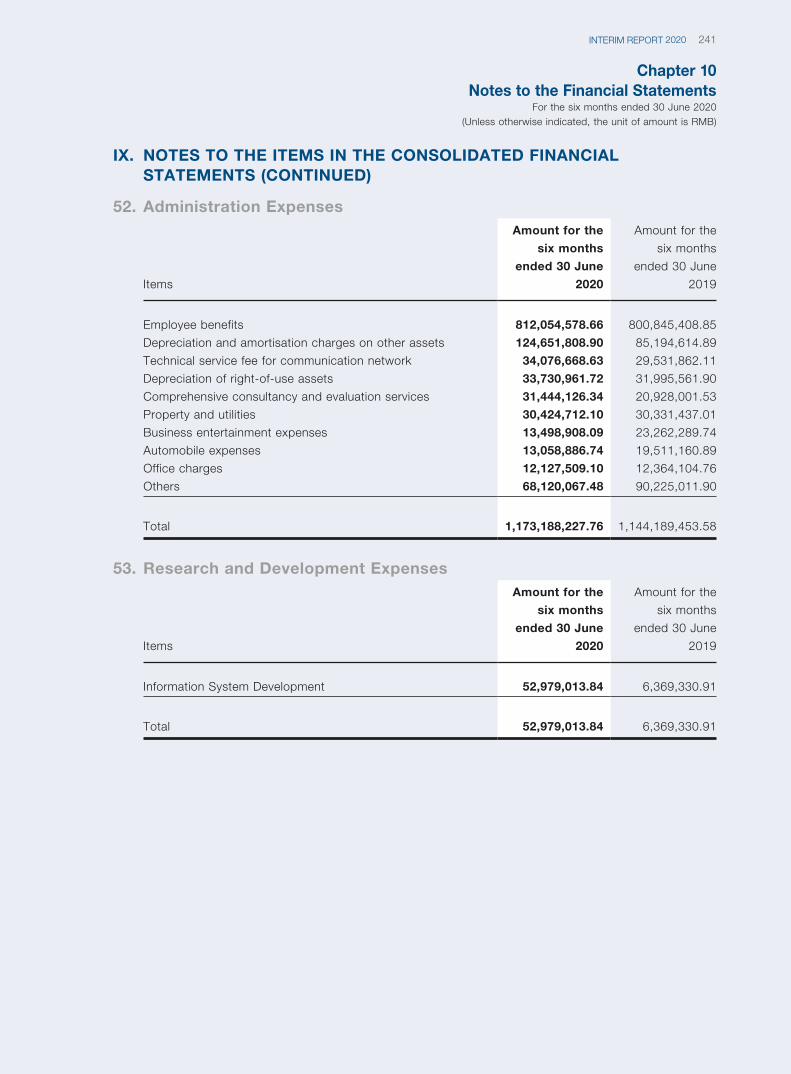
Chapter 10Notes to the Financial Statements
For the six months ended 30 June 2020(Unless otherwise indicated, the unit of amount is RMB)
241INTERIM REPORT 2020
IX. NOTES TO THE ITEMS IN THE CONSOLIDATED FINANCIAL STATEMENTS (CONTINUED)
52. Administration Expenses
Items
Amount for the
six months
ended 30 June
2020
Amount for the
six months
ended 30 June
2019
Employee benefits 812,054,578.66 800,845,408.85
Depreciation and amortisation charges on other assets 124,651,808.90 85,194,614.89
Technical service fee for communication network 34,076,668.63 29,531,862.11
Depreciation of right-of-use assets 33,730,961.72 31,995,561.90
Comprehensive consultancy and evaluation services 31,444,126.34 20,928,001.53
Property and utilities 30,424,712.10 30,331,437.01
Business entertainment expenses 13,498,908.09 23,262,289.74
Automobile expenses 13,058,886.74 19,511,160.89
Office charges 12,127,509.10 12,364,104.76
Others 68,120,067.48 90,225,011.90
Total 1,173,188,227.76 1,144,189,453.58
53. Research and Development Expenses
Items
Amount for the
six months
ended 30 June
2020
Amount for the
six months
ended 30 June
2019
Information System Development 52,979,013.84 6,369,330.91
Total 52,979,013.84 6,369,330.91
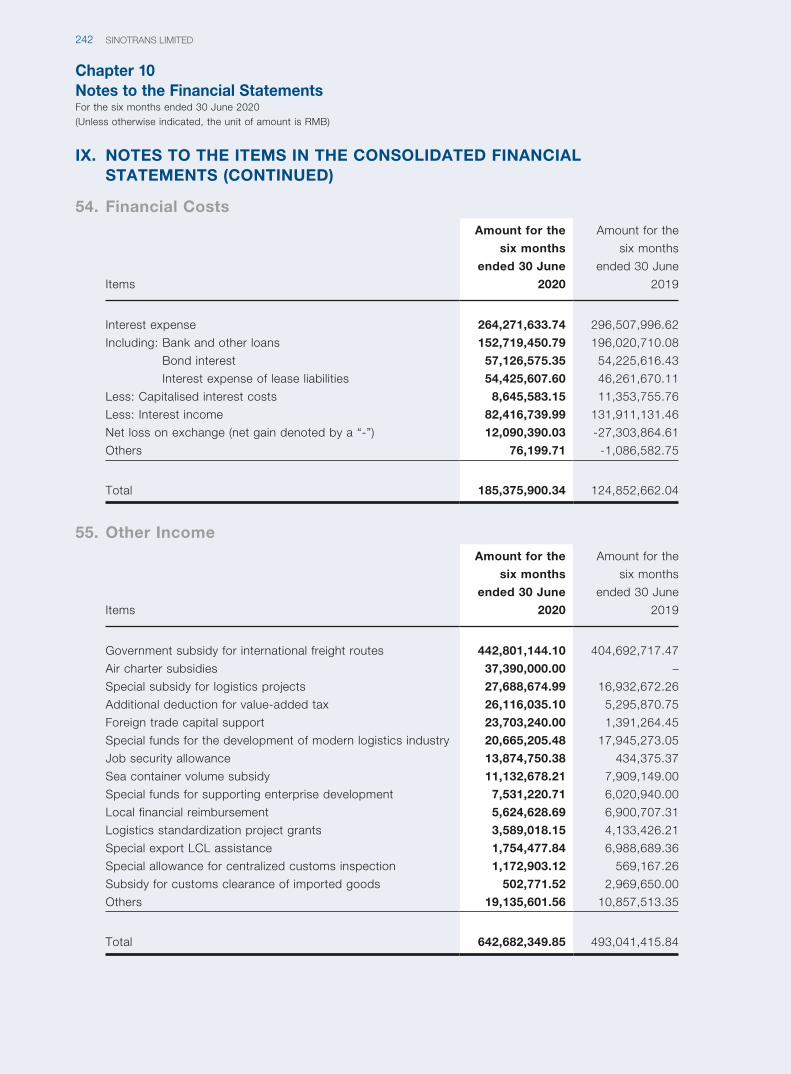
Chapter 10Notes to the Financial StatementsFor the six months ended 30 June 2020(Unless otherwise indicated, the unit of amount is RMB)
SINOTRANS LIMITED242
IX. NOTES TO THE ITEMS IN THE CONSOLIDATED FINANCIAL STATEMENTS (CONTINUED)
54. Financial Costs
Items
Amount for the
six months
ended 30 June
2020
Amount for the
six months
ended 30 June
2019
Interest expense 264,271,633.74 296,507,996.62
Including: Bank and other loans 152,719,450.79 196,020,710.08
Bond interest 57,126,575.35 54,225,616.43
Interest expense of lease liabilities 54,425,607.60 46,261,670.11
Less: Capitalised interest costs 8,645,583.15 11,353,755.76
Less: Interest income 82,416,739.99 131,911,131.46
Net loss on exchange (net gain denoted by a “-”) 12,090,390.03 -27,303,864.61
Others 76,199.71 -1,086,582.75
Total 185,375,900.34 124,852,662.04
55. Other Income
Items
Amount for the
six months
ended 30 June
2020
Amount for the
six months
ended 30 June
2019
Government subsidy for international freight routes 442,801,144.10 404,692,717.47
Air charter subsidies 37,390,000.00 –
Special subsidy for logistics projects 27,688,674.99 16,932,672.26
Additional deduction for value-added tax 26,116,035.10 5,295,870.75
Foreign trade capital support 23,703,240.00 1,391,264.45
Special funds for the development of modern logistics industry 20,665,205.48 17,945,273.05
Job security allowance 13,874,750.38 434,375.37
Sea container volume subsidy 11,132,678.21 7,909,149.00
Special funds for supporting enterprise development 7,531,220.71 6,020,940.00
Local financial reimbursement 5,624,628.69 6,900,707.31
Logistics standardization project grants 3,589,018.15 4,133,426.21
Special export LCL assistance 1,754,477.84 6,988,689.36
Special allowance for centralized customs inspection 1,172,903.12 569,167.26
Subsidy for customs clearance of imported goods 502,771.52 2,969,650.00
Others 19,135,601.56 10,857,513.35
Total 642,682,349.85 493,041,415.84
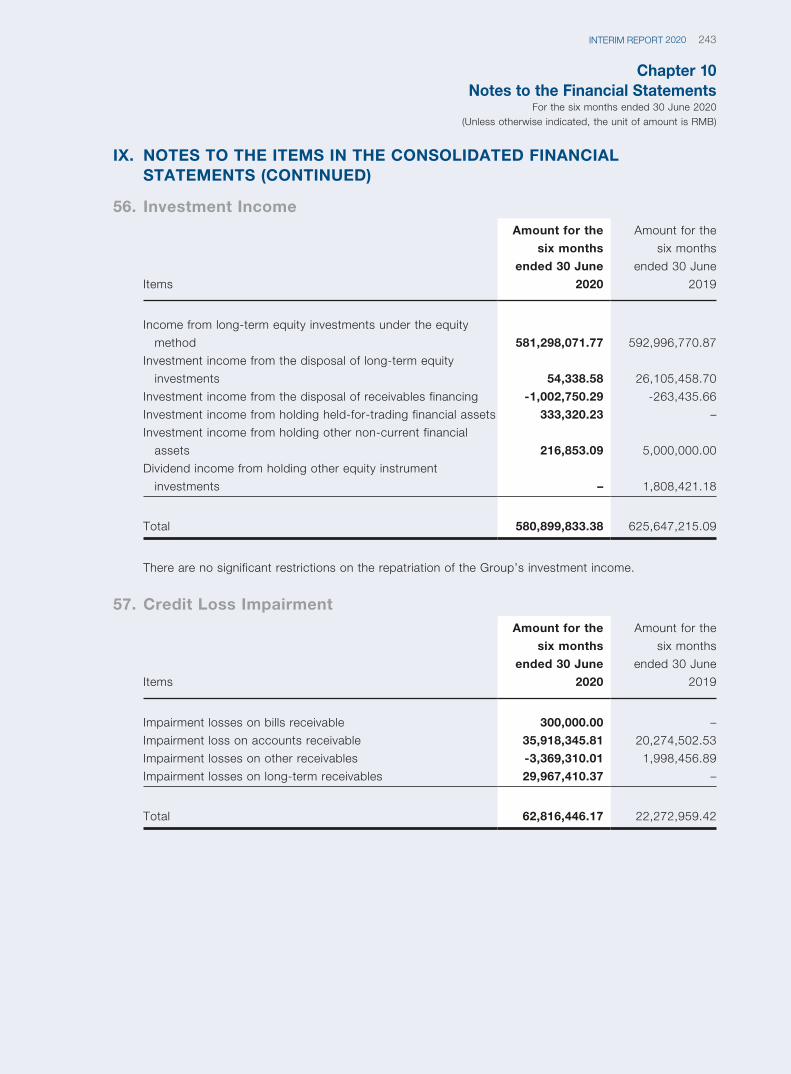
Chapter 10Notes to the Financial Statements
For the six months ended 30 June 2020(Unless otherwise indicated, the unit of amount is RMB)
243INTERIM REPORT 2020
IX. NOTES TO THE ITEMS IN THE CONSOLIDATED FINANCIAL STATEMENTS (CONTINUED)
56. Investment Income
Items
Amount for the
six months
ended 30 June
2020
Amount for the
six months
ended 30 June
2019
Income from long-term equity investments under the equity
method 581,298,071.77 592,996,770.87
Investment income from the disposal of long-term equity
investments 54,338.58 26,105,458.70
Investment income from the disposal of receivables financing -1,002,750.29 -263,435.66
Investment income from holding held-for-trading financial assets 333,320.23 –
Investment income from holding other non-current financial
assets 216,853.09 5,000,000.00
Dividend income from holding other equity instrument
investments – 1,808,421.18
Total 580,899,833.38 625,647,215.09
There are no significant restrictions on the repatriation of the Group’s investment income.
57. Credit Loss Impairment
Items
Amount for the
six months
ended 30 June
2020
Amount for the
six months
ended 30 June
2019
Impairment losses on bills receivable 300,000.00 –
Impairment loss on accounts receivable 35,918,345.81 20,274,502.53
Impairment losses on other receivables -3,369,310.01 1,998,456.89
Impairment losses on long-term receivables 29,967,410.37 –
Total 62,816,446.17 22,272,959.42
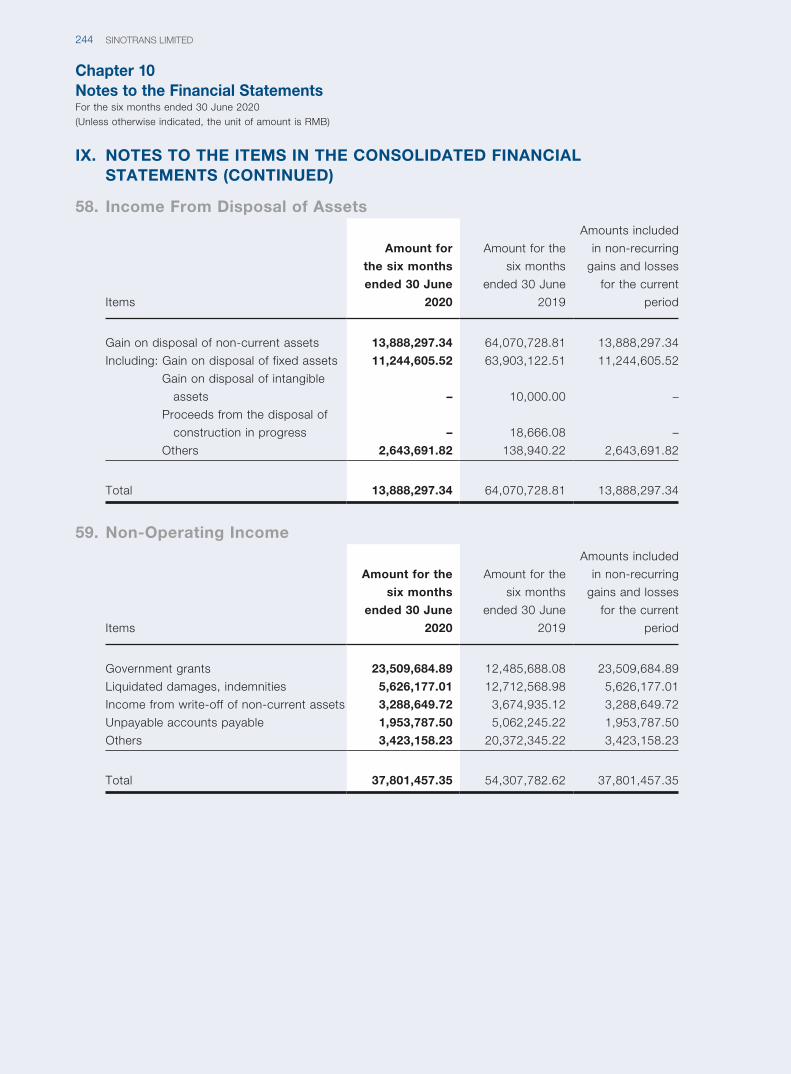
Chapter 10Notes to the Financial StatementsFor the six months ended 30 June 2020(Unless otherwise indicated, the unit of amount is RMB)
SINOTRANS LIMITED244
IX. NOTES TO THE ITEMS IN THE CONSOLIDATED FINANCIAL STATEMENTS (CONTINUED)
58. Income From Disposal of Assets
Items
Amount for
the six months
ended 30 June
2020
Amount for the
six months
ended 30 June
2019
Amounts included
in non-recurring
gains and losses
for the current
period
Gain on disposal of non-current assets 13,888,297.34 64,070,728.81 13,888,297.34
Including: Gain on disposal of fixed assets 11,244,605.52 63,903,122.51 11,244,605.52
Gain on disposal of intangible
assets – 10,000.00 –
Proceeds from the disposal of
construction in progress – 18,666.08 –
Others 2,643,691.82 138,940.22 2,643,691.82
Total 13,888,297.34 64,070,728.81 13,888,297.34
59. Non-Operating Income
Items
Amount for the
six months
ended 30 June
2020
Amount for the
six months
ended 30 June
2019
Amounts included
in non-recurring
gains and losses
for the current
period
Government grants 23,509,684.89 12,485,688.08 23,509,684.89
Liquidated damages, indemnities 5,626,177.01 12,712,568.98 5,626,177.01
Income from write-off of non-current assets 3,288,649.72 3,674,935.12 3,288,649.72
Unpayable accounts payable 1,953,787.50 5,062,245.22 1,953,787.50
Others 3,423,158.23 20,372,345.22 3,423,158.23
Total 37,801,457.35 54,307,782.62 37,801,457.35
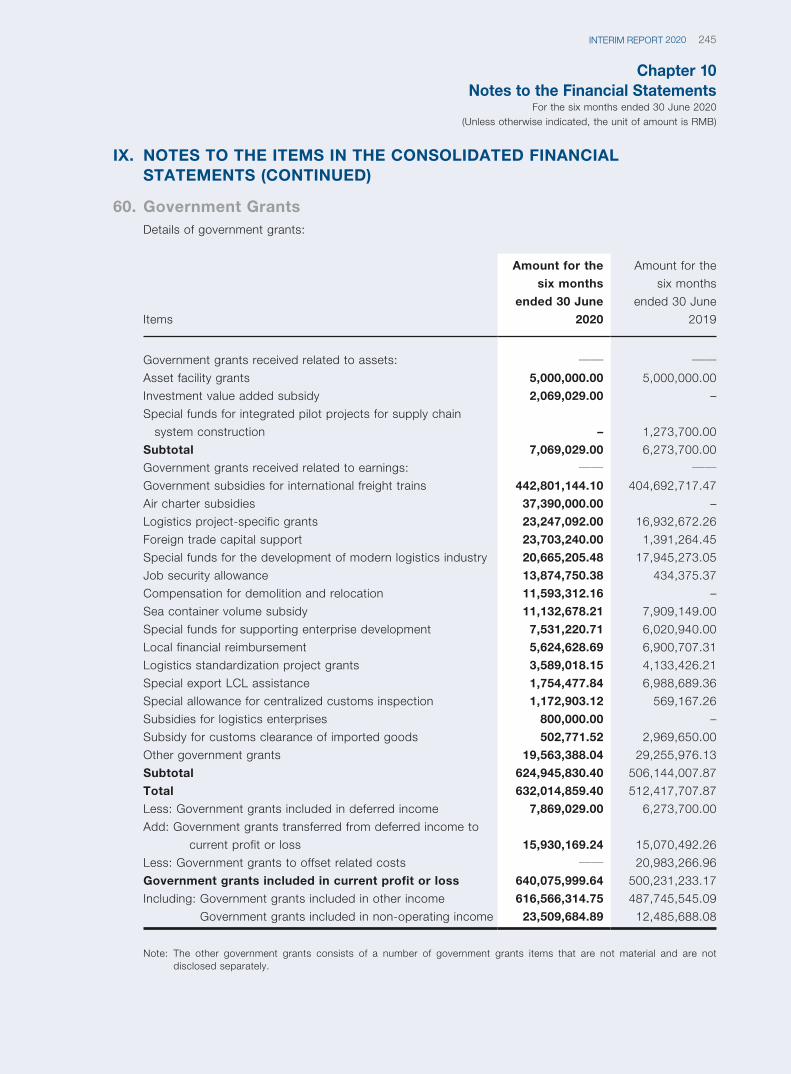
Chapter 10Notes to the Financial Statements
For the six months ended 30 June 2020(Unless otherwise indicated, the unit of amount is RMB)
245INTERIM REPORT 2020
IX. NOTES TO THE ITEMS IN THE CONSOLIDATED FINANCIAL STATEMENTS (CONTINUED)
60. Government GrantsDetails of government grants:
Items
Amount for the
six months
ended 30 June
2020
Amount for the
six months
ended 30 June
2019
Government grants received related to assets: —— ——Asset facility grants 5,000,000.00 5,000,000.00
Investment value added subsidy 2,069,029.00 –
Special funds for integrated pilot projects for supply chain
system construction – 1,273,700.00
Subtotal 7,069,029.00 6,273,700.00
Government grants received related to earnings: —— ——Government subsidies for international freight trains 442,801,144.10 404,692,717.47
Air charter subsidies 37,390,000.00 –
Logistics project-specific grants 23,247,092.00 16,932,672.26
Foreign trade capital support 23,703,240.00 1,391,264.45
Special funds for the development of modern logistics industry 20,665,205.48 17,945,273.05
Job security allowance 13,874,750.38 434,375.37
Compensation for demolition and relocation 11,593,312.16 –
Sea container volume subsidy 11,132,678.21 7,909,149.00
Special funds for supporting enterprise development 7,531,220.71 6,020,940.00
Local financial reimbursement 5,624,628.69 6,900,707.31
Logistics standardization project grants 3,589,018.15 4,133,426.21
Special export LCL assistance 1,754,477.84 6,988,689.36
Special allowance for centralized customs inspection 1,172,903.12 569,167.26
Subsidies for logistics enterprises 800,000.00 –
Subsidy for customs clearance of imported goods 502,771.52 2,969,650.00
Other government grants 19,563,388.04 29,255,976.13
Subtotal 624,945,830.40 506,144,007.87
Total 632,014,859.40 512,417,707.87
Less: Government grants included in deferred income 7,869,029.00 6,273,700.00
Add: Go vernment grants transferred from deferred income to
current profit or loss 15,930,169.24 15,070,492.26
Less: Government grants to offset related costs —— 20,983,266.96
Government grants included in current profit or loss 640,075,999.64 500,231,233.17
Including: Government grants included in other income 616,566,314.75 487,745,545.09
Government grants included in non-operating income 23,509,684.89 12,485,688.08
Note: The other government grants consists of a number of government grants items that are not material and are not disclosed separately.
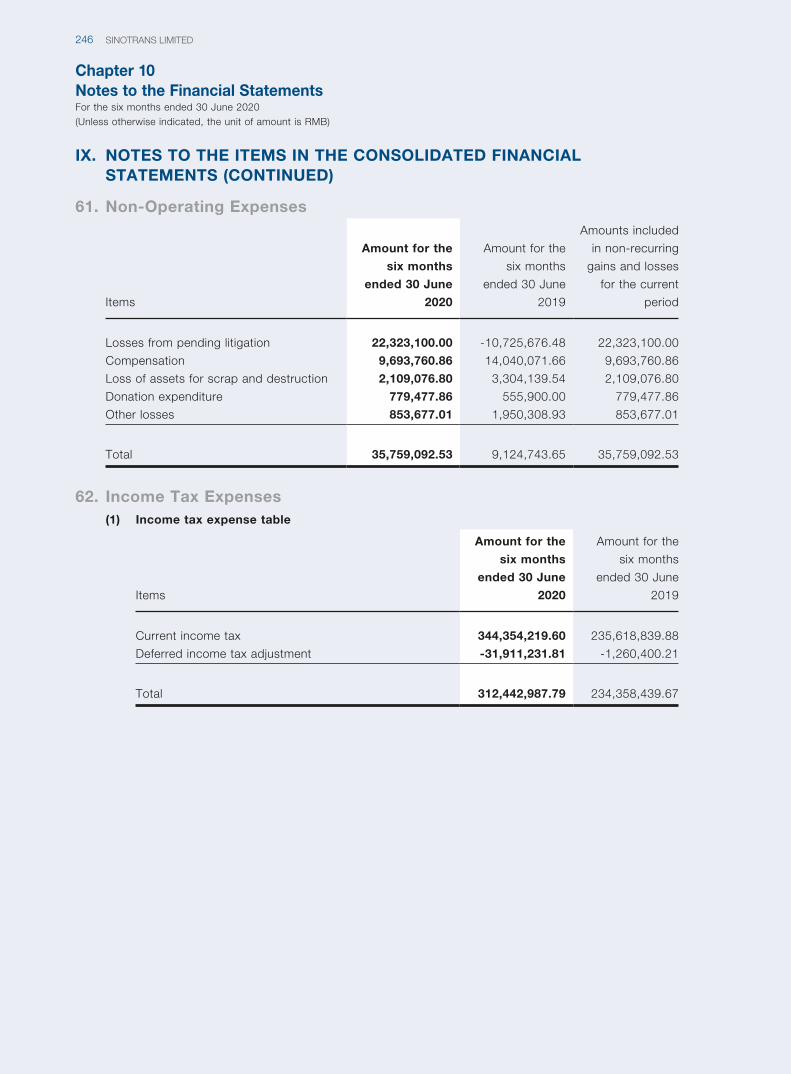
Chapter 10Notes to the Financial StatementsFor the six months ended 30 June 2020(Unless otherwise indicated, the unit of amount is RMB)
SINOTRANS LIMITED246
IX. NOTES TO THE ITEMS IN THE CONSOLIDATED FINANCIAL STATEMENTS (CONTINUED)
61. Non-Operating Expenses
Items
Amount for the
six months
ended 30 June
2020
Amount for the
six months
ended 30 June
2019
Amounts included
in non-recurring
gains and losses
for the current
period
Losses from pending litigation 22,323,100.00 -10,725,676.48 22,323,100.00
Compensation 9,693,760.86 14,040,071.66 9,693,760.86
Loss of assets for scrap and destruction 2,109,076.80 3,304,139.54 2,109,076.80
Donation expenditure 779,477.86 555,900.00 779,477.86
Other losses 853,677.01 1,950,308.93 853,677.01
Total 35,759,092.53 9,124,743.65 35,759,092.53
62. Income Tax Expenses(1) Income tax expense table
Items
Amount for the
six months
ended 30 June
2020
Amount for the
six months
ended 30 June
2019
Current income tax 344,354,219.60 235,618,839.88
Deferred income tax adjustment -31,911,231.81 -1,260,400.21
Total 312,442,987.79 234,358,439.67
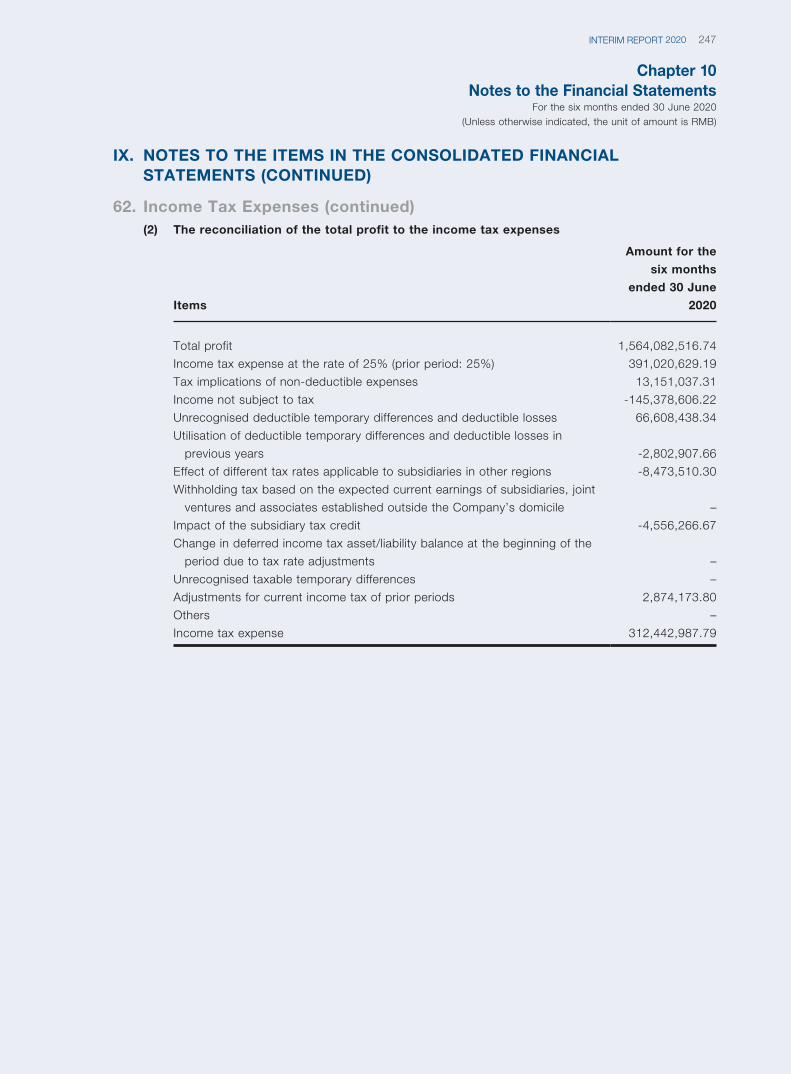
Chapter 10Notes to the Financial Statements
For the six months ended 30 June 2020(Unless otherwise indicated, the unit of amount is RMB)
247INTERIM REPORT 2020
IX. NOTES TO THE ITEMS IN THE CONSOLIDATED FINANCIAL STATEMENTS (CONTINUED)
62. Income Tax Expenses (continued)(2) The reconciliation of the total profit to the income tax expenses
Items
Amount for the
six months
ended 30 June
2020
Total profit 1,564,082,516.74
Income tax expense at the rate of 25% (prior period: 25%) 391,020,629.19
Tax implications of non-deductible expenses 13,151,037.31
Income not subject to tax -145,378,606.22
Unrecognised deductible temporary differences and deductible losses 66,608,438.34
Utilisation of deductible temporary differences and deductible losses in
previous years -2,802,907.66
Effect of different tax rates applicable to subsidiaries in other regions -8,473,510.30
Withholding tax based on the expected current earnings of subsidiaries, joint
ventures and associates established outside the Company’s domicile –
Impact of the subsidiary tax credit -4,556,266.67
Change in deferred income tax asset/liability balance at the beginning of the
period due to tax rate adjustments –
Unrecognised taxable temporary differences –
Adjustments for current income tax of prior periods 2,874,173.80
Others –
Income tax expense 312,442,987.79
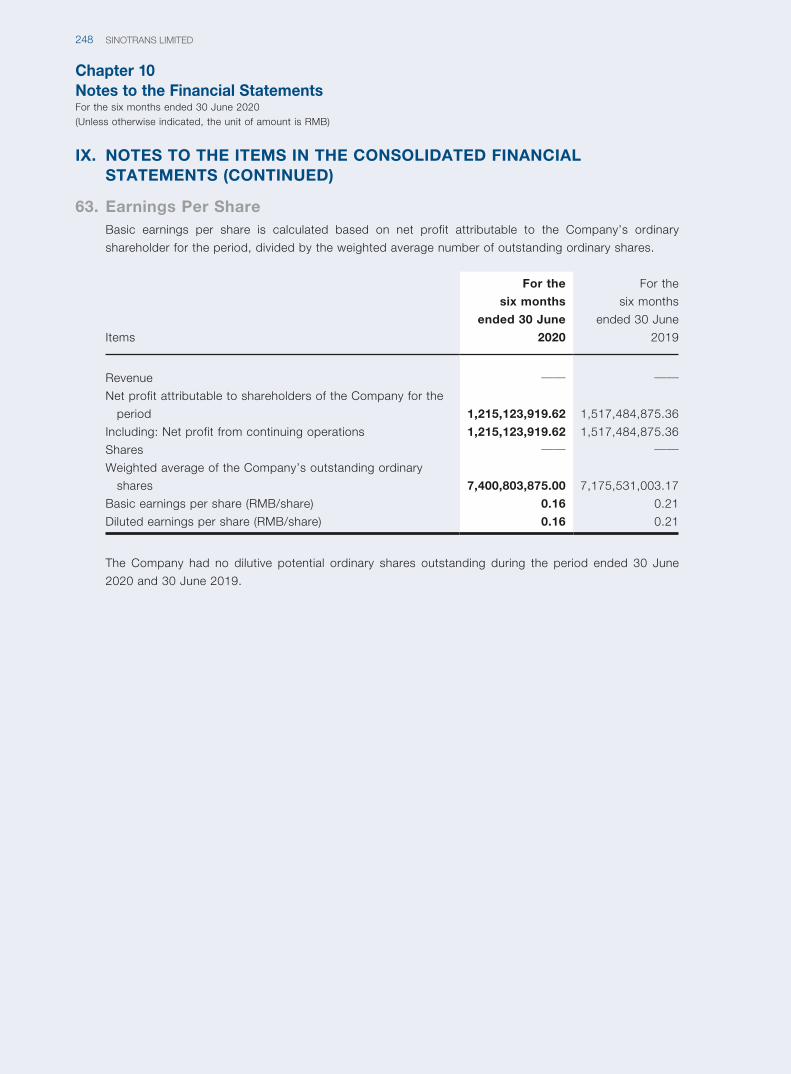
Chapter 10Notes to the Financial StatementsFor the six months ended 30 June 2020(Unless otherwise indicated, the unit of amount is RMB)
SINOTRANS LIMITED248
IX. NOTES TO THE ITEMS IN THE CONSOLIDATED FINANCIAL STATEMENTS (CONTINUED)
63. Earnings Per ShareBasic earnings per share is calculated based on net profit attributable to the Company’s ordinary
shareholder for the period, divided by the weighted average number of outstanding ordinary shares.
Items
For the
six months
ended 30 June
2020
For the
six months
ended 30 June
2019
Revenue —— ——Net profit attributable to shareholders of the Company for the
period 1,215,123,919.62 1,517,484,875.36
Including: Net profit from continuing operations 1,215,123,919.62 1,517,484,875.36
Shares —— ——Weighted average of the Company’s outstanding ordinary
shares 7,400,803,875.00 7,175,531,003.17
Basic earnings per share (RMB/share) 0.16 0.21
Diluted earnings per share (RMB/share) 0.16 0.21
The Company had no dilutive potential ordinary shares outstanding during the period ended 30 June
2020 and 30 June 2019.
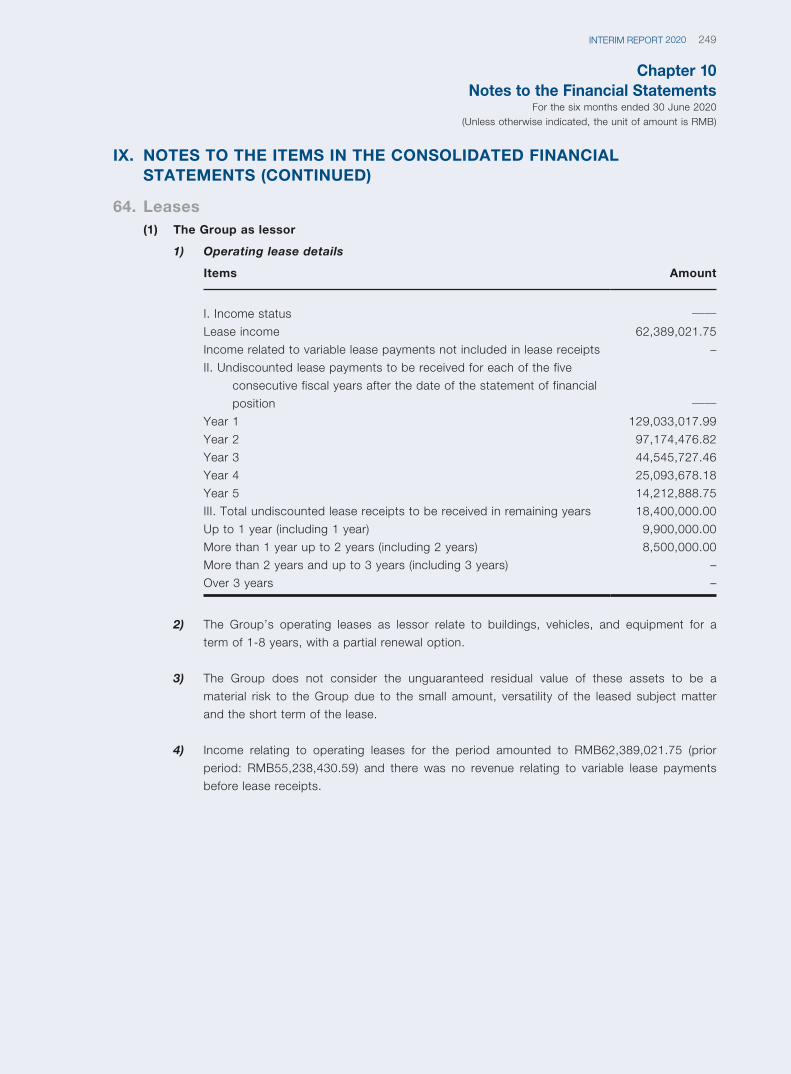
Chapter 10Notes to the Financial Statements
For the six months ended 30 June 2020(Unless otherwise indicated, the unit of amount is RMB)
249INTERIM REPORT 2020
IX. NOTES TO THE ITEMS IN THE CONSOLIDATED FINANCIAL STATEMENTS (CONTINUED)
64. Leases(1) The Group as lessor
1) Operating lease details
Items Amount
I. Income status ——Lease income 62,389,021.75
Income related to variable lease payments not included in lease receipts –
II. Un discounted lease payments to be received for each of the five
consecutive fiscal years after the date of the statement of financial
position ——Year 1 129,033,017.99
Year 2 97,174,476.82
Year 3 44,545,727.46
Year 4 25,093,678.18
Year 5 14,212,888.75
III. Total undiscounted lease receipts to be received in remaining years 18,400,000.00
Up to 1 year (including 1 year) 9,900,000.00
More than 1 year up to 2 years (including 2 years) 8,500,000.00
More than 2 years and up to 3 years (including 3 years) –
Over 3 years –
2) The Group’s operating leases as lessor relate to buildings, vehicles, and equipment for a
term of 1-8 years, with a partial renewal option.
3) The Group does not consider the unguaranteed residual value of these assets to be a
material risk to the Group due to the small amount, versatility of the leased subject matter
and the short term of the lease.
4) Income relating to operating leases for the period amounted to RMB62,389,021.75 (prior
period: RMB55,238,430.59) and there was no revenue relating to variable lease payments
before lease receipts.
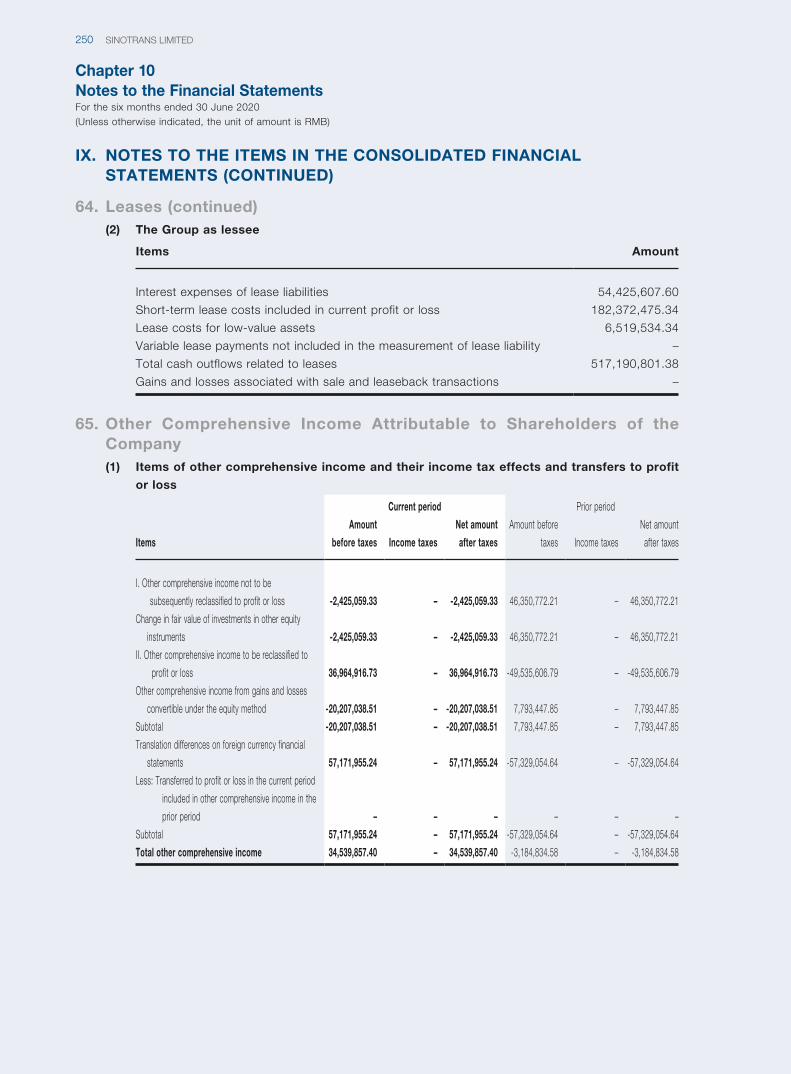
Chapter 10Notes to the Financial StatementsFor the six months ended 30 June 2020(Unless otherwise indicated, the unit of amount is RMB)
SINOTRANS LIMITED250
IX. NOTES TO THE ITEMS IN THE CONSOLIDATED FINANCIAL STATEMENTS (CONTINUED)
64. Leases (continued)(2) The Group as lessee
Items Amount
Interest expenses of lease liabilities 54,425,607.60
Short-term lease costs included in current profit or loss 182,372,475.34
Lease costs for low-value assets 6,519,534.34
Variable lease payments not included in the measurement of lease liability –
Total cash outflows related to leases 517,190,801.38
Gains and losses associated with sale and leaseback transactions –
65. Other Comprehensive Income Attributable to Shareholders of the Company(1) Items of other comprehensive income and their income tax effects and transfers to profit
or loss
Items
Current period Prior period
Amount
before taxes Income taxes
Net amount
after taxes
Amount before
taxes Income taxes
Net amount
after taxes
I. Ot her comprehensive income not to be
subsequently reclassified to profit or loss -2,425,059.33 – -2,425,059.33 46,350,772.21 – 46,350,772.21
Change in fair value of investments in other equity
instruments -2,425,059.33 – -2,425,059.33 46,350,772.21 – 46,350,772.21
II. Ot her comprehensive income to be reclassified to
profit or loss 36,964,916.73 – 36,964,916.73 -49,535,606.79 – -49,535,606.79
Other comprehensive income from gains and losses
convertible under the equity method -20,207,038.51 – -20,207,038.51 7,793,447.85 – 7,793,447.85
Subtotal -20,207,038.51 – -20,207,038.51 7,793,447.85 – 7,793,447.85
Translation differences on foreign currency financial
statements 57,171,955.24 – 57,171,955.24 -57,329,054.64 – -57,329,054.64
Less: Tr ansferred to profit or loss in the current period
included in other comprehensive income in the
prior period – – – – – –
Subtotal 57,171,955.24 – 57,171,955.24 -57,329,054.64 – -57,329,054.64
Total other comprehensive income 34,539,857.40 – 34,539,857.40 -3,184,834.58 – -3,184,834.58
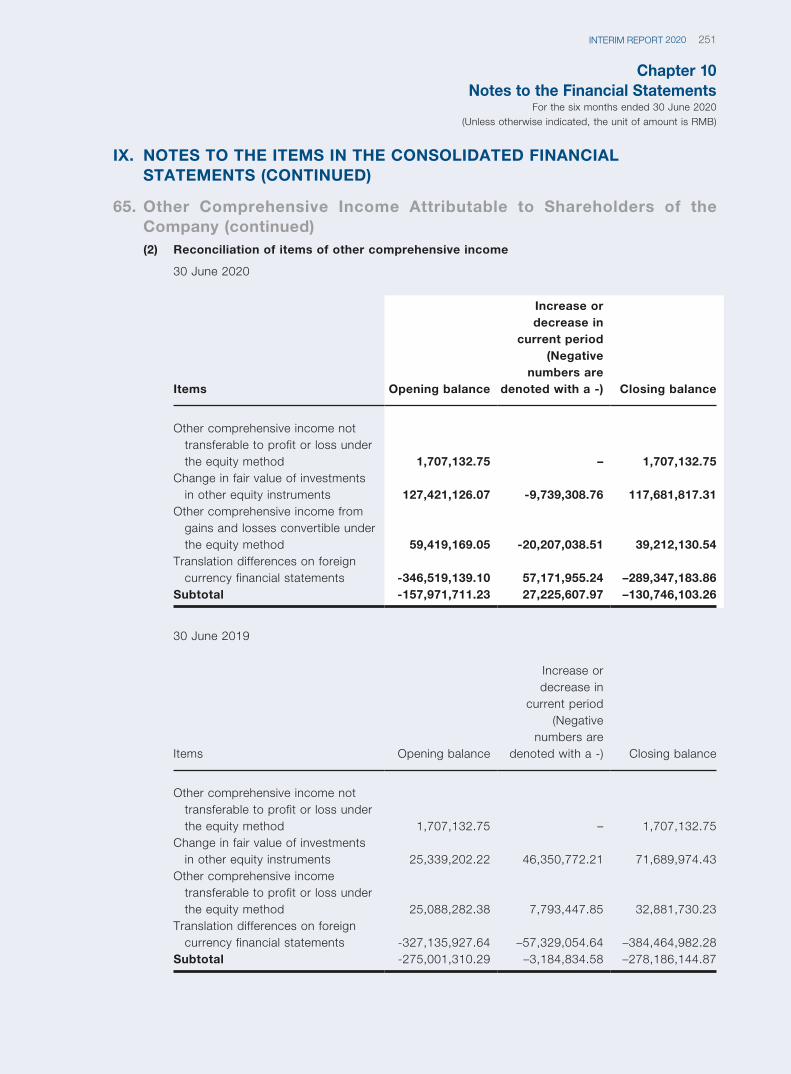
Chapter 10Notes to the Financial Statements
For the six months ended 30 June 2020(Unless otherwise indicated, the unit of amount is RMB)
251INTERIM REPORT 2020
IX. NOTES TO THE ITEMS IN THE CONSOLIDATED FINANCIAL STATEMENTS (CONTINUED)
65. Other Comprehensive Income Attributable to Shareholders of the Company (continued)(2) Reconciliation of items of other comprehensive income
30 June 2020
Items Opening balance
Increase or decrease in
current period (Negative
numbers are denoted with a -) Closing balance
Other comprehensive income not transferable to profit or loss under the equity method 1,707,132.75 – 1,707,132.75
Change in fair value of investments in other equity instruments 127,421,126.07 -9,739,308.76 117,681,817.31
Other comprehensive income from gains and losses convertible under the equity method 59,419,169.05 -20,207,038.51 39,212,130.54
Translation differences on foreign currency financial statements -346,519,139.10 57,171,955.24 –289,347,183.86
Subtotal -157,971,711.23 27,225,607.97 –130,746,103.26
30 June 2019
Items Opening balance
Increase or decrease in
current period (Negative
numbers are denoted with a -) Closing balance
Other comprehensive income not transferable to profit or loss under the equity method 1,707,132.75 – 1,707,132.75
Change in fair value of investments in other equity instruments 25,339,202.22 46,350,772.21 71,689,974.43
Other comprehensive income transferable to profit or loss under the equity method 25,088,282.38 7,793,447.85 32,881,730.23
Translation differences on foreign currency financial statements -327,135,927.64 –57,329,054.64 –384,464,982.28
Subtotal -275,001,310.29 –3,184,834.58 –278,186,144.87
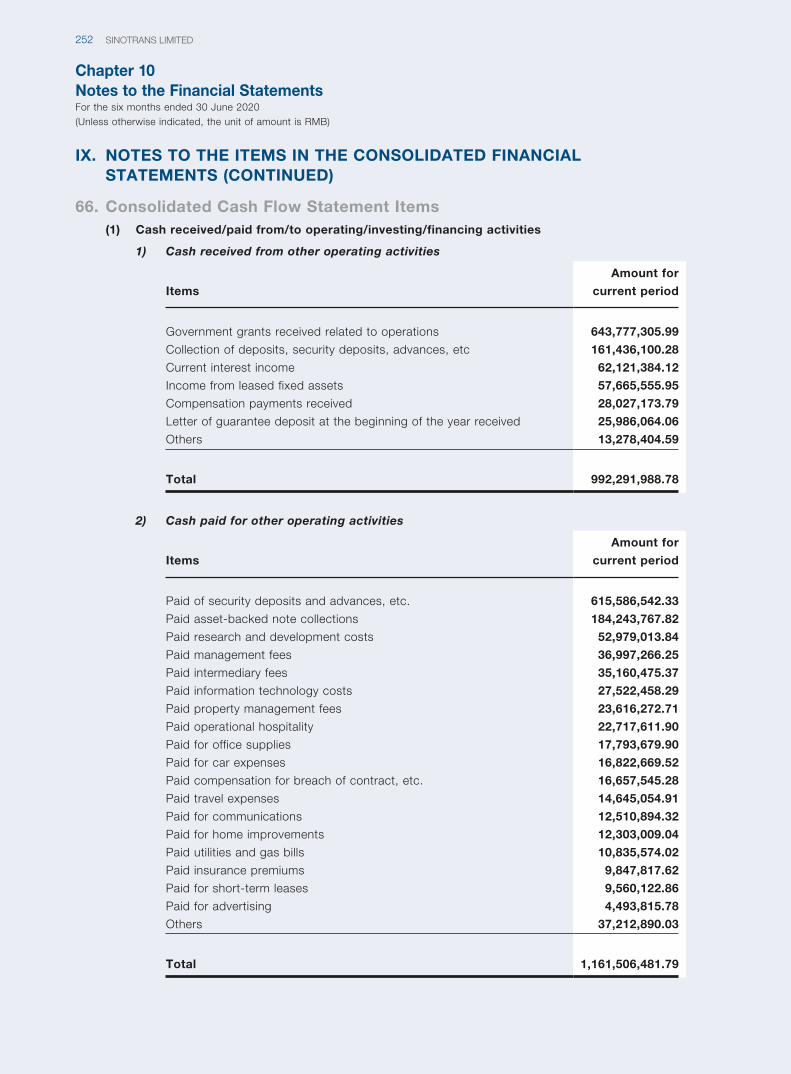
Chapter 10Notes to the Financial StatementsFor the six months ended 30 June 2020(Unless otherwise indicated, the unit of amount is RMB)
SINOTRANS LIMITED252
IX. NOTES TO THE ITEMS IN THE CONSOLIDATED FINANCIAL STATEMENTS (CONTINUED)
66. Consolidated Cash Flow Statement Items(1) Cash received/paid from/to operating/investing/financing activities
1) Cash received from other operating activities
Items
Amount for
current period
Government grants received related to operations 643,777,305.99
Collection of deposits, security deposits, advances, etc 161,436,100.28
Current interest income 62,121,384.12
Income from leased fixed assets 57,665,555.95
Compensation payments received 28,027,173.79
Letter of guarantee deposit at the beginning of the year received 25,986,064.06
Others 13,278,404.59
Total 992,291,988.78
2) Cash paid for other operating activities
Items
Amount for
current period
Paid of security deposits and advances, etc. 615,586,542.33
Paid asset-backed note collections 184,243,767.82
Paid research and development costs 52,979,013.84
Paid management fees 36,997,266.25
Paid intermediary fees 35,160,475.37
Paid information technology costs 27,522,458.29
Paid property management fees 23,616,272.71
Paid operational hospitality 22,717,611.90
Paid for office supplies 17,793,679.90
Paid for car expenses 16,822,669.52
Paid compensation for breach of contract, etc. 16,657,545.28
Paid travel expenses 14,645,054.91
Paid for communications 12,510,894.32
Paid for home improvements 12,303,009.04
Paid utilities and gas bills 10,835,574.02
Paid insurance premiums 9,847,817.62
Paid for short-term leases 9,560,122.86
Paid for advertising 4,493,815.78
Others 37,212,890.03
Total 1,161,506,481.79
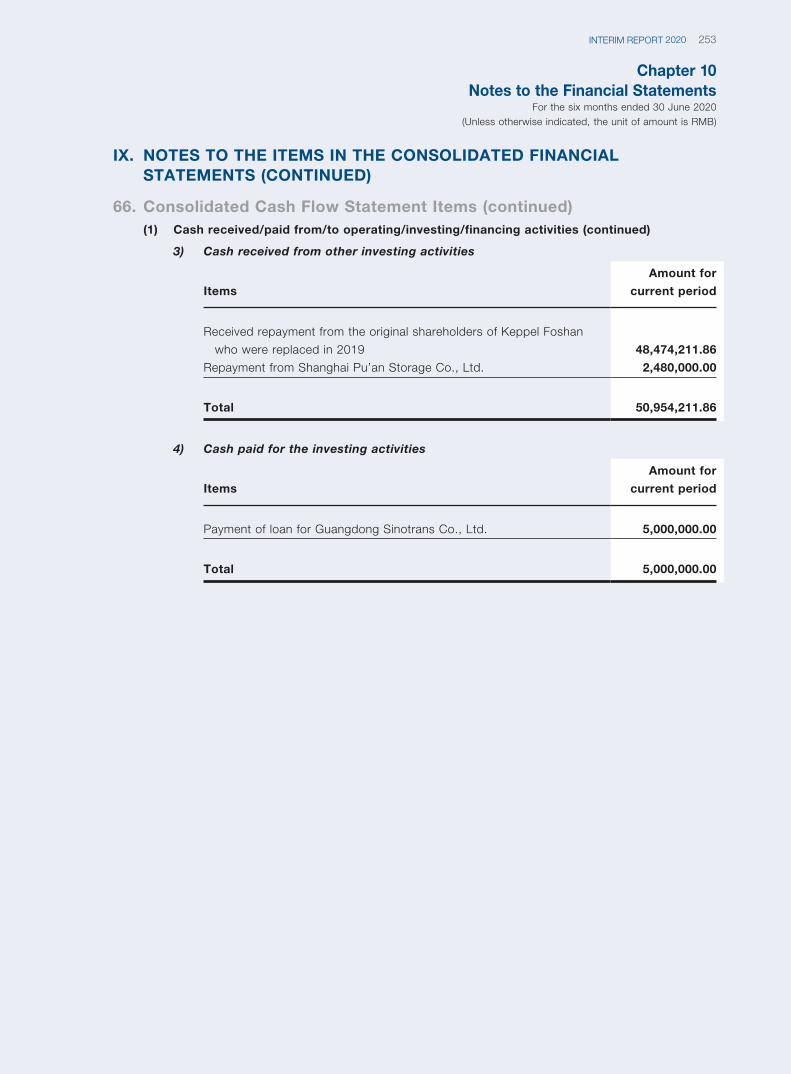
Chapter 10Notes to the Financial Statements
For the six months ended 30 June 2020(Unless otherwise indicated, the unit of amount is RMB)
253INTERIM REPORT 2020
IX. NOTES TO THE ITEMS IN THE CONSOLIDATED FINANCIAL STATEMENTS (CONTINUED)
66. Consolidated Cash Flow Statement Items (continued)(1) Cash received/paid from/to operating/investing/financing activities (continued)
3) Cash received from other investing activities
Items
Amount for
current period
Received repayment from the original shareholders of Keppel Foshan
who were replaced in 2019 48,474,211.86
Repayment from Shanghai Pu’an Storage Co., Ltd. 2,480,000.00
Total 50,954,211.86
4) Cash paid for the investing activities
Items
Amount for
current period
Payment of loan for Guangdong Sinotrans Co., Ltd. 5,000,000.00
Total 5,000,000.00
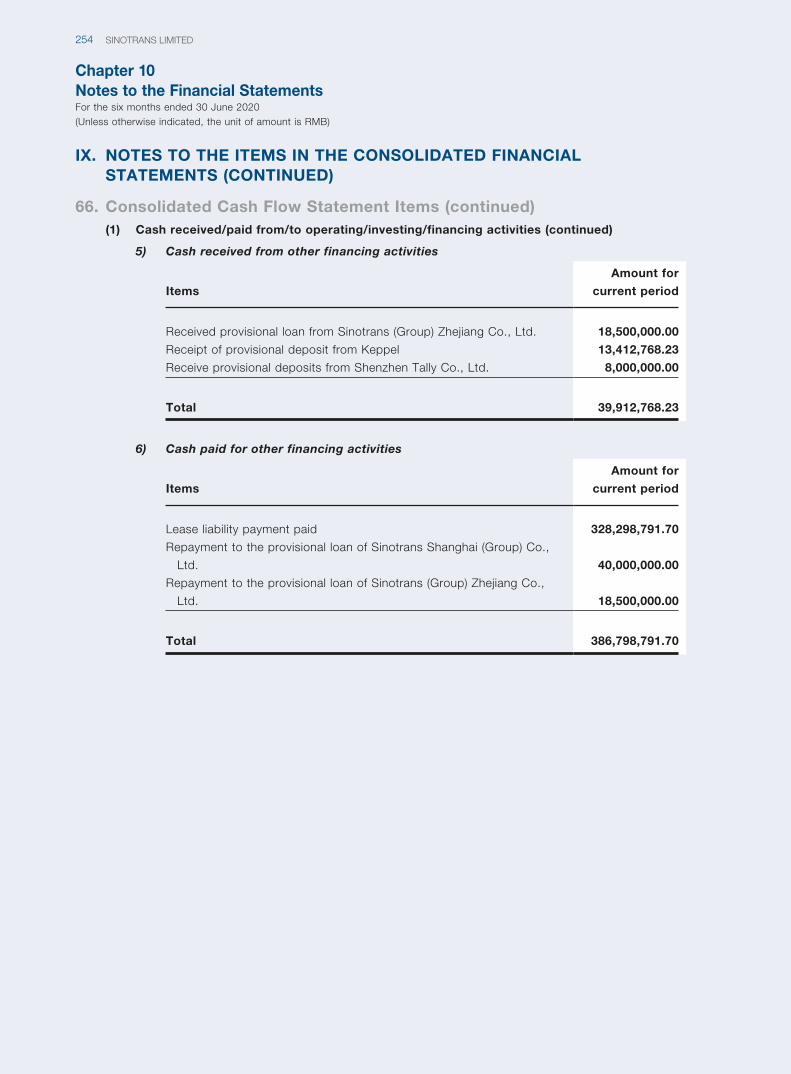
Chapter 10Notes to the Financial StatementsFor the six months ended 30 June 2020(Unless otherwise indicated, the unit of amount is RMB)
SINOTRANS LIMITED254
IX. NOTES TO THE ITEMS IN THE CONSOLIDATED FINANCIAL STATEMENTS (CONTINUED)
66. Consolidated Cash Flow Statement Items (continued)(1) Cash received/paid from/to operating/investing/financing activities (continued)
5) Cash received from other financing activities
Items
Amount for
current period
Received provisional loan from Sinotrans (Group) Zhejiang Co., Ltd. 18,500,000.00
Receipt of provisional deposit from Keppel 13,412,768.23
Receive provisional deposits from Shenzhen Tally Co., Ltd. 8,000,000.00
Total 39,912,768.23
6) Cash paid for other financing activities
Items
Amount for
current period
Lease liability payment paid 328,298,791.70
Repayment to the provisional loan of Sinotrans Shanghai (Group) Co.,
Ltd. 40,000,000.00
Repayment to the provisional loan of Sinotrans (Group) Zhejiang Co.,
Ltd. 18,500,000.00
Total 386,798,791.70
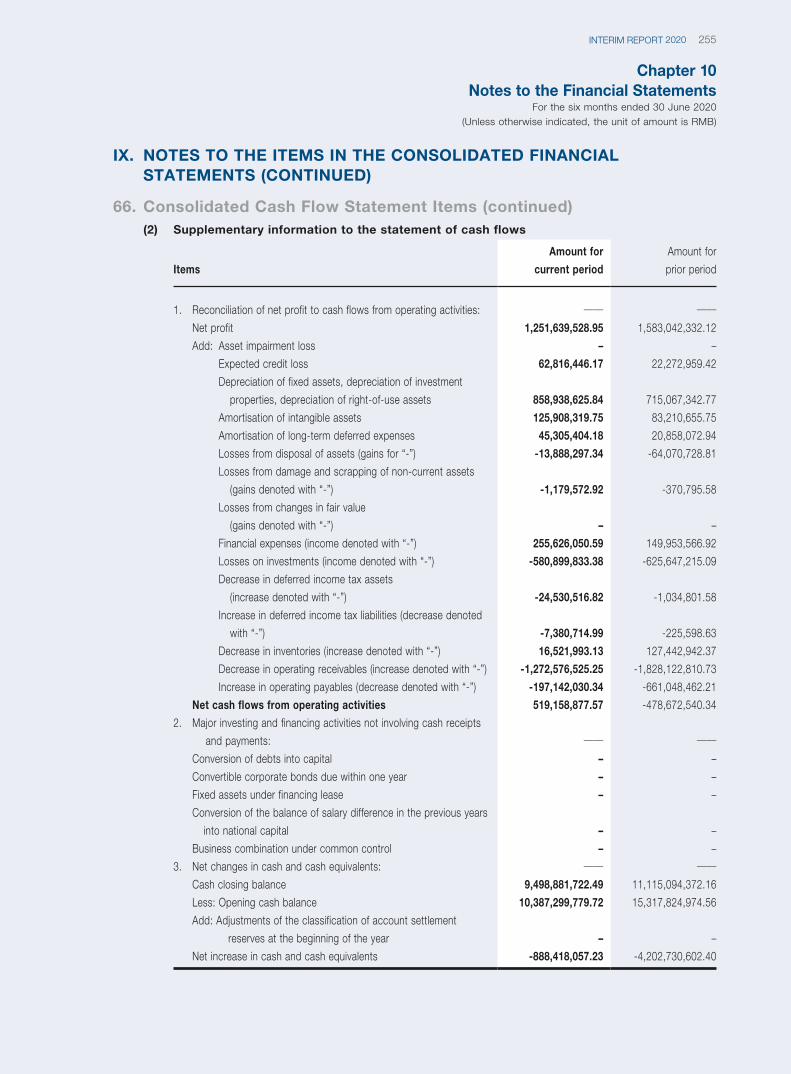
Chapter 10Notes to the Financial Statements
For the six months ended 30 June 2020(Unless otherwise indicated, the unit of amount is RMB)
255INTERIM REPORT 2020
IX. NOTES TO THE ITEMS IN THE CONSOLIDATED FINANCIAL STATEMENTS (CONTINUED)
66. Consolidated Cash Flow Statement Items (continued)(2) Supplementary information to the statement of cash flows
Items
Amount for
current period
Amount for
prior period
1. Re conciliation of net profit to cash flows from operating activities: —— ——Net profit 1,251,639,528.95 1,583,042,332.12
Add: Asset impairment loss – –
Expected credit loss 62,816,446.17 22,272,959.42
Depreciation of fixed assets, depreciation of investment
properties, depreciation of right-of-use assets 858,938,625.84 715,067,342.77
Amortisation of intangible assets 125,908,319.75 83,210,655.75
Amortisation of long-term deferred expenses 45,305,404.18 20,858,072.94
Losses from disposal of assets (gains for “-”) -13,888,297.34 -64,070,728.81
Losses from damage and scrapping of non-current assets
(gains denoted with “-”) -1,179,572.92 -370,795.58
Losses from changes in fair value
(gains denoted with “-”) – –
Financial expenses (income denoted with “-”) 255,626,050.59 149,953,566.92
Losses on investments (income denoted with “-”) -580,899,833.38 -625,647,215.09
Decrease in deferred income tax assets
(increase denoted with “-”) -24,530,516.82 -1,034,801.58
Increase in deferred income tax liabilities (decrease denoted
with “-”) -7,380,714.99 -225,598.63
Decrease in inventories (increase denoted with “-”) 16,521,993.13 127,442,942.37
Decrease in operating receivables (increase denoted with “-”) -1,272,576,525.25 -1,828,122,810.73
Increase in operating payables (decrease denoted with “-”) -197,142,030.34 -661,048,462.21
Net cash flows from operating activities 519,158,877.57 -478,672,540.34
2. Ma jor investing and financing activities not involving cash receipts
and payments: —— ——Conversion of debts into capital – –
Convertible corporate bonds due within one year – –
Fixed assets under financing lease – –
Conversion of the balance of salary difference in the previous years
into national capital – –
Business combination under common control – –
3. Net changes in cash and cash equivalents: —— ——Cash closing balance 9,498,881,722.49 11,115,094,372.16
Less: Opening cash balance 10,387,299,779.72 15,317,824,974.56
Add: Ad justments of the classification of account settlement
reserves at the beginning of the year – –
Net increase in cash and cash equivalents -888,418,057.23 -4,202,730,602.40
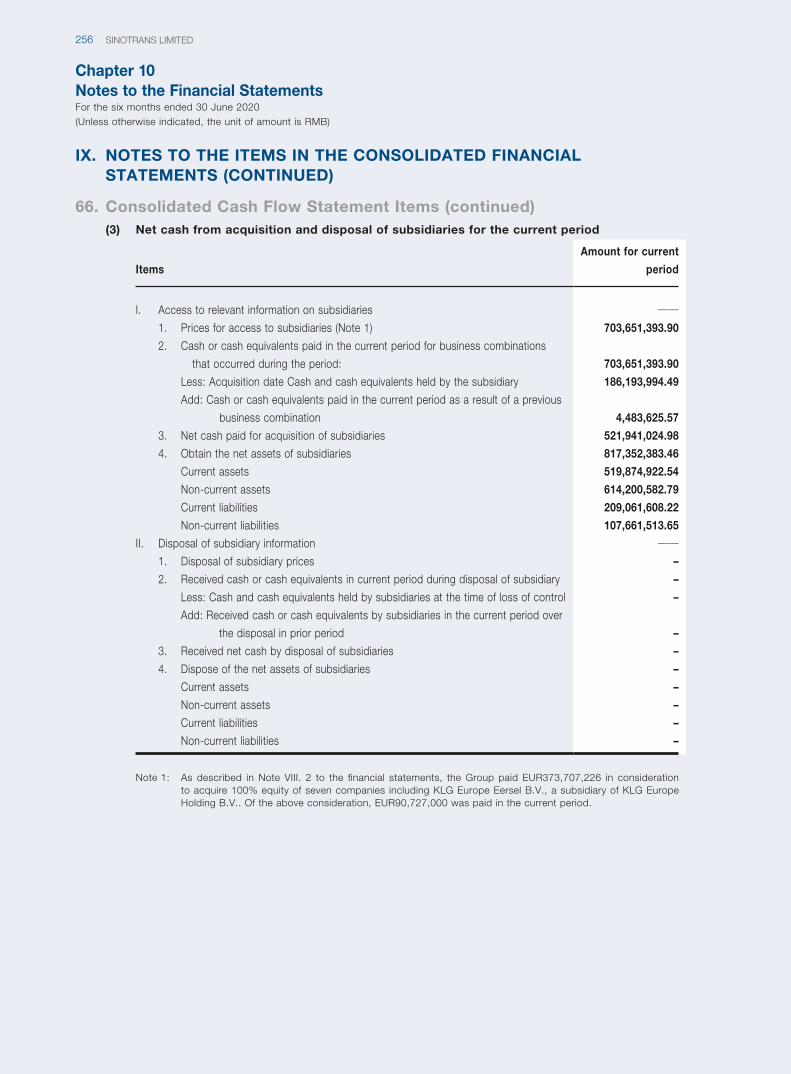
Chapter 10Notes to the Financial StatementsFor the six months ended 30 June 2020(Unless otherwise indicated, the unit of amount is RMB)
SINOTRANS LIMITED256
IX. NOTES TO THE ITEMS IN THE CONSOLIDATED FINANCIAL STATEMENTS (CONTINUED)
66. Consolidated Cash Flow Statement Items (continued)(3) Net cash from acquisition and disposal of subsidiaries for the current period
Items
Amount for current
period
I. Access to relevant information on subsidiaries ——1. Prices for access to subsidiaries (Note 1) 703,651,393.90
2. Cash or cash equivalents paid in the current period for business combinations
that occurred during the period: 703,651,393.90
Less: Ac quisition date Cash and cash equivalents held by the subsidiary 186,193,994.49
Add: Ca sh or cash equivalents paid in the current period as a result of a previous
business combination 4,483,625.57
3. Net cash paid for acquisition of subsidiaries 521,941,024.98
4. Obtain the net assets of subsidiaries 817,352,383.46
Current assets 519,874,922.54
Non-current assets 614,200,582.79
Current liabilities 209,061,608.22
Non-current liabilities 107,661,513.65
II. Disposal of subsidiary information ——1. Disposal of subsidiary prices –
2. Received cash or cash equivalents in current period during disposal of subsidiary –
Less: Ca sh and cash equivalents held by subsidiaries at the time of loss of control –
Add: Re ceived cash or cash equivalents by subsidiaries in the current period over
the disposal in prior period –
3. Received net cash by disposal of subsidiaries –
4. Dispose of the net assets of subsidiaries –
Current assets –
Non-current assets –
Current liabilities –
Non-current liabilities –
Note 1: As described in Note VIII. 2 to the financial statements, the Group paid EUR373,707,226 in consideration to acquire 100% equity of seven companies including KLG Europe Eersel B.V., a subsidiary of KLG Europe Holding B.V.. Of the above consideration, EUR90,727,000 was paid in the current period.
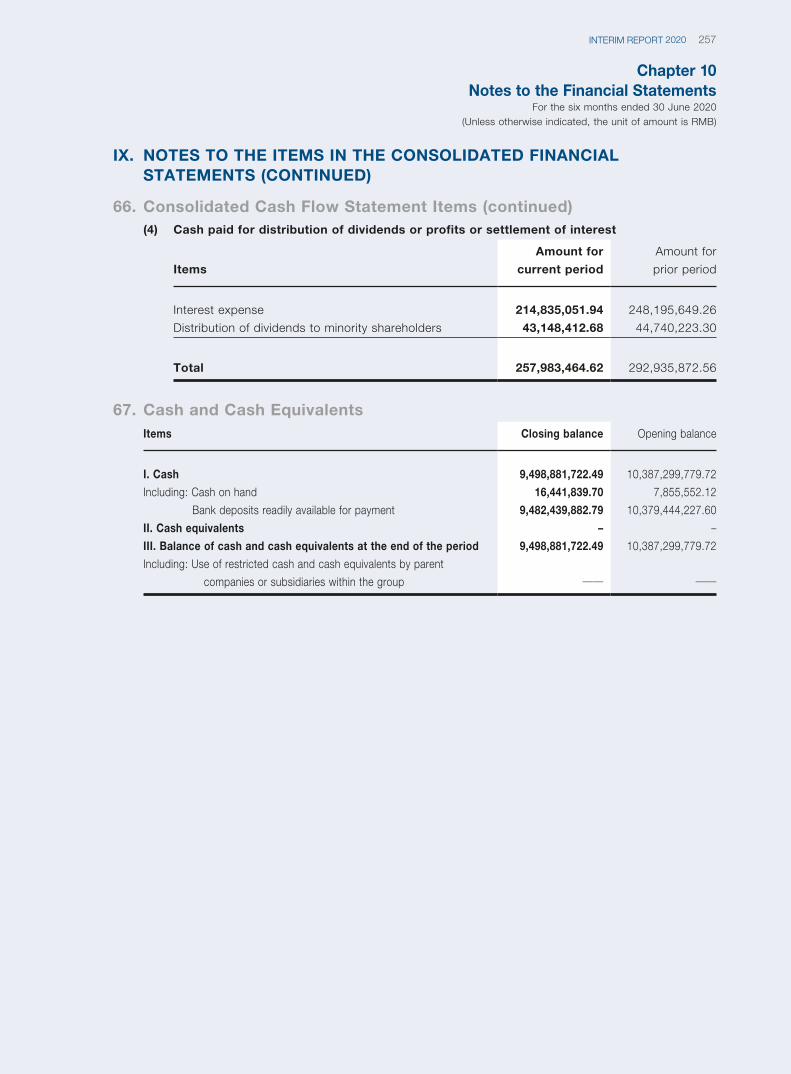
Chapter 10Notes to the Financial Statements
For the six months ended 30 June 2020(Unless otherwise indicated, the unit of amount is RMB)
257INTERIM REPORT 2020
IX. NOTES TO THE ITEMS IN THE CONSOLIDATED FINANCIAL STATEMENTS (CONTINUED)
66. Consolidated Cash Flow Statement Items (continued)(4) Cash paid for distribution of dividends or profits or settlement of interest
Items
Amount for
current period
Amount for
prior period
Interest expense 214,835,051.94 248,195,649.26
Distribution of dividends to minority shareholders 43,148,412.68 44,740,223.30
Total 257,983,464.62 292,935,872.56
67. Cash and Cash EquivalentsItems Closing balance Opening balance
I. Cash 9,498,881,722.49 10,387,299,779.72
Including: Cash on hand 16,441,839.70 7,855,552.12
Bank deposits readily available for payment 9,482,439,882.79 10,379,444,227.60
II. Cash equivalents – –
III. Ba lance of cash and cash equivalents at the end of the period 9,498,881,722.49 10,387,299,779.72
Including: Us e of restricted cash and cash equivalents by parent
companies or subsidiaries within the group —— ——
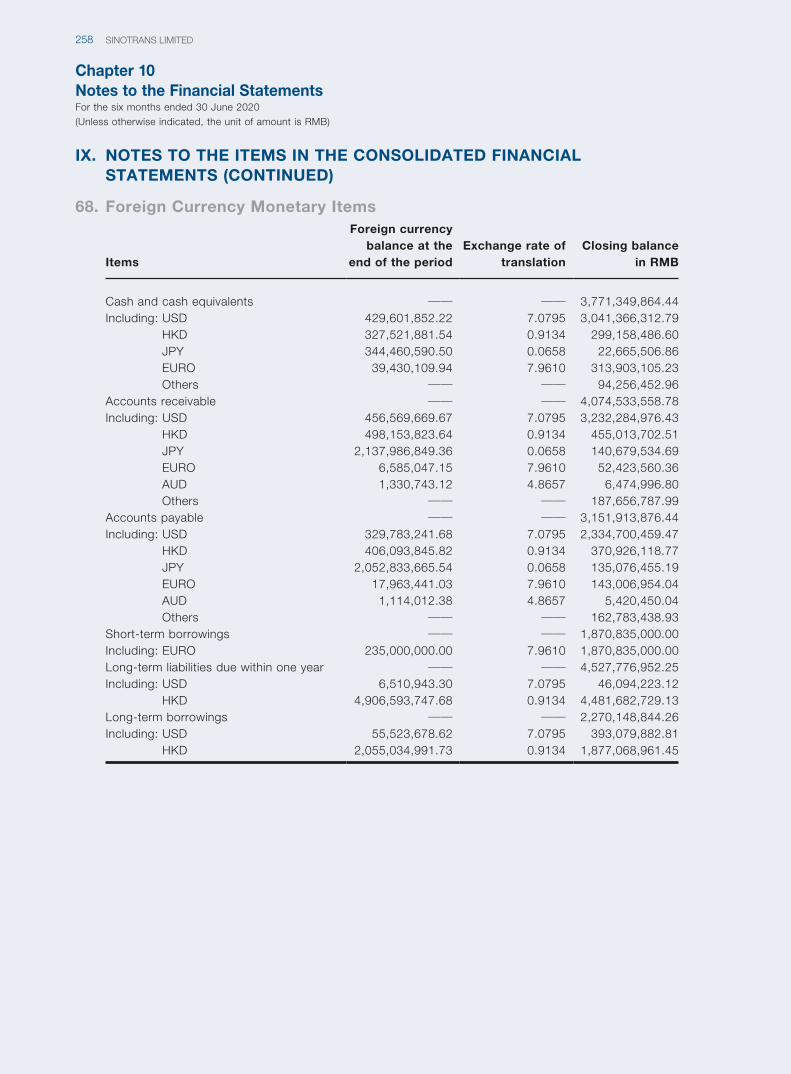
Chapter 10Notes to the Financial StatementsFor the six months ended 30 June 2020(Unless otherwise indicated, the unit of amount is RMB)
SINOTRANS LIMITED258
IX. NOTES TO THE ITEMS IN THE CONSOLIDATED FINANCIAL STATEMENTS (CONTINUED)
68. Foreign Currency Monetary Items
Items
Foreign currency balance at the
end of the periodExchange rate of
translationClosing balance
in RMB
Cash and cash equivalents —— —— 3,771,349,864.44Including: USD 429,601,852.22 7.0795 3,041,366,312.79
HKD 327,521,881.54 0.9134 299,158,486.60JPY 344,460,590.50 0.0658 22,665,506.86EURO 39,430,109.94 7.9610 313,903,105.23Others —— —— 94,256,452.96
Accounts receivable —— —— 4,074,533,558.78Including: USD 456,569,669.67 7.0795 3,232,284,976.43
HKD 498,153,823.64 0.9134 455,013,702.51JPY 2,137,986,849.36 0.0658 140,679,534.69EURO 6,585,047.15 7.9610 52,423,560.36AUD 1,330,743.12 4.8657 6,474,996.80Others —— —— 187,656,787.99
Accounts payable —— —— 3,151,913,876.44Including: USD 329,783,241.68 7.0795 2,334,700,459.47
HKD 406,093,845.82 0.9134 370,926,118.77JPY 2,052,833,665.54 0.0658 135,076,455.19EURO 17,963,441.03 7.9610 143,006,954.04AUD 1,114,012.38 4.8657 5,420,450.04Others —— —— 162,783,438.93
Short-term borrowings —— —— 1,870,835,000.00Including: EURO 235,000,000.00 7.9610 1,870,835,000.00Long-term liabilities due within one year —— —— 4,527,776,952.25Including: USD 6,510,943.30 7.0795 46,094,223.12
HKD 4,906,593,747.68 0.9134 4,481,682,729.13Long-term borrowings —— —— 2,270,148,844.26Including: USD 55,523,678.62 7.0795 393,079,882.81
HKD 2,055,034,991.73 0.9134 1,877,068,961.45
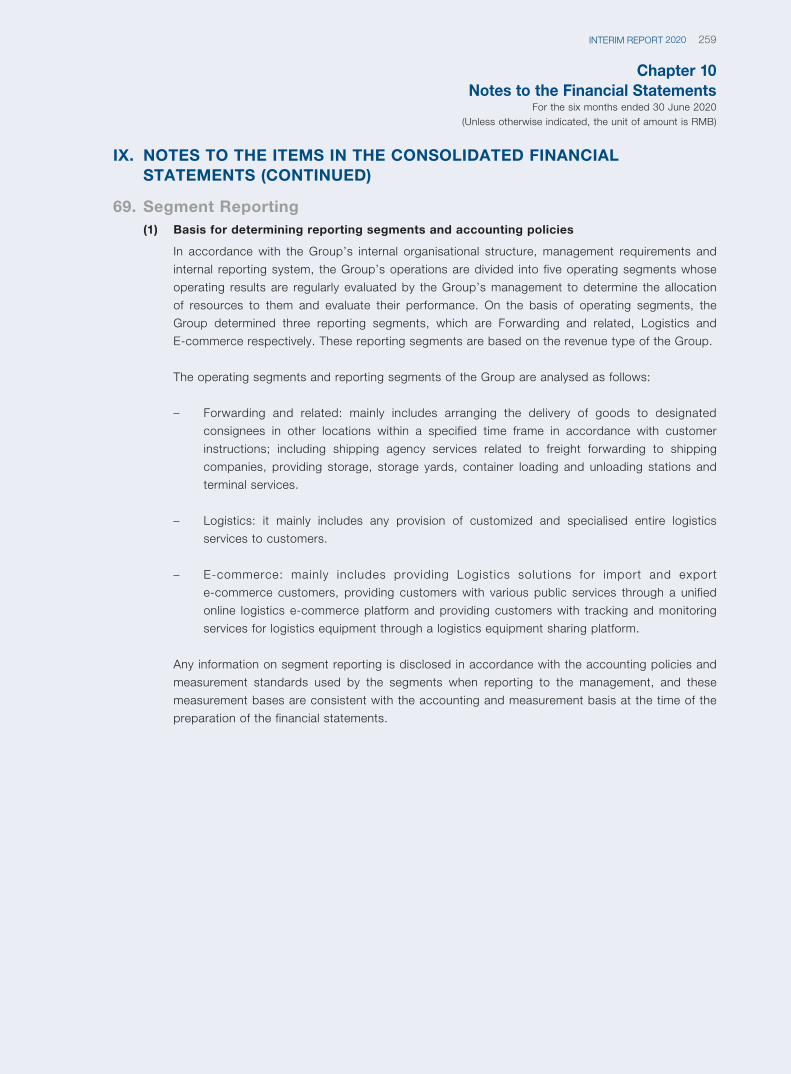
Chapter 10Notes to the Financial Statements
For the six months ended 30 June 2020(Unless otherwise indicated, the unit of amount is RMB)
259INTERIM REPORT 2020
IX. NOTES TO THE ITEMS IN THE CONSOLIDATED FINANCIAL STATEMENTS (CONTINUED)
69. Segment Reporting(1) Basis for determining reporting segments and accounting policies
In accordance with the Group’s internal organisational structure, management requirements and
internal reporting system, the Group’s operations are divided into five operating segments whose
operating results are regularly evaluated by the Group’s management to determine the allocation
of resources to them and evaluate their performance. On the basis of operating segments, the
Group determined three reporting segments, which are Forwarding and related, Logistics and
E-commerce respectively. These reporting segments are based on the revenue type of the Group.
The operating segments and reporting segments of the Group are analysed as follows:
– Forwarding and related: mainly includes arranging the delivery of goods to designated
consignees in other locations within a specified time frame in accordance with customer
instructions; including shipping agency services related to freight forwarding to shipping
companies, providing storage, storage yards, container loading and unloading stations and
terminal services.
– Logistics: it mainly includes any provision of customized and specialised entire logistics
services to customers.
– E-commerce: mainly includes providing Logistics solutions for import and export
e-commerce customers, providing customers with various public services through a unified
online logistics e-commerce platform and providing customers with tracking and monitoring
services for logistics equipment through a logistics equipment sharing platform.
Any information on segment reporting is disclosed in accordance with the accounting policies and
measurement standards used by the segments when reporting to the management, and these
measurement bases are consistent with the accounting and measurement basis at the time of the
preparation of the financial statements.
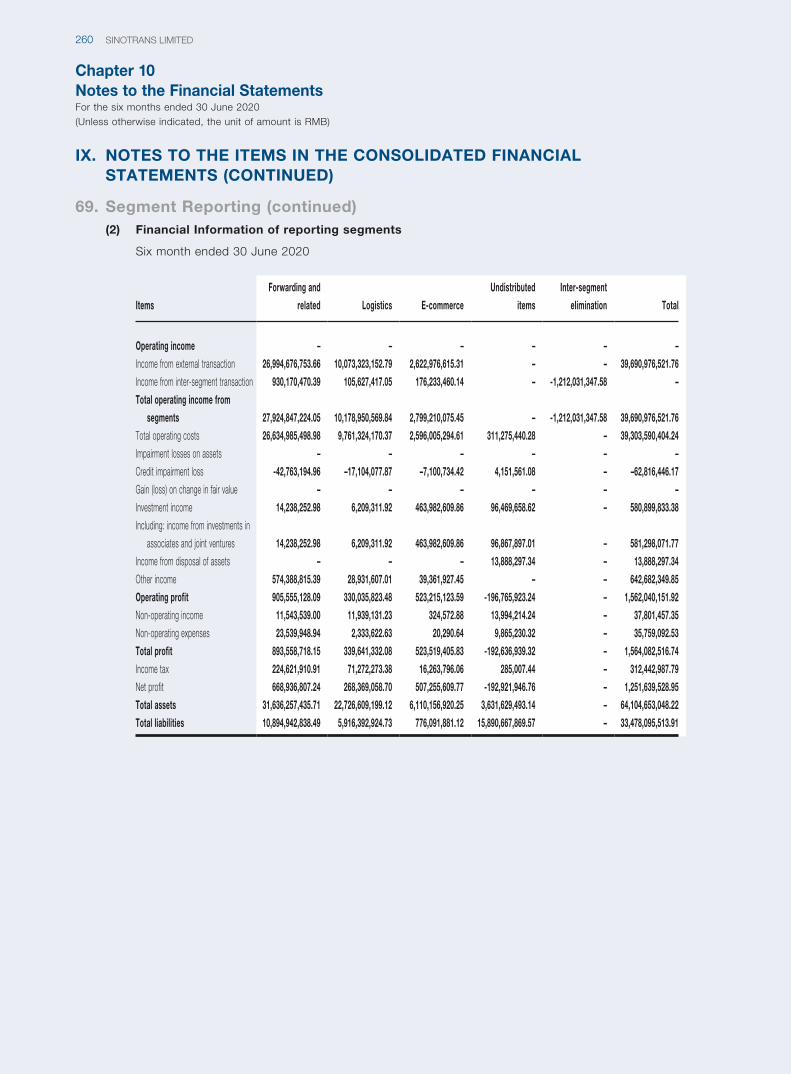
Chapter 10Notes to the Financial StatementsFor the six months ended 30 June 2020(Unless otherwise indicated, the unit of amount is RMB)
SINOTRANS LIMITED260
IX. NOTES TO THE ITEMS IN THE CONSOLIDATED FINANCIAL STATEMENTS (CONTINUED)
69. Segment Reporting (continued)(2) Financial Information of reporting segments
Six month ended 30 June 2020
Items
Forwarding and
related Logistics E-commerce
Undistributed
items
Inter-segment
elimination Total
Operating income – – – – – –
Income from external transaction 26,994,676,753.66 10,073,323,152.79 2,622,976,615.31 – – 39,690,976,521.76
Income from inter-segment transaction 930,170,470.39 105,627,417.05 176,233,460.14 – -1,212,031,347.58 –
Total operating income from
segments 27,924,847,224.05 10,178,950,569.84 2,799,210,075.45 – -1,212,031,347.58 39,690,976,521.76
Total operating costs 26,634,985,498.98 9,761,324,170.37 2,596,005,294.61 311,275,440.28 – 39,303,590,404.24
Impairment losses on assets – – – – – –
Credit impairment loss -42,763,194.96 –17,104,077.87 –7,100,734.42 4,151,561.08 – –62,816,446.17
Gain (loss) on change in fair value – – – – – –
Investment income 14,238,252.98 6,209,311.92 463,982,609.86 96,469,658.62 – 580,899,833.38
Including: income from investments in
associates and joint ventures 14,238,252.98 6,209,311.92 463,982,609.86 96,867,897.01 – 581,298,071.77
Income from disposal of assets – – – 13,888,297.34 – 13,888,297.34
Other income 574,388,815.39 28,931,607.01 39,361,927.45 – – 642,682,349.85
Operating profit 905,555,128.09 330,035,823.48 523,215,123.59 -196,765,923.24 – 1,562,040,151.92
Non-operating income 11,543,539.00 11,939,131.23 324,572.88 13,994,214.24 – 37,801,457.35
Non-operating expenses 23,539,948.94 2,333,622.63 20,290.64 9,865,230.32 – 35,759,092.53
Total profit 893,558,718.15 339,641,332.08 523,519,405.83 -192,636,939.32 – 1,564,082,516.74
Income tax 224,621,910.91 71,272,273.38 16,263,796.06 285,007.44 – 312,442,987.79
Net profit 668,936,807.24 268,369,058.70 507,255,609.77 -192,921,946.76 – 1,251,639,528.95
Total assets 31,636,257,435.71 22,726,609,199.12 6,110,156,920.25 3,631,629,493.14 – 64,104,653,048.22
Total liabilities 10,894,942,838.49 5,916,392,924.73 776,091,881.12 15,890,667,869.57 – 33,478,095,513.91

Chapter 10Notes to the Financial Statements
For the six months ended 30 June 2020(Unless otherwise indicated, the unit of amount is RMB)
261INTERIM REPORT 2020
IX. NOTES TO THE ITEMS IN THE CONSOLIDATED FINANCIAL STATEMENTS (CONTINUED)
69. Segment Reporting (continued)(2) Financial Information of reporting segments (continued)
Six month ended 30 June 2019
Items
Forwarding and
related Logistics E-commerce Undistributed items
Inter-segment
elimination Total
Operating income – – – – – –
Income from external transaction 26,228,797,800.28 9,934,370,091.66 1,557,415,190.19 – – 37,720,583,082.13
Income from inter-segment
transaction 760,772,656.47 117,102,097.45 124,910,274.54 – -1,002,785,028.46 –
Total operating income from
segments 26,989,570,456.75 10,051,472,189.11 1,682,325,464.73 – -1,002,785,028.46 37,720,583,082.13
Total operating costs 25,789,020,021.44 9,560,929,972.93 1,537,340,227.56 221,561,527.70 – 37,108,851,749.63
Impairment losses on assets – – – – – –
Credit impairment loss -30,939,004.74 3,262,625.02 184,010.25 5,219,410.05 – –22,272,959.42
Gain (loss) on change in fair value – – – – – –
Investment income 23,913,140.11 1,696,572.98 492,582,623.18 107,454,878.82 – 625,647,215.09
Including: income from investments
in associates and joint ventures 23,913,140.11 1,696,572.98 492,582,623.18 74,804,434.60 – 592,996,770.87
Income from disposal of assets – – – 64,070,728.81 – 64,070,728.81
Other income 476,404,823.42 15,540,264.12 1,096,328.30 – – 493,041,415.84
Operating profit 909,156,737.63 393,939,580.85 513,937,924.36 -44,816,510.02 – 1,772,217,732.82
Non-operating income 15,182,822.24 30,626,856.06 177,750.15 8,320,354.17 – 54,307,782.62
Non-operating expenses 3,828,659.03 9,271,820.31 13,554.77 -3,989,290.46 – 9,124,743.65
Total profit 920,510,900.84 415,294,616.60 514,102,119.74 -32,506,865.39 – 1,817,400,771.79
Income tax 207,733,446.03 78,100,622.01 11,784,231.03 -63,259,859.40 – 234,358,439.67
Net profit 712,777,454.81 337,193,994.59 502,317,888.71 30,752,994.01 – 1,583,042,332.12
Total assets 28,839,412,783.51 24,557,221,205.02 5,350,568,127.63 2,362,049,902.98 – 61,109,252,019.14
Total liabilities 9,677,513,384.07 5,248,087,864.20 605,779,868.39 17,257,958,313.33 – 32,789,339,429.99
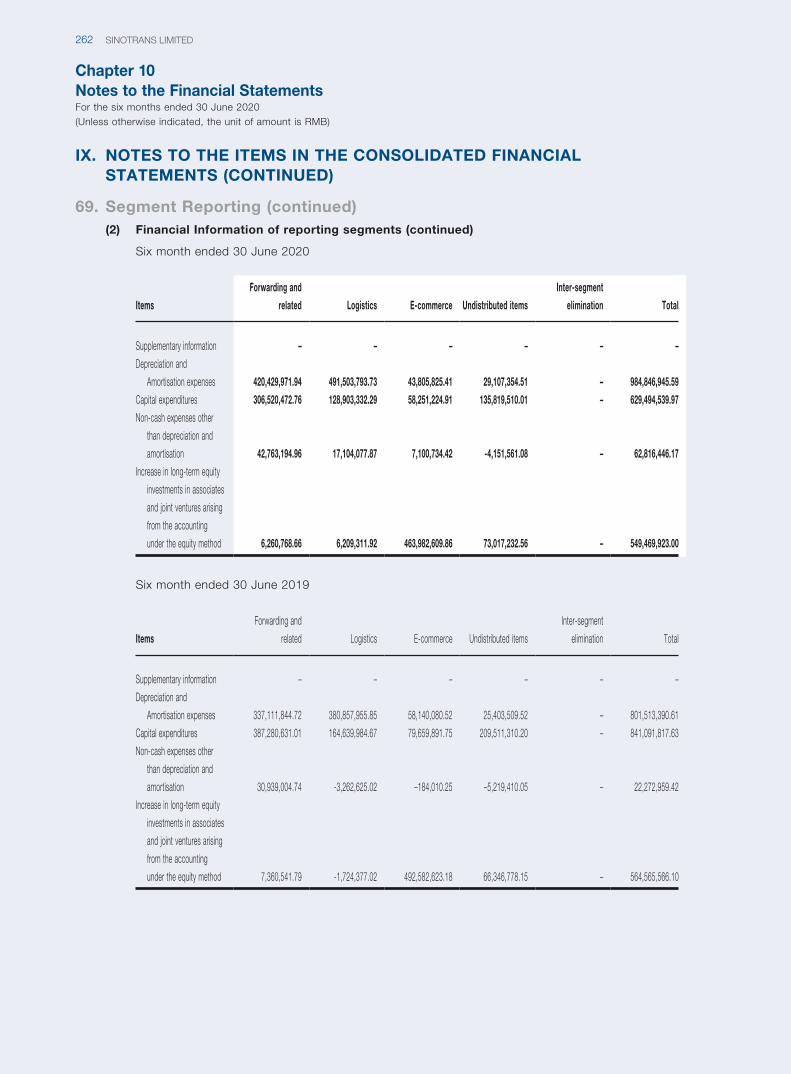
Chapter 10Notes to the Financial StatementsFor the six months ended 30 June 2020(Unless otherwise indicated, the unit of amount is RMB)
SINOTRANS LIMITED262
IX. NOTES TO THE ITEMS IN THE CONSOLIDATED FINANCIAL STATEMENTS (CONTINUED)
69. Segment Reporting (continued)(2) Financial Information of reporting segments (continued)
Six month ended 30 June 2020
Items
Forwarding and
related Logistics E-commerce Undistributed items
Inter-segment
elimination Total
Supplementary information – – – – – –
Depreciation and
Amortisation expenses 420,429,971.94 491,503,793.73 43,805,825.41 29,107,354.51 – 984,846,945.59
Capital expenditures 306,520,472.76 128,903,332.29 58,251,224.91 135,819,510.01 – 629,494,539.97
Non-cash expenses other
than depreciation and
amortisation 42,763,194.96 17,104,077.87 7,100,734.42 -4,151,561.08 – 62,816,446.17
Increase in long-term equity
investments in associates
and joint ventures arising
from the accounting
under the equity method 6,260,768.66 6,209,311.92 463,982,609.86 73,017,232.56 – 549,469,923.00
Six month ended 30 June 2019
Items
Forwarding and
related Logistics E-commerce Undistributed items
Inter-segment
elimination Total
Supplementary information – – – – – –
Depreciation and
Amortisation expenses 337,111,844.72 380,857,955.85 58,140,080.52 25,403,509.52 – 801,513,390.61
Capital expenditures 387,280,631.01 164,639,984.67 79,659,891.75 209,511,310.20 – 841,091,817.63
Non-cash expenses other
than depreciation and
amortisation 30,939,004.74 -3,262,625.02 –184,010.25 –5,219,410.05 – 22,272,959.42
Increase in long-term equity
investments in associates
and joint ventures arising
from the accounting
under the equity method 7,360,541.79 -1,724,377.02 492,582,623.18 66,346,778.15 – 564,565,566.10

Chapter 10Notes to the Financial Statements
For the six months ended 30 June 2020(Unless otherwise indicated, the unit of amount is RMB)
263INTERIM REPORT 2020
X. RELATED-PARTY RELATIONSHIPS AND TRANSACTIONS
1. Related Parties With Control RelationshipsName of controlling
shareholders and the ultimate
controlling party
Place of
registration Business nature
Registered
capital
(RMB)
Proportion of
shareholding
(%)
Voting
proportion
(%)
China Merchants Co., Ltd. Beijing Conducting
transportation
undertaking and
etc.
RMB16,900
million
—— ——
2. Information on Subsidiaries is Provided in Note Viii.
3. The Main Related Parties that have Transactions with the Group but do not have a Control Relationship are as Follows:Names of related parties Nature
Sinotrans & CSC Another enterprise controlled by the same controlling
shareholder and the ultimate controlling party
Sinotrans Container Lines Co., Ltd. Another enterprise controlled by the same controlling
shareholder and the ultimate controlling party
SINOTRANS CONTAINER LINES (HONG
KONG) COMPANY LIMITED
Another enterprise controlled by the same controlling
shareholder and the ultimate controlling party
Sinotrans Sunny Express Co.,Ltd Another enterprise controlled by the same controlling
shareholder and the ultimate controlling party
China Merchants Holdings (Hong Kong) Co.,
Ltd.
Another enterprise controlled by the same controlling
shareholder and the ultimate controlling party
RED BRAVES FINANCE LTD. Another enterprise controlled by the same controlling
shareholder and the ultimate controlling party
Sinotrans Anhui Direct Storage and
Transportation Co., Ltd.
Another enterprise controlled by the same controlling
shareholder and the ultimate controlling party
Beijing Aocheng Wuhe Real Estate Co., Ltd. Another enterprise controlled by the same controlling
shareholder and the ultimate controlling party
Beijing Sinotrans Land Transportation Co., Ltd. Another enterprise controlled by the same controlling
shareholder and the ultimate controlling party
Beijing Sinotrans Automobile Transportation
Company
Another enterprise controlled by the same controlling
shareholder and the ultimate controlling party
Beijing Sinotrans Sanjianfang Warehouse Co.,
Ltd.
Another enterprise controlled by the same controlling
shareholder and the ultimate controlling party
Beijing Sinotrans Logistics Center Co., Ltd. Another enterprise controlled by the same controlling
shareholder and the ultimate controlling party
Dalian Port Jifa Logistics Co., Ltd. Another enterprise controlled by the same controlling
shareholder and the ultimate controlling party
Dalian Port Corporation Limited Another enterprise controlled by the same controlling
shareholder and the ultimate controlling party
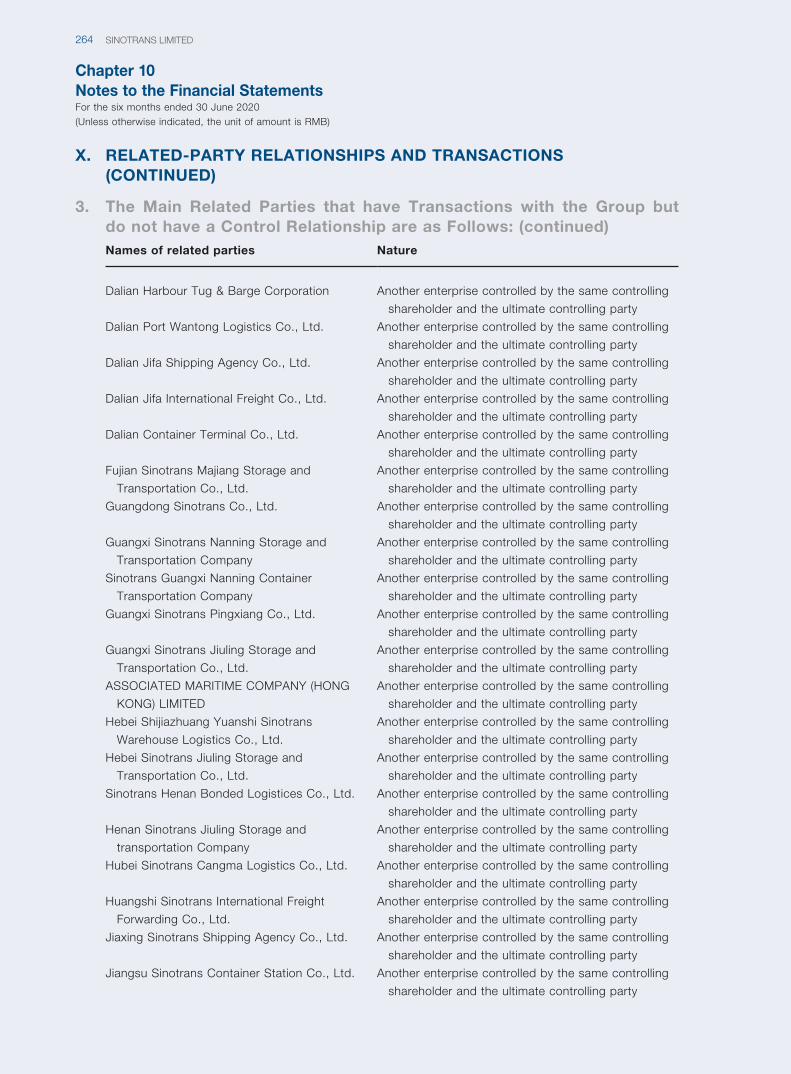
Chapter 10Notes to the Financial StatementsFor the six months ended 30 June 2020(Unless otherwise indicated, the unit of amount is RMB)
SINOTRANS LIMITED264
Names of related parties Nature
Dalian Harbour Tug & Barge Corporation Another enterprise controlled by the same controlling
shareholder and the ultimate controlling party
Dalian Port Wantong Logistics Co., Ltd. Another enterprise controlled by the same controlling
shareholder and the ultimate controlling party
Dalian Jifa Shipping Agency Co., Ltd. Another enterprise controlled by the same controlling
shareholder and the ultimate controlling party
Dalian Jifa International Freight Co., Ltd. Another enterprise controlled by the same controlling
shareholder and the ultimate controlling party
Dalian Container Terminal Co., Ltd. Another enterprise controlled by the same controlling
shareholder and the ultimate controlling party
Fujian Sinotrans Majiang Storage and
Transportation Co., Ltd.
Another enterprise controlled by the same controlling
shareholder and the ultimate controlling party
Guangdong Sinotrans Co., Ltd. Another enterprise controlled by the same controlling
shareholder and the ultimate controlling party
Guangxi Sinotrans Nanning Storage and
Transportation Company
Another enterprise controlled by the same controlling
shareholder and the ultimate controlling party
Sinotrans Guangxi Nanning Container
Transportation Company
Another enterprise controlled by the same controlling
shareholder and the ultimate controlling party
Guangxi Sinotrans Pingxiang Co., Ltd. Another enterprise controlled by the same controlling
shareholder and the ultimate controlling party
Guangxi Sinotrans Jiuling Storage and
Transportation Co., Ltd.
Another enterprise controlled by the same controlling
shareholder and the ultimate controlling party
ASSOCIATED MARITIME COMPANY (HONG
KONG) LIMITED
Another enterprise controlled by the same controlling
shareholder and the ultimate controlling party
Hebei Shijiazhuang Yuanshi Sinotrans
Warehouse Logistics Co., Ltd.
Another enterprise controlled by the same controlling
shareholder and the ultimate controlling party
Hebei Sinotrans Jiuling Storage and
Transportation Co., Ltd.
Another enterprise controlled by the same controlling
shareholder and the ultimate controlling party
Sinotrans Henan Bonded Logistices Co., Ltd. Another enterprise controlled by the same controlling
shareholder and the ultimate controlling party
Henan Sinotrans Jiuling Storage and
transportation Company
Another enterprise controlled by the same controlling
shareholder and the ultimate controlling party
Hubei Sinotrans Cangma Logistics Co., Ltd. Another enterprise controlled by the same controlling
shareholder and the ultimate controlling party
Huangshi Sinotrans International Freight
Forwarding Co., Ltd.
Another enterprise controlled by the same controlling
shareholder and the ultimate controlling party
Jiaxing Sinotrans Shipping Agency Co., Ltd. Another enterprise controlled by the same controlling
shareholder and the ultimate controlling party
Jiangsu Sinotrans Container Station Co., Ltd. Another enterprise controlled by the same controlling
shareholder and the ultimate controlling party
X. RELATED-PARTY RELATIONSHIPS AND TRANSACTIONS (CONTINUED)
3. The Main Related Parties that have Transactions with the Group but do not have a Control Relationship are as Follows: (continued)
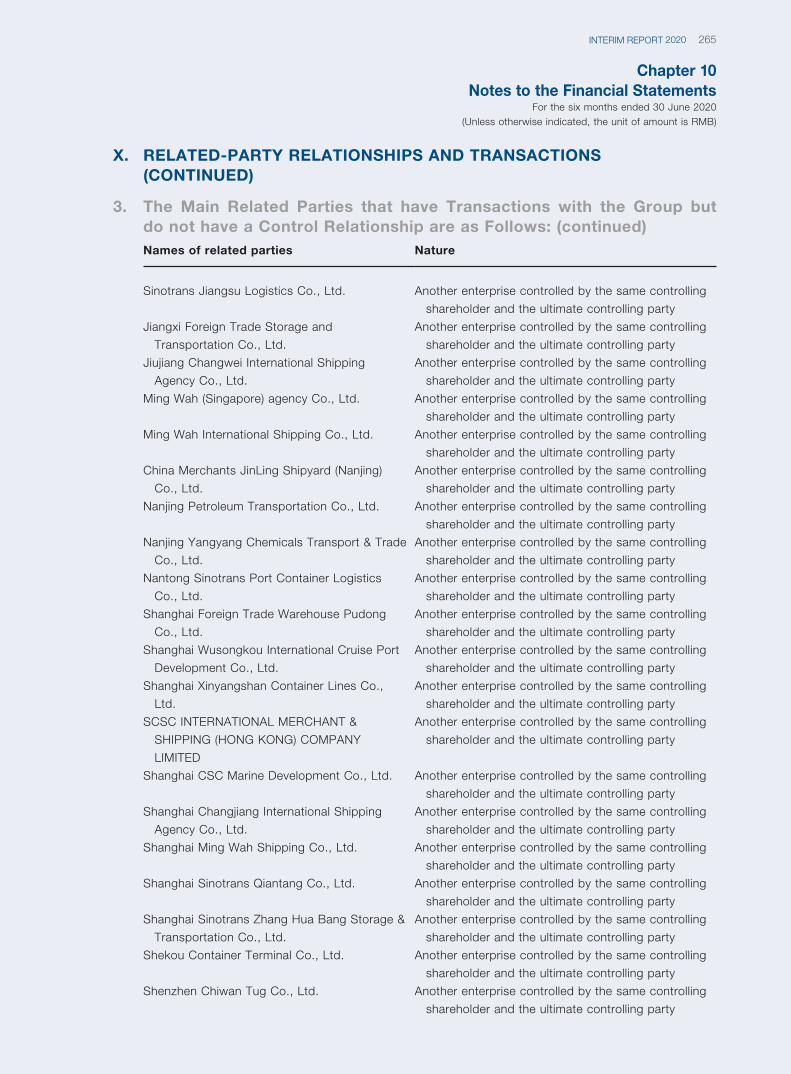
Chapter 10Notes to the Financial Statements
For the six months ended 30 June 2020(Unless otherwise indicated, the unit of amount is RMB)
265INTERIM REPORT 2020
Names of related parties Nature
Sinotrans Jiangsu Logistics Co., Ltd. Another enterprise controlled by the same controlling
shareholder and the ultimate controlling party
Jiangxi Foreign Trade Storage and
Transportation Co., Ltd.
Another enterprise controlled by the same controlling
shareholder and the ultimate controlling party
Jiujiang Changwei International Shipping
Agency Co., Ltd.
Another enterprise controlled by the same controlling
shareholder and the ultimate controlling party
Ming Wah (Singapore) agency Co., Ltd. Another enterprise controlled by the same controlling
shareholder and the ultimate controlling party
Ming Wah International Shipping Co., Ltd. Another enterprise controlled by the same controlling
shareholder and the ultimate controlling party
China Merchants JinLing Shipyard (Nanjing)
Co., Ltd.
Another enterprise controlled by the same controlling
shareholder and the ultimate controlling party
Nanjing Petroleum Transportation Co., Ltd. Another enterprise controlled by the same controlling
shareholder and the ultimate controlling party
Nanjing Yangyang Chemicals Transport & Trade
Co., Ltd.
Another enterprise controlled by the same controlling
shareholder and the ultimate controlling party
Nantong Sinotrans Port Container Logistics
Co., Ltd.
Another enterprise controlled by the same controlling
shareholder and the ultimate controlling party
Shanghai Foreign Trade Warehouse Pudong
Co., Ltd.
Another enterprise controlled by the same controlling
shareholder and the ultimate controlling party
Shanghai Wusongkou International Cruise Port
Development Co., Ltd.
Another enterprise controlled by the same controlling
shareholder and the ultimate controlling party
Shanghai Xinyangshan Container Lines Co.,
Ltd.
Another enterprise controlled by the same controlling
shareholder and the ultimate controlling party
SCSC INTERNATIONAL MERCHANT &
SHIPPING (HONG KONG) COMPANY
LIMITED
Another enterprise controlled by the same controlling
shareholder and the ultimate controlling party
Shanghai CSC Marine Development Co., Ltd. Another enterprise controlled by the same controlling
shareholder and the ultimate controlling party
Shanghai Changjiang International Shipping
Agency Co., Ltd.
Another enterprise controlled by the same controlling
shareholder and the ultimate controlling party
Shanghai Ming Wah Shipping Co., Ltd. Another enterprise controlled by the same controlling
shareholder and the ultimate controlling party
Shanghai Sinotrans Qiantang Co., Ltd. Another enterprise controlled by the same controlling
shareholder and the ultimate controlling party
Shanghai Sinotrans Zhang Hua Bang Storage &
Transportation Co., Ltd.
Another enterprise controlled by the same controlling
shareholder and the ultimate controlling party
Shekou Container Terminal Co., Ltd. Another enterprise controlled by the same controlling
shareholder and the ultimate controlling party
Shenzhen Chiwan Tug Co., Ltd. Another enterprise controlled by the same controlling
shareholder and the ultimate controlling party
X. RELATED-PARTY RELATIONSHIPS AND TRANSACTIONS (CONTINUED)
3. The Main Related Parties that have Transactions with the Group but do not have a Control Relationship are as Follows: (continued)
Chapter 10Notes to the Financial StatementsFor the six months ended 30 June 2020(Unless otherwise indicated, the unit of amount is RMB)
SINOTRANS LIMITED266
Names of related parties Nature
Shenzhen Lianda Tug Co., Ltd. Another enterprise controlled by the same controlling
shareholder and the ultimate controlling party
Shenzhen Nanyou (Holdings) Co., Ltd. Another enterprise controlled by the same controlling
shareholder and the ultimate controlling party
Shenzhen Shekou New Era Property
Management Co., Ltd.
Another enterprise controlled by the same controlling
shareholder and the ultimate controlling party
Shenzhen Xunlong Shipping Co., Ltd. Another enterprise controlled by the same controlling
shareholder and the ultimate controlling party
CSC Roro Logistics Co., Ltd. Another enterprise controlled by the same controlling
shareholder and the ultimate controlling party
Shenzhen Merchants Daojiahui Technology
Co., Ltd.
Another enterprise controlled by the same controlling
shareholder and the ultimate controlling party
Shenzhen Merchants Shekou International
Cruise Home Port Co., Ltd.
Another enterprise controlled by the same controlling
shareholder and the ultimate controlling party
Shenzhen Merchants Property Management
Co., Ltd.
Another enterprise controlled by the same controlling
shareholder and the ultimate controlling party
Sichuan Sinotrans Storage Service Co., Ltd. Another enterprise controlled by the same controlling
shareholder and the ultimate controlling party
Sinotrans Suzhou Storage Co., Ltd. Another enterprise controlled by the same controlling
shareholder and the ultimate controlling party
Tianjin Sinotrans Co., Ltd. Another enterprise controlled by the same controlling
shareholder and the ultimate controlling party
Wuxi Xihui Sinotrans Warehousing Co., Ltd. Another enterprise controlled by the same controlling
shareholder and the ultimate controlling party
Wuhan Changwei International Shipping
Industry Co., Ltd.
Another enterprise controlled by the same controlling
shareholder and the ultimate controlling party
Wuhan China Merchants Ro-Ro Transportation
Co., Ltd.
Another enterprise controlled by the same controlling
shareholder and the ultimate controlling party
Hong Kong Ming Wah Shipping Co., Ltd. Another enterprise controlled by the same controlling
shareholder and the ultimate controlling party
Yantai Anshun Automobile Transportation Co.,
Ltd.
Another enterprise controlled by the same controlling
shareholder and the ultimate controlling party
Sinotrans Yinchuan Inland Port Logistics Co.,
Ltd.
Another enterprise controlled by the same controlling
shareholder and the ultimate controlling party
Yingkou Gangrong Big Data Co., Ltd. Another enterprise controlled by the same controlling
shareholder and the ultimate controlling party
Far Rise Co., Ltd. Another enterprise controlled by the same controlling
shareholder and the ultimate controlling party
X. RELATED-PARTY RELATIONSHIPS AND TRANSACTIONS (CONTINUED)
3. The Main Related Parties that have Transactions with the Group but do not have a Control Relationship are as Follows: (continued)
Chapter 10Notes to the Financial Statements
For the six months ended 30 June 2020(Unless otherwise indicated, the unit of amount is RMB)
267INTERIM REPORT 2020
Names of related parties Nature
Singapore Changhang International Shipping
Limited
Another enterprise controlled by the same controlling
shareholder and the ultimate controlling party
CSC Bulk Shipping Co., Ltd. Another enterprise controlled by the same controlling
shareholder and the ultimate controlling party
Changjiang International Freight Forwarding
Co., Ltd.
Another enterprise controlled by the same controlling
shareholder and the ultimate controlling party
China Merchants Port Service (Shenzhen) Co.,
Ltd.
Another enterprise controlled by the same controlling
shareholder and the ultimate controlling party
China Merchants Bonded Logistics Co., Ltd. Another enterprise controlled by the same controlling
shareholder and the ultimate controlling party
China Merchants Godown, Wharf &
Transportation Co., Ltd.
Another enterprise controlled by the same controlling
shareholder and the ultimate controlling party
China Merchants International Terminal
(Qingdao) Company Ltd.
Another enterprise controlled by the same controlling
shareholder and the ultimate controlling party
China Merchants Container Services Limited Another enterprise controlled by the same controlling
shareholder and the ultimate controlling party
China Merchants Group Finance Co., Ltd. Another enterprise controlled by the same controlling
shareholder and the ultimate controlling party
China Merchants Jinling Shipyard (Weihai) Co.,
Ltd.
Another enterprise controlled by the same controlling
shareholder and the ultimate controlling party
Nanjing Tanker Corporation Another enterprise controlled by the same controlling
shareholder and the ultimate controlling party
China Merchants Investment Development Co.,
Ltd.
Another enterprise controlled by the same controlling
shareholder and the ultimate controlling party
China Merchants Property Management Co.,
Ltd.
Another enterprise controlled by the same controlling
shareholder and the ultimate controlling party
China Merchants Heavy Industry (Jiangsu) Co.,
Ltd.
Another enterprise controlled by the same controlling
shareholder and the ultimate controlling party
Zhejiang Youlian Shipbuilding Co., Ltd. Another enterprise controlled by the same controlling
shareholder and the ultimate controlling party
Zhengzhou China Merchants Logistics Co., Ltd. Another enterprise controlled by the same controlling
shareholder and the ultimate controlling party
Sinotrans Alashankou Company Another enterprise controlled by the same controlling
shareholder and the ultimate controlling party
Sinotrans Erlian Co., Ltd. Another enterprise controlled by the same controlling
shareholder and the ultimate controlling party
Sinotrans Gansu Co., Ltd. Another enterprise controlled by the same controlling
shareholder and the ultimate controlling party
Sinotrans Guangxi Company Another enterprise controlled by the same controlling
shareholder and the ultimate controlling party
X. RELATED-PARTY RELATIONSHIPS AND TRANSACTIONS (CONTINUED)
3. The Main Related Parties that have Transactions with the Group but do not have a Control Relationship are as Follows: (continued)
Chapter 10Notes to the Financial StatementsFor the six months ended 30 June 2020(Unless otherwise indicated, the unit of amount is RMB)
SINOTRANS LIMITED268
Names of related parties Nature
Sinotrans Hebei Tangshan Company Another enterprise controlled by the same controlling
shareholder and the ultimate controlling party
Sinotrans Hebei Co., Ltd. Another enterprise controlled by the same controlling
shareholder and the ultimate controlling party
Sinotrans Hubei Co., Ltd. Another enterprise controlled by the same controlling
shareholder and the ultimate controlling party
Sinotrans Jiangsu Group Corporation Another enterprise controlled by the same controlling
shareholder and the ultimate controlling party
Sinotrans Jiangxi Co., Ltd. Another enterprise controlled by the same controlling
shareholder and the ultimate controlling party
Sinotrans Liaoning Co., Ltd. Another enterprise controlled by the same controlling
shareholder and the ultimate controlling party
Changzhou Sinotrans Supply Chain
Management Co., Ltd.
Another enterprise controlled by the same controlling
shareholder and the ultimate controlling party
Sinotrans Shandong Co., Ltd. Another enterprise controlled by the same controlling
shareholder and the ultimate controlling party
Shanghai Foreign Trade Storage Jiefang Island
storage and Transportation Co., Ltd.
Another enterprise controlled by the same controlling
shareholder and the ultimate controlling party
Shanghai Sinotrans Anda Storage and
Transportation Co., Ltd.
Another enterprise controlled by the same controlling
shareholder and the ultimate controlling party
Xiamen Shipping Co., Ltd. Another enterprise controlled by the same controlling
shareholder and the ultimate controlling party
Shanghai Foreign Trade Yangxing Storage and
Transportation Co., Ltd.
Another enterprise controlled by the same controlling
shareholder and the ultimate controlling party
Sinotrans Qinhuangdao Port Industrial Co., Ltd. Another enterprise controlled by the same controlling
shareholder and the ultimate controlling party
Tianjin Sinotrans Binhai Logistics Management
Co., Ltd.
Another enterprise controlled by the same controlling
shareholder and the ultimate controlling party
Shenzhen Merchants Venture Co., Ltd. Another enterprise controlled by the same controlling
shareholder and the ultimate controlling party
Sinotrans Guangxi Guigang Company Another enterprise controlled by the same controlling
shareholder and the ultimate controlling party
Guangdong Sinotrans Huangpu Co., Ltd. Another enterprise controlled by the same controlling
shareholder and the ultimate controlling party
Fujian Sinotrans Hexi Storage and
Transportation Co., Ltd.
Another enterprise controlled by the same controlling
shareholder and the ultimate controlling party
Sinotrans Jinling Co., Ltd. Another enterprise controlled by the same controlling
shareholder and the ultimate controlling party
Sinotrans Nantong Co., Ltd. Another enterprise controlled by the same controlling
shareholder and the ultimate controlling party
X. RELATED-PARTY RELATIONSHIPS AND TRANSACTIONS (CONTINUED)
3. The Main Related Parties that have Transactions with the Group but do not have a Control Relationship are as Follows: (continued)
Chapter 10Notes to the Financial Statements
For the six months ended 30 June 2020(Unless otherwise indicated, the unit of amount is RMB)
269INTERIM REPORT 2020
Names of related parties Nature
Sinotrans Inner Mongolia Co., Ltd. Another enterprise controlled by the same controlling
shareholder and the ultimate controlling party
Sinotrans Shaanxi Co., Ltd. Another enterprise controlled by the same controlling
shareholder and the ultimate controlling party
China Yangzijiang Shipping Co., Ltd. Another enterprise controlled by the same controlling
shareholder and the ultimate controlling party
Sinopec Changjiang Fuel Co., Ltd. Another enterprise controlled by the same controlling
shareholder and the ultimate controlling party
Sinotrans Shipping Management Co., Ltd. Another enterprise controlled by the same controlling
shareholder and the ultimate controlling party
Sinotrans International Trade Co., Ltd. Another enterprise controlled by the same controlling
shareholder and the ultimate controlling party
Sinotrans Liaoning Container Co., Ltd. Another enterprise controlled by the same controlling
shareholder and the ultimate controlling party
Sinotrans Shanghai (Group) Co., Ltd. Another enterprise controlled by the same controlling
shareholder and the ultimate controlling party
Chongqing Wanqiao Traffic Technology
Development Co., Ltd.
Another enterprise controlled by the same controlling
shareholder and the ultimate controlling party
Chongqing Changhang Tianyi Logistics Co.,
Ltd.
Another enterprise controlled by the same controlling
shareholder and the ultimate controlling party
Chongqing Changhang Yihua Shipping Co.,
Ltd.
Another enterprise controlled by the same controlling
shareholder and the ultimate controlling party
Chongqing Changjiang Shipping Co., Ltd. Another enterprise controlled by the same controlling
shareholder and the ultimate controlling party
Nanjing Changjiang Tanker Co., Ltd. Another enterprise controlled by the same controlling
shareholder and the ultimate controlling party
MAXX LOGISTICS FZCO. A joint venture of the Group
Beijing Medical Chain Communication Supply
Chain Management Co., Ltd.
A joint venture of the Group
Beijing Sinotrans Huali Logistics Co., Ltd. A joint venture of the Group
Dalian Jd Cargo International Co., Ltd. A joint venture of the Group
Dongguan Port Container Port Co., Ltd. A joint venture of the Group
Dongguan Sinotrans Kuasheng E-Commerce
Co., Ltd.
A joint venture of the Group
Jiangsu Rixin International Transport Co., Ltd. A joint venture of the Group
Sinotrans International Cold chain Logistics
(Shanghai) Co., Ltd.
A joint venture of the Group
Nantong Comprehensive Bonded zone
Sinotrans Logistics Co., Ltd.
A joint venture of the Group
Ningbo Dagang Container Co., Ltd. A joint venture of the Group
X. RELATED-PARTY RELATIONSHIPS AND TRANSACTIONS (CONTINUED)
3. The Main Related Parties that have Transactions with the Group but do not have a Control Relationship are as Follows: (continued)
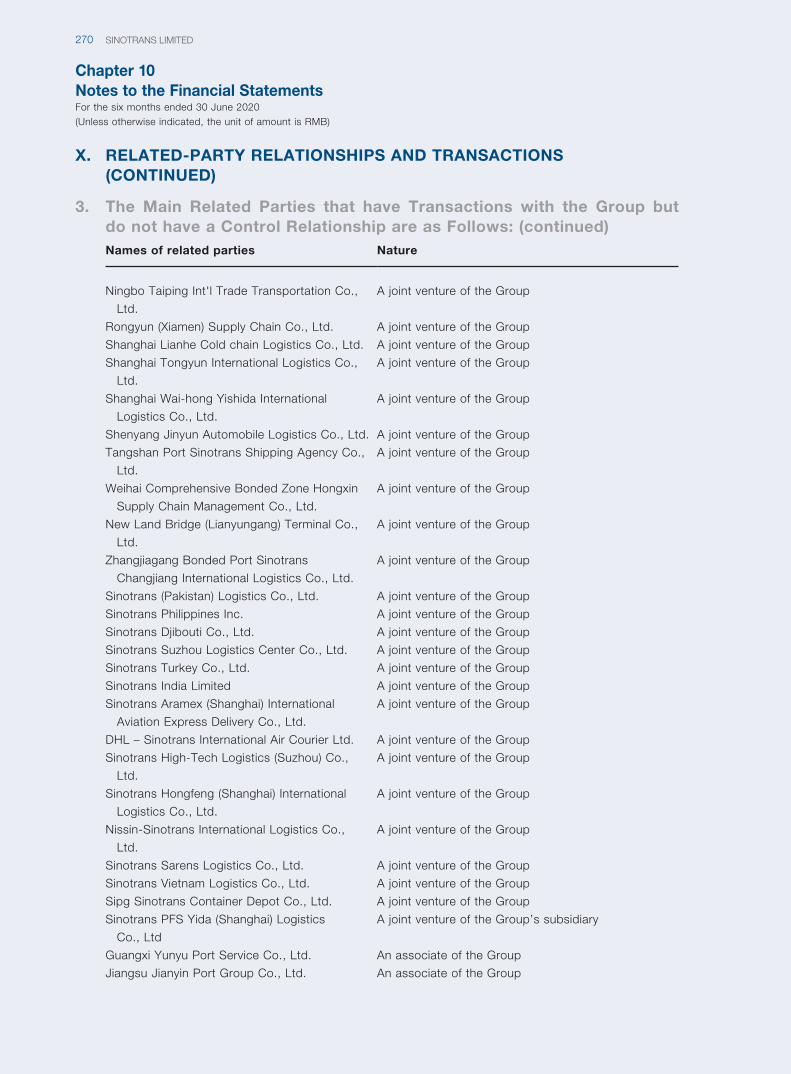
Chapter 10Notes to the Financial StatementsFor the six months ended 30 June 2020(Unless otherwise indicated, the unit of amount is RMB)
SINOTRANS LIMITED270
Names of related parties Nature
Ningbo Taiping Int'l Trade Transportation Co.,
Ltd.
A joint venture of the Group
Rongyun (Xiamen) Supply Chain Co., Ltd. A joint venture of the Group
Shanghai Lianhe Cold chain Logistics Co., Ltd. A joint venture of the Group
Shanghai Tongyun International Logistics Co.,
Ltd.
A joint venture of the Group
Shanghai Wai-hong Yishida International
Logistics Co., Ltd.
A joint venture of the Group
Shenyang Jinyun Automobile Logistics Co., Ltd. A joint venture of the Group
Tangshan Port Sinotrans Shipping Agency Co.,
Ltd.
A joint venture of the Group
Weihai Comprehensive Bonded Zone Hongxin
Supply Chain Management Co., Ltd.
A joint venture of the Group
New Land Bridge (Lianyungang) Terminal Co.,
Ltd.
A joint venture of the Group
Zhangjiagang Bonded Port Sinotrans
Changjiang International Logistics Co., Ltd.
A joint venture of the Group
Sinotrans (Pakistan) Logistics Co., Ltd. A joint venture of the Group
Sinotrans Philippines Inc. A joint venture of the Group
Sinotrans Djibouti Co., Ltd. A joint venture of the Group
Sinotrans Suzhou Logistics Center Co., Ltd. A joint venture of the Group
Sinotrans Turkey Co., Ltd. A joint venture of the Group
Sinotrans India Limited A joint venture of the Group
Sinotrans Aramex (Shanghai) International
Aviation Express Delivery Co., Ltd.
A joint venture of the Group
DHL – Sinotrans International Air Courier Ltd. A joint venture of the Group
Sinotrans High-Tech Logistics (Suzhou) Co.,
Ltd.
A joint venture of the Group
Sinotrans Hongfeng (Shanghai) International
Logistics Co., Ltd.
A joint venture of the Group
Nissin-Sinotrans International Logistics Co.,
Ltd.
A joint venture of the Group
Sinotrans Sarens Logistics Co., Ltd. A joint venture of the Group
Sinotrans Vietnam Logistics Co., Ltd. A joint venture of the Group
Sipg Sinotrans Container Depot Co., Ltd. A joint venture of the Group
Sinotrans PFS Yida (Shanghai) Logistics
Co., Ltd
A joint venture of the Group’s subsidiary
Guangxi Yunyu Port Service Co., Ltd. An associate of the Group
Jiangsu Jianyin Port Group Co., Ltd. An associate of the Group
X. RELATED-PARTY RELATIONSHIPS AND TRANSACTIONS (CONTINUED)
3. The Main Related Parties that have Transactions with the Group but do not have a Control Relationship are as Follows: (continued)
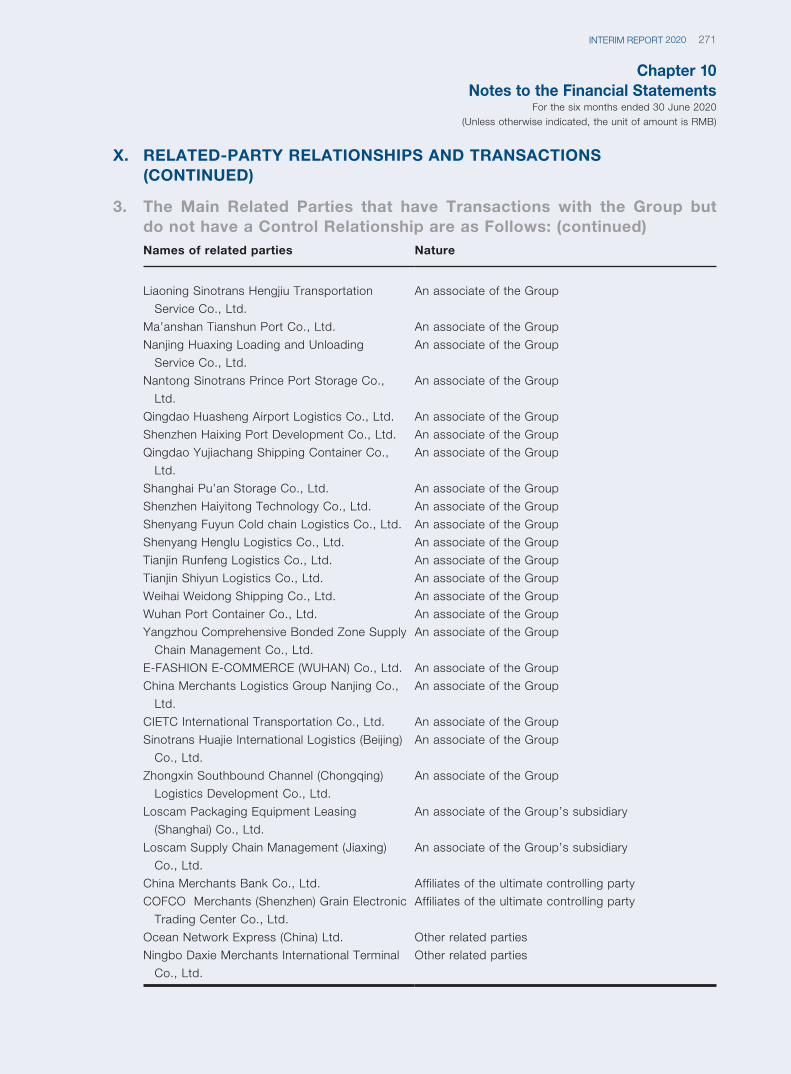
Chapter 10Notes to the Financial Statements
For the six months ended 30 June 2020(Unless otherwise indicated, the unit of amount is RMB)
271INTERIM REPORT 2020
Names of related parties Nature
Liaoning Sinotrans Hengjiu Transportation
Service Co., Ltd.
An associate of the Group
Ma’anshan Tianshun Port Co., Ltd. An associate of the Group
Nanjing Huaxing Loading and Unloading
Service Co., Ltd.
An associate of the Group
Nantong Sinotrans Prince Port Storage Co.,
Ltd.
An associate of the Group
Qingdao Huasheng Airport Logistics Co., Ltd. An associate of the Group
Shenzhen Haixing Port Development Co., Ltd. An associate of the Group
Qingdao Yujiachang Shipping Container Co.,
Ltd.
An associate of the Group
Shanghai Pu’an Storage Co., Ltd. An associate of the Group
Shenzhen Haiyitong Technology Co., Ltd. An associate of the Group
Shenyang Fuyun Cold chain Logistics Co., Ltd. An associate of the Group
Shenyang Henglu Logistics Co., Ltd. An associate of the Group
Tianjin Runfeng Logistics Co., Ltd. An associate of the Group
Tianjin Shiyun Logistics Co., Ltd. An associate of the Group
Weihai Weidong Shipping Co., Ltd. An associate of the Group
Wuhan Port Container Co., Ltd. An associate of the Group
Yangzhou Comprehensive Bonded Zone Supply
Chain Management Co., Ltd.
An associate of the Group
E-FASHION E-COMMERCE (WUHAN) Co., Ltd. An associate of the Group
China Merchants Logistics Group Nanjing Co.,
Ltd.
An associate of the Group
CIETC International Transportation Co., Ltd. An associate of the Group
Sinotrans Huajie International Logistics (Beijing)
Co., Ltd.
An associate of the Group
Zhongxin Southbound Channel (Chongqing)
Logistics Development Co., Ltd.
An associate of the Group
Loscam Packaging Equipment Leasing
(Shanghai) Co., Ltd.
An associate of the Group’s subsidiary
Loscam Supply Chain Management (Jiaxing)
Co., Ltd.
An associate of the Group’s subsidiary
China Merchants Bank Co., Ltd. Affiliates of the ultimate controlling party
COFCO Merchants (Shenzhen) Grain Electronic
Trading Center Co., Ltd.
Affiliates of the ultimate controlling party
Ocean Network Express (China) Ltd. Other related parties
Ningbo Daxie Merchants International Terminal
Co., Ltd.
Other related parties
X. RELATED-PARTY RELATIONSHIPS AND TRANSACTIONS (CONTINUED)
3. The Main Related Parties that have Transactions with the Group but do not have a Control Relationship are as Follows: (continued)
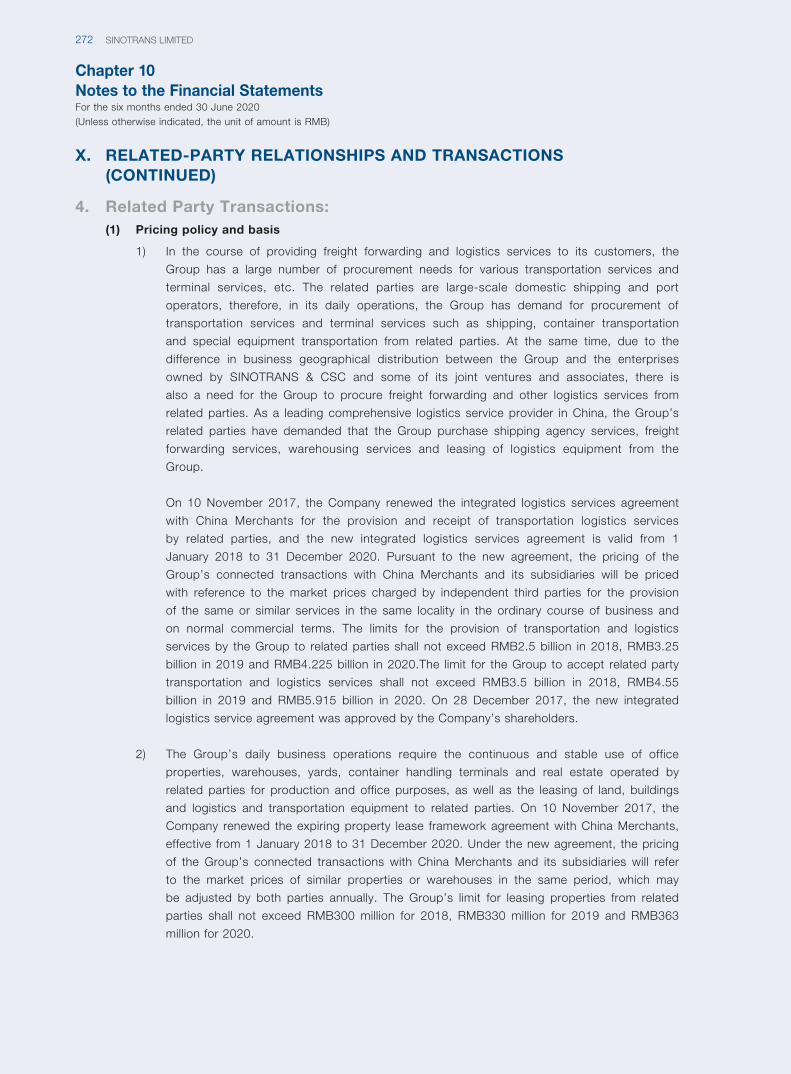
Chapter 10Notes to the Financial StatementsFor the six months ended 30 June 2020(Unless otherwise indicated, the unit of amount is RMB)
SINOTRANS LIMITED272
X. RELATED-PARTY RELATIONSHIPS AND TRANSACTIONS (CONTINUED)
4. Related Party Transactions:(1) Pricing policy and basis
1) In the course of providing freight forwarding and logistics services to its customers, the
Group has a large number of procurement needs for various transportation services and
terminal services, etc. The related parties are large-scale domestic shipping and port
operators, therefore, in its daily operations, the Group has demand for procurement of
transportation services and terminal services such as shipping, container transportation
and special equipment transportation from related parties. At the same time, due to the
difference in business geographical distribution between the Group and the enterprises
owned by SINOTRANS & CSC and some of its joint ventures and associates, there is
also a need for the Group to procure freight forwarding and other logistics services from
related parties. As a leading comprehensive logistics service provider in China, the Group’s
related parties have demanded that the Group purchase shipping agency services, freight
forwarding services, warehousing services and leasing of logistics equipment from the
Group.
On 10 November 2017, the Company renewed the integrated logistics services agreement
with China Merchants for the provision and receipt of transportation logistics services
by related parties, and the new integrated logistics services agreement is valid from 1
January 2018 to 31 December 2020. Pursuant to the new agreement, the pricing of the
Group’s connected transactions with China Merchants and its subsidiaries will be priced
with reference to the market prices charged by independent third parties for the provision
of the same or similar services in the same locality in the ordinary course of business and
on normal commercial terms. The limits for the provision of transportation and logistics
services by the Group to related parties shall not exceed RMB2.5 billion in 2018, RMB3.25
billion in 2019 and RMB4.225 billion in 2020.The limit for the Group to accept related party
transportation and logistics services shall not exceed RMB3.5 billion in 2018, RMB4.55
billion in 2019 and RMB5.915 billion in 2020. On 28 December 2017, the new integrated
logistics service agreement was approved by the Company’s shareholders.
2) The Group’s daily business operations require the continuous and stable use of office
properties, warehouses, yards, container handling terminals and real estate operated by
related parties for production and office purposes, as well as the leasing of land, buildings
and logistics and transportation equipment to related parties. On 10 November 2017, the
Company renewed the expiring property lease framework agreement with China Merchants,
effective from 1 January 2018 to 31 December 2020. Under the new agreement, the pricing
of the Group’s connected transactions with China Merchants and its subsidiaries will refer
to the market prices of similar properties or warehouses in the same period, which may
be adjusted by both parties annually. The Group’s limit for leasing properties from related
parties shall not exceed RMB300 million for 2018, RMB330 million for 2019 and RMB363
million for 2020.
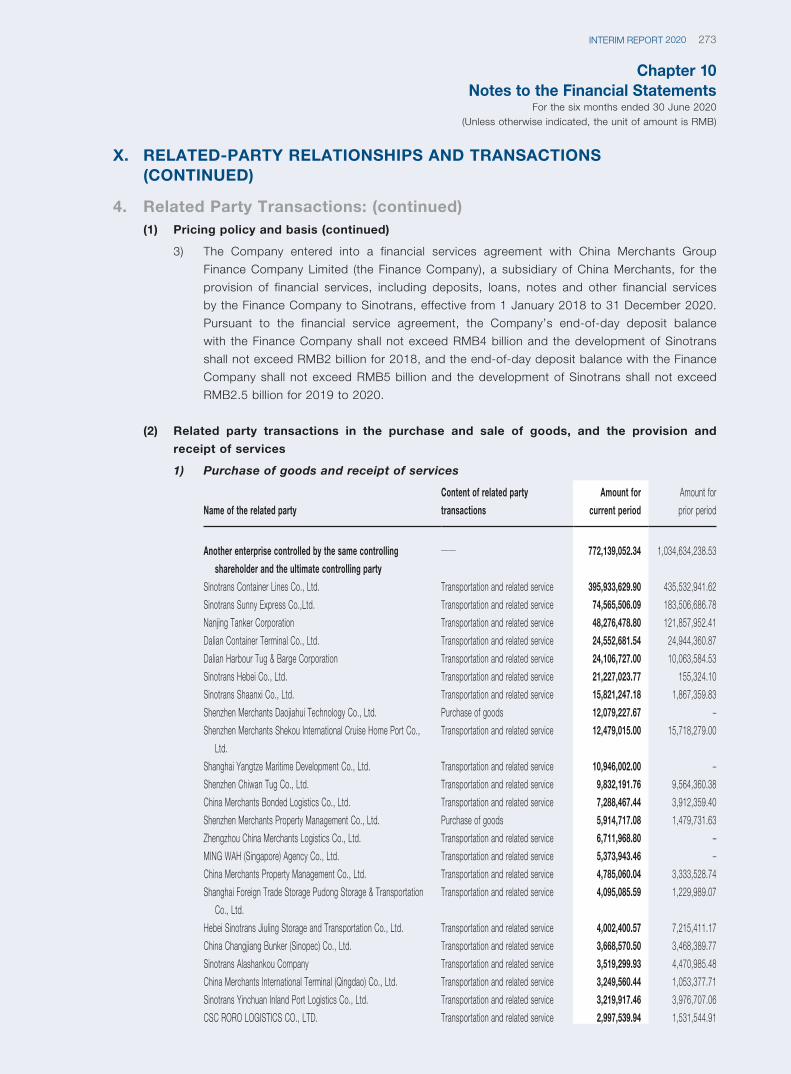
Chapter 10Notes to the Financial Statements
For the six months ended 30 June 2020(Unless otherwise indicated, the unit of amount is RMB)
273INTERIM REPORT 2020
X. RELATED-PARTY RELATIONSHIPS AND TRANSACTIONS (CONTINUED)
4. Related Party Transactions: (continued)(1) Pricing policy and basis (continued)
3) The Company entered into a financial services agreement with China Merchants Group
Finance Company Limited (the Finance Company), a subsidiary of China Merchants, for the
provision of financial services, including deposits, loans, notes and other financial services
by the Finance Company to Sinotrans, effective from 1 January 2018 to 31 December 2020.
Pursuant to the financial service agreement, the Company’s end-of-day deposit balance
with the Finance Company shall not exceed RMB4 billion and the development of Sinotrans
shall not exceed RMB2 billion for 2018, and the end-of-day deposit balance with the Finance
Company shall not exceed RMB5 billion and the development of Sinotrans shall not exceed
RMB2.5 billion for 2019 to 2020.
(2) Related party transactions in the purchase and sale of goods, and the provision and
receipt of services
1) Purchase of goods and receipt of services
Name of the related party
Content of related party
transactions
Amount for
current period
Amount for
prior period
Another enterprise controlled by the same controlling
shareholder and the ultimate controlling party—— 772,139,052.34 1,034,634,238.53
Sinotrans Container Lines Co., Ltd. Transportation and related service 395,933,629.90 435,532,941.62
Sinotrans Sunny Express Co.,Ltd. Transportation and related service 74,565,506.09 183,506,686.78
Nanjing Tanker Corporation Transportation and related service 48,276,478.80 121,857,952.41
Dalian Container Terminal Co., Ltd. Transportation and related service 24,552,681.54 24,944,360.87
Dalian Harbour Tug & Barge Corporation Transportation and related service 24,106,727.00 10,063,584.53
Sinotrans Hebei Co., Ltd. Transportation and related service 21,227,023.77 155,324.10
Sinotrans Shaanxi Co., Ltd. Transportation and related service 15,821,247.18 1,867,359.83
Shenzhen Merchants Daojiahui Technology Co., Ltd. Purchase of goods 12,079,227.67 –
Shenzhen Merchants Shekou International Cruise Home Port Co.,
Ltd.
Transportation and related service 12,479,015.00 15,718,279.00
Shanghai Yangtze Maritime Development Co., Ltd. Transportation and related service 10,946,002.00 –
Shenzhen Chiwan Tug Co., Ltd. Transportation and related service 9,832,191.76 9,564,360.38
China Merchants Bonded Logistics Co., Ltd. Transportation and related service 7,288,467.44 3,912,359.40
Shenzhen Merchants Property Management Co., Ltd. Purchase of goods 5,914,717.08 1,479,731.63
Zhengzhou China Merchants Logistics Co., Ltd. Transportation and related service 6,711,968.80 –
MING WAH (Singapore) Agency Co., Ltd. Transportation and related service 5,373,943.46 –
China Merchants Property Management Co., Ltd. Transportation and related service 4,785,060.04 3,333,528.74
Shanghai Foreign Trade Storage Pudong Storage & Transportation
Co., Ltd.
Transportation and related service 4,095,085.59 1,229,989.07
Hebei Sinotrans Jiuling Storage and Transportation Co., Ltd. Transportation and related service 4,002,400.57 7,215,411.17
China Changjiang Bunker (Sinopec) Co., Ltd. Transportation and related service 3,668,570.50 3,468,389.77
Sinotrans Alashankou Company Transportation and related service 3,519,299.93 4,470,985.48
China Merchants International Terminal (Qingdao) Co., Ltd. Transportation and related service 3,249,560.44 1,053,377.71
Sinotrans Yinchuan Inland Port Logistics Co., Ltd. Transportation and related service 3,219,917.46 3,976,707.06
CSC RORO LOGISTICS CO., LTD. Transportation and related service 2,997,539.94 1,531,544.91
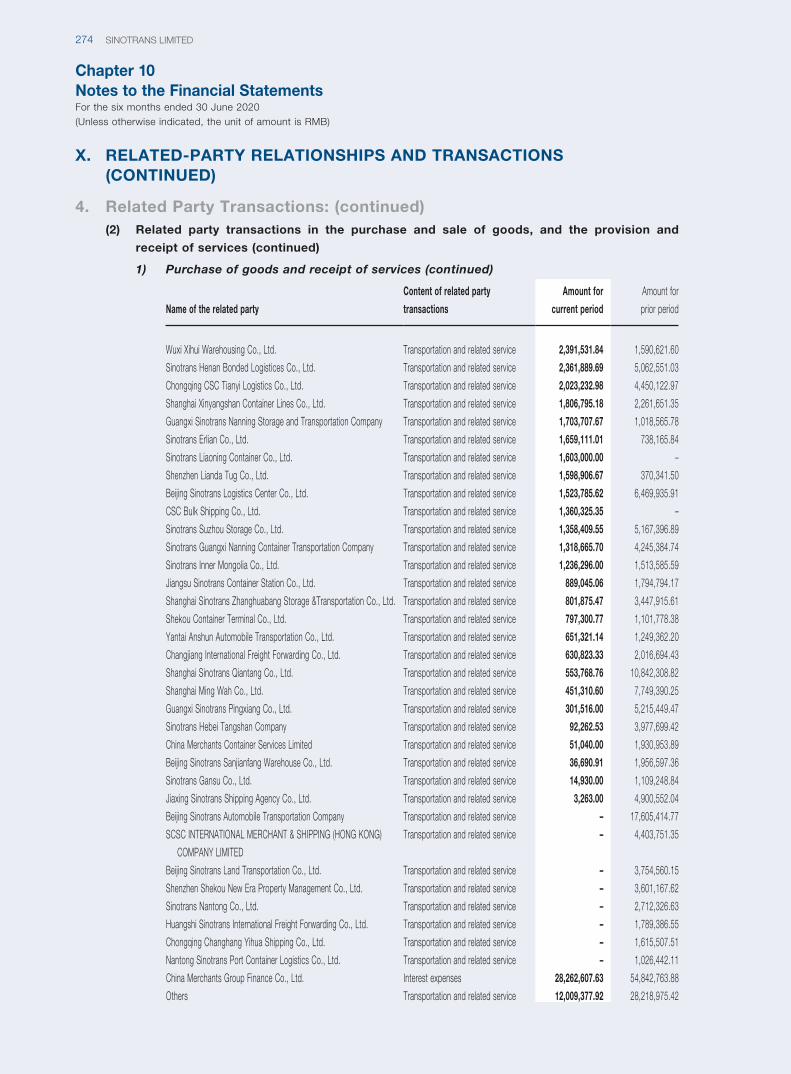
Chapter 10Notes to the Financial StatementsFor the six months ended 30 June 2020(Unless otherwise indicated, the unit of amount is RMB)
SINOTRANS LIMITED274
Name of the related party
Content of related party
transactions
Amount for
current period
Amount for
prior period
Wuxi Xihui Warehousing Co., Ltd. Transportation and related service 2,391,531.84 1,590,621.60
Sinotrans Henan Bonded Logistices Co., Ltd. Transportation and related service 2,361,889.69 5,062,551.03
Chongqing CSC Tianyi Logistics Co., Ltd. Transportation and related service 2,023,232.98 4,450,122.97
Shanghai Xinyangshan Container Lines Co., Ltd. Transportation and related service 1,806,795.18 2,261,651.35
Guangxi Sinotrans Nanning Storage and Transportation Company Transportation and related service 1,703,707.67 1,018,565.78
Sinotrans Erlian Co., Ltd. Transportation and related service 1,659,111.01 738,165.84
Sinotrans Liaoning Container Co., Ltd. Transportation and related service 1,603,000.00 –
Shenzhen Lianda Tug Co., Ltd. Transportation and related service 1,598,906.67 370,341.50
Beijing Sinotrans Logistics Center Co., Ltd. Transportation and related service 1,523,785.62 6,469,935.91
CSC Bulk Shipping Co., Ltd. Transportation and related service 1,360,325.35 –
Sinotrans Suzhou Storage Co., Ltd. Transportation and related service 1,358,409.55 5,167,396.89
Sinotrans Guangxi Nanning Container Transportation Company Transportation and related service 1,318,665.70 4,245,384.74
Sinotrans Inner Mongolia Co., Ltd. Transportation and related service 1,236,296.00 1,513,585.59
Jiangsu Sinotrans Container Station Co., Ltd. Transportation and related service 889,045.06 1,794,794.17
Shanghai Sinotrans Zhanghuabang Storage &Transportation Co., Ltd. Transportation and related service 801,875.47 3,447,915.61
Shekou Container Terminal Co., Ltd. Transportation and related service 797,300.77 1,101,778.38
Yantai Anshun Automobile Transportation Co., Ltd. Transportation and related service 651,321.14 1,249,362.20
Changjiang International Freight Forwarding Co., Ltd. Transportation and related service 630,823.33 2,016,694.43
Shanghai Sinotrans Qiantang Co., Ltd. Transportation and related service 553,768.76 10,842,308.82
Shanghai Ming Wah Co., Ltd. Transportation and related service 451,310.60 7,749,390.25
Guangxi Sinotrans Pingxiang Co., Ltd. Transportation and related service 301,516.00 5,215,449.47
Sinotrans Hebei Tangshan Company Transportation and related service 92,262.53 3,977,699.42
China Merchants Container Services Limited Transportation and related service 51,040.00 1,930,953.89
Beijing Sinotrans Sanjianfang Warehouse Co., Ltd. Transportation and related service 36,690.91 1,956,597.36
Sinotrans Gansu Co., Ltd. Transportation and related service 14,930.00 1,109,248.84
Jiaxing Sinotrans Shipping Agency Co., Ltd. Transportation and related service 3,263.00 4,900,552.04
Beijing Sinotrans Automobile Transportation Company Transportation and related service – 17,605,414.77
SCSC INTERNATIONAL MERCHANT & SHIPPING (HONG KONG)
COMPANY LIMITED
Transportation and related service – 4,403,751.35
Beijing Sinotrans Land Transportation Co., Ltd. Transportation and related service – 3,754,560.15
Shenzhen Shekou New Era Property Management Co., Ltd. Transportation and related service – 3,601,167.62
Sinotrans Nantong Co., Ltd. Transportation and related service – 2,712,326.63
Huangshi Sinotrans International Freight Forwarding Co., Ltd. Transportation and related service – 1,789,386.55
Chongqing Changhang Yihua Shipping Co., Ltd. Transportation and related service – 1,615,507.51
Nantong Sinotrans Port Container Logistics Co., Ltd. Transportation and related service – 1,026,442.11
China Merchants Group Finance Co., Ltd. Interest expenses 28,262,607.63 54,842,763.88
Others Transportation and related service 12,009,377.92 28,218,975.42
X. RELATED-PARTY RELATIONSHIPS AND TRANSACTIONS (CONTINUED)
4. Related Party Transactions: (continued)(2) Related party transactions in the purchase and sale of goods, and the provision and
receipt of services (continued)
1) Purchase of goods and receipt of services (continued)
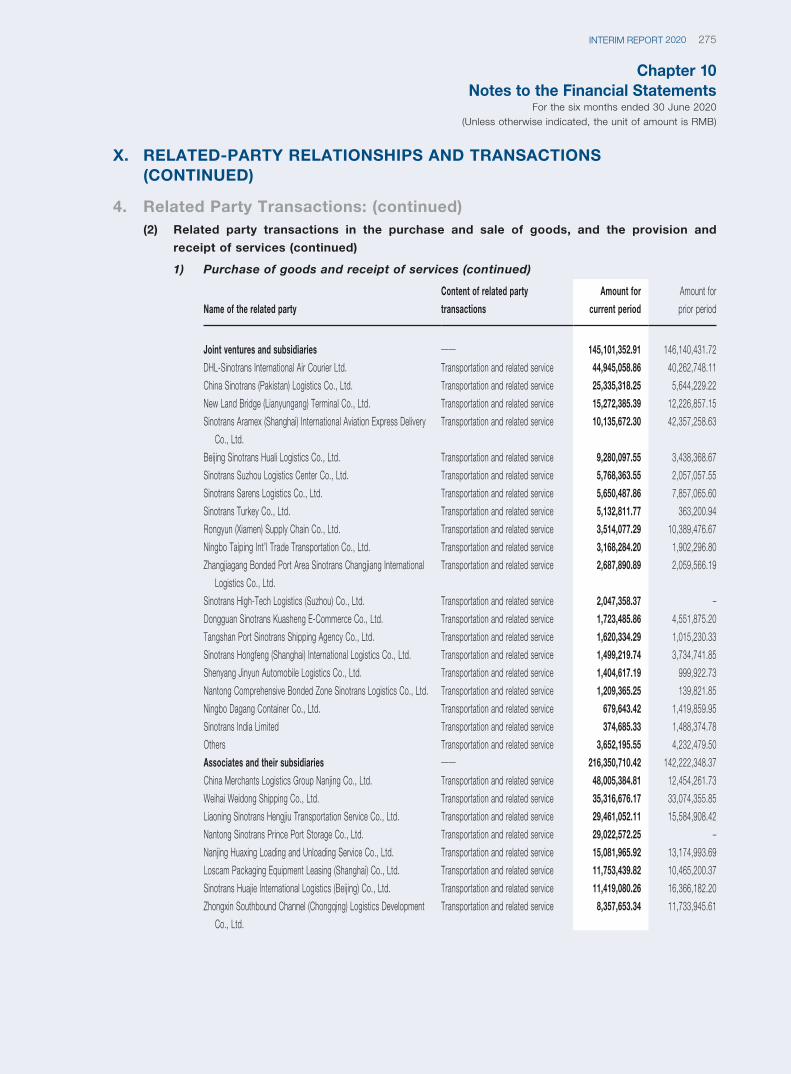
Chapter 10Notes to the Financial Statements
For the six months ended 30 June 2020(Unless otherwise indicated, the unit of amount is RMB)
275INTERIM REPORT 2020
Name of the related party
Content of related party
transactions
Amount for
current period
Amount for
prior period
Joint ventures and subsidiaries —— 145,101,352.91 146,140,431.72
DHL-Sinotrans International Air Courier Ltd. Transportation and related service 44,945,058.86 40,262,748.11
China Sinotrans (Pakistan) Logistics Co., Ltd. Transportation and related service 25,335,318.25 5,644,229.22
New Land Bridge (Lianyungang) Terminal Co., Ltd. Transportation and related service 15,272,385.39 12,226,857.15
Sinotrans Aramex (Shanghai) International Aviation Express Delivery
Co., Ltd.
Transportation and related service 10,135,672.30 42,357,258.63
Beijing Sinotrans Huali Logistics Co., Ltd. Transportation and related service 9,280,097.55 3,438,368.67
Sinotrans Suzhou Logistics Center Co., Ltd. Transportation and related service 5,768,363.55 2,057,057.55
Sinotrans Sarens Logistics Co., Ltd. Transportation and related service 5,650,487.86 7,857,065.60
Sinotrans Turkey Co., Ltd. Transportation and related service 5,132,811.77 363,200.94
Rongyun (Xiamen) Supply Chain Co., Ltd. Transportation and related service 3,514,077.29 10,389,476.67
Ningbo Taiping Int’l Trade Transportation Co., Ltd. Transportation and related service 3,168,284.20 1,902,296.80
Zhangjiagang Bonded Port Area Sinotrans Changjiang International
Logistics Co., Ltd.
Transportation and related service 2,687,890.89 2,059,566.19
Sinotrans High-Tech Logistics (Suzhou) Co., Ltd. Transportation and related service 2,047,358.37 –
Dongguan Sinotrans Kuasheng E-Commerce Co., Ltd. Transportation and related service 1,723,485.86 4,551,875.20
Tangshan Port Sinotrans Shipping Agency Co., Ltd. Transportation and related service 1,620,334.29 1,015,230.33
Sinotrans Hongfeng (Shanghai) International Logistics Co., Ltd. Transportation and related service 1,499,219.74 3,734,741.85
Shenyang Jinyun Automobile Logistics Co., Ltd. Transportation and related service 1,404,617.19 999,922.73
Nantong Comprehensive Bonded Zone Sinotrans Logistics Co., Ltd. Transportation and related service 1,209,365.25 139,821.85
Ningbo Dagang Container Co., Ltd. Transportation and related service 679,643.42 1,419,859.95
Sinotrans India Limited Transportation and related service 374,685.33 1,488,374.78
Others Transportation and related service 3,652,195.55 4,232,479.50
Associates and their subsidiaries —— 216,350,710.42 142,222,348.37
China Merchants Logistics Group Nanjing Co., Ltd. Transportation and related service 48,005,384.81 12,454,261.73
Weihai Weidong Shipping Co., Ltd. Transportation and related service 35,316,676.17 33,074,355.85
Liaoning Sinotrans Hengjiu Transportation Service Co., Ltd. Transportation and related service 29,461,052.11 15,584,908.42
Nantong Sinotrans Prince Port Storage Co., Ltd. Transportation and related service 29,022,572.25 –
Nanjing Huaxing Loading and Unloading Service Co., Ltd. Transportation and related service 15,081,965.92 13,174,993.69
Loscam Packaging Equipment Leasing (Shanghai) Co., Ltd. Transportation and related service 11,753,439.82 10,465,200.37
Sinotrans Huajie International Logistics (Beijing) Co., Ltd. Transportation and related service 11,419,080.26 16,366,182.20
Zhongxin Southbound Channel (Chongqing) Logistics Development
Co., Ltd.
Transportation and related service 8,357,653.34 11,733,945.61
X. RELATED-PARTY RELATIONSHIPS AND TRANSACTIONS (CONTINUED)
4. Related Party Transactions: (continued)(2) Related party transactions in the purchase and sale of goods, and the provision and
receipt of services (continued)
1) Purchase of goods and receipt of services (continued)
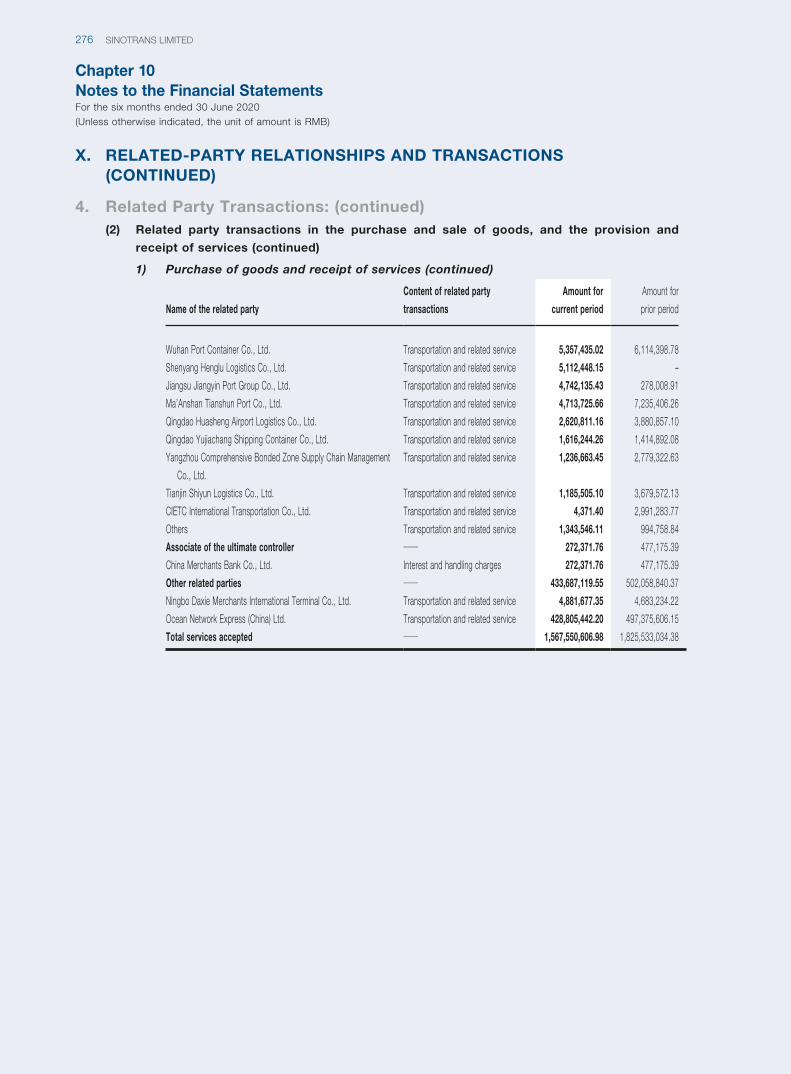
Chapter 10Notes to the Financial StatementsFor the six months ended 30 June 2020(Unless otherwise indicated, the unit of amount is RMB)
SINOTRANS LIMITED276
Name of the related party
Content of related party
transactions
Amount for
current period
Amount for
prior period
Wuhan Port Container Co., Ltd. Transportation and related service 5,357,435.02 6,114,398.78
Shenyang Henglu Logistics Co., Ltd. Transportation and related service 5,112,448.15 –
Jiangsu Jiangyin Port Group Co., Ltd. Transportation and related service 4,742,135.43 278,008.91
Ma’Anshan Tianshun Port Co., Ltd. Transportation and related service 4,713,725.66 7,235,406.26
Qingdao Huasheng Airport Logistics Co., Ltd. Transportation and related service 2,620,811.16 3,880,857.10
Qingdao Yujiachang Shipping Container Co., Ltd. Transportation and related service 1,616,244.26 1,414,892.08
Yangzhou Comprehensive Bonded Zone Supply Chain Management
Co., Ltd.
Transportation and related service 1,236,663.45 2,779,322.63
Tianjin Shiyun Logistics Co., Ltd. Transportation and related service 1,185,505.10 3,679,572.13
CIETC International Transportation Co., Ltd. Transportation and related service 4,371.40 2,991,283.77
Others Transportation and related service 1,343,546.11 994,758.84
Associate of the ultimate controller —— 272,371.76 477,175.39
China Merchants Bank Co., Ltd. Interest and handling charges 272,371.76 477,175.39
Other related parties —— 433,687,119.55 502,058,840.37
Ningbo Daxie Merchants International Terminal Co., Ltd. Transportation and related service 4,881,677.35 4,683,234.22
Ocean Network Express (China) Ltd. Transportation and related service 428,805,442.20 497,375,606.15
Total services accepted —— 1,567,550,606.98 1,825,533,034.38
X. RELATED-PARTY RELATIONSHIPS AND TRANSACTIONS (CONTINUED)
4. Related Party Transactions: (continued)(2) Related party transactions in the purchase and sale of goods, and the provision and
receipt of services (continued)
1) Purchase of goods and receipt of services (continued)
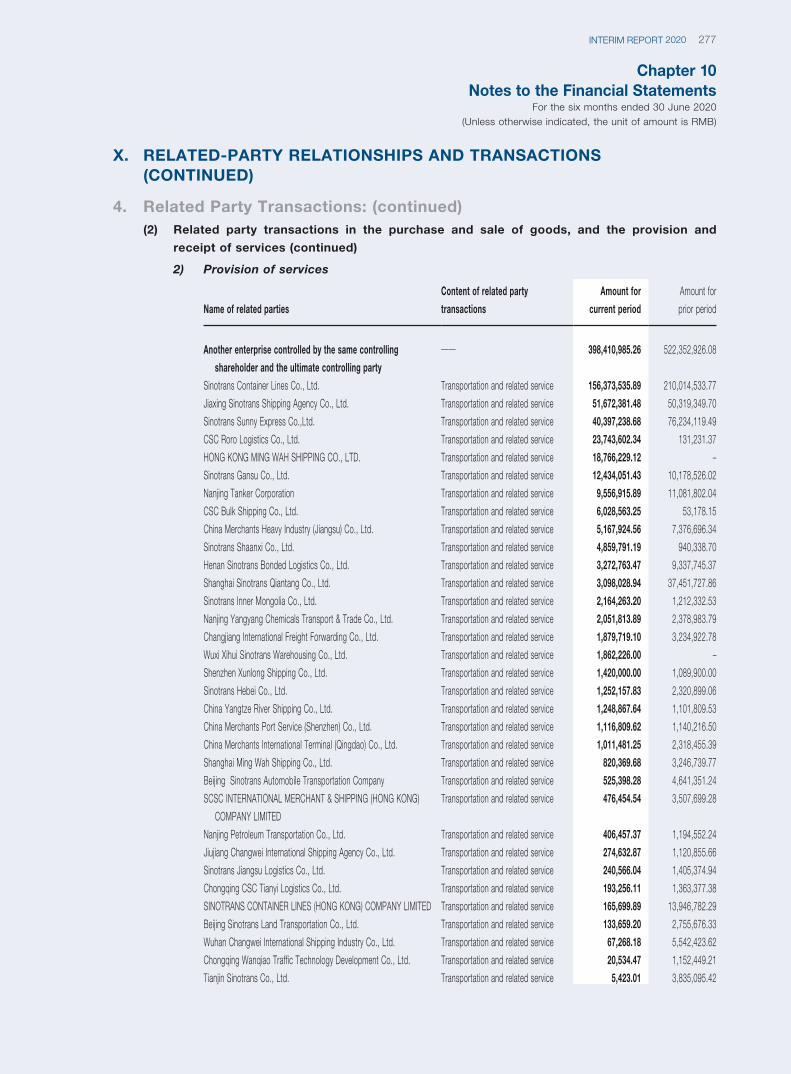
Chapter 10Notes to the Financial Statements
For the six months ended 30 June 2020(Unless otherwise indicated, the unit of amount is RMB)
277INTERIM REPORT 2020
X. RELATED-PARTY RELATIONSHIPS AND TRANSACTIONS (CONTINUED)
4. Related Party Transactions: (continued)(2) Related party transactions in the purchase and sale of goods, and the provision and
receipt of services (continued)
2) Provision of services
Name of related parties
Content of related party
transactions
Amount for
current period
Amount for
prior period
Another enterprise controlled by the same controlling
shareholder and the ultimate controlling party—— 398,410,985.26 522,352,926.08
Sinotrans Container Lines Co., Ltd. Transportation and related service 156,373,535.89 210,014,533.77
Jiaxing Sinotrans Shipping Agency Co., Ltd. Transportation and related service 51,672,381.48 50,319,349.70
Sinotrans Sunny Express Co.,Ltd. Transportation and related service 40,397,238.68 76,234,119.49
CSC Roro Logistics Co., Ltd. Transportation and related service 23,743,602.34 131,231.37
HONG KONG MING WAH SHIPPING CO., LTD. Transportation and related service 18,766,229.12 –
Sinotrans Gansu Co., Ltd. Transportation and related service 12,434,051.43 10,178,526.02
Nanjing Tanker Corporation Transportation and related service 9,556,915.89 11,081,802.04
CSC Bulk Shipping Co., Ltd. Transportation and related service 6,028,563.25 53,178.15
China Merchants Heavy Industry (Jiangsu) Co., Ltd. Transportation and related service 5,167,924.56 7,376,696.34
Sinotrans Shaanxi Co., Ltd. Transportation and related service 4,859,791.19 940,338.70
Henan Sinotrans Bonded Logistics Co., Ltd. Transportation and related service 3,272,763.47 9,337,745.37
Shanghai Sinotrans Qiantang Co., Ltd. Transportation and related service 3,098,028.94 37,451,727.86
Sinotrans Inner Mongolia Co., Ltd. Transportation and related service 2,164,263.20 1,212,332.53
Nanjing Yangyang Chemicals Transport & Trade Co., Ltd. Transportation and related service 2,051,813.89 2,378,983.79
Changjiang International Freight Forwarding Co., Ltd. Transportation and related service 1,879,719.10 3,234,922.78
Wuxi Xihui Sinotrans Warehousing Co., Ltd. Transportation and related service 1,862,226.00 –
Shenzhen Xunlong Shipping Co., Ltd. Transportation and related service 1,420,000.00 1,089,900.00
Sinotrans Hebei Co., Ltd. Transportation and related service 1,252,157.83 2,320,899.06
China Yangtze River Shipping Co., Ltd. Transportation and related service 1,248,867.64 1,101,809.53
China Merchants Port Service (Shenzhen) Co., Ltd. Transportation and related service 1,116,809.62 1,140,216.50
China Merchants International Terminal (Qingdao) Co., Ltd. Transportation and related service 1,011,481.25 2,318,455.39
Shanghai Ming Wah Shipping Co., Ltd. Transportation and related service 820,369.68 3,246,739.77
Beijing Sinotrans Automobile Transportation Company Transportation and related service 525,398.28 4,641,351.24
SCSC INTERNATIONAL MERCHANT & SHIPPING (HONG KONG)
COMPANY LIMITED
Transportation and related service 476,454.54 3,507,699.28
Nanjing Petroleum Transportation Co., Ltd. Transportation and related service 406,457.37 1,194,552.24
Jiujiang Changwei International Shipping Agency Co., Ltd. Transportation and related service 274,632.87 1,120,855.66
Sinotrans Jiangsu Logistics Co., Ltd. Transportation and related service 240,566.04 1,405,374.94
Chongqing CSC Tianyi Logistics Co., Ltd. Transportation and related service 193,256.11 1,363,377.38
SINOTRANS CONTAINER LINES (HONG KONG) COMPANY LIMITED Transportation and related service 165,699.89 13,946,782.29
Beijing Sinotrans Land Transportation Co., Ltd. Transportation and related service 133,659.20 2,755,676.33
Wuhan Changwei International Shipping Industry Co., Ltd. Transportation and related service 67,268.18 5,542,423.62
Chongqing Wanqiao Traffic Technology Development Co., Ltd. Transportation and related service 20,534.47 1,152,449.21
Tianjin Sinotrans Co., Ltd. Transportation and related service 5,423.01 3,835,095.42
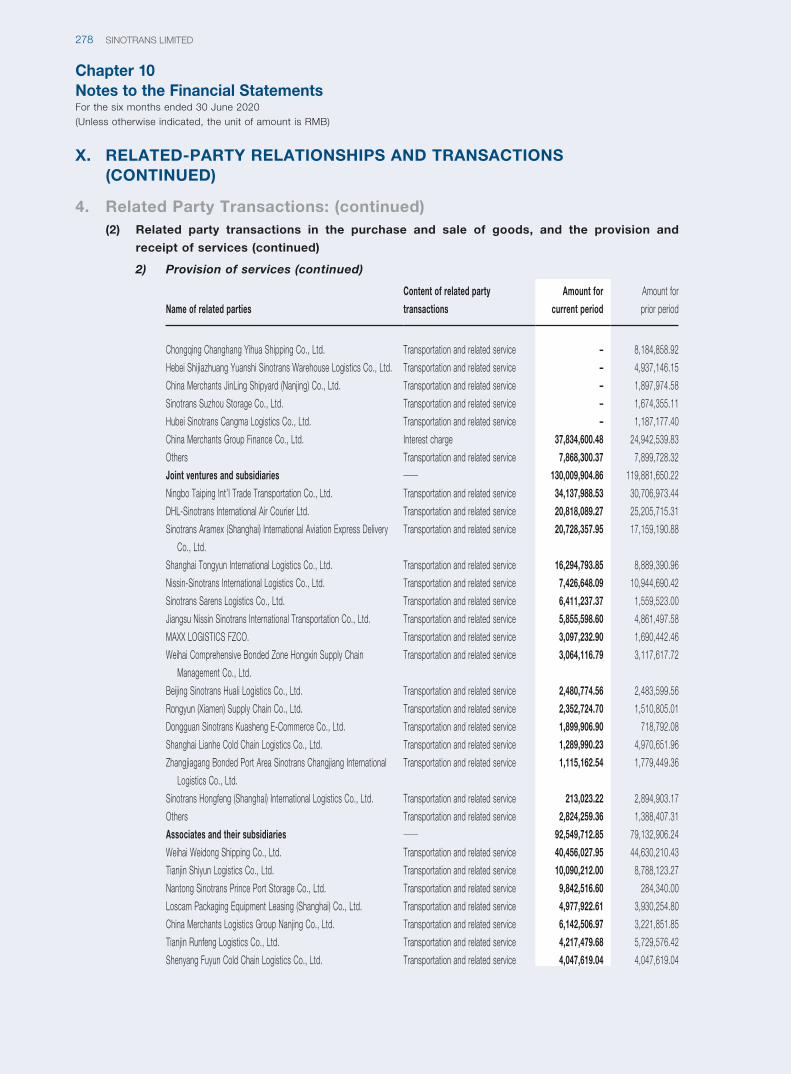
Chapter 10Notes to the Financial StatementsFor the six months ended 30 June 2020(Unless otherwise indicated, the unit of amount is RMB)
SINOTRANS LIMITED278
Name of related parties
Content of related party
transactions
Amount for
current period
Amount for
prior period
Chongqing Changhang Yihua Shipping Co., Ltd. Transportation and related service – 8,184,858.92
Hebei Shijiazhuang Yuanshi Sinotrans Warehouse Logistics Co., Ltd. Transportation and related service – 4,937,146.15
China Merchants JinLing Shipyard (Nanjing) Co., Ltd. Transportation and related service – 1,897,974.58
Sinotrans Suzhou Storage Co., Ltd. Transportation and related service – 1,674,355.11
Hubei Sinotrans Cangma Logistics Co., Ltd. Transportation and related service – 1,187,177.40
China Merchants Group Finance Co., Ltd. Interest charge 37,834,600.48 24,942,539.83
Others Transportation and related service 7,868,300.37 7,899,728.32
Joint ventures and subsidiaries —— 130,009,904.86 119,881,650.22
Ningbo Taiping Int’l Trade Transportation Co., Ltd. Transportation and related service 34,137,988.53 30,706,973.44
DHL-Sinotrans International Air Courier Ltd. Transportation and related service 20,818,089.27 25,205,715.31
Sinotrans Aramex (Shanghai) International Aviation Express Delivery
Co., Ltd.
Transportation and related service 20,728,357.95 17,159,190.88
Shanghai Tongyun International Logistics Co., Ltd. Transportation and related service 16,294,793.85 8,889,390.96
Nissin-Sinotrans International Logistics Co., Ltd. Transportation and related service 7,426,648.09 10,944,690.42
Sinotrans Sarens Logistics Co., Ltd. Transportation and related service 6,411,237.37 1,559,523.00
Jiangsu Nissin Sinotrans International Transportation Co., Ltd. Transportation and related service 5,855,598.60 4,861,497.58
MAXX LOGISTICS FZCO. Transportation and related service 3,097,232.90 1,690,442.46
Weihai Comprehensive Bonded Zone Hongxin Supply Chain
Management Co., Ltd.
Transportation and related service 3,064,116.79 3,117,617.72
Beijing Sinotrans Huali Logistics Co., Ltd. Transportation and related service 2,480,774.56 2,483,599.56
Rongyun (Xiamen) Supply Chain Co., Ltd. Transportation and related service 2,352,724.70 1,510,805.01
Dongguan Sinotrans Kuasheng E-Commerce Co., Ltd. Transportation and related service 1,899,906.90 718,792.08
Shanghai Lianhe Cold Chain Logistics Co., Ltd. Transportation and related service 1,289,990.23 4,970,651.96
Zhangjiagang Bonded Port Area Sinotrans Changjiang International
Logistics Co., Ltd.
Transportation and related service 1,115,162.54 1,779,449.36
Sinotrans Hongfeng (Shanghai) International Logistics Co., Ltd. Transportation and related service 213,023.22 2,894,903.17
Others Transportation and related service 2,824,259.36 1,388,407.31
Associates and their subsidiaries —— 92,549,712.85 79,132,906.24
Weihai Weidong Shipping Co., Ltd. Transportation and related service 40,456,027.95 44,630,210.43
Tianjin Shiyun Logistics Co., Ltd. Transportation and related service 10,090,212.00 8,788,123.27
Nantong Sinotrans Prince Port Storage Co., Ltd. Transportation and related service 9,842,516.60 284,340.00
Loscam Packaging Equipment Leasing (Shanghai) Co., Ltd. Transportation and related service 4,977,922.61 3,930,254.80
China Merchants Logistics Group Nanjing Co., Ltd. Transportation and related service 6,142,506.97 3,221,851.85
Tianjin Runfeng Logistics Co., Ltd. Transportation and related service 4,217,479.68 5,729,576.42
Shenyang Fuyun Cold Chain Logistics Co., Ltd. Transportation and related service 4,047,619.04 4,047,619.04
X. RELATED-PARTY RELATIONSHIPS AND TRANSACTIONS (CONTINUED)
4. Related Party Transactions: (continued)(2) Related party transactions in the purchase and sale of goods, and the provision and
receipt of services (continued)
2) Provision of services (continued)
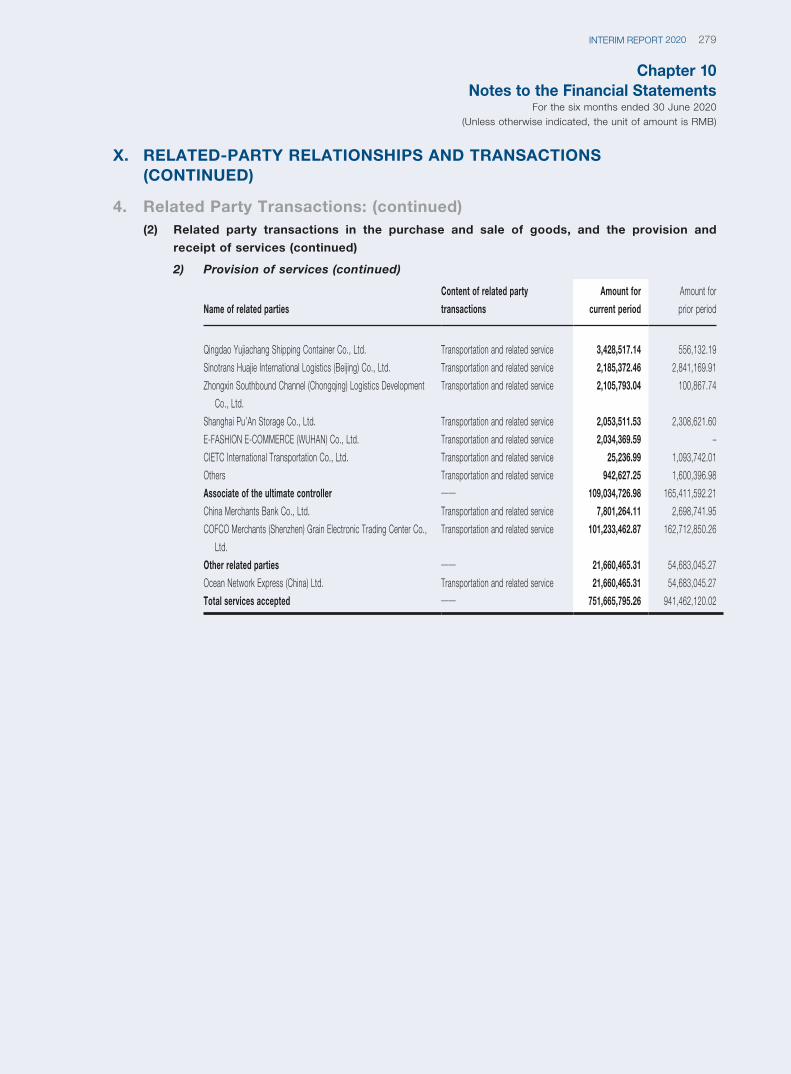
Chapter 10Notes to the Financial Statements
For the six months ended 30 June 2020(Unless otherwise indicated, the unit of amount is RMB)
279INTERIM REPORT 2020
Name of related parties
Content of related party
transactions
Amount for
current period
Amount for
prior period
Qingdao Yujiachang Shipping Container Co., Ltd. Transportation and related service 3,428,517.14 556,132.19
Sinotrans Huajie International Logistics (Beijing) Co., Ltd. Transportation and related service 2,185,372.46 2,841,169.91
Zhongxin Southbound Channel (Chongqing) Logistics Development
Co., Ltd.
Transportation and related service 2,105,793.04 100,867.74
Shanghai Pu’An Storage Co., Ltd. Transportation and related service 2,053,511.53 2,308,621.60
E-FASHION E-COMMERCE (WUHAN) Co., Ltd. Transportation and related service 2,034,369.59 –
CIETC International Transportation Co., Ltd. Transportation and related service 25,236.99 1,093,742.01
Others Transportation and related service 942,627.25 1,600,396.98
Associate of the ultimate controller —— 109,034,726.98 165,411,592.21
China Merchants Bank Co., Ltd. Transportation and related service 7,801,264.11 2,698,741.95
COFCO Merchants (Shenzhen) Grain Electronic Trading Center Co.,
Ltd.
Transportation and related service 101,233,462.87 162,712,850.26
Other related parties —— 21,660,465.31 54,683,045.27
Ocean Network Express (China) Ltd. Transportation and related service 21,660,465.31 54,683,045.27
Total services accepted —— 751,665,795.26 941,462,120.02
X. RELATED-PARTY RELATIONSHIPS AND TRANSACTIONS (CONTINUED)
4. Related Party Transactions: (continued)(2) Related party transactions in the purchase and sale of goods, and the provision and
receipt of services (continued)
2) Provision of services (continued)
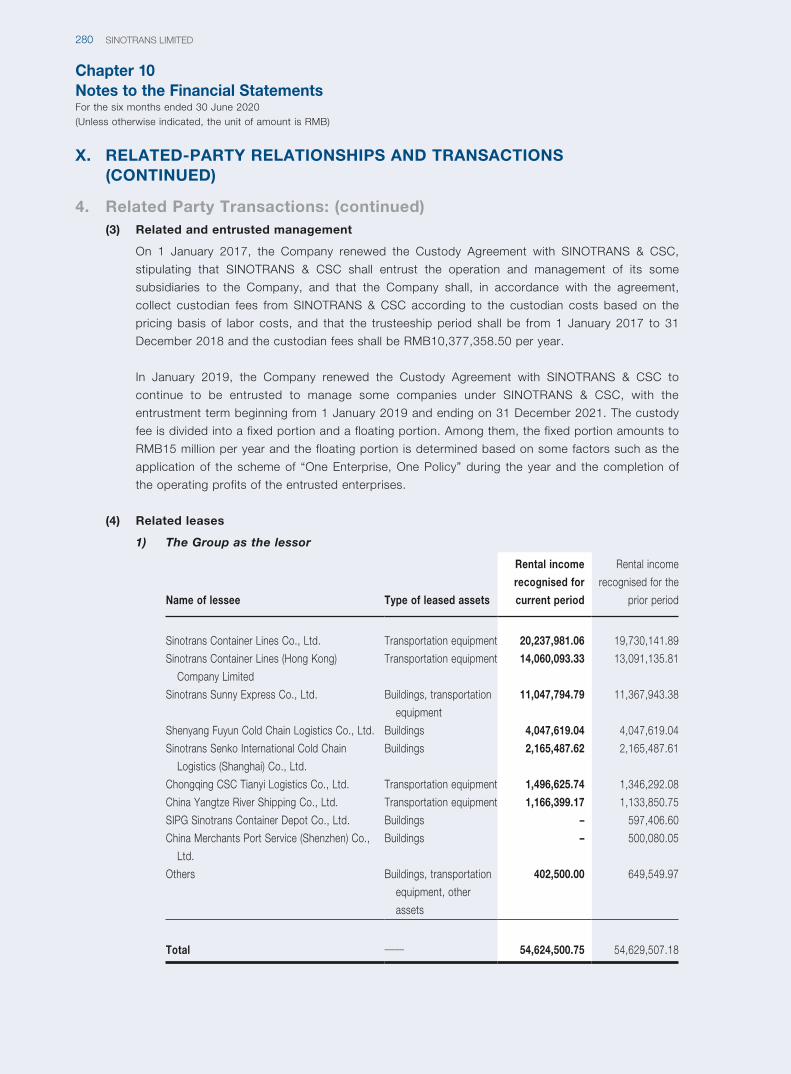
Chapter 10Notes to the Financial StatementsFor the six months ended 30 June 2020(Unless otherwise indicated, the unit of amount is RMB)
SINOTRANS LIMITED280
X. RELATED-PARTY RELATIONSHIPS AND TRANSACTIONS (CONTINUED)
4. Related Party Transactions: (continued)(3) Related and entrusted management
On 1 January 2017, the Company renewed the Custody Agreement with SINOTRANS & CSC,
stipulating that SINOTRANS & CSC shall entrust the operation and management of its some
subsidiaries to the Company, and that the Company shall, in accordance with the agreement,
collect custodian fees from SINOTRANS & CSC according to the custodian costs based on the
pricing basis of labor costs, and that the trusteeship period shall be from 1 January 2017 to 31
December 2018 and the custodian fees shall be RMB10,377,358.50 per year.
In January 2019, the Company renewed the Custody Agreement with SINOTRANS & CSC to
continue to be entrusted to manage some companies under SINOTRANS & CSC, with the
entrustment term beginning from 1 January 2019 and ending on 31 December 2021. The custody
fee is divided into a fixed portion and a floating portion. Among them, the fixed portion amounts to
RMB15 million per year and the floating portion is determined based on some factors such as the
application of the scheme of “One Enterprise, One Policy” during the year and the completion of
the operating profits of the entrusted enterprises.
(4) Related leases
1) The Group as the lessor
Name of lessee Type of leased assets
Rental income
recognised for
current period
Rental income
recognised for the
prior period
Sinotrans Container Lines Co., Ltd. Transportation equipment 20,237,981.06 19,730,141.89
Sinotrans Container Lines (Hong Kong)
Company Limited
Transportation equipment 14,060,093.33 13,091,135.81
Sinotrans Sunny Express Co., Ltd. Buildings, transportation
equipment
11,047,794.79 11,367,943.38
Shenyang Fuyun Cold Chain Logistics Co., Ltd. Buildings 4,047,619.04 4,047,619.04
Sinotrans Senko International Cold Chain
Logistics (Shanghai) Co., Ltd.
Buildings 2,165,487.62 2,165,487.61
Chongqing CSC Tianyi Logistics Co., Ltd. Transportation equipment 1,496,625.74 1,346,292.08
China Yangtze River Shipping Co., Ltd. Transportation equipment 1,166,399.17 1,133,850.75
SIPG Sinotrans Container Depot Co., Ltd. Buildings – 597,406.60
China Merchants Port Service (Shenzhen) Co.,
Ltd.
Buildings – 500,080.05
Others Buildings, transportation
equipment, other
assets
402,500.00 649,549.97
Total —— 54,624,500.75 54,629,507.18
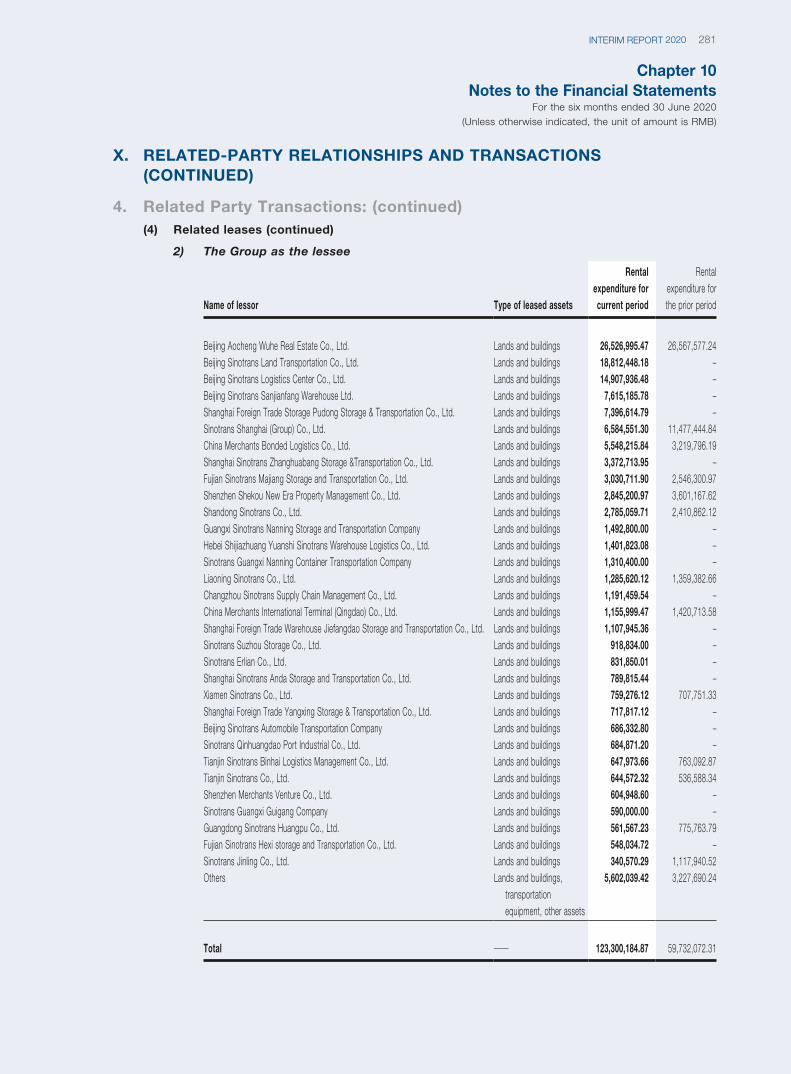
Chapter 10Notes to the Financial Statements
For the six months ended 30 June 2020(Unless otherwise indicated, the unit of amount is RMB)
281INTERIM REPORT 2020
X. RELATED-PARTY RELATIONSHIPS AND TRANSACTIONS (CONTINUED)
4. Related Party Transactions: (continued)(4) Related leases (continued)
2) The Group as the lessee
Name of lessor Type of leased assets
Rental expenditure for current period
Rental expenditure for the prior period
Beijing Aocheng Wuhe Real Estate Co., Ltd. Lands and buildings 26,526,995.47 26,567,577.24Beijing Sinotrans Land Transportation Co., Ltd. Lands and buildings 18,812,448.18 –Beijing Sinotrans Logistics Center Co., Ltd. Lands and buildings 14,907,936.48 –Beijing Sinotrans Sanjianfang Warehouse Ltd. Lands and buildings 7,615,185.78 –Shanghai Foreign Trade Storage Pudong Storage & Transportation Co., Ltd. Lands and buildings 7,396,614.79 –Sinotrans Shanghai (Group) Co., Ltd. Lands and buildings 6,584,551.30 11,477,444.84China Merchants Bonded Logistics Co., Ltd. Lands and buildings 5,548,215.84 3,219,796.19Shanghai Sinotrans Zhanghuabang Storage &Transportation Co., Ltd. Lands and buildings 3,372,713.95 –Fujian Sinotrans Majiang Storage and Transportation Co., Ltd. Lands and buildings 3,030,711.90 2,546,300.97Shenzhen Shekou New Era Property Management Co., Ltd. Lands and buildings 2,845,200.97 3,601,167.62Shandong Sinotrans Co., Ltd. Lands and buildings 2,785,059.71 2,410,862.12Guangxi Sinotrans Nanning Storage and Transportation Company Lands and buildings 1,492,800.00 –Hebei Shijiazhuang Yuanshi Sinotrans Warehouse Logistics Co., Ltd. Lands and buildings 1,401,823.08 –Sinotrans Guangxi Nanning Container Transportation Company Lands and buildings 1,310,400.00 –Liaoning Sinotrans Co., Ltd. Lands and buildings 1,285,620.12 1,359,382.66Changzhou Sinotrans Supply Chain Management Co., Ltd. Lands and buildings 1,191,459.54 –China Merchants International Terminal (Qingdao) Co., Ltd. Lands and buildings 1,155,999.47 1,420,713.58Shanghai Foreign Trade Warehouse Jiefangdao Storage and Transportation Co., Ltd. Lands and buildings 1,107,945.36 –Sinotrans Suzhou Storage Co., Ltd. Lands and buildings 918,834.00 –Sinotrans Erlian Co., Ltd. Lands and buildings 831,850.01 –Shanghai Sinotrans Anda Storage and Transportation Co., Ltd. Lands and buildings 789,815.44 –Xiamen Sinotrans Co., Ltd. Lands and buildings 759,276.12 707,751.33Shanghai Foreign Trade Yangxing Storage & Transportation Co., Ltd. Lands and buildings 717,817.12 –Beijing Sinotrans Automobile Transportation Company Lands and buildings 686,332.80 –Sinotrans Qinhuangdao Port Industrial Co., Ltd. Lands and buildings 684,871.20 –Tianjin Sinotrans Binhai Logistics Management Co., Ltd. Lands and buildings 647,973.66 763,092.87Tianjin Sinotrans Co., Ltd. Lands and buildings 644,572.32 536,588.34Shenzhen Merchants Venture Co., Ltd. Lands and buildings 604,948.60 –Sinotrans Guangxi Guigang Company Lands and buildings 590,000.00 –Guangdong Sinotrans Huangpu Co., Ltd. Lands and buildings 561,567.23 775,763.79Fujian Sinotrans Hexi storage and Transportation Co., Ltd. Lands and buildings 548,034.72 –Sinotrans Jinling Co., Ltd. Lands and buildings 340,570.29 1,117,940.52Others Lands and buildings,
transportation equipment, other assets
5,602,039.42 3,227,690.24
Total —— 123,300,184.87 59,732,072.31
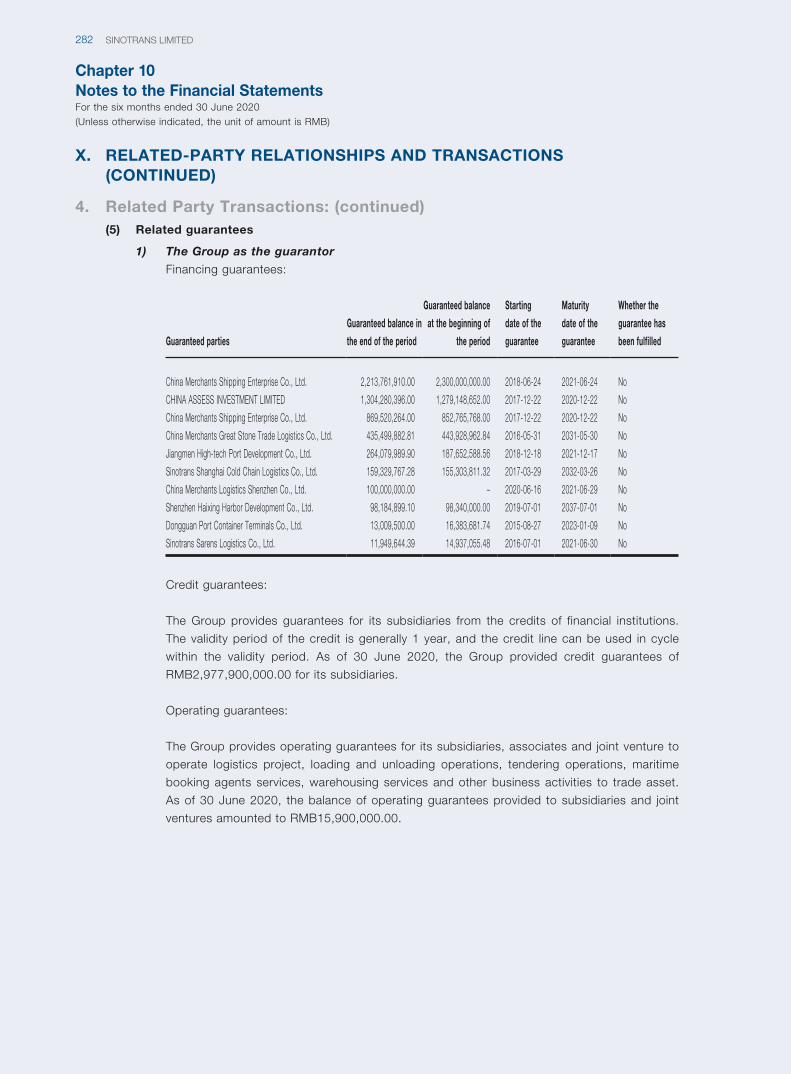
Chapter 10Notes to the Financial StatementsFor the six months ended 30 June 2020(Unless otherwise indicated, the unit of amount is RMB)
SINOTRANS LIMITED282
X. RELATED-PARTY RELATIONSHIPS AND TRANSACTIONS (CONTINUED)
4. Related Party Transactions: (continued)(5) Related guarantees
1) The Group as the guarantor
Financing guarantees:
Guaranteed parties
Guaranteed balance in
the end of the period
Guaranteed balance
at the beginning of
the period
Starting
date of the
guarantee
Maturity
date of the
guarantee
Whether the
guarantee has
been fulfilled
China Merchants Shipping Enterprise Co., Ltd. 2,213,761,910.00 2,300,000,000.00 2018-06-24 2021-06-24 No
CHINA ASSESS INVESTMENT LIMITED 1,304,280,396.00 1,279,148,652.00 2017-12-22 2020-12-22 No
China Merchants Shipping Enterprise Co., Ltd. 869,520,264.00 852,765,768.00 2017-12-22 2020-12-22 No
China Merchants Great Stone Trade Logistics Co., Ltd. 435,499,882.81 443,928,962.84 2016-05-31 2031-05-30 No
Jiangmen High-tech Port Development Co., Ltd. 264,079,989.90 187,652,588.56 2018-12-18 2021-12-17 No
Sinotrans Shanghai Cold Chain Logistics Co., Ltd. 159,329,767.28 155,303,811.32 2017-03-29 2032-03-26 No
China Merchants Logistics Shenzhen Co., Ltd. 100,000,000.00 – 2020-06-16 2021-06-29 No
Shenzhen Haixing Harbor Development Co., Ltd. 98,184,899.10 98,340,000.00 2019-07-01 2037-07-01 No
Dongguan Port Container Terminals Co., Ltd. 13,009,500.00 16,383,681.74 2015-08-27 2023-01-09 No
Sinotrans Sarens Logistics Co., Ltd. 11,949,644.39 14,937,055.48 2016-07-01 2021-06-30 No
Credit guarantees:
The Group provides guarantees for its subsidiaries from the credits of financial institutions.
The validity period of the credit is generally 1 year, and the credit line can be used in cycle
within the validity period. As of 30 June 2020, the Group provided credit guarantees of
RMB2,977,900,000.00 for its subsidiaries.
Operating guarantees:
The Group provides operating guarantees for its subsidiaries, associates and joint venture to
operate logistics project, loading and unloading operations, tendering operations, maritime
booking agents services, warehousing services and other business activities to trade asset.
As of 30 June 2020, the balance of operating guarantees provided to subsidiaries and joint
ventures amounted to RMB15,900,000.00.
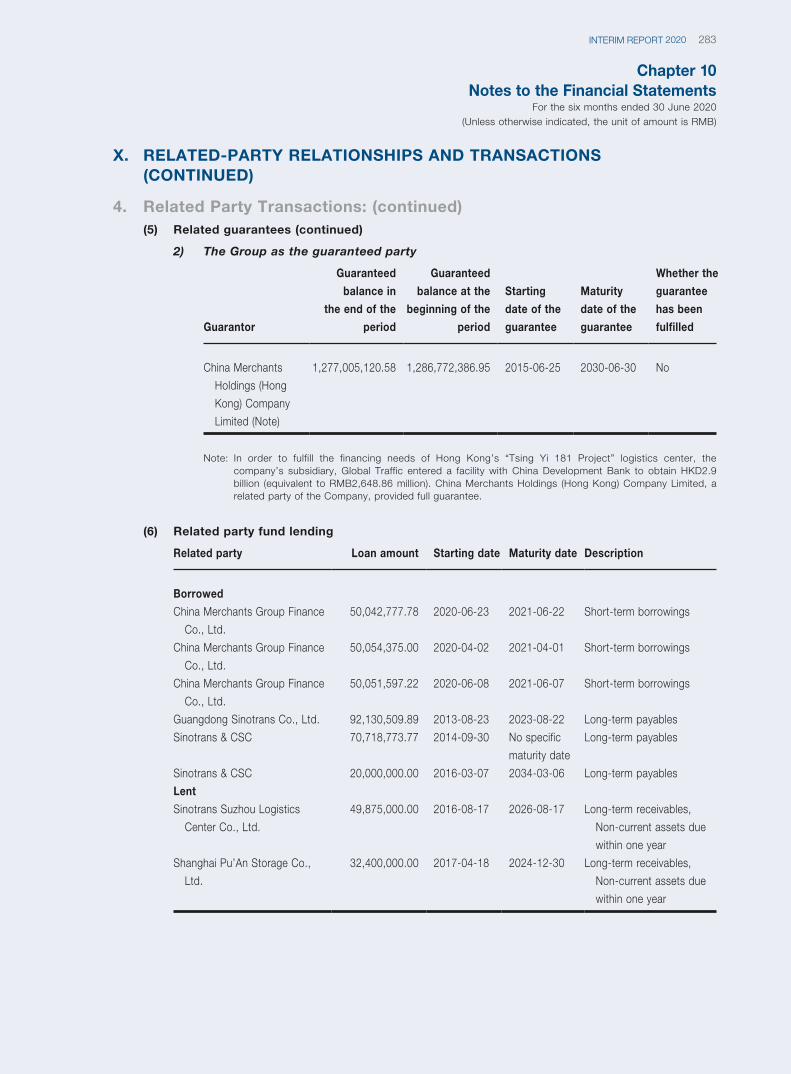
Chapter 10Notes to the Financial Statements
For the six months ended 30 June 2020(Unless otherwise indicated, the unit of amount is RMB)
283INTERIM REPORT 2020
X. RELATED-PARTY RELATIONSHIPS AND TRANSACTIONS (CONTINUED)
4. Related Party Transactions: (continued)(5) Related guarantees (continued)
2) The Group as the guaranteed party
Guarantor
Guaranteed
balance in
the end of the
period
Guaranteed
balance at the
beginning of the
period
Starting
date of the
guarantee
Maturity
date of the
guarantee
Whether the
guarantee
has been
fulfilled
China Merchants
Holdings (Hong
Kong) Company
Limited (Note)
1,277,005,120.58 1,286,772,386.95 2015-06-25 2030-06-30 No
Note: In order to fulfill the financing needs of Hong Kong’s “Tsing Yi 181 Project” logistics center, the company’s subsidiary, Global Traffic entered a facility with China Development Bank to obtain HKD2.9 billion (equivalent to RMB2,648.86 million). China Merchants Holdings (Hong Kong) Company Limited, a related party of the Company, provided full guarantee.
(6) Related party fund lending
Related party Loan amount Starting date Maturity date Description
Borrowed
China Merchants Group Finance
Co., Ltd.
50,042,777.78 2020-06-23 2021-06-22 Short-term borrowings
China Merchants Group Finance
Co., Ltd.
50,054,375.00 2020-04-02 2021-04-01 Short-term borrowings
China Merchants Group Finance
Co., Ltd.
50,051,597.22 2020-06-08 2021-06-07 Short-term borrowings
Guangdong Sinotrans Co., Ltd. 92,130,509.89 2013-08-23 2023-08-22 Long-term payables
Sinotrans & CSC 70,718,773.77 2014-09-30 No specific
maturity date
Long-term payables
Sinotrans & CSC 20,000,000.00 2016-03-07 2034-03-06 Long-term payables
Lent
Sinotrans Suzhou Logistics
Center Co., Ltd.
49,875,000.00 2016-08-17 2026-08-17 Long-term receivables,
Non-current assets due
within one year
Shanghai Pu’An Storage Co.,
Ltd.
32,400,000.00 2017-04-18 2024-12-30 Long-term receivables,
Non-current assets due
within one year
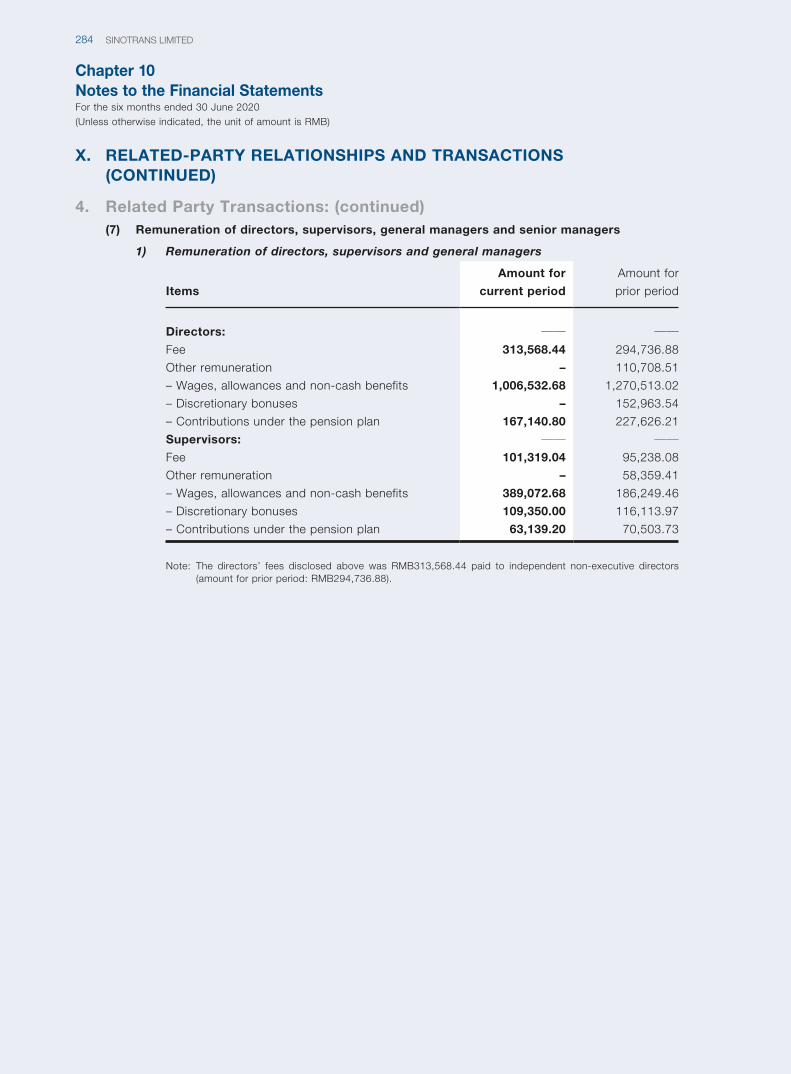
Chapter 10Notes to the Financial StatementsFor the six months ended 30 June 2020(Unless otherwise indicated, the unit of amount is RMB)
SINOTRANS LIMITED284
X. RELATED-PARTY RELATIONSHIPS AND TRANSACTIONS (CONTINUED)
4. Related Party Transactions: (continued)(7) Remuneration of directors, supervisors, general managers and senior managers
1) Remuneration of directors, supervisors and general managers
Items
Amount for
current period
Amount for
prior period
Directors: —— ——Fee 313,568.44 294,736.88
Other remuneration – 110,708.51
– Wages, allowances and non-cash benefits 1,006,532.68 1,270,513.02
– Discretionary bonuses – 152,963.54
– Contributions under the pension plan 167,140.80 227,626.21
Supervisors: —— ——Fee 101,319.04 95,238.08
Other remuneration – 58,359.41
– Wages, allowances and non-cash benefits 389,072.68 186,249.46
– Discretionary bonuses 109,350.00 116,113.97
– Contributions under the pension plan 63,139.20 70,503.73
Note: The directors’ fees disclosed above was RMB313,568.44 paid to independent non-executive directors (amount for prior period: RMB294,736.88).
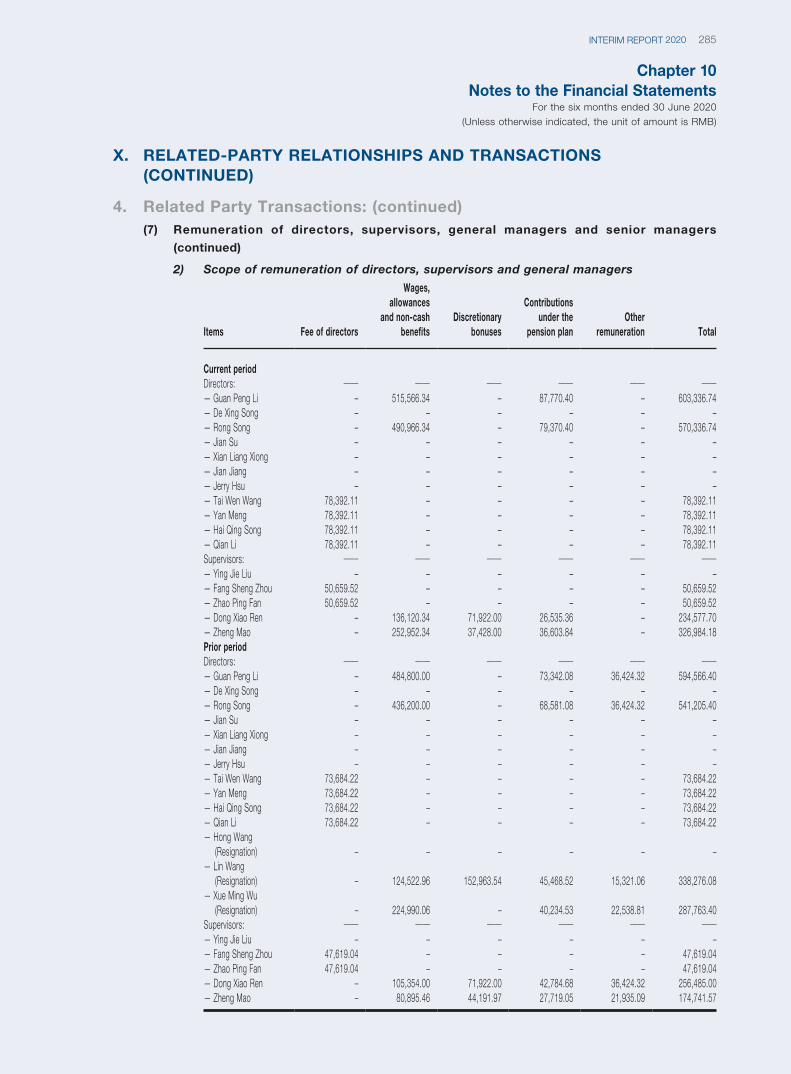
Chapter 10Notes to the Financial Statements
For the six months ended 30 June 2020(Unless otherwise indicated, the unit of amount is RMB)
285INTERIM REPORT 2020
X. RELATED-PARTY RELATIONSHIPS AND TRANSACTIONS (CONTINUED)
4. Related Party Transactions: (continued)(7) Remuneration of directors, supervisors, general managers and senior managers
(continued)
2) Scope of remuneration of directors, supervisors and general managers
Items Fee of directors
Wages, allowances
and non-cash benefits
Discretionary bonuses
Contributions under the
pension planOther
remuneration Total
Current periodDirectors: —— —— —— —— —— ——— Guan Peng Li – 515,566.34 – 87,770.40 – 603,336.74— De Xing Song – – – – – –— Rong Song – 490,966.34 – 79,370.40 – 570,336.74— Jian Su – – – – – –— Xian Liang Xiong – – – – – –— Jian Jiang – – – – – –— Jerry Hsu – – – – – –— Tai Wen Wang 78,392.11 – – – – 78,392.11— Yan Meng 78,392.11 – – – – 78,392.11— Hai Qing Song 78,392.11 – – – – 78,392.11— Qian Li 78,392.11 – – – – 78,392.11Supervisors: —— —— —— —— —— ——— Ying Jie Liu – – – – – –— Fang Sheng Zhou 50,659.52 – – – – 50,659.52— Zhao Ping Fan 50,659.52 – – – – 50,659.52— Dong Xiao Ren – 136,120.34 71,922.00 26,535.36 – 234,577.70— Zheng Mao – 252,952.34 37,428.00 36,603.84 – 326,984.18Prior periodDirectors: —— —— —— —— —— ——— Guan Peng Li – 484,800.00 – 73,342.08 36,424.32 594,566.40— De Xing Song – – – – – –— Rong Song – 436,200.00 – 68,581.08 36,424.32 541,205.40— Jian Su – – – – – –— Xian Liang Xiong – – – – – –— Jian Jiang – – – – – –— Jerry Hsu – – – – – –— Tai Wen Wang 73,684.22 – – – – 73,684.22— Yan Meng 73,684.22 – – – – 73,684.22— Hai Qing Song 73,684.22 – – – – 73,684.22— Qian Li 73,684.22 – – – – 73,684.22— Hong Wang
(Resignation) – – – – – –— Lin Wang
(Resignation) – 124,522.96 152,963.54 45,468.52 15,321.06 338,276.08— Xue Ming Wu
(Resignation) – 224,990.06 – 40,234.53 22,538.81 287,763.40Supervisors: —— —— —— —— —— ——— Ying Jie Liu – – – – – –— Fang Sheng Zhou 47,619.04 – – – – 47,619.04— Zhao Ping Fan 47,619.04 – – – – 47,619.04— Dong Xiao Ren – 105,354.00 71,922.00 42,784.68 36,424.32 256,485.00— Zheng Mao – 80,895.46 44,191.97 27,719.05 21,935.09 174,741.57
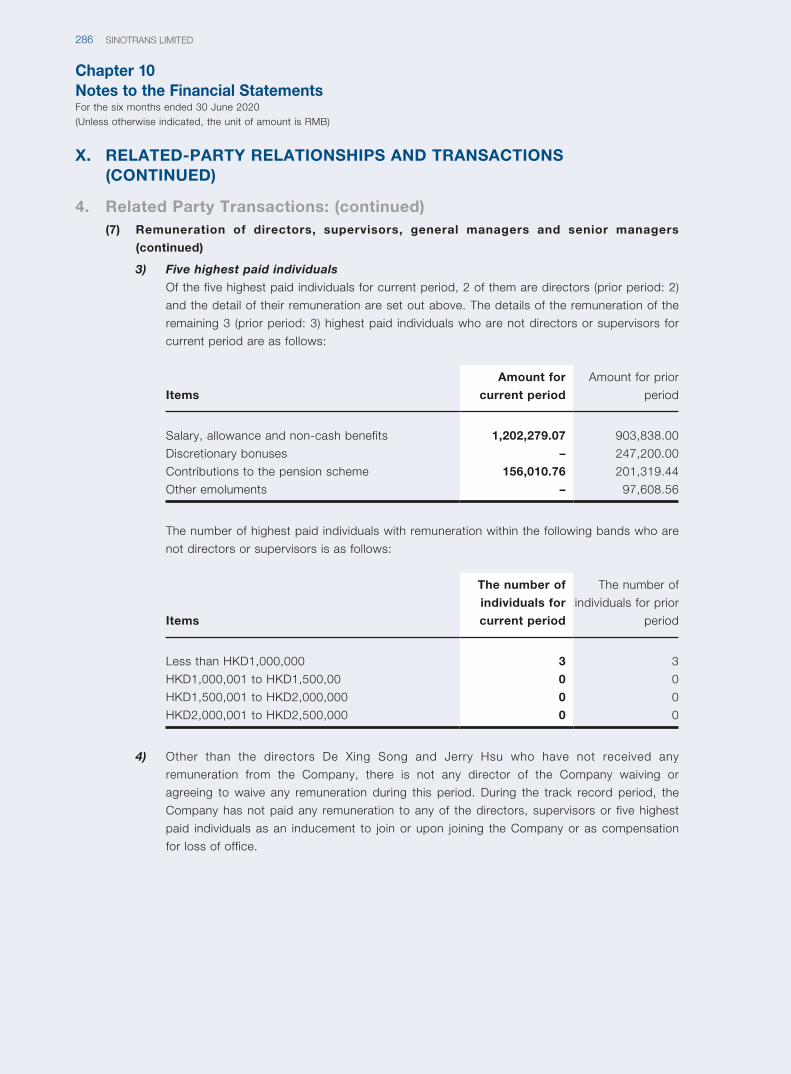
Chapter 10Notes to the Financial StatementsFor the six months ended 30 June 2020(Unless otherwise indicated, the unit of amount is RMB)
SINOTRANS LIMITED286
X. RELATED-PARTY RELATIONSHIPS AND TRANSACTIONS (CONTINUED)
4. Related Party Transactions: (continued)(7) Remuneration of directors, supervisors, general managers and senior managers
(continued)
3) Five highest paid individuals
Of the five highest paid individuals for current period, 2 of them are directors (prior period: 2)
and the detail of their remuneration are set out above. The details of the remuneration of the
remaining 3 (prior period: 3) highest paid individuals who are not directors or supervisors for
current period are as follows:
Items
Amount for
current period
Amount for prior
period
Salary, allowance and non-cash benefits 1,202,279.07 903,838.00
Discretionary bonuses – 247,200.00
Contributions to the pension scheme 156,010.76 201,319.44
Other emoluments – 97,608.56
The number of highest paid individuals with remuneration within the following bands who are
not directors or supervisors is as follows:
Items
The number of
individuals for
current period
The number of
individuals for prior
period
Less than HKD1,000,000 3 3
HKD1,000,001 to HKD1,500,00 0 0
HKD1,500,001 to HKD2,000,000 0 0
HKD2,000,001 to HKD2,500,000 0 0
4) Other than the directors De Xing Song and Jerry Hsu who have not received any
remuneration from the Company, there is not any director of the Company waiving or
agreeing to waive any remuneration during this period. During the track record period, the
Company has not paid any remuneration to any of the directors, supervisors or five highest
paid individuals as an inducement to join or upon joining the Company or as compensation
for loss of office.
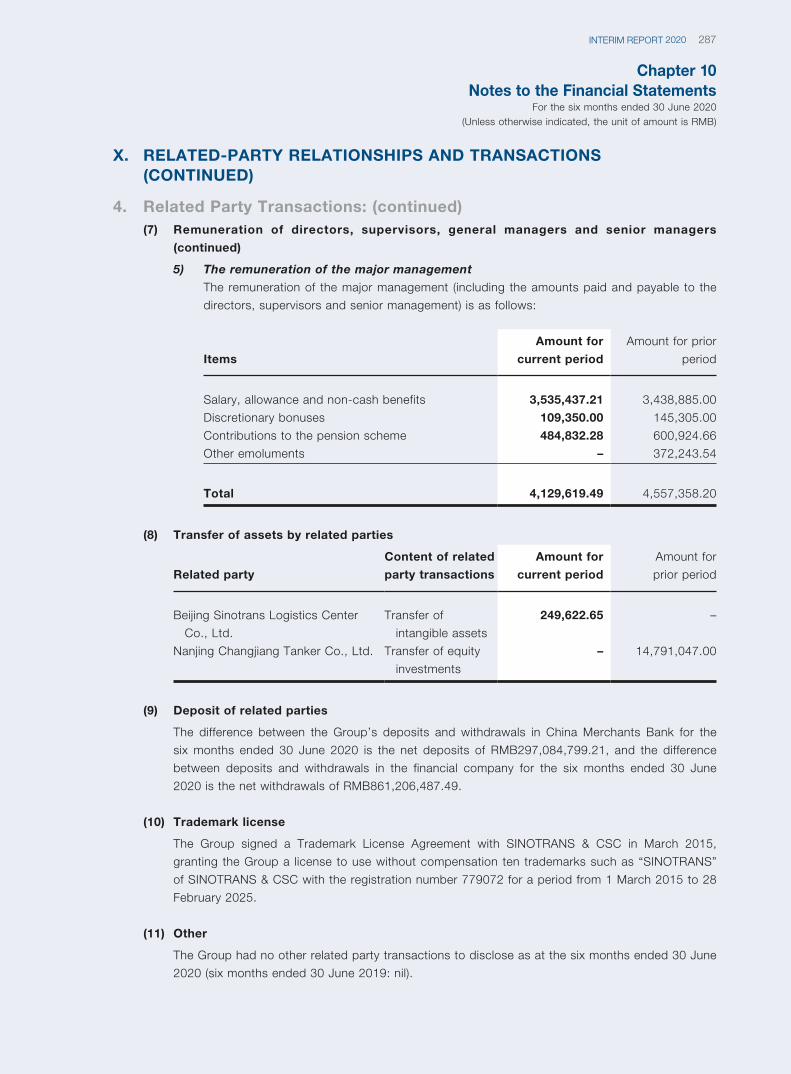
Chapter 10Notes to the Financial Statements
For the six months ended 30 June 2020(Unless otherwise indicated, the unit of amount is RMB)
287INTERIM REPORT 2020
X. RELATED-PARTY RELATIONSHIPS AND TRANSACTIONS (CONTINUED)
4. Related Party Transactions: (continued)(7) Remuneration of directors, supervisors, general managers and senior managers
(continued)
5) The remuneration of the major management
The remuneration of the major management (including the amounts paid and payable to the
directors, supervisors and senior management) is as follows:
Items
Amount for
current period
Amount for prior
period
Salary, allowance and non-cash benefits 3,535,437.21 3,438,885.00
Discretionary bonuses 109,350.00 145,305.00
Contributions to the pension scheme 484,832.28 600,924.66
Other emoluments – 372,243.54
Total 4,129,619.49 4,557,358.20
(8) Transfer of assets by related parties
Related party
Content of related
party transactions
Amount for
current period
Amount for
prior period
Beijing Sinotrans Logistics Center
Co., Ltd.
Transfer of
intangible assets
249,622.65 –
Nanjing Changjiang Tanker Co., Ltd. Transfer of equity
investments
– 14,791,047.00
(9) Deposit of related parties
The difference between the Group’s deposits and withdrawals in China Merchants Bank for the
six months ended 30 June 2020 is the net deposits of RMB297,084,799.21, and the difference
between deposits and withdrawals in the financial company for the six months ended 30 June
2020 is the net withdrawals of RMB861,206,487.49.
(10) Trademark license
The Group signed a Trademark License Agreement with SINOTRANS & CSC in March 2015,
granting the Group a license to use without compensation ten trademarks such as “SINOTRANS”
of SINOTRANS & CSC with the registration number 779072 for a period from 1 March 2015 to 28
February 2025.
(11) Other
The Group had no other related party transactions to disclose as at the six months ended 30 June
2020 (six months ended 30 June 2019: nil).
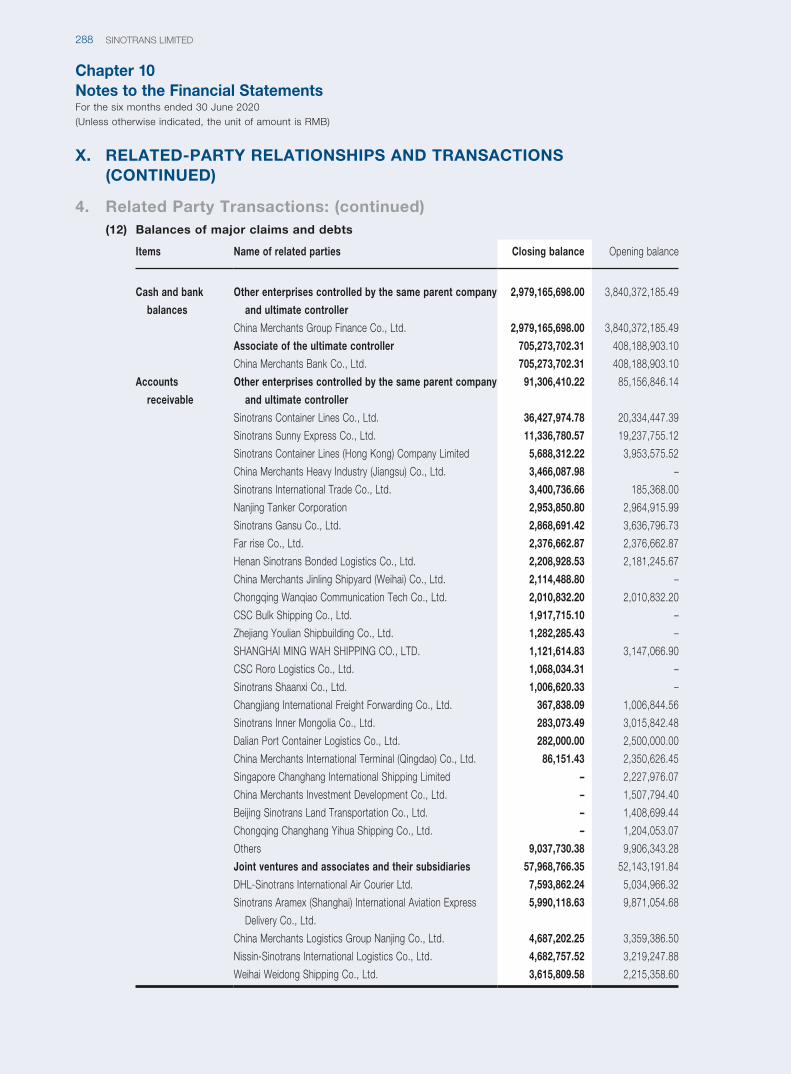
Chapter 10Notes to the Financial StatementsFor the six months ended 30 June 2020(Unless otherwise indicated, the unit of amount is RMB)
SINOTRANS LIMITED288
X. RELATED-PARTY RELATIONSHIPS AND TRANSACTIONS (CONTINUED)
4. Related Party Transactions: (continued)(12) Balances of major claims and debts
Items Name of related parties Closing balance Opening balance
Cash and bank
balances
Other enterprises controlled by the same parent company
and ultimate controller
2,979,165,698.00 3,840,372,185.49
China Merchants Group Finance Co., Ltd. 2,979,165,698.00 3,840,372,185.49
Associate of the ultimate controller 705,273,702.31 408,188,903.10
China Merchants Bank Co., Ltd. 705,273,702.31 408,188,903.10
Accounts
receivable
Other enterprises controlled by the same parent company
and ultimate controller
91,306,410.22 85,156,846.14
Sinotrans Container Lines Co., Ltd. 36,427,974.78 20,334,447.39
Sinotrans Sunny Express Co., Ltd. 11,336,780.57 19,237,755.12
Sinotrans Container Lines (Hong Kong) Company Limited 5,688,312.22 3,953,575.52
China Merchants Heavy Industry (Jiangsu) Co., Ltd. 3,466,087.98 –
Sinotrans International Trade Co., Ltd. 3,400,736.66 185,368.00
Nanjing Tanker Corporation 2,953,850.80 2,964,915.99
Sinotrans Gansu Co., Ltd. 2,868,691.42 3,636,796.73
Far rise Co., Ltd. 2,376,662.87 2,376,662.87
Henan Sinotrans Bonded Logistics Co., Ltd. 2,208,928.53 2,181,245.67
China Merchants Jinling Shipyard (Weihai) Co., Ltd. 2,114,488.80 –
Chongqing Wanqiao Communication Tech Co., Ltd. 2,010,832.20 2,010,832.20
CSC Bulk Shipping Co., Ltd. 1,917,715.10 –
Zhejiang Youlian Shipbuilding Co., Ltd. 1,282,285.43 –
SHANGHAI MING WAH SHIPPING CO., LTD. 1,121,614.83 3,147,066.90
CSC Roro Logistics Co., Ltd. 1,068,034.31 –
Sinotrans Shaanxi Co., Ltd. 1,006,620.33 –
Changjiang International Freight Forwarding Co., Ltd. 367,838.09 1,006,844.56
Sinotrans Inner Mongolia Co., Ltd. 283,073.49 3,015,842.48
Dalian Port Container Logistics Co., Ltd. 282,000.00 2,500,000.00
China Merchants International Terminal (Qingdao) Co., Ltd. 86,151.43 2,350,626.45
Singapore Changhang International Shipping Limited – 2,227,976.07
China Merchants Investment Development Co., Ltd. – 1,507,794.40
Beijing Sinotrans Land Transportation Co., Ltd. – 1,408,699.44
Chongqing Changhang Yihua Shipping Co., Ltd. – 1,204,053.07
Others 9,037,730.38 9,906,343.28
Joint ventures and associates and their subsidiaries 57,968,766.35 52,143,191.84
DHL-Sinotrans International Air Courier Ltd. 7,593,862.24 5,034,966.32
Sinotrans Aramex (Shanghai) International Aviation Express
Delivery Co., Ltd.
5,990,118.63 9,871,054.68
China Merchants Logistics Group Nanjing Co., Ltd. 4,687,202.25 3,359,386.50
Nissin-Sinotrans International Logistics Co., Ltd. 4,682,757.52 3,219,247.88
Weihai Weidong Shipping Co., Ltd. 3,615,809.58 2,215,358.60
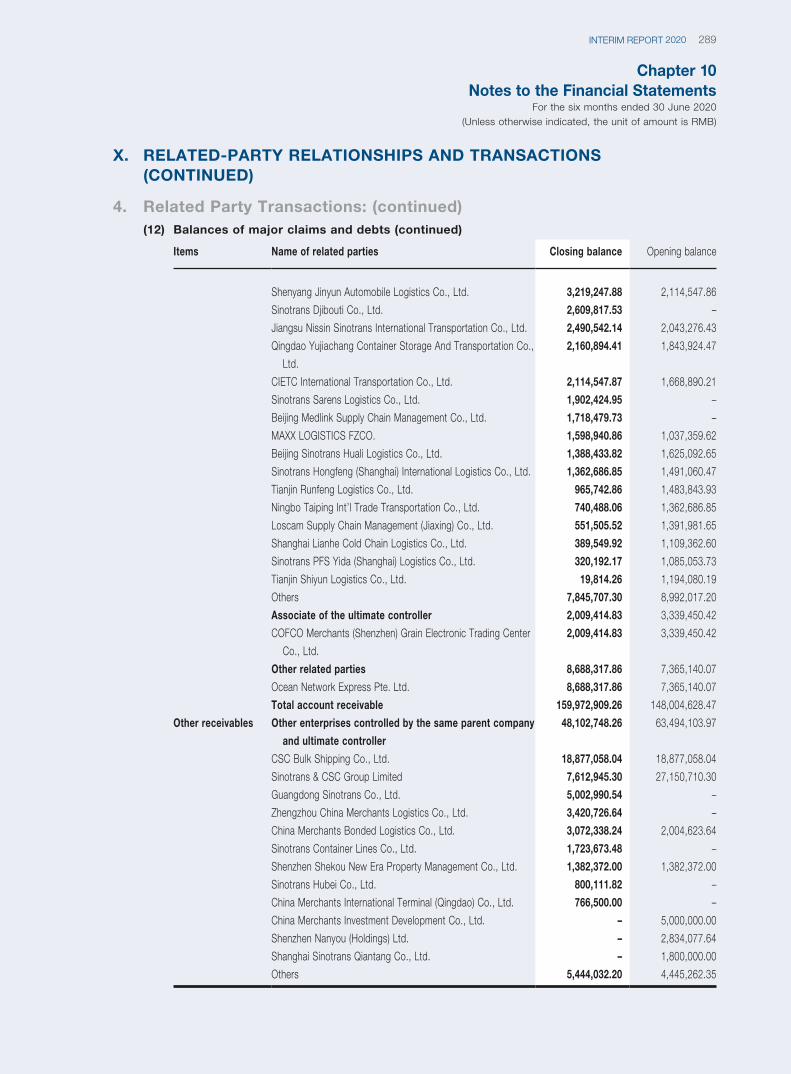
Chapter 10Notes to the Financial Statements
For the six months ended 30 June 2020(Unless otherwise indicated, the unit of amount is RMB)
289INTERIM REPORT 2020
Items Name of related parties Closing balance Opening balance
Shenyang Jinyun Automobile Logistics Co., Ltd. 3,219,247.88 2,114,547.86
Sinotrans Djibouti Co., Ltd. 2,609,817.53 –
Jiangsu Nissin Sinotrans International Transportation Co., Ltd. 2,490,542.14 2,043,276.43
Qingdao Yujiachang Container Storage And Transportation Co.,
Ltd.
2,160,894.41 1,843,924.47
CIETC International Transportation Co., Ltd. 2,114,547.87 1,668,890.21
Sinotrans Sarens Logistics Co., Ltd. 1,902,424.95 –
Beijing Medlink Supply Chain Management Co., Ltd. 1,718,479.73 –
MAXX LOGISTICS FZCO. 1,598,940.86 1,037,359.62
Beijing Sinotrans Huali Logistics Co., Ltd. 1,388,433.82 1,625,092.65
Sinotrans Hongfeng (Shanghai) International Logistics Co., Ltd. 1,362,686.85 1,491,060.47
Tianjin Runfeng Logistics Co., Ltd. 965,742.86 1,483,843.93
Ningbo Taiping Int’l Trade Transportation Co., Ltd. 740,488.06 1,362,686.85
Loscam Supply Chain Management (Jiaxing) Co., Ltd. 551,505.52 1,391,981.65
Shanghai Lianhe Cold Chain Logistics Co., Ltd. 389,549.92 1,109,362.60
Sinotrans PFS Yida (Shanghai) Logistics Co., Ltd. 320,192.17 1,085,053.73
Tianjin Shiyun Logistics Co., Ltd. 19,814.26 1,194,080.19
Others 7,845,707.30 8,992,017.20
Associate of the ultimate controller 2,009,414.83 3,339,450.42
COFCO Merchants (Shenzhen) Grain Electronic Trading Center
Co., Ltd.
2,009,414.83 3,339,450.42
Other related parties 8,688,317.86 7,365,140.07
Ocean Network Express Pte. Ltd. 8,688,317.86 7,365,140.07
Total account receivable 159,972,909.26 148,004,628.47
Other receivables Other enterprises controlled by the same parent company
and ultimate controller
48,102,748.26 63,494,103.97
CSC Bulk Shipping Co., Ltd. 18,877,058.04 18,877,058.04
Sinotrans & CSC Group Limited 7,612,945.30 27,150,710.30
Guangdong Sinotrans Co., Ltd. 5,002,990.54 –
Zhengzhou China Merchants Logistics Co., Ltd. 3,420,726.64 –
China Merchants Bonded Logistics Co., Ltd. 3,072,338.24 2,004,623.64
Sinotrans Container Lines Co., Ltd. 1,723,673.48 –
Shenzhen Shekou New Era Property Management Co., Ltd. 1,382,372.00 1,382,372.00
Sinotrans Hubei Co., Ltd. 800,111.82 –
China Merchants International Terminal (Qingdao) Co., Ltd. 766,500.00 –
China Merchants Investment Development Co., Ltd. – 5,000,000.00
Shenzhen Nanyou (Holdings) Ltd. – 2,834,077.64
Shanghai Sinotrans Qiantang Co., Ltd. – 1,800,000.00
Others 5,444,032.20 4,445,262.35
X. RELATED-PARTY RELATIONSHIPS AND TRANSACTIONS (CONTINUED)
4. Related Party Transactions: (continued)(12) Balances of major claims and debts (continued)
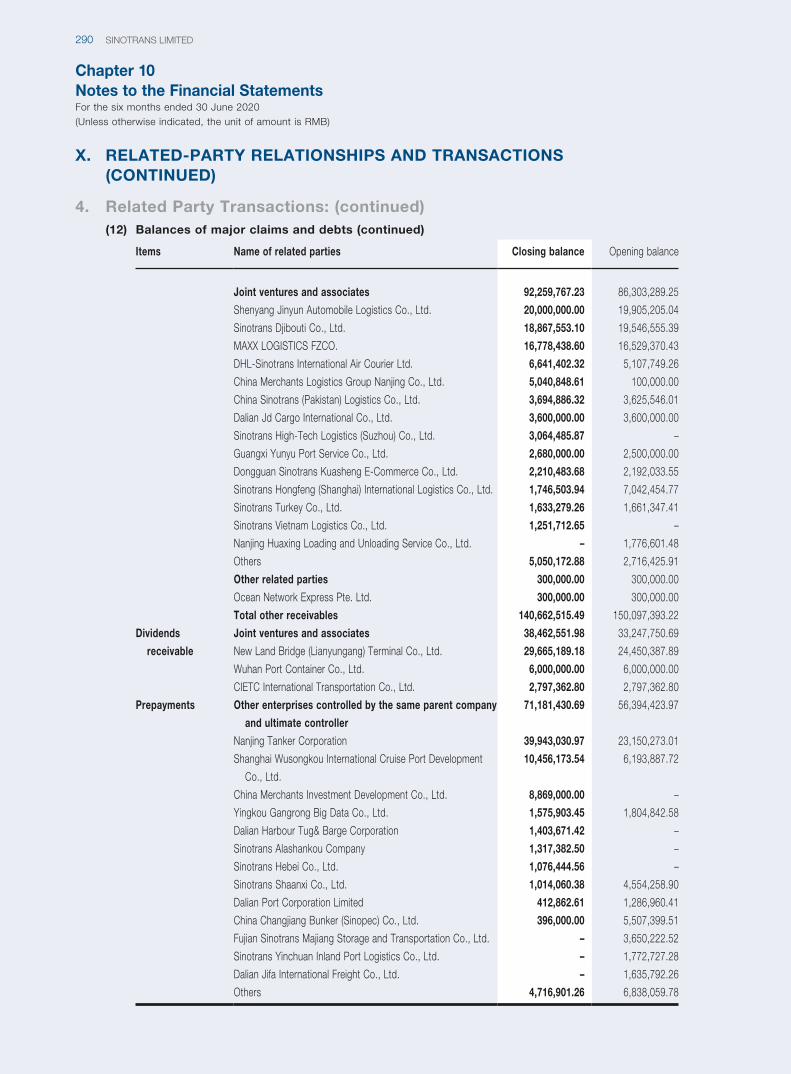
Chapter 10Notes to the Financial StatementsFor the six months ended 30 June 2020(Unless otherwise indicated, the unit of amount is RMB)
SINOTRANS LIMITED290
Items Name of related parties Closing balance Opening balance
Joint ventures and associates 92,259,767.23 86,303,289.25
Shenyang Jinyun Automobile Logistics Co., Ltd. 20,000,000.00 19,905,205.04
Sinotrans Djibouti Co., Ltd. 18,867,553.10 19,546,555.39
MAXX LOGISTICS FZCO. 16,778,438.60 16,529,370.43
DHL-Sinotrans International Air Courier Ltd. 6,641,402.32 5,107,749.26
China Merchants Logistics Group Nanjing Co., Ltd. 5,040,848.61 100,000.00
China Sinotrans (Pakistan) Logistics Co., Ltd. 3,694,886.32 3,625,546.01
Dalian Jd Cargo International Co., Ltd. 3,600,000.00 3,600,000.00
Sinotrans High-Tech Logistics (Suzhou) Co., Ltd. 3,064,485.87 –
Guangxi Yunyu Port Service Co., Ltd. 2,680,000.00 2,500,000.00
Dongguan Sinotrans Kuasheng E-Commerce Co., Ltd. 2,210,483.68 2,192,033.55
Sinotrans Hongfeng (Shanghai) International Logistics Co., Ltd. 1,746,503.94 7,042,454.77
Sinotrans Turkey Co., Ltd. 1,633,279.26 1,661,347.41
Sinotrans Vietnam Logistics Co., Ltd. 1,251,712.65 –
Nanjing Huaxing Loading and Unloading Service Co., Ltd. – 1,776,601.48
Others 5,050,172.88 2,716,425.91
Other related parties 300,000.00 300,000.00
Ocean Network Express Pte. Ltd. 300,000.00 300,000.00
Total other receivables 140,662,515.49 150,097,393.22
Dividends
receivable
Joint ventures and associates 38,462,551.98 33,247,750.69
New Land Bridge (Lianyungang) Terminal Co., Ltd. 29,665,189.18 24,450,387.89
Wuhan Port Container Co., Ltd. 6,000,000.00 6,000,000.00
CIETC International Transportation Co., Ltd. 2,797,362.80 2,797,362.80
Prepayments Other enterprises controlled by the same parent company
and ultimate controller
71,181,430.69 56,394,423.97
Nanjing Tanker Corporation 39,943,030.97 23,150,273.01
Shanghai Wusongkou International Cruise Port Development
Co., Ltd.
10,456,173.54 6,193,887.72
China Merchants Investment Development Co., Ltd. 8,869,000.00 –
Yingkou Gangrong Big Data Co., Ltd. 1,575,903.45 1,804,842.58
Dalian Harbour Tug& Barge Corporation 1,403,671.42 –
Sinotrans Alashankou Company 1,317,382.50 –
Sinotrans Hebei Co., Ltd. 1,076,444.56 –
Sinotrans Shaanxi Co., Ltd. 1,014,060.38 4,554,258.90
Dalian Port Corporation Limited 412,862.61 1,286,960.41
China Changjiang Bunker (Sinopec) Co., Ltd. 396,000.00 5,507,399.51
Fujian Sinotrans Majiang Storage and Transportation Co., Ltd. – 3,650,222.52
Sinotrans Yinchuan Inland Port Logistics Co., Ltd. – 1,772,727.28
Dalian Jifa International Freight Co., Ltd. – 1,635,792.26
Others 4,716,901.26 6,838,059.78
X. RELATED-PARTY RELATIONSHIPS AND TRANSACTIONS (CONTINUED)
4. Related Party Transactions: (continued)(12) Balances of major claims and debts (continued)
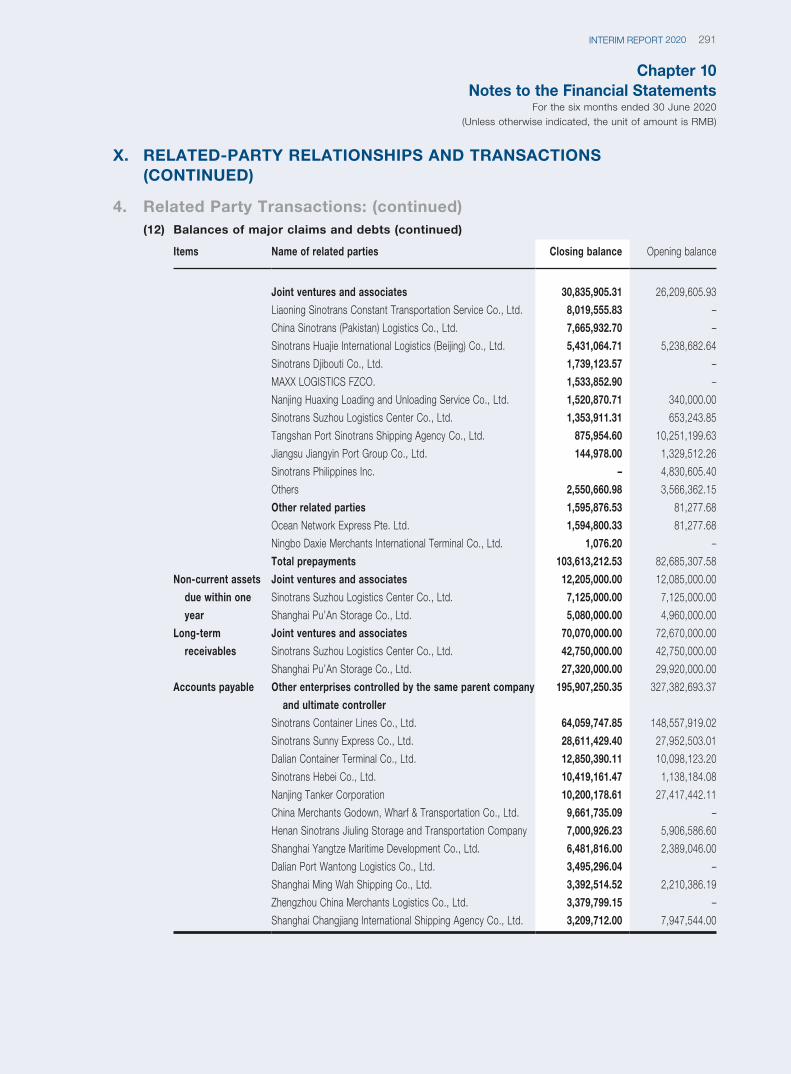
Chapter 10Notes to the Financial Statements
For the six months ended 30 June 2020(Unless otherwise indicated, the unit of amount is RMB)
291INTERIM REPORT 2020
Items Name of related parties Closing balance Opening balance
Joint ventures and associates 30,835,905.31 26,209,605.93
Liaoning Sinotrans Constant Transportation Service Co., Ltd. 8,019,555.83 –
China Sinotrans (Pakistan) Logistics Co., Ltd. 7,665,932.70 –
Sinotrans Huajie International Logistics (Beijing) Co., Ltd. 5,431,064.71 5,238,682.64
Sinotrans Djibouti Co., Ltd. 1,739,123.57 –
MAXX LOGISTICS FZCO. 1,533,852.90 –
Nanjing Huaxing Loading and Unloading Service Co., Ltd. 1,520,870.71 340,000.00
Sinotrans Suzhou Logistics Center Co., Ltd. 1,353,911.31 653,243.85
Tangshan Port Sinotrans Shipping Agency Co., Ltd. 875,954.60 10,251,199.63
Jiangsu Jiangyin Port Group Co., Ltd. 144,978.00 1,329,512.26
Sinotrans Philippines Inc. – 4,830,605.40
Others 2,550,660.98 3,566,362.15
Other related parties 1,595,876.53 81,277.68
Ocean Network Express Pte. Ltd. 1,594,800.33 81,277.68
Ningbo Daxie Merchants International Terminal Co., Ltd. 1,076.20 –
Total prepayments 103,613,212.53 82,685,307.58
Non-current assets
due within one
year
Joint ventures and associates 12,205,000.00 12,085,000.00
Sinotrans Suzhou Logistics Center Co., Ltd. 7,125,000.00 7,125,000.00
Shanghai Pu’An Storage Co., Ltd. 5,080,000.00 4,960,000.00
Long-term
receivables
Joint ventures and associates 70,070,000.00 72,670,000.00
Sinotrans Suzhou Logistics Center Co., Ltd. 42,750,000.00 42,750,000.00
Shanghai Pu’An Storage Co., Ltd. 27,320,000.00 29,920,000.00
Accounts payable Other enterprises controlled by the same parent company
and ultimate controller
195,907,250.35 327,382,693.37
Sinotrans Container Lines Co., Ltd. 64,059,747.85 148,557,919.02
Sinotrans Sunny Express Co., Ltd. 28,611,429.40 27,952,503.01
Dalian Container Terminal Co., Ltd. 12,850,390.11 10,098,123.20
Sinotrans Hebei Co., Ltd. 10,419,161.47 1,138,184.08
Nanjing Tanker Corporation 10,200,178.61 27,417,442.11
China Merchants Godown, Wharf & Transportation Co., Ltd. 9,661,735.09 –
Henan Sinotrans Jiuling Storage and Transportation Company 7,000,926.23 5,906,586.60
Shanghai Yangtze Maritime Development Co., Ltd. 6,481,816.00 2,389,046.00
Dalian Port Wantong Logistics Co., Ltd. 3,495,296.04 –
Shanghai Ming Wah Shipping Co., Ltd. 3,392,514.52 2,210,386.19
Zhengzhou China Merchants Logistics Co., Ltd. 3,379,799.15 –
Shanghai Changjiang International Shipping Agency Co., Ltd. 3,209,712.00 7,947,544.00
X. RELATED-PARTY RELATIONSHIPS AND TRANSACTIONS (CONTINUED)
4. Related Party Transactions: (continued)(12) Balances of major claims and debts (continued)
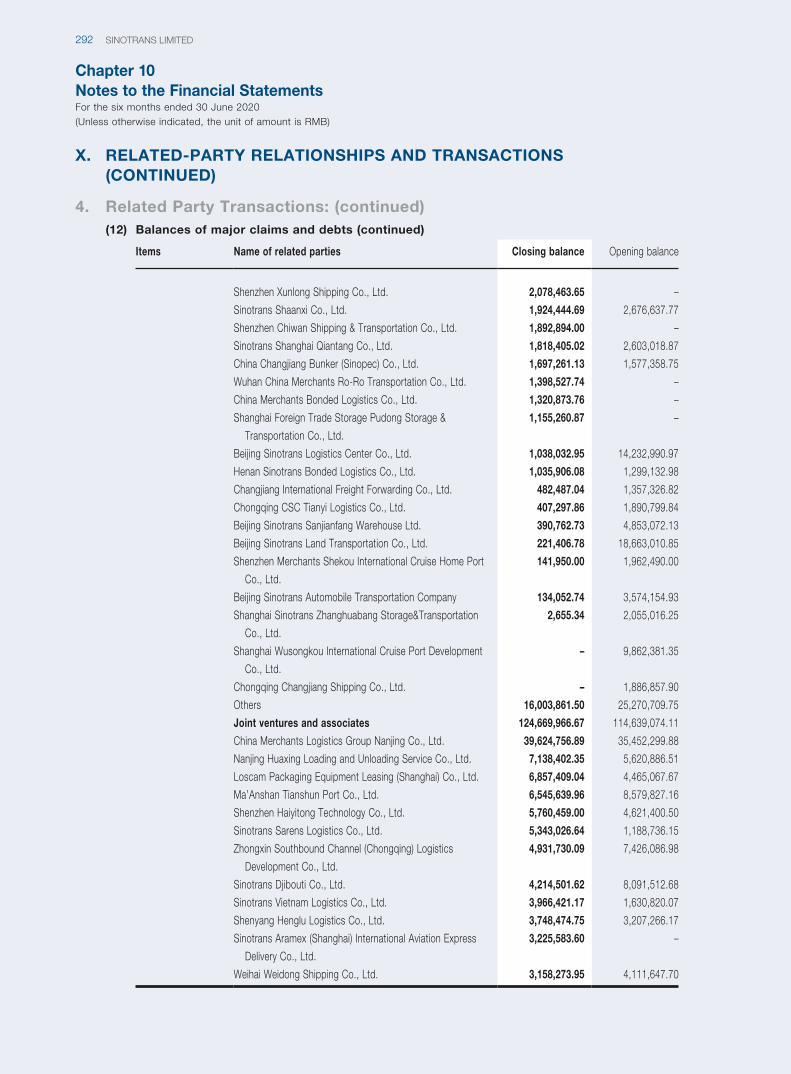
Chapter 10Notes to the Financial StatementsFor the six months ended 30 June 2020(Unless otherwise indicated, the unit of amount is RMB)
SINOTRANS LIMITED292
Items Name of related parties Closing balance Opening balance
Shenzhen Xunlong Shipping Co., Ltd. 2,078,463.65 –
Sinotrans Shaanxi Co., Ltd. 1,924,444.69 2,676,637.77
Shenzhen Chiwan Shipping & Transportation Co., Ltd. 1,892,894.00 –
Sinotrans Shanghai Qiantang Co., Ltd. 1,818,405.02 2,603,018.87
China Changjiang Bunker (Sinopec) Co., Ltd. 1,697,261.13 1,577,358.75
Wuhan China Merchants Ro-Ro Transportation Co., Ltd. 1,398,527.74 –
China Merchants Bonded Logistics Co., Ltd. 1,320,873.76 –
Shanghai Foreign Trade Storage Pudong Storage &
Transportation Co., Ltd.
1,155,260.87 –
Beijing Sinotrans Logistics Center Co., Ltd. 1,038,032.95 14,232,990.97
Henan Sinotrans Bonded Logistics Co., Ltd. 1,035,906.08 1,299,132.98
Changjiang International Freight Forwarding Co., Ltd. 482,487.04 1,357,326.82
Chongqing CSC Tianyi Logistics Co., Ltd. 407,297.86 1,890,799.84
Beijing Sinotrans Sanjianfang Warehouse Ltd. 390,762.73 4,853,072.13
Beijing Sinotrans Land Transportation Co., Ltd. 221,406.78 18,663,010.85
Shenzhen Merchants Shekou International Cruise Home Port
Co., Ltd.
141,950.00 1,962,490.00
Beijing Sinotrans Automobile Transportation Company 134,052.74 3,574,154.93
Shanghai Sinotrans Zhanghuabang Storage&Transportation
Co., Ltd.
2,655.34 2,055,016.25
Shanghai Wusongkou International Cruise Port Development
Co., Ltd.
– 9,862,381.35
Chongqing Changjiang Shipping Co., Ltd. – 1,886,857.90
Others 16,003,861.50 25,270,709.75
Joint ventures and associates 124,669,966.67 114,639,074.11
China Merchants Logistics Group Nanjing Co., Ltd. 39,624,756.89 35,452,299.88
Nanjing Huaxing Loading and Unloading Service Co., Ltd. 7,138,402.35 5,620,886.51
Loscam Packaging Equipment Leasing (Shanghai) Co., Ltd. 6,857,409.04 4,465,067.67
Ma’Anshan Tianshun Port Co., Ltd. 6,545,639.96 8,579,827.16
Shenzhen Haiyitong Technology Co., Ltd. 5,760,459.00 4,621,400.50
Sinotrans Sarens Logistics Co., Ltd. 5,343,026.64 1,188,736.15
Zhongxin Southbound Channel (Chongqing) Logistics
Development Co., Ltd.
4,931,730.09 7,426,086.98
Sinotrans Djibouti Co., Ltd. 4,214,501.62 8,091,512.68
Sinotrans Vietnam Logistics Co., Ltd. 3,966,421.17 1,630,820.07
Shenyang Henglu Logistics Co., Ltd. 3,748,474.75 3,207,266.17
Sinotrans Aramex (Shanghai) International Aviation Express
Delivery Co., Ltd.
3,225,583.60 –
Weihai Weidong Shipping Co., Ltd. 3,158,273.95 4,111,647.70
X. RELATED-PARTY RELATIONSHIPS AND TRANSACTIONS (CONTINUED)
4. Related Party Transactions: (continued)(12) Balances of major claims and debts (continued)
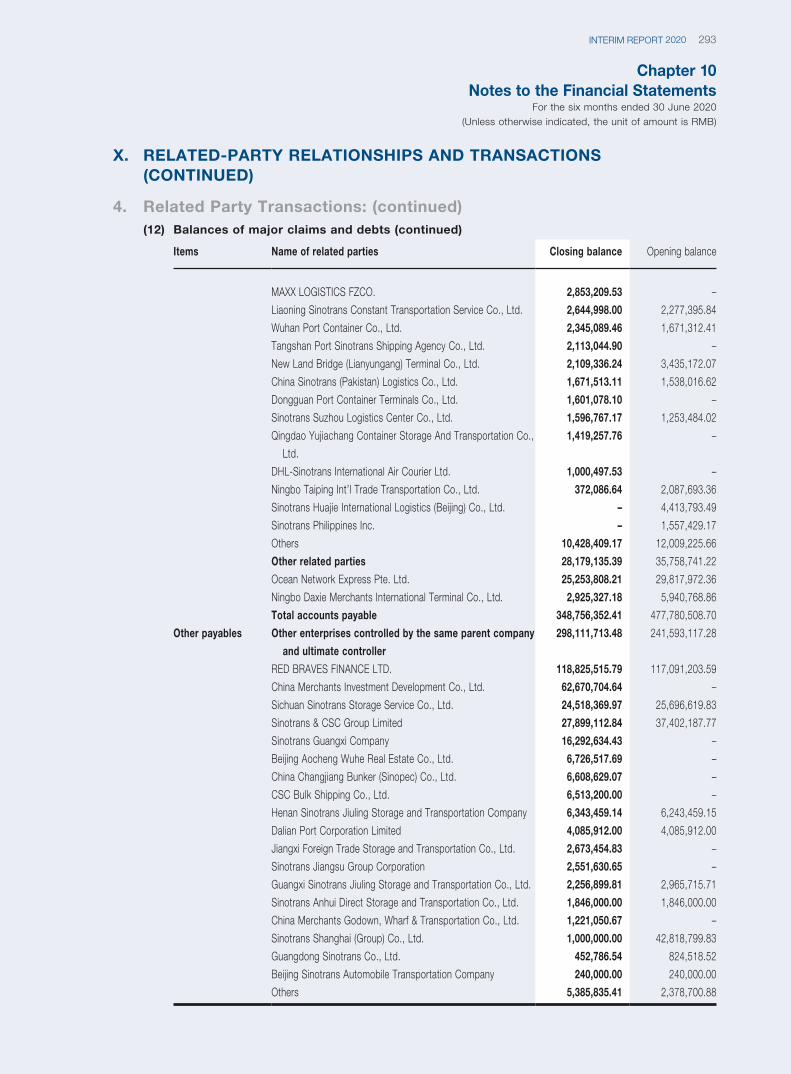
Chapter 10Notes to the Financial Statements
For the six months ended 30 June 2020(Unless otherwise indicated, the unit of amount is RMB)
293INTERIM REPORT 2020
Items Name of related parties Closing balance Opening balance
MAXX LOGISTICS FZCO. 2,853,209.53 –
Liaoning Sinotrans Constant Transportation Service Co., Ltd. 2,644,998.00 2,277,395.84
Wuhan Port Container Co., Ltd. 2,345,089.46 1,671,312.41
Tangshan Port Sinotrans Shipping Agency Co., Ltd. 2,113,044.90 –
New Land Bridge (Lianyungang) Terminal Co., Ltd. 2,109,336.24 3,435,172.07
China Sinotrans (Pakistan) Logistics Co., Ltd. 1,671,513.11 1,538,016.62
Dongguan Port Container Terminals Co., Ltd. 1,601,078.10 –
Sinotrans Suzhou Logistics Center Co., Ltd. 1,596,767.17 1,253,484.02
Qingdao Yujiachang Container Storage And Transportation Co.,
Ltd.
1,419,257.76 –
DHL-Sinotrans International Air Courier Ltd. 1,000,497.53 –
Ningbo Taiping Int’l Trade Transportation Co., Ltd. 372,086.64 2,087,693.36
Sinotrans Huajie International Logistics (Beijing) Co., Ltd. – 4,413,793.49
Sinotrans Philippines Inc. – 1,557,429.17
Others 10,428,409.17 12,009,225.66
Other related parties 28,179,135.39 35,758,741.22
Ocean Network Express Pte. Ltd. 25,253,808.21 29,817,972.36
Ningbo Daxie Merchants International Terminal Co., Ltd. 2,925,327.18 5,940,768.86
Total accounts payable 348,756,352.41 477,780,508.70
Other payables Other enterprises controlled by the same parent company
and ultimate controller
298,111,713.48 241,593,117.28
RED BRAVES FINANCE LTD. 118,825,515.79 117,091,203.59
China Merchants Investment Development Co., Ltd. 62,670,704.64 –
Sichuan Sinotrans Storage Service Co., Ltd. 24,518,369.97 25,696,619.83
Sinotrans & CSC Group Limited 27,899,112.84 37,402,187.77
Sinotrans Guangxi Company 16,292,634.43 –
Beijing Aocheng Wuhe Real Estate Co., Ltd. 6,726,517.69 –
China Changjiang Bunker (Sinopec) Co., Ltd. 6,608,629.07 –
CSC Bulk Shipping Co., Ltd. 6,513,200.00 –
Henan Sinotrans Jiuling Storage and Transportation Company 6,343,459.14 6,243,459.15
Dalian Port Corporation Limited 4,085,912.00 4,085,912.00
Jiangxi Foreign Trade Storage and Transportation Co., Ltd. 2,673,454.83 –
Sinotrans Jiangsu Group Corporation 2,551,630.65 –
Guangxi Sinotrans Jiuling Storage and Transportation Co., Ltd. 2,256,899.81 2,965,715.71
Sinotrans Anhui Direct Storage and Transportation Co., Ltd. 1,846,000.00 1,846,000.00
China Merchants Godown, Wharf & Transportation Co., Ltd. 1,221,050.67 –
Sinotrans Shanghai (Group) Co., Ltd. 1,000,000.00 42,818,799.83
Guangdong Sinotrans Co., Ltd. 452,786.54 824,518.52
Beijing Sinotrans Automobile Transportation Company 240,000.00 240,000.00
Others 5,385,835.41 2,378,700.88
X. RELATED-PARTY RELATIONSHIPS AND TRANSACTIONS (CONTINUED)
4. Related Party Transactions: (continued)(12) Balances of major claims and debts (continued)
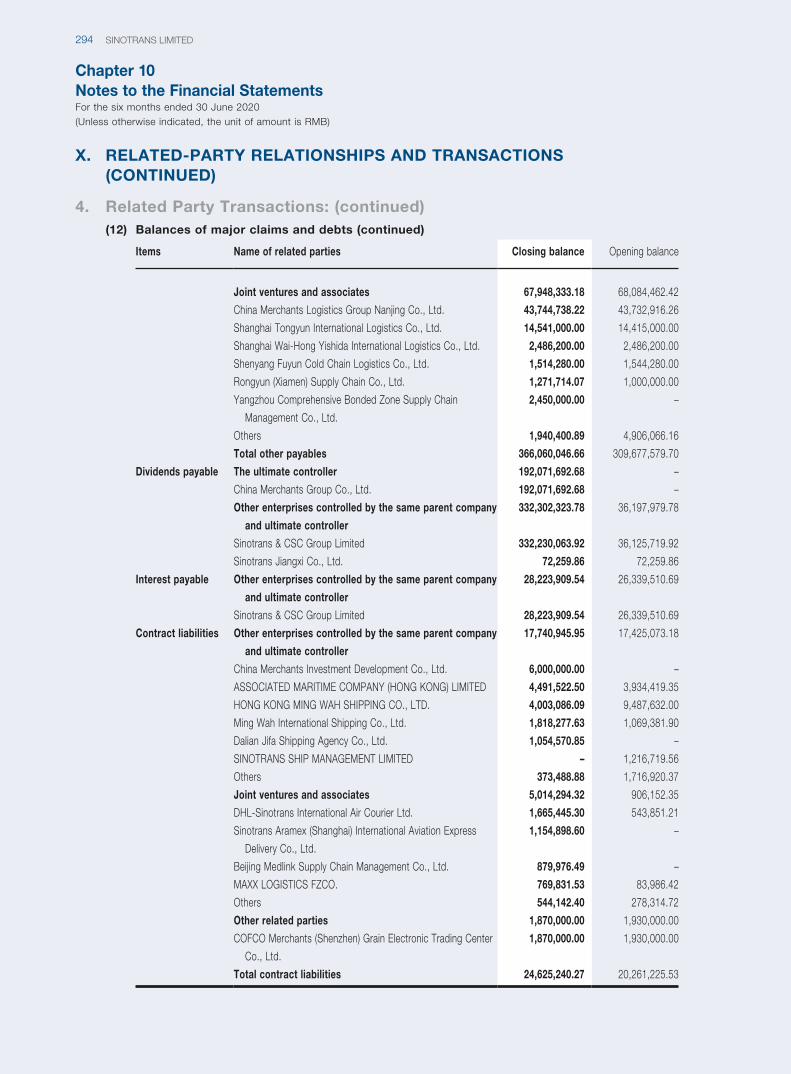
Chapter 10Notes to the Financial StatementsFor the six months ended 30 June 2020(Unless otherwise indicated, the unit of amount is RMB)
SINOTRANS LIMITED294
Items Name of related parties Closing balance Opening balance
Joint ventures and associates 67,948,333.18 68,084,462.42
China Merchants Logistics Group Nanjing Co., Ltd. 43,744,738.22 43,732,916.26
Shanghai Tongyun International Logistics Co., Ltd. 14,541,000.00 14,415,000.00
Shanghai Wai-Hong Yishida International Logistics Co., Ltd. 2,486,200.00 2,486,200.00
Shenyang Fuyun Cold Chain Logistics Co., Ltd. 1,514,280.00 1,544,280.00
Rongyun (Xiamen) Supply Chain Co., Ltd. 1,271,714.07 1,000,000.00
Yangzhou Comprehensive Bonded Zone Supply Chain
Management Co., Ltd.
2,450,000.00 –
Others 1,940,400.89 4,906,066.16
Total other payables 366,060,046.66 309,677,579.70
Dividends payable The ultimate controller 192,071,692.68 –
China Merchants Group Co., Ltd. 192,071,692.68 –
Other enterprises controlled by the same parent company
and ultimate controller
332,302,323.78 36,197,979.78
Sinotrans & CSC Group Limited 332,230,063.92 36,125,719.92
Sinotrans Jiangxi Co., Ltd. 72,259.86 72,259.86
Interest payable Other enterprises controlled by the same parent company
and ultimate controller
28,223,909.54 26,339,510.69
Sinotrans & CSC Group Limited 28,223,909.54 26,339,510.69
Contract liabilities Other enterprises controlled by the same parent company
and ultimate controller
17,740,945.95 17,425,073.18
China Merchants Investment Development Co., Ltd. 6,000,000.00 –
ASSOCIATED MARITIME COMPANY (HONG KONG) LIMITED 4,491,522.50 3,934,419.35
HONG KONG MING WAH SHIPPING CO., LTD. 4,003,086.09 9,487,632.00
Ming Wah International Shipping Co., Ltd. 1,818,277.63 1,069,381.90
Dalian Jifa Shipping Agency Co., Ltd. 1,054,570.85 –
SINOTRANS SHIP MANAGEMENT LIMITED – 1,216,719.56
Others 373,488.88 1,716,920.37
Joint ventures and associates 5,014,294.32 906,152.35
DHL-Sinotrans International Air Courier Ltd. 1,665,445.30 543,851.21
Sinotrans Aramex (Shanghai) International Aviation Express
Delivery Co., Ltd.
1,154,898.60 –
Beijing Medlink Supply Chain Management Co., Ltd. 879,976.49 –
MAXX LOGISTICS FZCO. 769,831.53 83,986.42
Others 544,142.40 278,314.72
Other related parties 1,870,000.00 1,930,000.00
COFCO Merchants (Shenzhen) Grain Electronic Trading Center
Co., Ltd.
1,870,000.00 1,930,000.00
Total contract liabilities 24,625,240.27 20,261,225.53
X. RELATED-PARTY RELATIONSHIPS AND TRANSACTIONS (CONTINUED)
4. Related Party Transactions: (continued)(12) Balances of major claims and debts (continued)
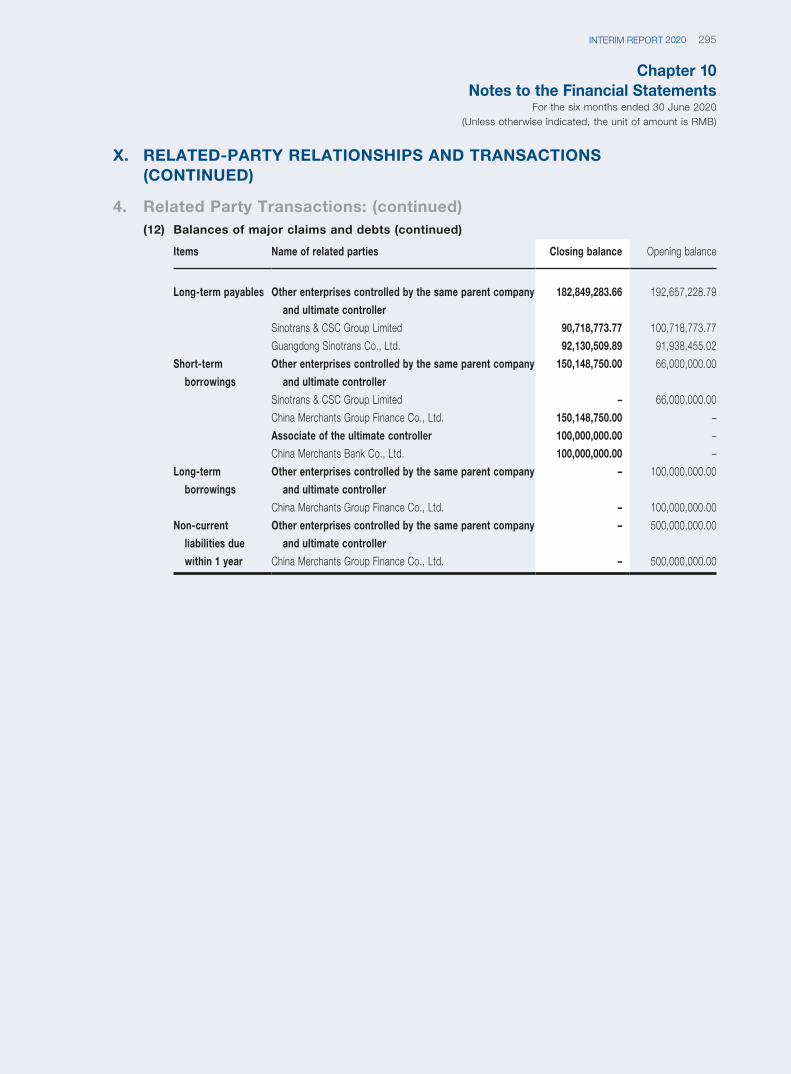
Chapter 10Notes to the Financial Statements
For the six months ended 30 June 2020(Unless otherwise indicated, the unit of amount is RMB)
295INTERIM REPORT 2020
Items Name of related parties Closing balance Opening balance
Long-term payables Other enterprises controlled by the same parent company
and ultimate controller
182,849,283.66 192,657,228.79
Sinotrans & CSC Group Limited 90,718,773.77 100,718,773.77
Guangdong Sinotrans Co., Ltd. 92,130,509.89 91,938,455.02
Short-term
borrowings
Other enterprises controlled by the same parent company
and ultimate controller
150,148,750.00 66,000,000.00
Sinotrans & CSC Group Limited – 66,000,000.00
China Merchants Group Finance Co., Ltd. 150,148,750.00 –
Associate of the ultimate controller 100,000,000.00 –
China Merchants Bank Co., Ltd. 100,000,000.00 –
Long-term
borrowings
Other enterprises controlled by the same parent company
and ultimate controller
– 100,000,000.00
China Merchants Group Finance Co., Ltd. – 100,000,000.00
Non-current
liabilities due
within 1 year
Other enterprises controlled by the same parent company
and ultimate controller
– 500,000,000.00
China Merchants Group Finance Co., Ltd. – 500,000,000.00
X. RELATED-PARTY RELATIONSHIPS AND TRANSACTIONS (CONTINUED)
4. Related Party Transactions: (continued)(12) Balances of major claims and debts (continued)
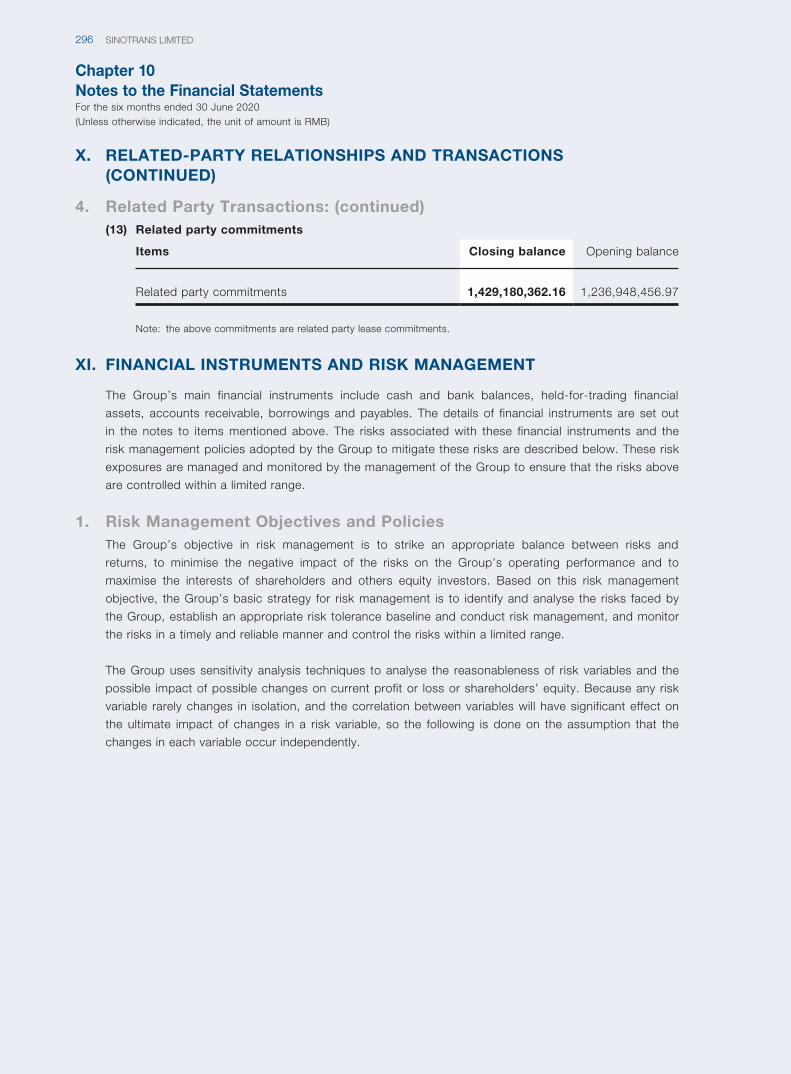
Chapter 10Notes to the Financial StatementsFor the six months ended 30 June 2020(Unless otherwise indicated, the unit of amount is RMB)
SINOTRANS LIMITED296
X. RELATED-PARTY RELATIONSHIPS AND TRANSACTIONS (CONTINUED)
4. Related Party Transactions: (continued)(13) Related party commitments
Items Closing balance Opening balance
Related party commitments 1,429,180,362.16 1,236,948,456.97
Note: the above commitments are related party lease commitments.
XI. FINANCIAL INSTRUMENTS AND RISK MANAGEMENT
The Group’s main financial instruments include cash and bank balances, held-for-trading financial
assets, accounts receivable, borrowings and payables. The details of financial instruments are set out
in the notes to items mentioned above. The risks associated with these financial instruments and the
risk management policies adopted by the Group to mitigate these risks are described below. These risk
exposures are managed and monitored by the management of the Group to ensure that the risks above
are controlled within a limited range.
1. Risk Management Objectives and PoliciesThe Group’s objective in risk management is to strike an appropriate balance between risks and
returns, to minimise the negative impact of the risks on the Group’s operating performance and to
maximise the interests of shareholders and others equity investors. Based on this risk management
objective, the Group’s basic strategy for risk management is to identify and analyse the risks faced by
the Group, establish an appropriate risk tolerance baseline and conduct risk management, and monitor
the risks in a timely and reliable manner and control the risks within a limited range.
The Group uses sensitivity analysis techniques to analyse the reasonableness of risk variables and the
possible impact of possible changes on current profit or loss or shareholders’ equity. Because any risk
variable rarely changes in isolation, and the correlation between variables will have significant effect on
the ultimate impact of changes in a risk variable, so the following is done on the assumption that the
changes in each variable occur independently.
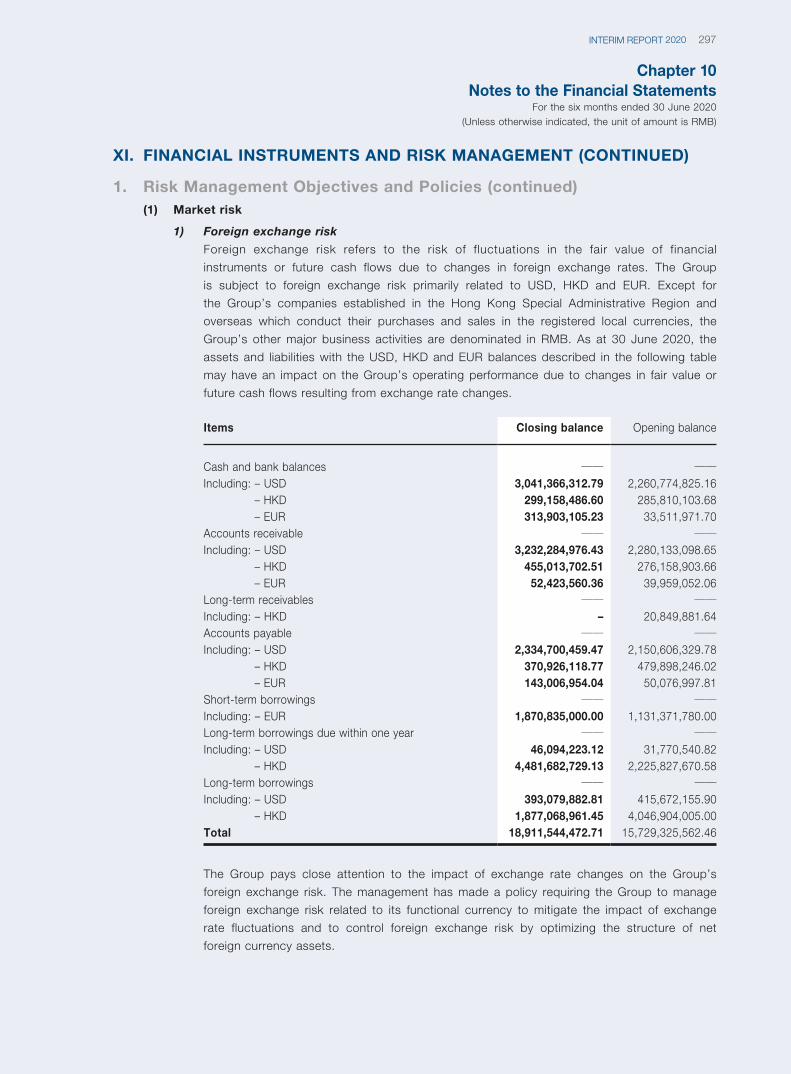
Chapter 10Notes to the Financial Statements
For the six months ended 30 June 2020(Unless otherwise indicated, the unit of amount is RMB)
297INTERIM REPORT 2020
XI. FINANCIAL INSTRUMENTS AND RISK MANAGEMENT (CONTINUED)
1. Risk Management Objectives and Policies (continued)(1) Market risk
1) Foreign exchange risk
Foreign exchange risk refers to the risk of fluctuations in the fair value of financial
instruments or future cash flows due to changes in foreign exchange rates. The Group
is subject to foreign exchange risk primarily related to USD, HKD and EUR. Except for
the Group’s companies established in the Hong Kong Special Administrative Region and
overseas which conduct their purchases and sales in the registered local currencies, the
Group’s other major business activities are denominated in RMB. As at 30 June 2020, the
assets and liabilities with the USD, HKD and EUR balances described in the following table
may have an impact on the Group’s operating performance due to changes in fair value or
future cash flows resulting from exchange rate changes.
Items Closing balance Opening balance
Cash and bank balances —— ——Including: – USD 3,041,366,312.79 2,260,774,825.16
– HKD 299,158,486.60 285,810,103.68– EUR 313,903,105.23 33,511,971.70
Accounts receivable —— ——Including: – USD 3,232,284,976.43 2,280,133,098.65
– HKD 455,013,702.51 276,158,903.66– EUR 52,423,560.36 39,959,052.06
Long-term receivables —— ——Including: – HKD – 20,849,881.64Accounts payable —— ——Including: – USD 2,334,700,459.47 2,150,606,329.78
– HKD 370,926,118.77 479,898,246.02– EUR 143,006,954.04 50,076,997.81
Short-term borrowings —— ——Including: – EUR 1,870,835,000.00 1,131,371,780.00Long-term borrowings due within one year —— ——Including: – USD 46,094,223.12 31,770,540.82
– HKD 4,481,682,729.13 2,225,827,670.58Long-term borrowings —— ——Including: – USD 393,079,882.81 415,672,155.90
– HKD 1,877,068,961.45 4,046,904,005.00Total 18,911,544,472.71 15,729,325,562.46
The Group pays close attention to the impact of exchange rate changes on the Group’s
foreign exchange risk. The management has made a policy requiring the Group to manage
foreign exchange risk related to its functional currency to mitigate the impact of exchange
rate fluctuations and to control foreign exchange risk by optimizing the structure of net
foreign currency assets.
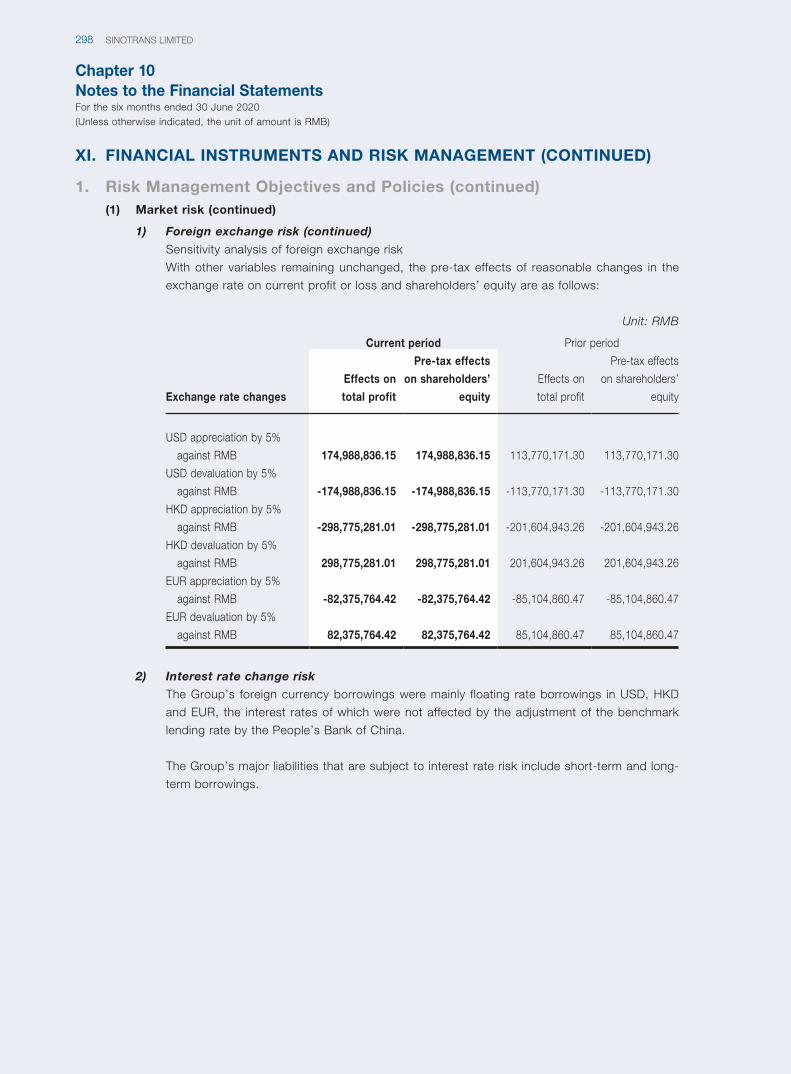
Chapter 10Notes to the Financial StatementsFor the six months ended 30 June 2020(Unless otherwise indicated, the unit of amount is RMB)
SINOTRANS LIMITED298
XI. FINANCIAL INSTRUMENTS AND RISK MANAGEMENT (CONTINUED)
1. Risk Management Objectives and Policies (continued)(1) Market risk (continued)
1) Foreign exchange risk (continued)
Sensitivity analysis of foreign exchange risk
With other variables remaining unchanged, the pre-tax effects of reasonable changes in the
exchange rate on current profit or loss and shareholders’ equity are as follows:
Unit: RMB
Exchange rate changes
Current period Prior period
Effects on
total profit
Pre-tax effects
on shareholders’
equity
Effects on
total profit
Pre-tax effects
on shareholders’
equity
USD appreciation by 5%
against RMB 174,988,836.15 174,988,836.15 113,770,171.30 113,770,171.30
USD devaluation by 5%
against RMB -174,988,836.15 -174,988,836.15 -113,770,171.30 -113,770,171.30
HKD appreciation by 5%
against RMB -298,775,281.01 -298,775,281.01 -201,604,943.26 -201,604,943.26
HKD devaluation by 5%
against RMB 298,775,281.01 298,775,281.01 201,604,943.26 201,604,943.26
EUR appreciation by 5%
against RMB -82,375,764.42 -82,375,764.42 -85,104,860.47 -85,104,860.47
EUR devaluation by 5%
against RMB 82,375,764.42 82,375,764.42 85,104,860.47 85,104,860.47
2) Interest rate change risk
The Group’s foreign currency borrowings were mainly floating rate borrowings in USD, HKD
and EUR, the interest rates of which were not affected by the adjustment of the benchmark
lending rate by the People’s Bank of China.
The Group’s major liabilities that are subject to interest rate risk include short-term and long-
term borrowings.
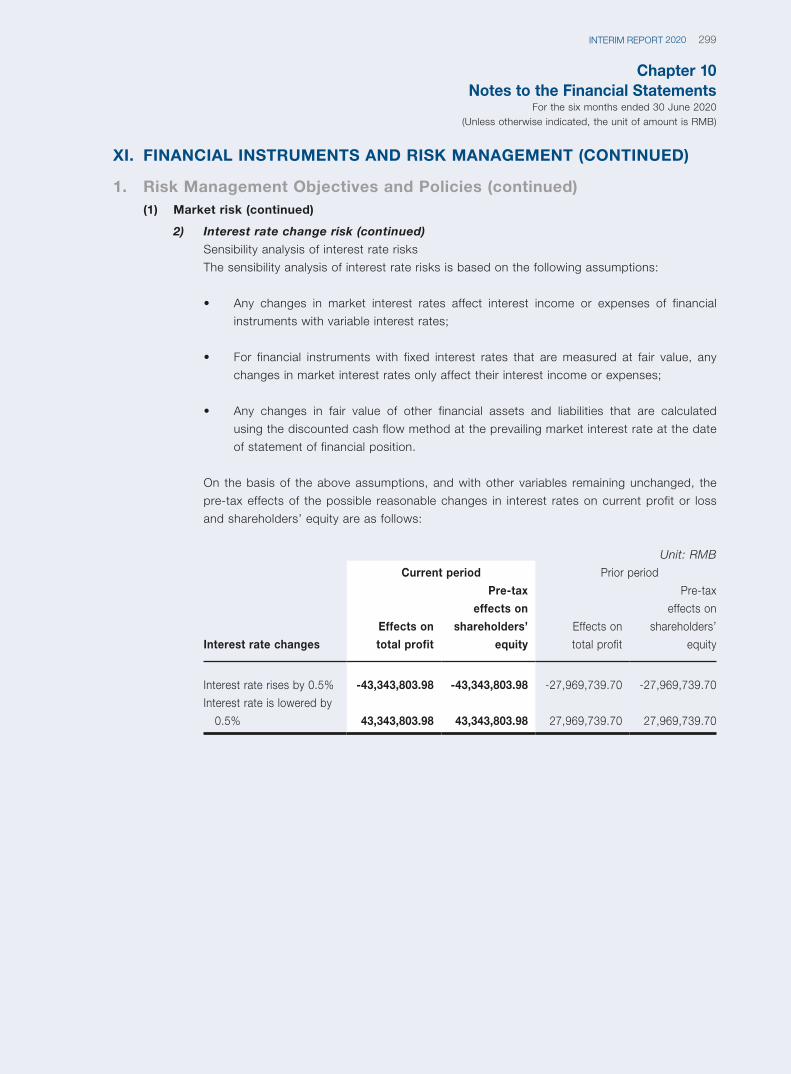
Chapter 10Notes to the Financial Statements
For the six months ended 30 June 2020(Unless otherwise indicated, the unit of amount is RMB)
299INTERIM REPORT 2020
XI. FINANCIAL INSTRUMENTS AND RISK MANAGEMENT (CONTINUED)
1. Risk Management Objectives and Policies (continued)(1) Market risk (continued)
2) Interest rate change risk (continued)
Sensibility analysis of interest rate risks
The sensibility analysis of interest rate risks is based on the following assumptions:
• Any changes in market interest rates affect interest income or expenses of financial
instruments with variable interest rates;
• For financial instruments with fixed interest rates that are measured at fair value, any
changes in market interest rates only affect their interest income or expenses;
• Any changes in fair value of other financial assets and liabilities that are calculated
using the discounted cash flow method at the prevailing market interest rate at the date
of statement of financial position.
On the basis of the above assumptions, and with other variables remaining unchanged, the
pre-tax effects of the possible reasonable changes in interest rates on current profit or loss
and shareholders’ equity are as follows:
Unit: RMB
Interest rate changes
Current period Prior period
Effects on
total profit
Pre-tax
effects on
shareholders’
equity
Effects on
total profit
Pre-tax
effects on
shareholders’
equity
Interest rate rises by 0.5% -43,343,803.98 -43,343,803.98 -27,969,739.70 -27,969,739.70
Interest rate is lowered by
0.5% 43,343,803.98 43,343,803.98 27,969,739.70 27,969,739.70
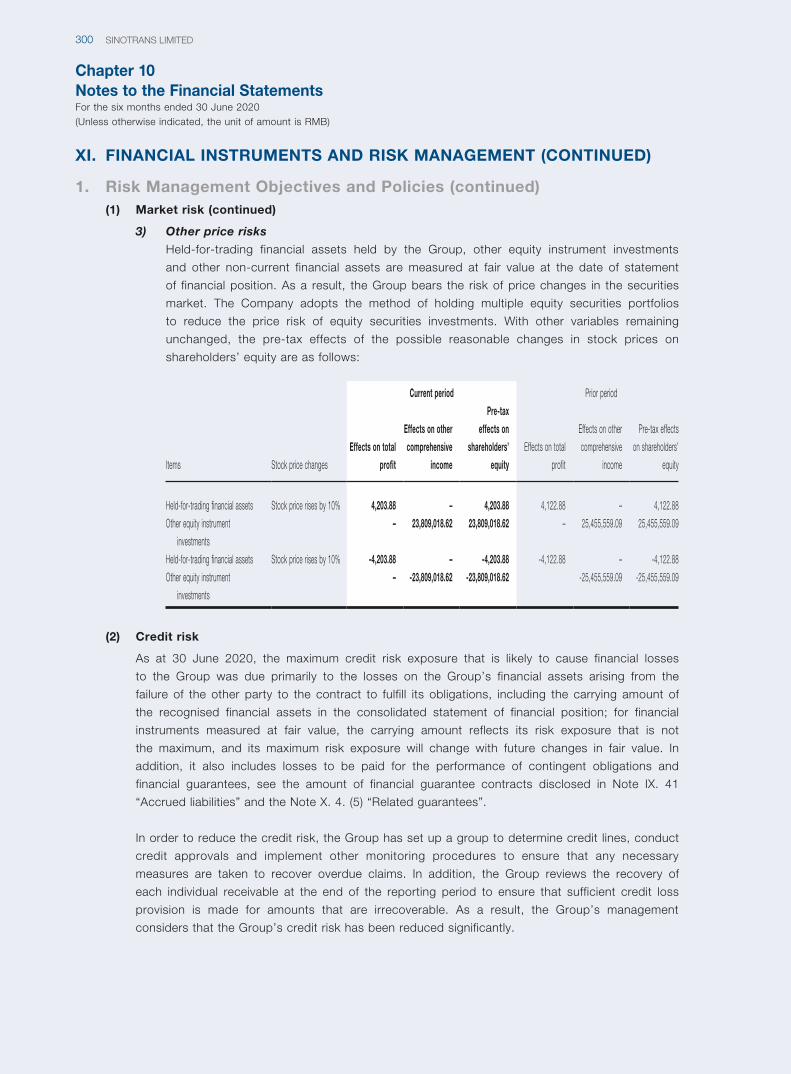
Chapter 10Notes to the Financial StatementsFor the six months ended 30 June 2020(Unless otherwise indicated, the unit of amount is RMB)
SINOTRANS LIMITED300
XI. FINANCIAL INSTRUMENTS AND RISK MANAGEMENT (CONTINUED)
1. Risk Management Objectives and Policies (continued)(1) Market risk (continued)
3) Other price risks
Held-for-trading financial assets held by the Group, other equity instrument investments
and other non-current financial assets are measured at fair value at the date of statement
of financial position. As a result, the Group bears the risk of price changes in the securities
market. The Company adopts the method of holding multiple equity securities portfolios
to reduce the price risk of equity securities investments. With other variables remaining
unchanged, the pre-tax effects of the possible reasonable changes in stock prices on
shareholders’ equity are as follows:
Items Stock price changes
Current period Prior period
Effects on total
profit
Effects on other
comprehensive
income
Pre-tax
effects on
shareholders’
equity
Effects on total
profit
Effects on other
comprehensive
income
Pre-tax effects
on shareholders’
equity
Held-for-trading financial assets Stock price rises by 10% 4,203.88 – 4,203.88 4,122.88 – 4,122.88
Other equity instrument
investments
– 23,809,018.62 23,809,018.62 – 25,455,559.09 25,455,559.09
Held-for-trading financial assets Stock price rises by 10% -4,203.88 – -4,203.88 -4,122.88 – -4,122.88
Other equity instrument
investments
– -23,809,018.62 -23,809,018.62 -25,455,559.09 -25,455,559.09
(2) Credit risk
As at 30 June 2020, the maximum credit risk exposure that is likely to cause financial losses
to the Group was due primarily to the losses on the Group’s financial assets arising from the
failure of the other party to the contract to fulfill its obligations, including the carrying amount of
the recognised financial assets in the consolidated statement of financial position; for financial
instruments measured at fair value, the carrying amount reflects its risk exposure that is not
the maximum, and its maximum risk exposure will change with future changes in fair value. In
addition, it also includes losses to be paid for the performance of contingent obligations and
financial guarantees, see the amount of financial guarantee contracts disclosed in Note IX. 41
“Accrued liabilities” and the Note X. 4. (5) “Related guarantees”.
In order to reduce the credit risk, the Group has set up a group to determine credit lines, conduct
credit approvals and implement other monitoring procedures to ensure that any necessary
measures are taken to recover overdue claims. In addition, the Group reviews the recovery of
each individual receivable at the end of the reporting period to ensure that sufficient credit loss
provision is made for amounts that are irrecoverable. As a result, the Group’s management
considers that the Group’s credit risk has been reduced significantly.
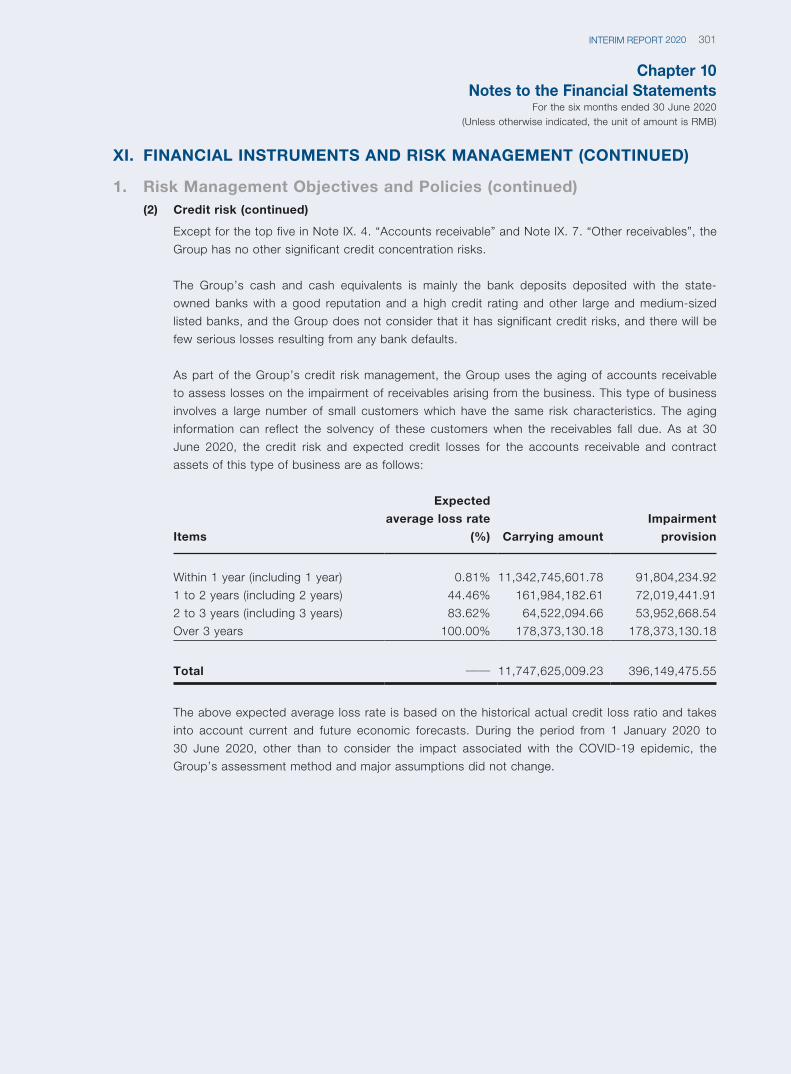
Chapter 10Notes to the Financial Statements
For the six months ended 30 June 2020(Unless otherwise indicated, the unit of amount is RMB)
301INTERIM REPORT 2020
XI. FINANCIAL INSTRUMENTS AND RISK MANAGEMENT (CONTINUED)
1. Risk Management Objectives and Policies (continued)(2) Credit risk (continued)
Except for the top five in Note IX. 4. “Accounts receivable” and Note IX. 7. “Other receivables”, the
Group has no other significant credit concentration risks.
The Group’s cash and cash equivalents is mainly the bank deposits deposited with the state-
owned banks with a good reputation and a high credit rating and other large and medium-sized
listed banks, and the Group does not consider that it has significant credit risks, and there will be
few serious losses resulting from any bank defaults.
As part of the Group’s credit risk management, the Group uses the aging of accounts receivable
to assess losses on the impairment of receivables arising from the business. This type of business
involves a large number of small customers which have the same risk characteristics. The aging
information can reflect the solvency of these customers when the receivables fall due. As at 30
June 2020, the credit risk and expected credit losses for the accounts receivable and contract
assets of this type of business are as follows:
Items
Expected
average loss rate
(%) Carrying amount
Impairment
provision
Within 1 year (including 1 year) 0.81% 11,342,745,601.78 91,804,234.92
1 to 2 years (including 2 years) 44.46% 161,984,182.61 72,019,441.91
2 to 3 years (including 3 years) 83.62% 64,522,094.66 53,952,668.54
Over 3 years 100.00% 178,373,130.18 178,373,130.18
Total —— 11,747,625,009.23 396,149,475.55
The above expected average loss rate is based on the historical actual credit loss ratio and takes
into account current and future economic forecasts. During the period from 1 January 2020 to
30 June 2020, other than to consider the impact associated with the COVID-19 epidemic, the
Group’s assessment method and major assumptions did not change.
Chapter 10Notes to the Financial StatementsFor the six months ended 30 June 2020(Unless otherwise indicated, the unit of amount is RMB)
SINOTRANS LIMITED302
XI. FINANCIAL INSTRUMENTS AND RISK MANAGEMENT (CONTINUED)
1. Risk Management Objectives and Policies (continued)(2) Credit risk (continued)
As at 30 June 2020, the maximum amount of financial guarantee provided by the Group was
RMB123,144,043.49, and the details of the financial guarantee contract are set out in Note X.
4. (5) “Related guarantees”. On 30 June 2020, the Group’s management assessed the overdue
borrowings under the guarantee, the financial position of the borrower concerned and the
economic situation of the debtor’s industry and concluded that since the initial recognition of
such financial guarantee contract, there was no significant increase in relevant credit risk. As a
result, the Group has no division into the financial guarantee contract that is required to measure
loss provisions on the basis of the amount of the expected credit loss over the entire life, and
measures its impairment provision on the basis of the amount equivalent to the expected credit
loss of the above financial guarantee contract within the next 12 months. During the period from 1
January 2020 to 30 June 2020, other than to consider the impact associated with the COVID-19
epidemic, the Group’s assessment method and major assumptions did not change.
(3) Liquidity risk
In managing the liquidity risk, the Group’s management believes that sufficient cash and cash
equivalents should be maintained and monitored to meet the Group’s business needs and to
reduce the impact of cash flow fluctuations. The Group’s management monitors the use of bank
loans and ensures compliance with loan agreements.
At the end of the period, the amount of bank loans that have not been used by the Group was
RMB17.767 billion (31 December 2019: RMB17.347 billion).
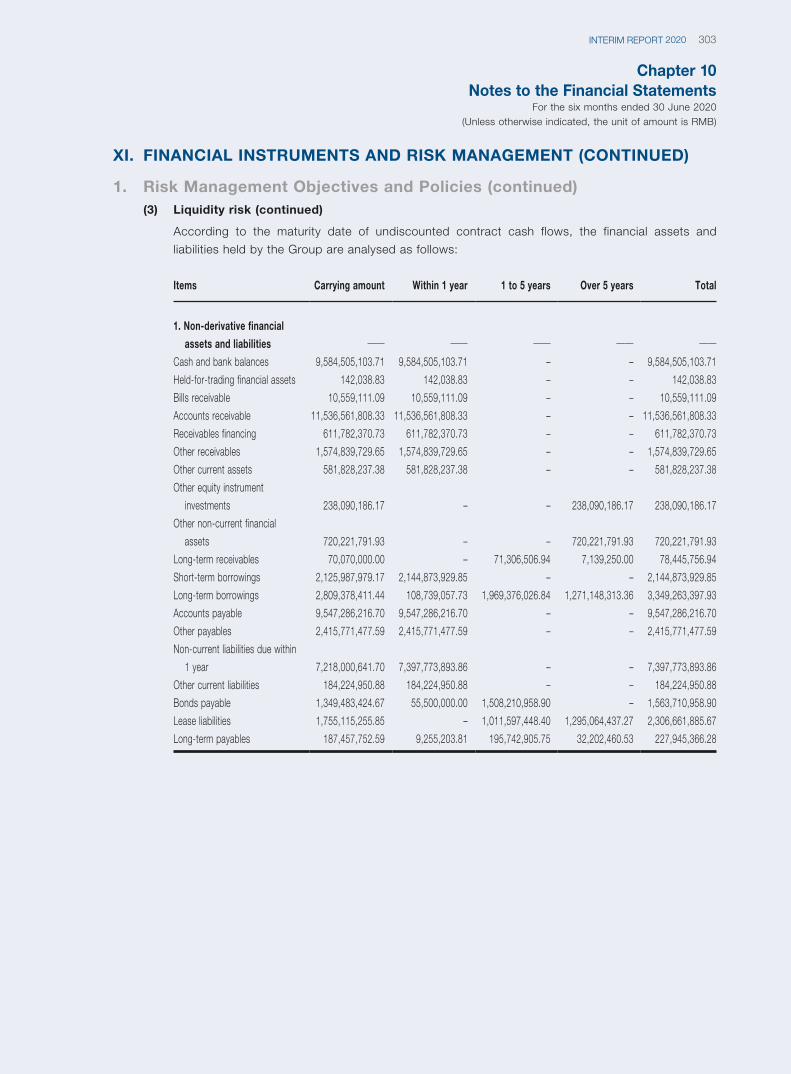
Chapter 10Notes to the Financial Statements
For the six months ended 30 June 2020(Unless otherwise indicated, the unit of amount is RMB)
303INTERIM REPORT 2020
XI. FINANCIAL INSTRUMENTS AND RISK MANAGEMENT (CONTINUED)
1. Risk Management Objectives and Policies (continued)(3) Liquidity risk (continued)
According to the maturity date of undiscounted contract cash flows, the financial assets and
liabilities held by the Group are analysed as follows:
Items Carrying amount Within 1 year 1 to 5 years Over 5 years Total
1. Non-derivative financial
assets and liabilities —— —— —— —— ——Cash and bank balances 9,584,505,103.71 9,584,505,103.71 – – 9,584,505,103.71
Held-for-trading financial assets 142,038.83 142,038.83 – – 142,038.83
Bills receivable 10,559,111.09 10,559,111.09 – – 10,559,111.09
Accounts receivable 11,536,561,808.33 11,536,561,808.33 – – 11,536,561,808.33
Receivables financing 611,782,370.73 611,782,370.73 – – 611,782,370.73
Other receivables 1,574,839,729.65 1,574,839,729.65 – – 1,574,839,729.65
Other current assets 581,828,237.38 581,828,237.38 – – 581,828,237.38
Other equity instrument
investments 238,090,186.17 – – 238,090,186.17 238,090,186.17
Other non-current financial
assets 720,221,791.93 – – 720,221,791.93 720,221,791.93
Long-term receivables 70,070,000.00 – 71,306,506.94 7,139,250.00 78,445,756.94
Short-term borrowings 2,125,987,979.17 2,144,873,929.85 – – 2,144,873,929.85
Long-term borrowings 2,809,378,411.44 108,739,057.73 1,969,376,026.84 1,271,148,313.36 3,349,263,397.93
Accounts payable 9,547,286,216.70 9,547,286,216.70 – – 9,547,286,216.70
Other payables 2,415,771,477.59 2,415,771,477.59 – – 2,415,771,477.59
Non-current liabilities due within
1 year 7,218,000,641.70 7,397,773,893.86 – – 7,397,773,893.86
Other current liabilities 184,224,950.88 184,224,950.88 – – 184,224,950.88
Bonds payable 1,349,483,424.67 55,500,000.00 1,508,210,958.90 – 1,563,710,958.90
Lease liabilities 1,755,115,255.85 – 1,011,597,448.40 1,295,064,437.27 2,306,661,885.67
Long-term payables 187,457,752.59 9,255,203.81 195,742,905.75 32,202,460.53 227,945,366.28
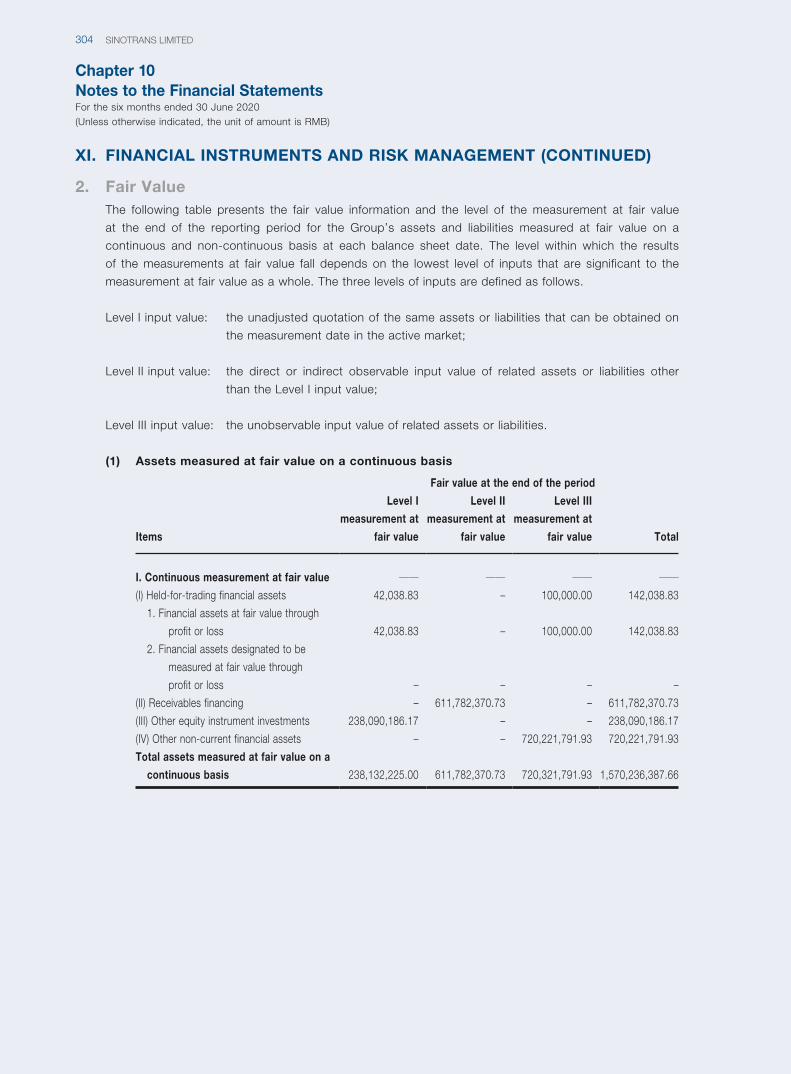
Chapter 10Notes to the Financial StatementsFor the six months ended 30 June 2020(Unless otherwise indicated, the unit of amount is RMB)
SINOTRANS LIMITED304
XI. FINANCIAL INSTRUMENTS AND RISK MANAGEMENT (CONTINUED)
2. Fair ValueThe following table presents the fair value information and the level of the measurement at fair value
at the end of the reporting period for the Group’s assets and liabilities measured at fair value on a
continuous and non-continuous basis at each balance sheet date. The level within which the results
of the measurements at fair value fall depends on the lowest level of inputs that are significant to the
measurement at fair value as a whole. The three levels of inputs are defined as follows.
Level I input value: the unadjusted quotation of the same assets or liabilities that can be obtained on
the measurement date in the active market;
Level II input value: the direct or indirect observable input value of related assets or liabilities other
than the Level I input value;
Level III input value: the unobservable input value of related assets or liabilities.
(1) Assets measured at fair value on a continuous basis
Items
Fair value at the end of the period
Level I
measurement at
fair value
Level II
measurement at
fair value
Level III
measurement at
fair value Total
I. Continuous measurement at fair value —— —— —— ——(I) Held-for-trading financial assets 42,038.83 – 100,000.00 142,038.83
1. Financial assets at fair value through
profit or loss 42,038.83 – 100,000.00 142,038.83
2. Financial assets designated to be
measured at fair value through
profit or loss – – – –
(II) Receivables financing – 611,782,370.73 – 611,782,370.73
(III) Other equity instrument investments 238,090,186.17 – – 238,090,186.17
(IV) Other non-current financial assets – – 720,221,791.93 720,221,791.93
Total assets measured at fair value on a
continuous basis 238,132,225.00 611,782,370.73 720,321,791.93 1,570,236,387.66
Chapter 10Notes to the Financial Statements
For the six months ended 30 June 2020(Unless otherwise indicated, the unit of amount is RMB)
305INTERIM REPORT 2020
XI. FINANCIAL INSTRUMENTS AND RISK MANAGEMENT (CONTINUED)
2. Fair Value (continued)(2) Determination of market price of continuous and non-continuous items of level I
measurement at fair value
The Group’s financial instruments included in Level I measurement at fair value are shares held in
listed companies, both domestic and foreign, and the fair value is determined using the closing
price of the open market on the last trading day of the date of the statement of financial position.
(3) Qualitative and quantitative information on the valuation techniques and significant
parameters used for continuous and non-continuous items of level II measurement at fair
value
The Group’s financial instruments included in Level II measurement at fair value are bank
acceptance bills held at fair value through other comprehensive income (receivables financing).
The accepting banks for the bank acceptance bills held by the Group are mainly large commercial
banks with high credit ratings, with maturities of less than 6 months and minimal credit risk. At
the date of the statement of financial position, the carrying value of the bank acceptance bills
receivable approximates its fair value.
(4) Qualitative and quantitative information on the valuation techniques and significant
parameters used for continuous and non-continuous items of level III measurement at
fair value
The Group’s financial instruments included in Level III measurement at fair value are primarily
unlisted equity investments held by the Company and its subsidiaries. The Company and its
subsidiaries use valuation techniques to determine the fair value of significant unlisted equity
investments. The valuation model used is a market multiplier approach, and the input values to the
valuation technique consist primarily of PE multiples of comparable listed companies, PB multiples
and the lack of market liquidity discount parameters. The primary unobservable input value used
is the lack of market liquidity discount. The higher the lack of a market liquidity discount, the lower
the fair value.
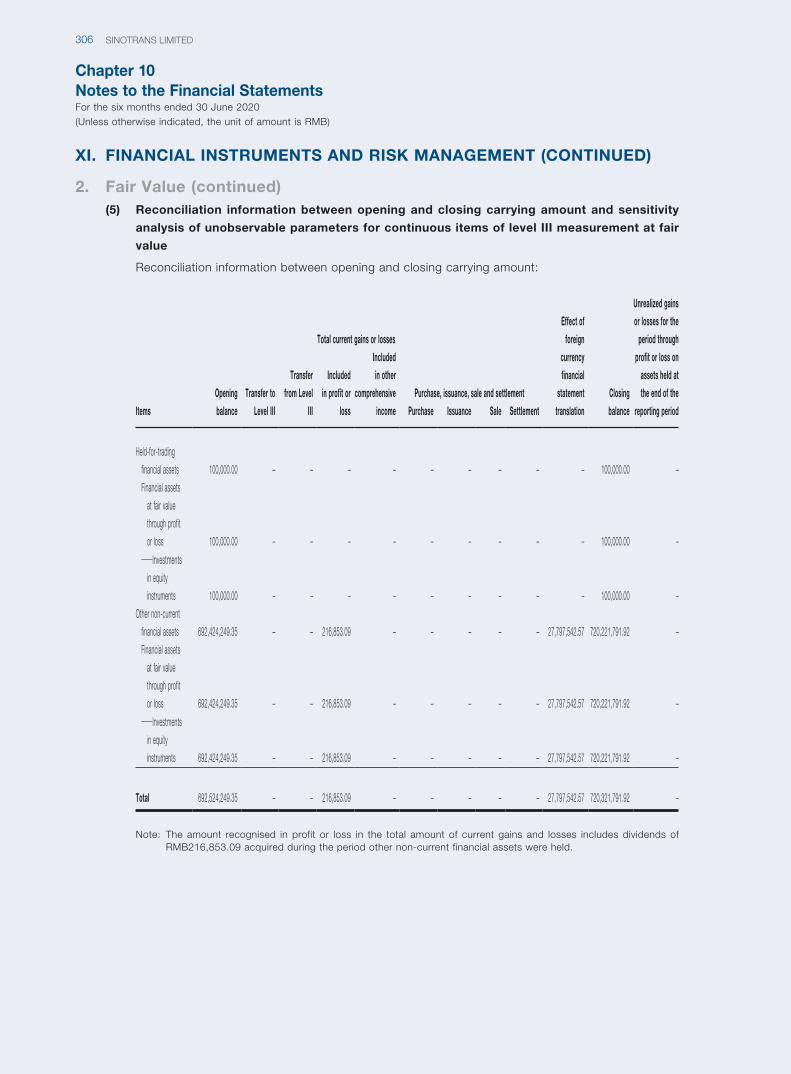
Chapter 10Notes to the Financial StatementsFor the six months ended 30 June 2020(Unless otherwise indicated, the unit of amount is RMB)
SINOTRANS LIMITED306
XI. FINANCIAL INSTRUMENTS AND RISK MANAGEMENT (CONTINUED)
2. Fair Value (continued)(5) Reconciliation information between opening and closing carrying amount and sensitivity
analysis of unobservable parameters for continuous items of level III measurement at fair
value
Reconciliation information between opening and closing carrying amount:
Items
Opening
balance
Transfer to
Level III
Transfer
from Level
III
Total current gains or losses
Purchase, issuance, sale and settlement
Effect of
foreign
currency
financial
statement
translation
Closing
balance
Unrealized gains
or losses for the
period through
profit or loss on
assets held at
the end of the
reporting period
Included
in profit or
loss
Included
in other
comprehensive
income Purchase Issuance Sale Settlement
Held-for-trading
financial assets 100,000.00 – – – – – – – – – 100,000.00 –
Financial assets
at fair value
through profit
or loss 100,000.00 – – – – – – – – – 100,000.00 –
——Investments
in equity
instruments 100,000.00 – – – – – – – – – 100,000.00 –
Other non-current
financial assets 692,424,249.35 – – 216,853.09 – – – – – 27,797,542.57 720,221,791.92 –
Financial assets
at fair value
through profit
or loss 692,424,249.35 – – 216,853.09 – – – – – 27,797,542.57 720,221,791.92 –
——Investments
in equity
instruments 692,424,249.35 – – 216,853.09 – – – – – 27,797,542.57 720,221,791.92 –
Total 692,524,249.35 – – 216,853.09 – – – – – 27,797,542.57 720,321,791.92 –
Note: The amount recognised in profit or loss in the total amount of current gains and losses includes dividends of RMB216,853.09 acquired during the period other non-current financial assets were held.
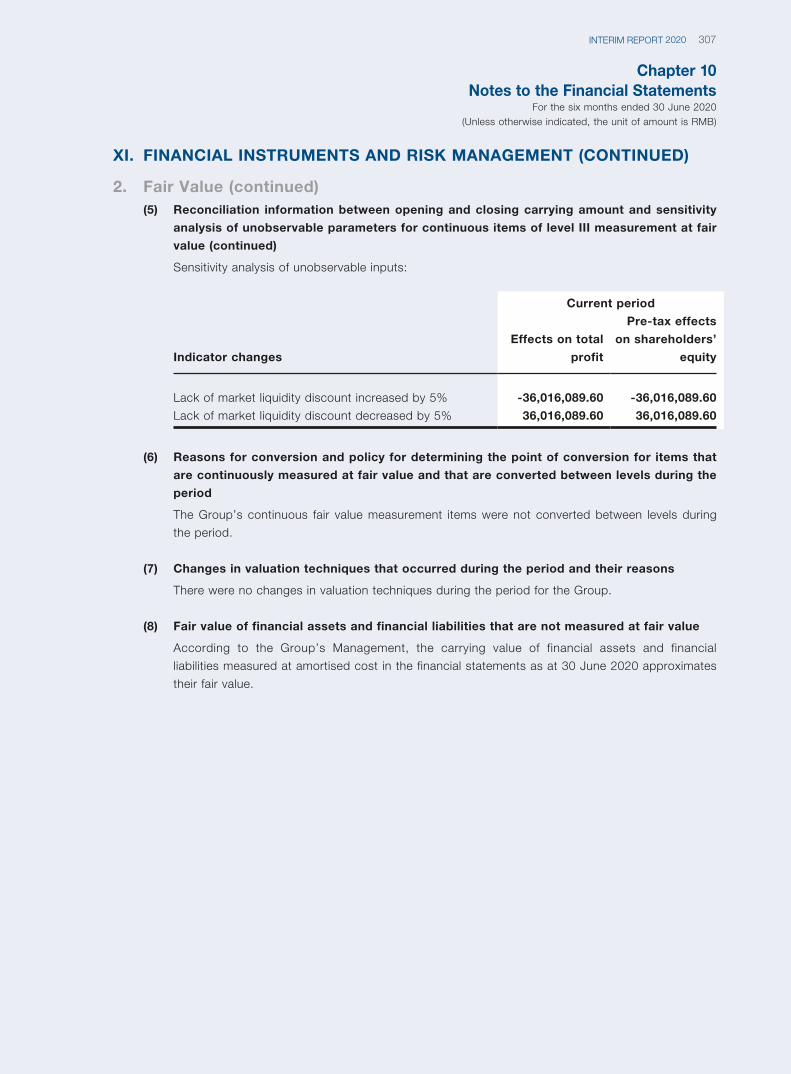
Chapter 10Notes to the Financial Statements
For the six months ended 30 June 2020(Unless otherwise indicated, the unit of amount is RMB)
307INTERIM REPORT 2020
XI. FINANCIAL INSTRUMENTS AND RISK MANAGEMENT (CONTINUED)
2. Fair Value (continued)(5) Reconciliation information between opening and closing carrying amount and sensitivity
analysis of unobservable parameters for continuous items of level III measurement at fair
value (continued)
Sensitivity analysis of unobservable inputs:
Indicator changes
Current period
Effects on total
profit
Pre-tax effects
on shareholders’
equity
Lack of market liquidity discount increased by 5% -36,016,089.60 -36,016,089.60
Lack of market liquidity discount decreased by 5% 36,016,089.60 36,016,089.60
(6) Reasons for conversion and policy for determining the point of conversion for items that
are continuously measured at fair value and that are converted between levels during the
period
The Group’s continuous fair value measurement items were not converted between levels during
the period.
(7) Changes in valuation techniques that occurred during the period and their reasons
There were no changes in valuation techniques during the period for the Group.
(8) Fair value of financial assets and financial liabilities that are not measured at fair value
According to the Group’s Management, the carrying value of financial assets and financial
liabilities measured at amortised cost in the financial statements as at 30 June 2020 approximates
their fair value.
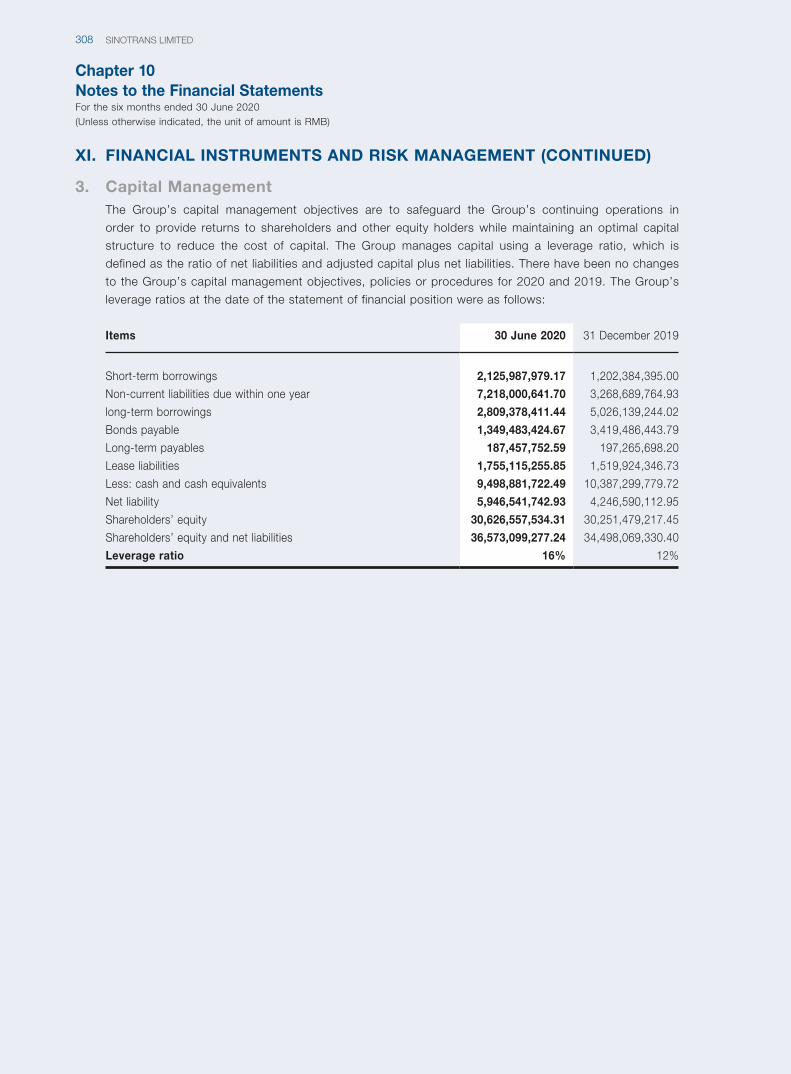
Chapter 10Notes to the Financial StatementsFor the six months ended 30 June 2020(Unless otherwise indicated, the unit of amount is RMB)
SINOTRANS LIMITED308
XI. FINANCIAL INSTRUMENTS AND RISK MANAGEMENT (CONTINUED)
3. Capital ManagementThe Group’s capital management objectives are to safeguard the Group’s continuing operations in
order to provide returns to shareholders and other equity holders while maintaining an optimal capital
structure to reduce the cost of capital. The Group manages capital using a leverage ratio, which is
defined as the ratio of net liabilities and adjusted capital plus net liabilities. There have been no changes
to the Group’s capital management objectives, policies or procedures for 2020 and 2019. The Group’s
leverage ratios at the date of the statement of financial position were as follows:
Items 30 June 2020 31 December 2019
Short-term borrowings 2,125,987,979.17 1,202,384,395.00
Non-current liabilities due within one year 7,218,000,641.70 3,268,689,764.93
long-term borrowings 2,809,378,411.44 5,026,139,244.02
Bonds payable 1,349,483,424.67 3,419,486,443.79
Long-term payables 187,457,752.59 197,265,698.20
Lease liabilities 1,755,115,255.85 1,519,924,346.73
Less: cash and cash equivalents 9,498,881,722.49 10,387,299,779.72
Net liability 5,946,541,742.93 4,246,590,112.95
Shareholders’ equity 30,626,557,534.31 30,251,479,217.45
Shareholders’ equity and net liabilities 36,573,099,277.24 34,498,069,330.40
Leverage ratio 16% 12%
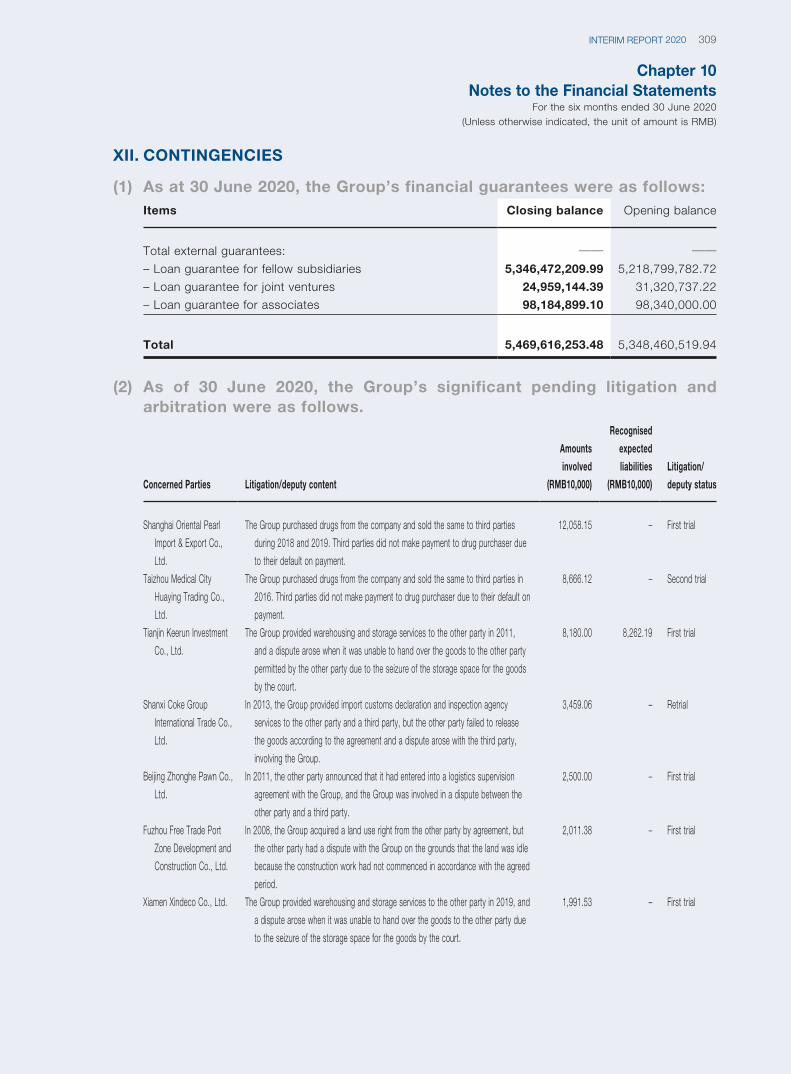
Chapter 10Notes to the Financial Statements
For the six months ended 30 June 2020(Unless otherwise indicated, the unit of amount is RMB)
309INTERIM REPORT 2020
XII. CONTINGENCIES
(1) As at 30 June 2020, the Group’s financial guarantees were as follows:Items Closing balance Opening balance
Total external guarantees: —— ——– Loan guarantee for fellow subsidiaries 5,346,472,209.99 5,218,799,782.72
– Loan guarantee for joint ventures 24,959,144.39 31,320,737.22
– Loan guarantee for associates 98,184,899.10 98,340,000.00
Total 5,469,616,253.48 5,348,460,519.94
(2) As of 30 June 2020, the Group’s significant pending litigation and arbitration were as follows.
Concerned Parties Litigation/deputy content
Amounts
involved
(RMB10,000)
Recognised
expected
liabilities
(RMB10,000)
Litigation/
deputy status
Shanghai Oriental Pearl
Import & Export Co.,
Ltd.
The Group purchased drugs from the company and sold the same to third parties
during 2018 and 2019. Third parties did not make payment to drug purchaser due
to their default on payment.
12,058.15 – First trial
Taizhou Medical City
Huaying Trading Co.,
Ltd.
The Group purchased drugs from the company and sold the same to third parties in
2016. Third parties did not make payment to drug purchaser due to their default on
payment.
8,666.12 – Second trial
Tianjin Keerun Investment
Co., Ltd.
The Group provided warehousing and storage services to the other party in 2011,
and a dispute arose when it was unable to hand over the goods to the other party
permitted by the other party due to the seizure of the storage space for the goods
by the court.
8,180.00 8,262.19 First trial
Shanxi Coke Group
International Trade Co.,
Ltd.
In 2013, the Group provided import customs declaration and inspection agency
services to the other party and a third party, but the other party failed to release
the goods according to the agreement and a dispute arose with the third party,
involving the Group.
3,459.06 – Retrial
Beijing Zhonghe Pawn Co.,
Ltd.
In 2011, the other party announced that it had entered into a logistics supervision
agreement with the Group, and the Group was involved in a dispute between the
other party and a third party.
2,500.00 – First trial
Fuzhou Free Trade Port
Zone Development and
Construction Co., Ltd.
In 2008, the Group acquired a land use right from the other party by agreement, but
the other party had a dispute with the Group on the grounds that the land was idle
because the construction work had not commenced in accordance with the agreed
period.
2,011.38 – First trial
Xiamen Xindeco Co., Ltd. The Group provided warehousing and storage services to the other party in 2019, and
a dispute arose when it was unable to hand over the goods to the other party due
to the seizure of the storage space for the goods by the court.
1,991.53 – First trial
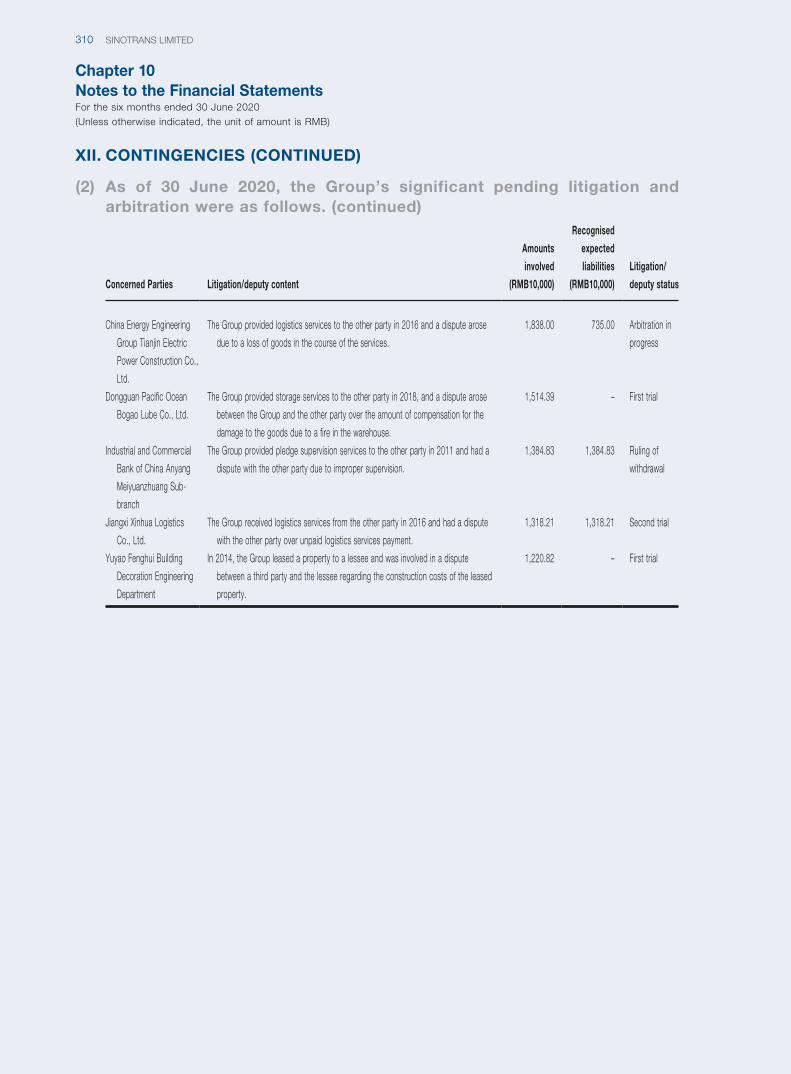
Chapter 10Notes to the Financial StatementsFor the six months ended 30 June 2020(Unless otherwise indicated, the unit of amount is RMB)
SINOTRANS LIMITED310
Concerned Parties Litigation/deputy content
Amounts
involved
(RMB10,000)
Recognised
expected
liabilities
(RMB10,000)
Litigation/
deputy status
China Energy Engineering
Group Tianjin Electric
Power Construction Co.,
Ltd.
The Group provided logistics services to the other party in 2016 and a dispute arose
due to a loss of goods in the course of the services.
1,838.00 735.00 Arbitration in
progress
Dongguan Pacific Ocean
Bogao Lube Co., Ltd.
The Group provided storage services to the other party in 2018, and a dispute arose
between the Group and the other party over the amount of compensation for the
damage to the goods due to a fire in the warehouse.
1,514.39 – First trial
Industrial and Commercial
Bank of China Anyang
Meiyuanzhuang Sub-
branch
The Group provided pledge supervision services to the other party in 2011 and had a
dispute with the other party due to improper supervision.
1,384.83 1,384.83 Ruling of
withdrawal
Jiangxi Xinhua Logistics
Co., Ltd.
The Group received logistics services from the other party in 2016 and had a dispute
with the other party over unpaid logistics services payment.
1,318.21 1,318.21 Second trial
Yuyao Fenghui Building
Decoration Engineering
Department
In 2014, the Group leased a property to a lessee and was involved in a dispute
between a third party and the lessee regarding the construction costs of the leased
property.
1,220.82 – First trial
XII. CONTINGENCIES (CONTINUED)
(2) As of 30 June 2020, the Group’s significant pending litigation and arbitration were as follows. (continued)
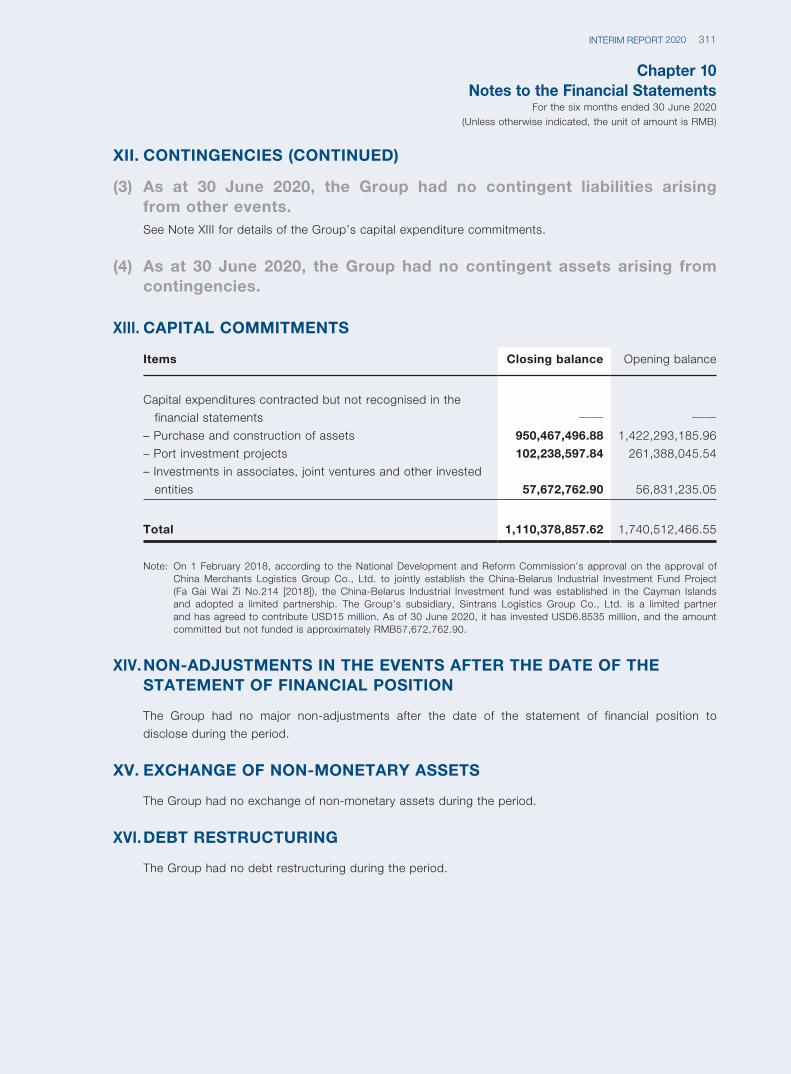
Chapter 10Notes to the Financial Statements
For the six months ended 30 June 2020(Unless otherwise indicated, the unit of amount is RMB)
311INTERIM REPORT 2020
XII. CONTINGENCIES (CONTINUED)
(3) As at 30 June 2020, the Group had no contingent liabilities arising from other events.See Note XIII for details of the Group’s capital expenditure commitments.
(4) As at 30 June 2020, the Group had no contingent assets arising from contingencies.
XIII. CAPITAL COMMITMENTS
Items Closing balance Opening balance
Capital expenditures contracted but not recognised in the
financial statements —— ——– Purchase and construction of assets 950,467,496.88 1,422,293,185.96
– Port investment projects 102,238,597.84 261,388,045.54
– Investments in associates, joint ventures and other invested
entities 57,672,762.90 56,831,235.05
Total 1,110,378,857.62 1,740,512,466.55
Note: On 1 February 2018, according to the National Development and Reform Commission’s approval on the approval of China Merchants Logistics Group Co., Ltd. to jointly establish the China-Belarus Industrial Investment Fund Project (Fa Gai Wai Zi No.214 [2018]), the China-Belarus Industrial Investment fund was established in the Cayman Islands and adopted a limited partnership. The Group’s subsidiary, Sintrans Logistics Group Co., Ltd. is a limited partner and has agreed to contribute USD15 million. As of 30 June 2020, it has invested USD6.8535 million, and the amount committed but not funded is approximately RMB57,672,762.90.
XIV. NON-ADJUSTMENTS IN THE EVENTS AFTER THE DATE OF THE STATEMENT OF FINANCIAL POSITION
The Group had no major non-adjustments after the date of the statement of financial position to
disclose during the period.
XV. EXCHANGE OF NON-MONETARY ASSETS
The Group had no exchange of non-monetary assets during the period.
XVI. DEBT RESTRUCTURING
The Group had no debt restructuring during the period.
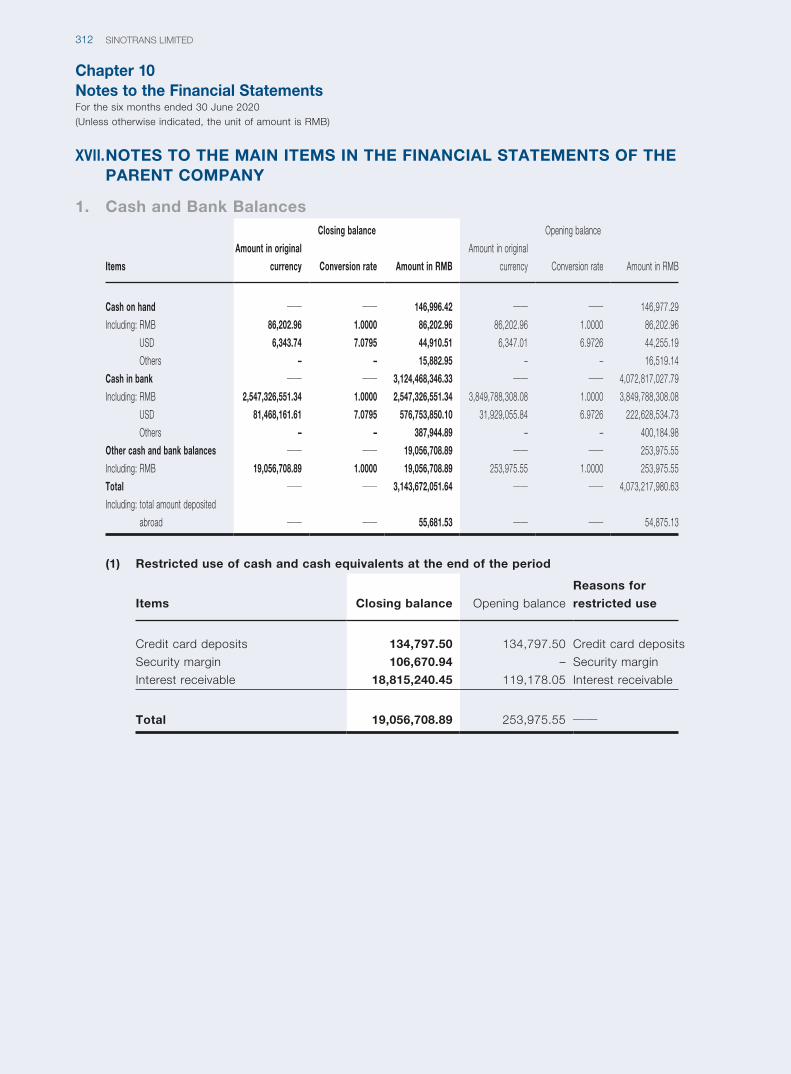
Chapter 10Notes to the Financial StatementsFor the six months ended 30 June 2020(Unless otherwise indicated, the unit of amount is RMB)
SINOTRANS LIMITED312
XVII. NOTES TO THE MAIN ITEMS IN THE FINANCIAL STATEMENTS OF THE PARENT COMPANY
1. Cash and Bank Balances
Items
Closing balance Opening balance
Amount in original
currency Conversion rate Amount in RMB
Amount in original
currency Conversion rate Amount in RMB
Cash on hand —— —— 146,996.42 —— —— 146,977.29
Including: RMB 86,202.96 1.0000 86,202.96 86,202.96 1.0000 86,202.96
USD 6,343.74 7.0795 44,910.51 6,347.01 6.9726 44,255.19
Others – – 15,882.95 – – 16,519.14
Cash in bank —— —— 3,124,468,346.33 —— —— 4,072,817,027.79
Including: RMB 2,547,326,551.34 1.0000 2,547,326,551.34 3,849,788,308.08 1.0000 3,849,788,308.08
USD 81,468,161.61 7.0795 576,753,850.10 31,929,055.84 6.9726 222,628,534.73
Others – – 387,944.89 – – 400,184.98
Other cash and bank balances —— —— 19,056,708.89 —— —— 253,975.55
Including: RMB 19,056,708.89 1.0000 19,056,708.89 253,975.55 1.0000 253,975.55
Total —— —— 3,143,672,051.64 —— —— 4,073,217,980.63
Including: total amount deposited
abroad —— —— 55,681.53 —— —— 54,875.13
(1) Restricted use of cash and cash equivalents at the end of the period
Items Closing balance Opening balance
Reasons for
restricted use
Credit card deposits 134,797.50 134,797.50 Credit card deposits
Security margin 106,670.94 – Security margin
Interest receivable 18,815,240.45 119,178.05 Interest receivable
Total 19,056,708.89 253,975.55 ——
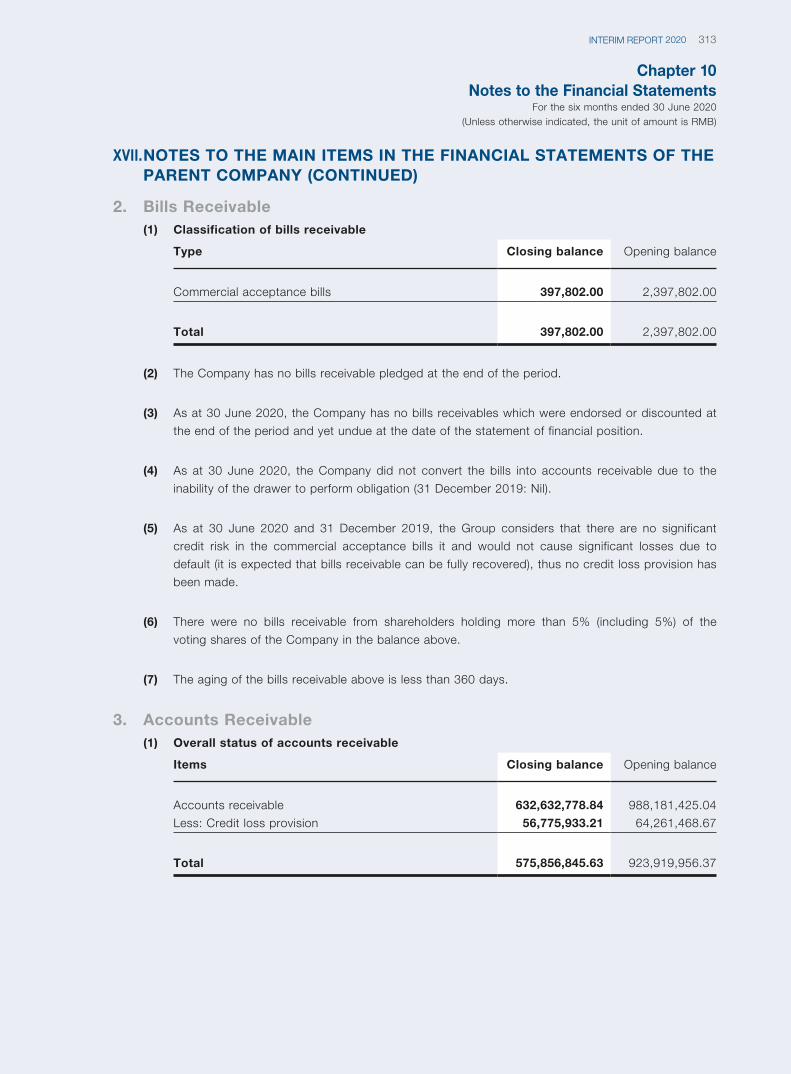
Chapter 10Notes to the Financial Statements
For the six months ended 30 June 2020(Unless otherwise indicated, the unit of amount is RMB)
313INTERIM REPORT 2020
XVII. NOTES TO THE MAIN ITEMS IN THE FINANCIAL STATEMENTS OF THE PARENT COMPANY (CONTINUED)
2. Bills Receivable(1) Classification of bills receivable
Type Closing balance Opening balance
Commercial acceptance bills 397,802.00 2,397,802.00
Total 397,802.00 2,397,802.00
(2) The Company has no bills receivable pledged at the end of the period.
(3) As at 30 June 2020, the Company has no bills receivables which were endorsed or discounted at
the end of the period and yet undue at the date of the statement of financial position.
(4) As at 30 June 2020, the Company did not convert the bills into accounts receivable due to the
inability of the drawer to perform obligation (31 December 2019: Nil).
(5) As at 30 June 2020 and 31 December 2019, the Group considers that there are no significant
credit risk in the commercial acceptance bills it and would not cause significant losses due to
default (it is expected that bills receivable can be fully recovered), thus no credit loss provision has
been made.
(6) There were no bills receivable from shareholders holding more than 5% (including 5%) of the
voting shares of the Company in the balance above.
(7) The aging of the bills receivable above is less than 360 days.
3. Accounts Receivable(1) Overall status of accounts receivable
Items Closing balance Opening balance
Accounts receivable 632,632,778.84 988,181,425.04
Less: Credit loss provision 56,775,933.21 64,261,468.67
Total 575,856,845.63 923,919,956.37
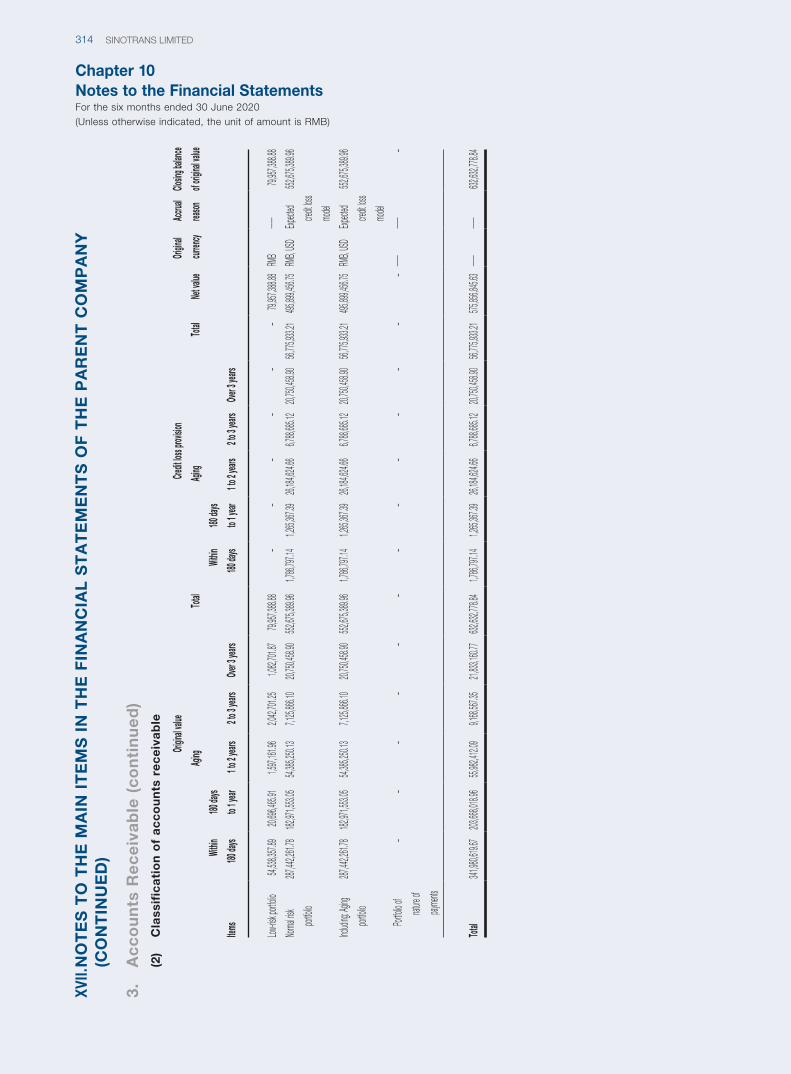
Chapter 10Notes to the Financial StatementsFor the six months ended 30 June 2020(Unless otherwise indicated, the unit of amount is RMB)
SINOTRANS LIMITED314
XVII.
NO
TE
S T
O T
HE
MA
IN I
TE
MS
IN
TH
E F
INA
NC
IAL
ST
AT
EM
EN
TS
OF
TH
E P
AR
EN
T C
OM
PA
NY
(C
ON
TIN
UE
D)
3.
Ac
co
un
ts R
ec
eiv
ab
le (
co
nti
nu
ed
)(2
) C
lass
ific
ati
on
of
ac
co
un
ts r
ec
eiv
ab
le
Items
Origin
al valu
eCre
dit los
s prov
ision
Net va
lue
Origin
al
curren
cy
Accrua
l
reason
Closin
g bala
nce
of ori
ginal v
alue
Aging
Total
Aging
Total
Within
180 da
ys
180 da
ys
to 1 y
ear1 to
2 year
s2 to
3 year
sOv
er 3 y
ears
Within
180 da
ys
180 da
ys
to 1 y
ear1 to
2 year
s2 to
3 year
sOv
er 3 y
ears
Low-ris
k portf
olio54,
538,35
7.89
20,696
,465.9
11,5
97,161
.962,0
42,701
.251,0
82,701
.8779,
957,38
8.88
––
––
––
79,957
,388.8
8RM
B——
79,957
,388.8
8
Norma
l risk
portfol
io
287,44
2,261.
78182
,971,5
53.05
54,385
,250.1
37,1
25,866
.1020,
750,45
8.90
552,67
5,389.
961,7
86,797
.141,2
65,367
.3926,
184,62
4.66
6,788,
685.12
20,750
,458.9
056,
775,93
3.21
495,89
9,456.
75RM
B, US
DExp
ected
credit
loss
model
552,67
5,389.
96
Includ
ing: Ag
ing
portfol
io
287,44
2,261.
78182
,971,5
53.05
54,385
,250.1
37,1
25,866
.1020,
750,45
8.90
552,67
5,389.
961,7
86,797
.141,2
65,367
.3926,
184,62
4.66
6,788,
685.12
20,750
,458.9
056,
775,93
3.21
495,89
9,456.
75RM
B, US
DExp
ected
credit
loss
model
552,67
5,389.
96
Portfol
io of
nature
of
payme
nts
––
––
––
––
––
––
–——
——–
Total
341,98
0,619.
67203
,668,0
18.96
55,982
,412.0
99,1
68,567
.3521,
833,16
0.77
632,63
2,778.
841,7
86,797
.141,2
65,367
.3926,
184,62
4.66
6,788,
685.12
20,750
,458.9
056,
775,93
3.21
575,85
6,845.
63——
——632
,632,7
78.84
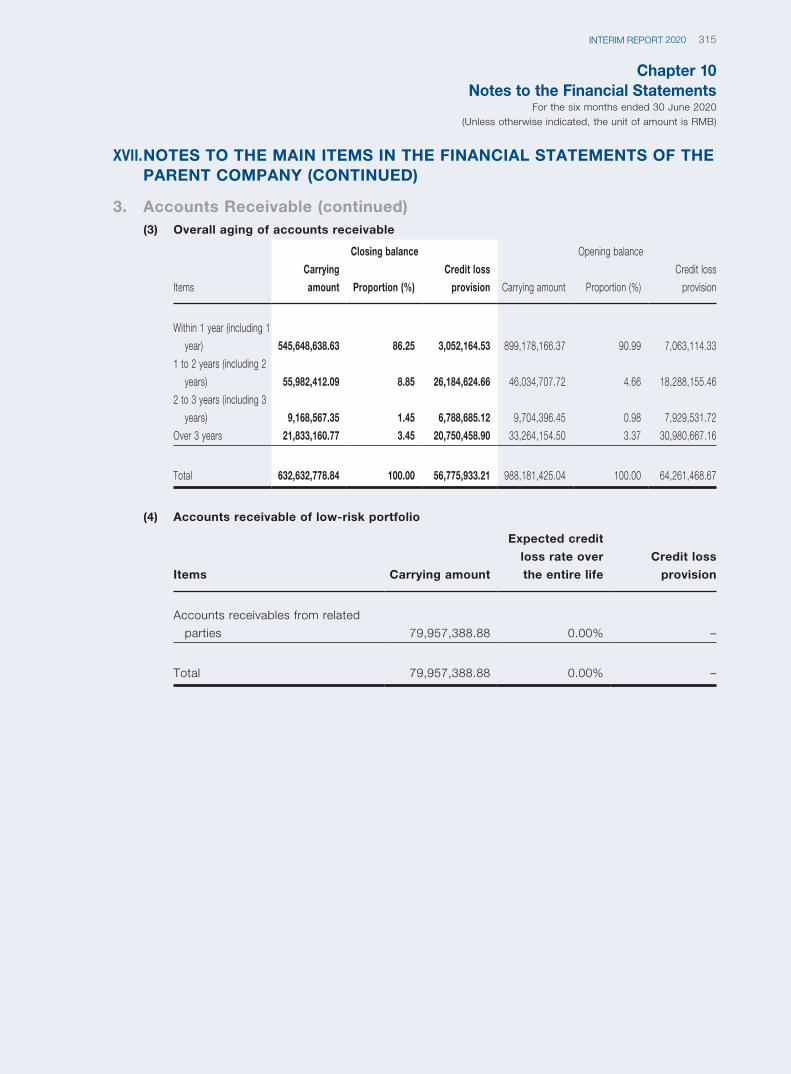
Chapter 10Notes to the Financial Statements
For the six months ended 30 June 2020(Unless otherwise indicated, the unit of amount is RMB)
315INTERIM REPORT 2020
XVII. NOTES TO THE MAIN ITEMS IN THE FINANCIAL STATEMENTS OF THE PARENT COMPANY (CONTINUED)
3. Accounts Receivable (continued)(3) Overall aging of accounts receivable
Items
Closing balance Opening balance
Carrying
amount Proportion (%)
Credit loss
provision Carrying amount Proportion (%)
Credit loss
provision
Within 1 year (including 1
year) 545,648,638.63 86.25 3,052,164.53 899,178,166.37 90.99 7,063,114.33
1 to 2 years (including 2
years) 55,982,412.09 8.85 26,184,624.66 46,034,707.72 4.66 18,288,155.46
2 to 3 years (including 3
years) 9,168,567.35 1.45 6,788,685.12 9,704,396.45 0.98 7,929,531.72
Over 3 years 21,833,160.77 3.45 20,750,458.90 33,264,154.50 3.37 30,980,667.16
Total 632,632,778.84 100.00 56,775,933.21 988,181,425.04 100.00 64,261,468.67
(4) Accounts receivable of low-risk portfolio
Items Carrying amount
Expected credit
loss rate over
the entire life
Credit loss
provision
Accounts receivables from related
parties 79,957,388.88 0.00% –
Total 79,957,388.88 0.00% –
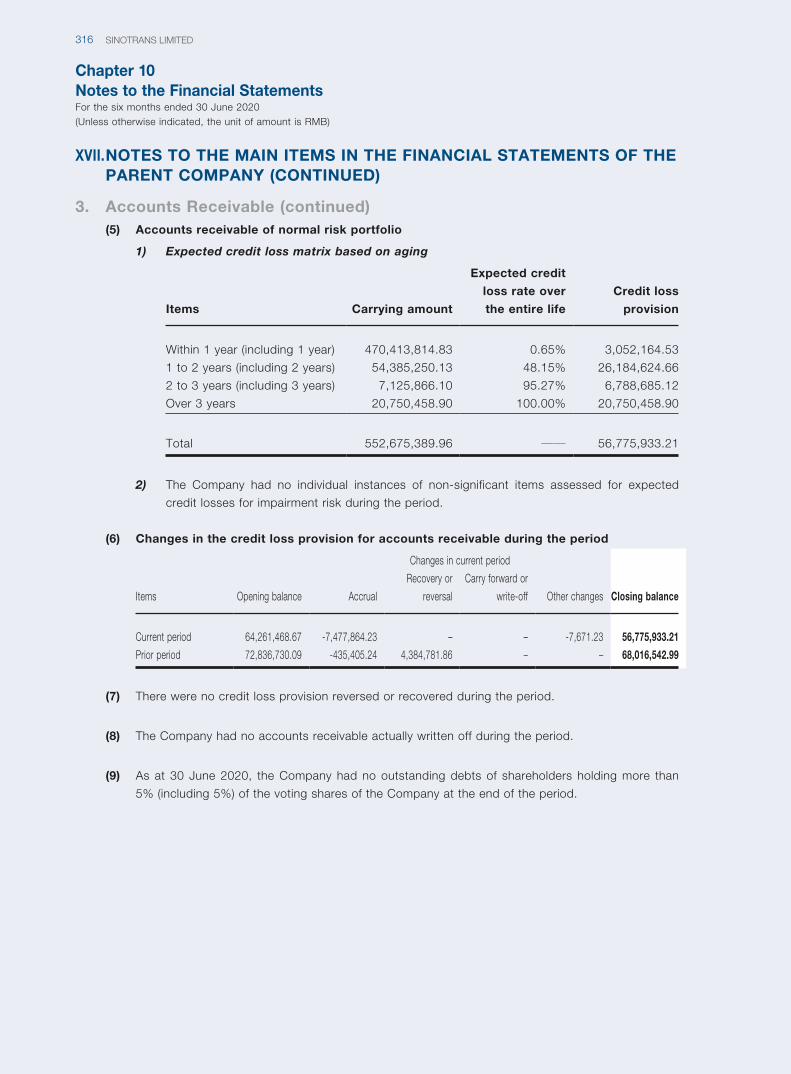
Chapter 10Notes to the Financial StatementsFor the six months ended 30 June 2020(Unless otherwise indicated, the unit of amount is RMB)
SINOTRANS LIMITED316
XVII. NOTES TO THE MAIN ITEMS IN THE FINANCIAL STATEMENTS OF THE PARENT COMPANY (CONTINUED)
3. Accounts Receivable (continued)(5) Accounts receivable of normal risk portfolio
1) Expected credit loss matrix based on aging
Items Carrying amount
Expected credit
loss rate over
the entire life
Credit loss
provision
Within 1 year (including 1 year) 470,413,814.83 0.65% 3,052,164.53
1 to 2 years (including 2 years) 54,385,250.13 48.15% 26,184,624.66
2 to 3 years (including 3 years) 7,125,866.10 95.27% 6,788,685.12
Over 3 years 20,750,458.90 100.00% 20,750,458.90
Total 552,675,389.96 —— 56,775,933.21
2) The Company had no individual instances of non-significant items assessed for expected
credit losses for impairment risk during the period.
(6) Changes in the credit loss provision for accounts receivable during the period
Items Opening balance
Changes in current period
Closing balanceAccrual
Recovery or
reversal
Carry forward or
write-off Other changes
Current period 64,261,468.67 -7,477,864.23 – – -7,671.23 56,775,933.21
Prior period 72,836,730.09 -435,405.24 4,384,781.86 – – 68,016,542.99
(7) There were no credit loss provision reversed or recovered during the period.
(8) The Company had no accounts receivable actually written off during the period.
(9) As at 30 June 2020, the Company had no outstanding debts of shareholders holding more than
5% (including 5%) of the voting shares of the Company at the end of the period.
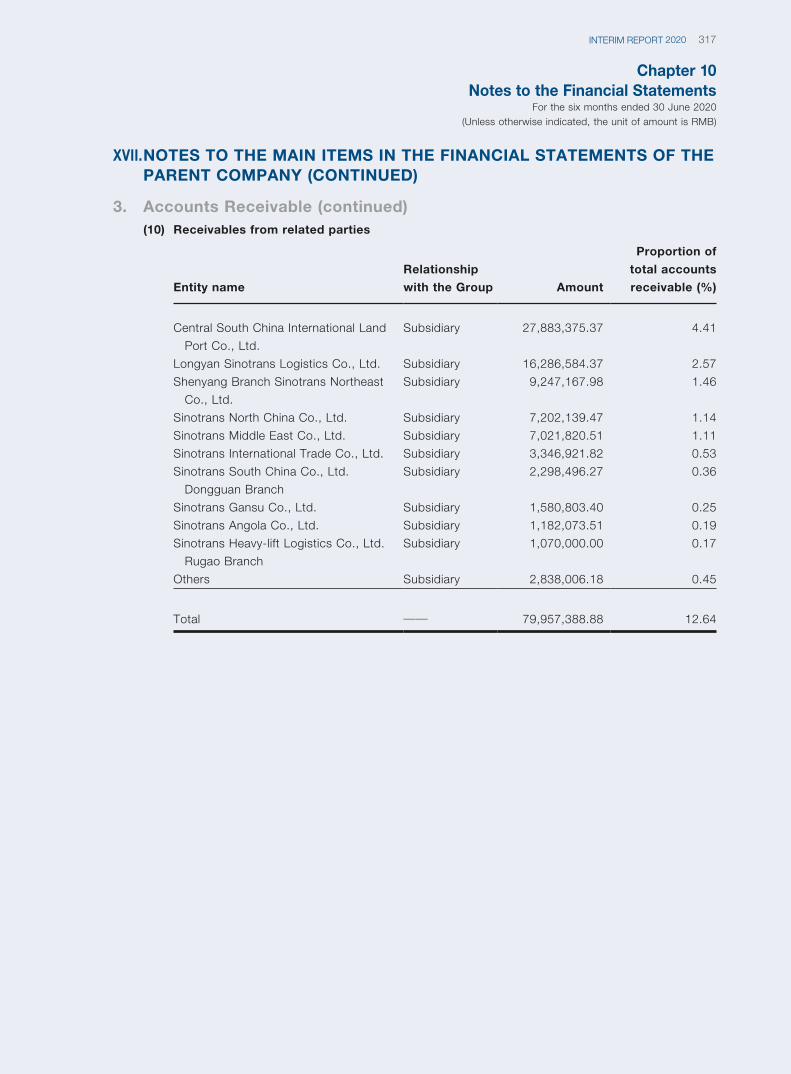
Chapter 10Notes to the Financial Statements
For the six months ended 30 June 2020(Unless otherwise indicated, the unit of amount is RMB)
317INTERIM REPORT 2020
XVII. NOTES TO THE MAIN ITEMS IN THE FINANCIAL STATEMENTS OF THE PARENT COMPANY (CONTINUED)
3. Accounts Receivable (continued)(10) Receivables from related parties
Entity name
Relationship
with the Group Amount
Proportion of
total accounts
receivable (%)
Central South China International Land
Port Co., Ltd.
Subsidiary 27,883,375.37 4.41
Longyan Sinotrans Logistics Co., Ltd. Subsidiary 16,286,584.37 2.57
Shenyang Branch Sinotrans Northeast
Co., Ltd.
Subsidiary 9,247,167.98 1.46
Sinotrans North China Co., Ltd. Subsidiary 7,202,139.47 1.14
Sinotrans Middle East Co., Ltd. Subsidiary 7,021,820.51 1.11
Sinotrans International Trade Co., Ltd. Subsidiary 3,346,921.82 0.53
Sinotrans South China Co., Ltd.
Dongguan Branch
Subsidiary 2,298,496.27 0.36
Sinotrans Gansu Co., Ltd. Subsidiary 1,580,803.40 0.25
Sinotrans Angola Co., Ltd. Subsidiary 1,182,073.51 0.19
Sinotrans Heavy-lift Logistics Co., Ltd.
Rugao Branch
Subsidiary 1,070,000.00 0.17
Others Subsidiary 2,838,006.18 0.45
Total —— 79,957,388.88 12.64
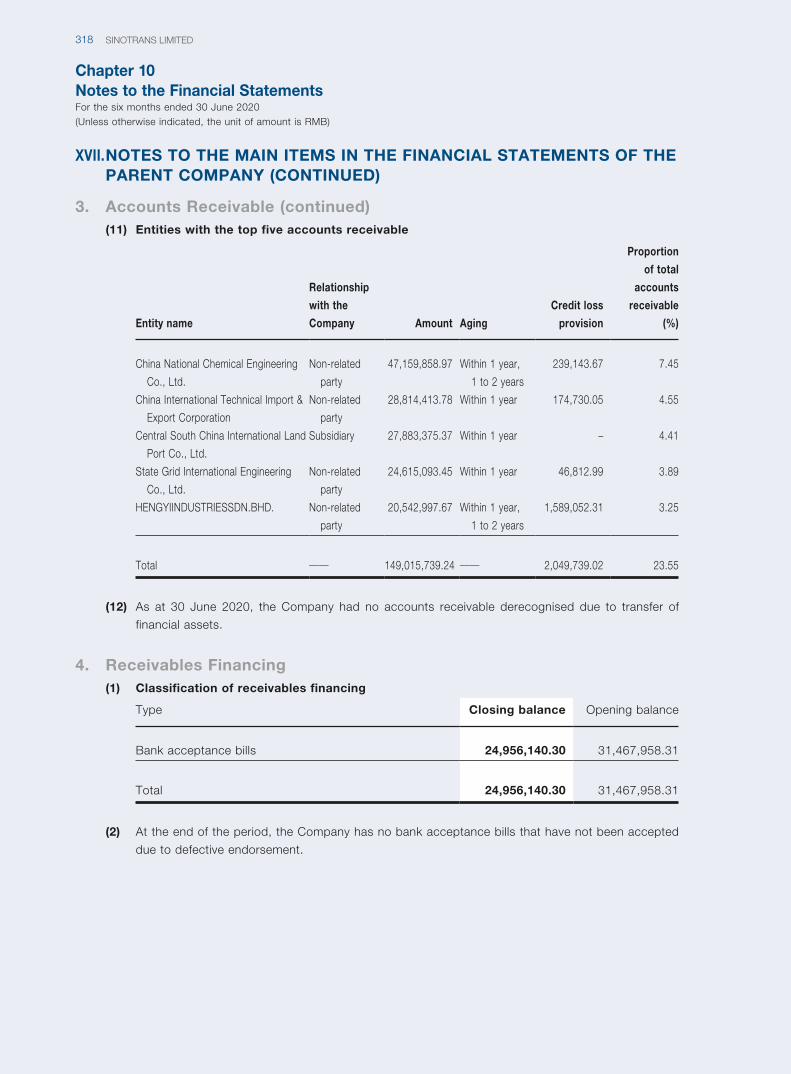
Chapter 10Notes to the Financial StatementsFor the six months ended 30 June 2020(Unless otherwise indicated, the unit of amount is RMB)
SINOTRANS LIMITED318
XVII. NOTES TO THE MAIN ITEMS IN THE FINANCIAL STATEMENTS OF THE PARENT COMPANY (CONTINUED)
3. Accounts Receivable (continued)(11) Entities with the top five accounts receivable
Entity name
Relationship
with the
Company Amount Aging
Credit loss
provision
Proportion
of total
accounts
receivable
(%)
China National Chemical Engineering
Co., Ltd.
Non-related
party
47,159,858.97 Within 1 year,
1 to 2 years
239,143.67 7.45
China International Technical Import &
Export Corporation
Non-related
party
28,814,413.78 Within 1 year 174,730.05 4.55
Central South China International Land
Port Co., Ltd.
Subsidiary 27,883,375.37 Within 1 year – 4.41
State Grid International Engineering
Co., Ltd.
Non-related
party
24,615,093.45 Within 1 year 46,812.99 3.89
HENGYIINDUSTRIESSDN.BHD. Non-related
party
20,542,997.67 Within 1 year,
1 to 2 years
1,589,052.31 3.25
Total —— 149,015,739.24 —— 2,049,739.02 23.55
(12) As at 30 June 2020, the Company had no accounts receivable derecognised due to transfer of
financial assets.
4. Receivables Financing(1) Classification of receivables financing
Type Closing balance Opening balance
Bank acceptance bills 24,956,140.30 31,467,958.31
Total 24,956,140.30 31,467,958.31
(2) At the end of the period, the Company has no bank acceptance bills that have not been accepted
due to defective endorsement.
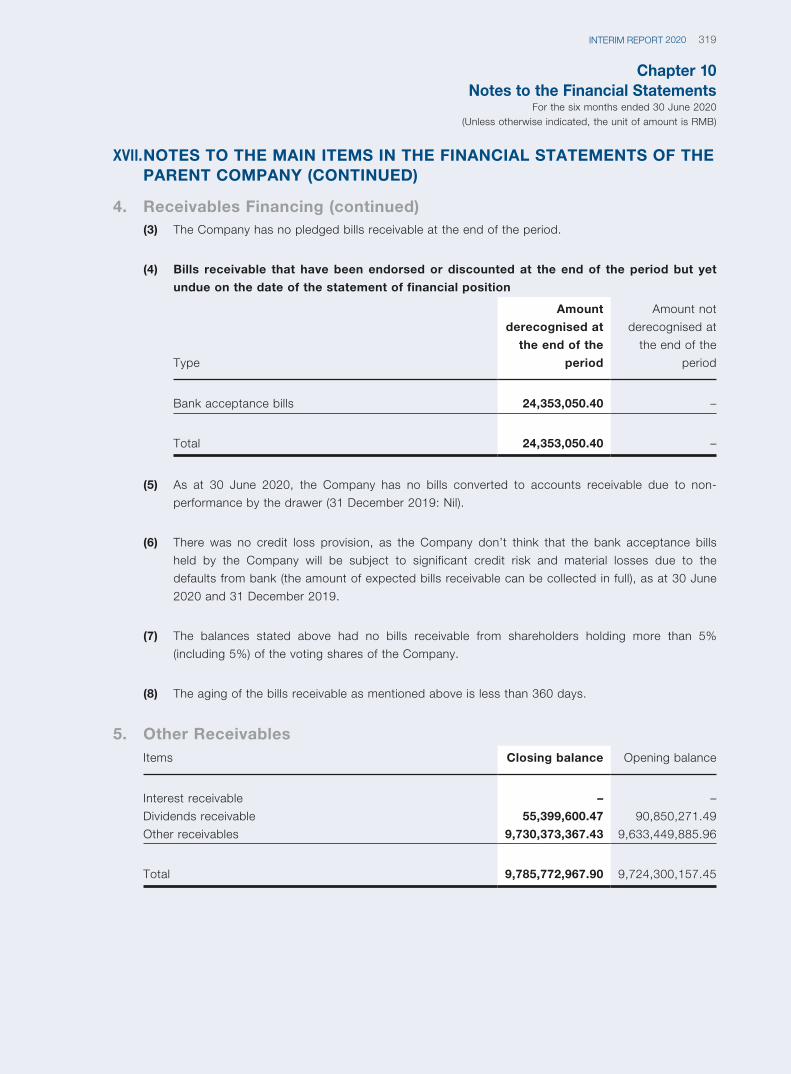
Chapter 10Notes to the Financial Statements
For the six months ended 30 June 2020(Unless otherwise indicated, the unit of amount is RMB)
319INTERIM REPORT 2020
XVII. NOTES TO THE MAIN ITEMS IN THE FINANCIAL STATEMENTS OF THE PARENT COMPANY (CONTINUED)
4. Receivables Financing (continued)(3) The Company has no pledged bills receivable at the end of the period.
(4) Bills receivable that have been endorsed or discounted at the end of the period but yet
undue on the date of the statement of financial position
Type
Amount
derecognised at
the end of the
period
Amount not
derecognised at
the end of the
period
Bank acceptance bills 24,353,050.40 –
Total 24,353,050.40 –
(5) As at 30 June 2020, the Company has no bills converted to accounts receivable due to non-
performance by the drawer (31 December 2019: Nil).
(6) There was no credit loss provision, as the Company don’t think that the bank acceptance bills
held by the Company will be subject to significant credit risk and material losses due to the
defaults from bank (the amount of expected bills receivable can be collected in full), as at 30 June
2020 and 31 December 2019.
(7) The balances stated above had no bills receivable from shareholders holding more than 5%
(including 5%) of the voting shares of the Company.
(8) The aging of the bills receivable as mentioned above is less than 360 days.
5. Other ReceivablesItems Closing balance Opening balance
Interest receivable – –
Dividends receivable 55,399,600.47 90,850,271.49
Other receivables 9,730,373,367.43 9,633,449,885.96
Total 9,785,772,967.90 9,724,300,157.45
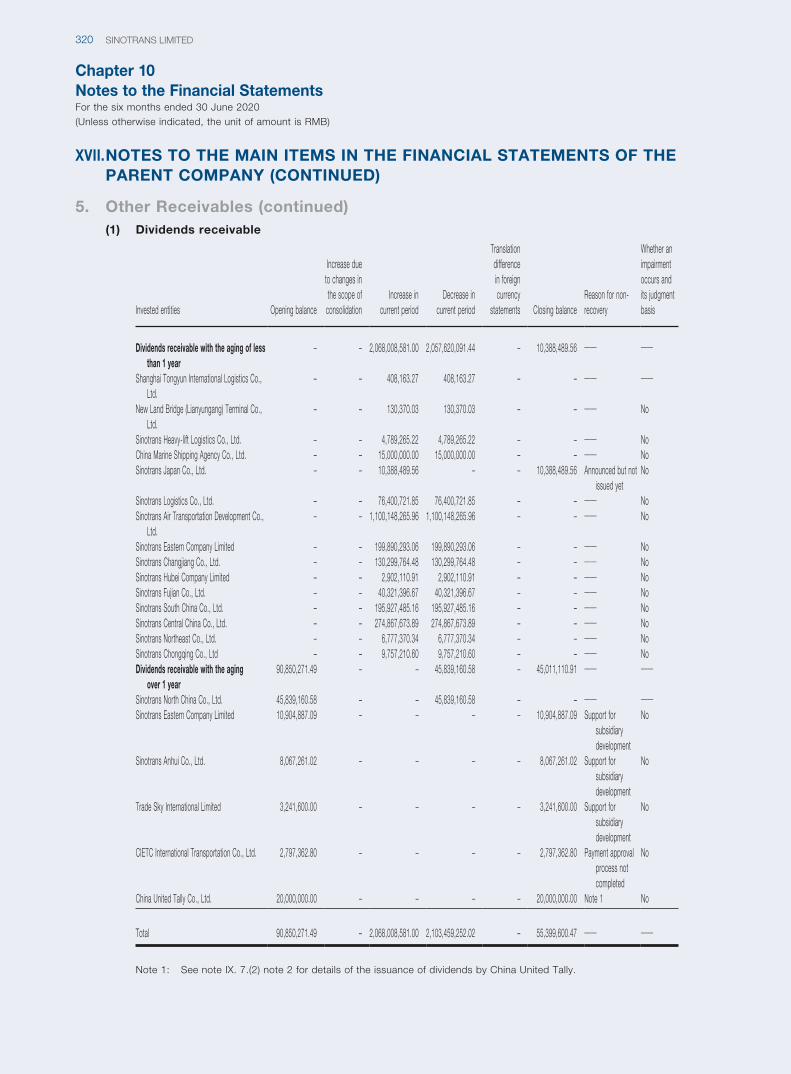
Chapter 10Notes to the Financial StatementsFor the six months ended 30 June 2020(Unless otherwise indicated, the unit of amount is RMB)
SINOTRANS LIMITED320
XVII. NOTES TO THE MAIN ITEMS IN THE FINANCIAL STATEMENTS OF THE PARENT COMPANY (CONTINUED)
5. Other Receivables (continued)(1) Dividends receivable
Invested entities Opening balance
Increase due to changes in the scope of
consolidationIncrease in
current periodDecrease in
current period
Translation difference in foreign currency
statements Closing balanceReason for non-recovery
Whether an impairment occurs and its judgment basis
Dividends receivable with the aging of less than 1 year
– – 2,068,008,581.00 2,057,620,091.44 – 10,388,489.56 —— ——
Shanghai Tongyun International Logistics Co., Ltd.
– – 408,163.27 408,163.27 – – —— ——
New Land Bridge (Lianyungang) Terminal Co., Ltd.
– – 130,370.03 130,370.03 – – —— No
Sinotrans Heavy-lift Logistics Co., Ltd. – – 4,789,265.22 4,789,265.22 – – —— NoChina Marine Shipping Agency Co., Ltd. – – 15,000,000.00 15,000,000.00 – – —— NoSinotrans Japan Co., Ltd. – – 10,388,489.56 – – 10,388,489.56 Announced but not
issued yetNo
Sinotrans Logistics Co., Ltd. – – 76,400,721.85 76,400,721.85 – – —— NoSinotrans Air Transportation Development Co.,
Ltd.– – 1,100,148,265.96 1,100,148,265.96 – – —— No
Sinotrans Eastern Company Limited – – 199,890,293.06 199,890,293.06 – – —— NoSinotrans Changjiang Co., Ltd. – – 130,299,764.48 130,299,764.48 – – —— NoSinotrans Hubei Company Limited – – 2,902,110.91 2,902,110.91 – – —— NoSinotrans Fujian Co., Ltd. – – 40,321,396.67 40,321,396.67 – – —— NoSinotrans South China Co., Ltd. – – 195,927,485.16 195,927,485.16 – – —— NoSinotrans Central China Co., Ltd. – – 274,867,673.89 274,867,673.89 – – —— NoSinotrans Northeast Co., Ltd. – – 6,777,370.34 6,777,370.34 – – —— NoSinotrans Chongqing Co., Ltd – – 9,757,210.60 9,757,210.60 – – —— NoDividends receivable with the aging
over 1 year90,850,271.49 – – 45,839,160.58 – 45,011,110.91 —— ——
Sinotrans North China Co., Ltd. 45,839,160.58 – – 45,839,160.58 – – —— ——Sinotrans Eastern Company Limited 10,904,887.09 – – – – 10,904,887.09 Support for
subsidiary development
No
Sinotrans Anhui Co., Ltd. 8,067,261.02 – – – – 8,067,261.02 Support for subsidiary development
No
Trade Sky International Limited 3,241,600.00 – – – – 3,241,600.00 Support for subsidiary development
No
CIETC International Transportation Co., Ltd. 2,797,362.80 – – – – 2,797,362.80 Payment approval process not completed
No
China United Tally Co., Ltd. 20,000,000.00 – – – – 20,000,000.00 Note 1 No
Total 90,850,271.49 – 2,068,008,581.00 2,103,459,252.02 – 55,399,600.47 —— ——
Note 1: See note IX. 7.(2) note 2 for details of the issuance of dividends by China United Tally.
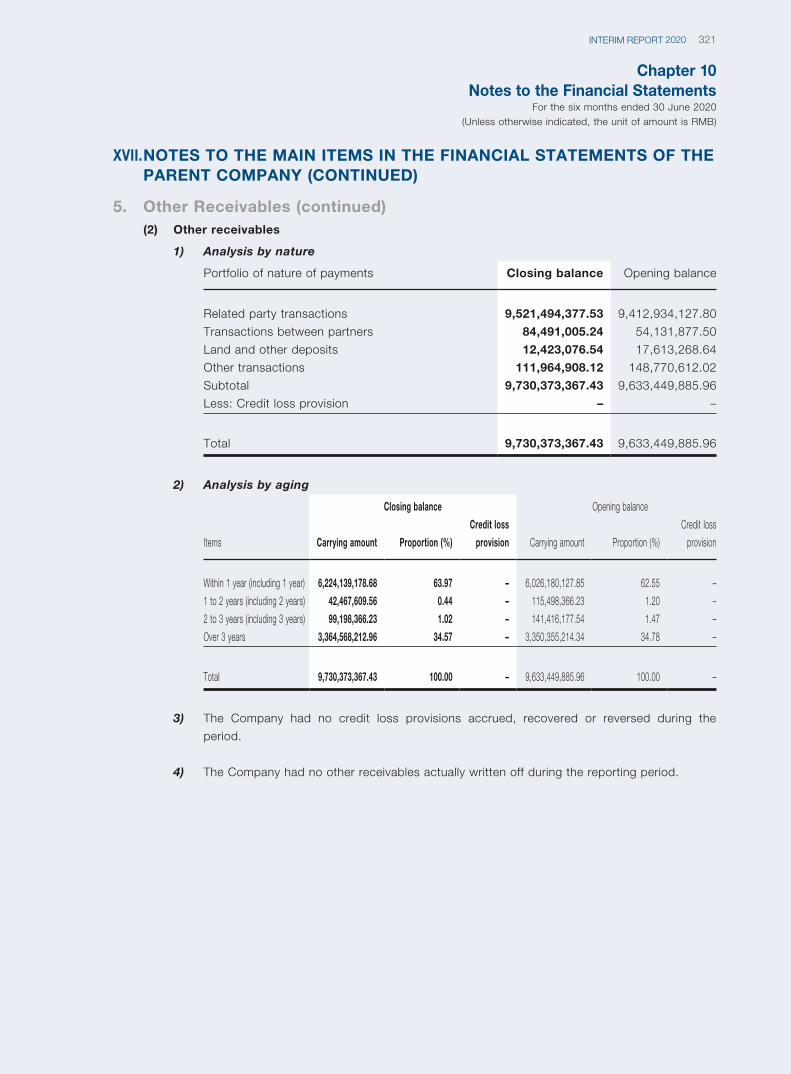
Chapter 10Notes to the Financial Statements
For the six months ended 30 June 2020(Unless otherwise indicated, the unit of amount is RMB)
321INTERIM REPORT 2020
XVII. NOTES TO THE MAIN ITEMS IN THE FINANCIAL STATEMENTS OF THE PARENT COMPANY (CONTINUED)
5. Other Receivables (continued)(2) Other receivables
1) Analysis by nature
Portfolio of nature of payments Closing balance Opening balance
Related party transactions 9,521,494,377.53 9,412,934,127.80
Transactions between partners 84,491,005.24 54,131,877.50
Land and other deposits 12,423,076.54 17,613,268.64
Other transactions 111,964,908.12 148,770,612.02
Subtotal 9,730,373,367.43 9,633,449,885.96
Less: Credit loss provision – –
Total 9,730,373,367.43 9,633,449,885.96
2) Analysis by aging
Items
Closing balance Opening balance
Carrying amount Proportion (%)
Credit loss
provision Carrying amount Proportion (%)
Credit loss
provision
Within 1 year (including 1 year) 6,224,139,178.68 63.97 – 6,026,180,127.85 62.55 –
1 to 2 years (including 2 years) 42,467,609.56 0.44 – 115,498,366.23 1.20 –
2 to 3 years (including 3 years) 99,198,366.23 1.02 – 141,416,177.54 1.47 –
Over 3 years 3,364,568,212.96 34.57 – 3,350,355,214.34 34.78 –
Total 9,730,373,367.43 100.00 – 9,633,449,885.96 100.00 –
3) The Company had no credit loss provisions accrued, recovered or reversed during the
period.
4) The Company had no other receivables actually written off during the reporting period.
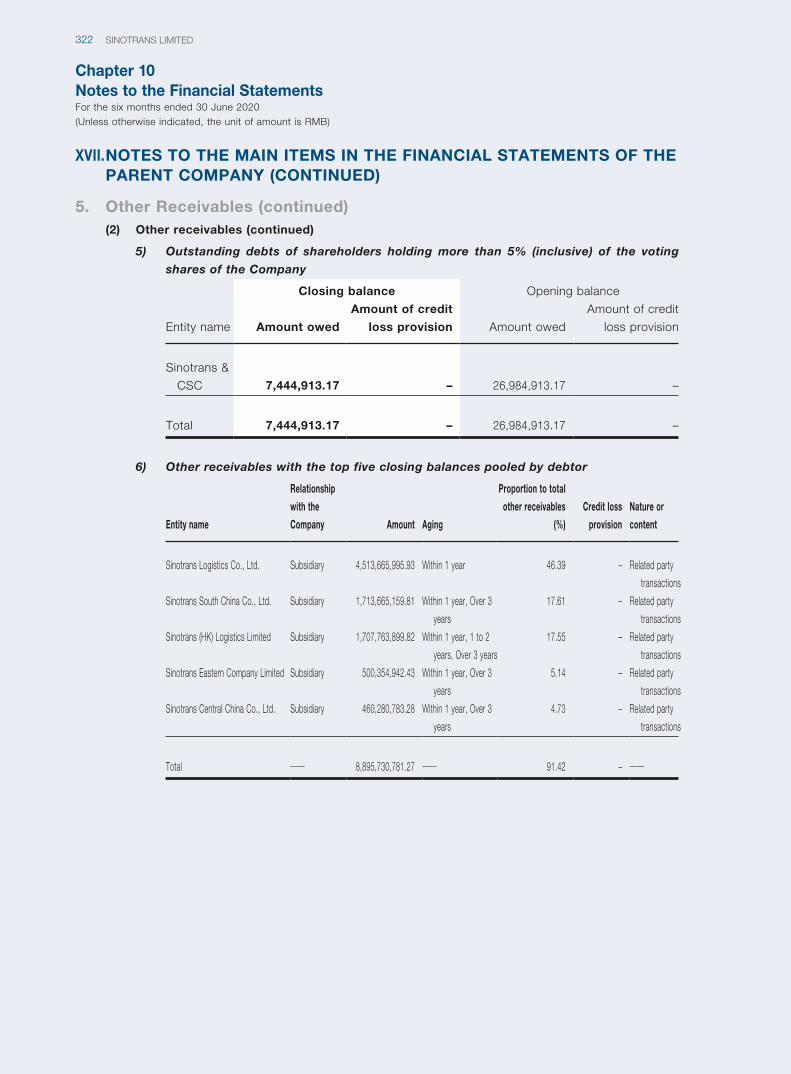
Chapter 10Notes to the Financial StatementsFor the six months ended 30 June 2020(Unless otherwise indicated, the unit of amount is RMB)
SINOTRANS LIMITED322
XVII. NOTES TO THE MAIN ITEMS IN THE FINANCIAL STATEMENTS OF THE PARENT COMPANY (CONTINUED)
5. Other Receivables (continued)(2) Other receivables (continued)
5) Outstanding debts of shareholders holding more than 5% (inclusive) of the voting
shares of the Company
Entity name
Closing balance Opening balance
Amount owed
Amount of credit
loss provision Amount owed
Amount of credit
loss provision
Sinotrans &
CSC 7,444,913.17 – 26,984,913.17 –
Total 7,444,913.17 – 26,984,913.17 –
6) Other receivables with the top five closing balances pooled by debtor
Entity name
Relationship
with the
Company Amount Aging
Proportion to total
other receivables
(%)
Credit loss
provision
Nature or
content
Sinotrans Logistics Co., Ltd. Subsidiary 4,513,665,995.93 Within 1 year 46.39 – Related party
transactions
Sinotrans South China Co., Ltd. Subsidiary 1,713,665,159.81 Within 1 year, Over 3
years
17.61 – Related party
transactions
Sinotrans (HK) Logistics Limited Subsidiary 1,707,763,899.82 Within 1 year, 1 to 2
years, Over 3 years
17.55 – Related party
transactions
Sinotrans Eastern Company Limited Subsidiary 500,354,942.43 Within 1 year, Over 3
years
5.14 – Related party
transactions
Sinotrans Central China Co., Ltd. Subsidiary 460,280,783.28 Within 1 year, Over 3
years
4.73 – Related party
transactions
Total —— 8,895,730,781.27 —— 91.42 – ——

Chapter 10Notes to the Financial Statements
For the six months ended 30 June 2020(Unless otherwise indicated, the unit of amount is RMB)
323INTERIM REPORT 2020
XVII. NOTES TO THE MAIN ITEMS IN THE FINANCIAL STATEMENTS OF THE PARENT COMPANY (CONTINUED)
5. Other Receivables (continued)(2) Other receivables (continued)
7) Receivables from related parties
Entity name
Relationship with
the Company Amount
Proportion
to total other
receivables (%)
Sinotrans Logistics Co., Ltd. Subsidiary 4,513,665,995.93 46.39
Sinotrans South China Co., Ltd. Subsidiary 1,713,665,159.81 17.61
Sinotrans (HK) Logistics Limited Subsidiary 1,707,763,899.82 17.55
Sinotrans Eastern Company
Limited
Subsidiary 500,354,942.43 5.14
Sinotrans Central China Co.,
Ltd.
Subsidiary 460,280,783.28 4.73
Sinotrans Changjiang Co., Ltd. Subsidiary 213,331,125.19 2.19
Sinotrans Fujian Co., Ltd. Subsidiary 184,521,824.85 1.90
Sinotrans Chongqing Co., Ltd Subsidiary 84,224,500.00 0.87
Sinotrans Heavy-lift Logistics
Co., Ltd.
Subsidiary 81,188,414.93 0.83
Others —— 62,497,731.29 0.64
Total —— 9,521,494,377.53 97.85
8) At 30 June 2020, the Company had no other receivables transferred from financial assets to
derecognition.
9) At 30 June 2020, the Company had no other receivables to transfer, such as securitization
and factoring of other receivables as the subject matter, and continues to be involved in the
formation of assets and liabilities.
10) At June 30 2020, the Company had no prepayments transferred to other receivables.
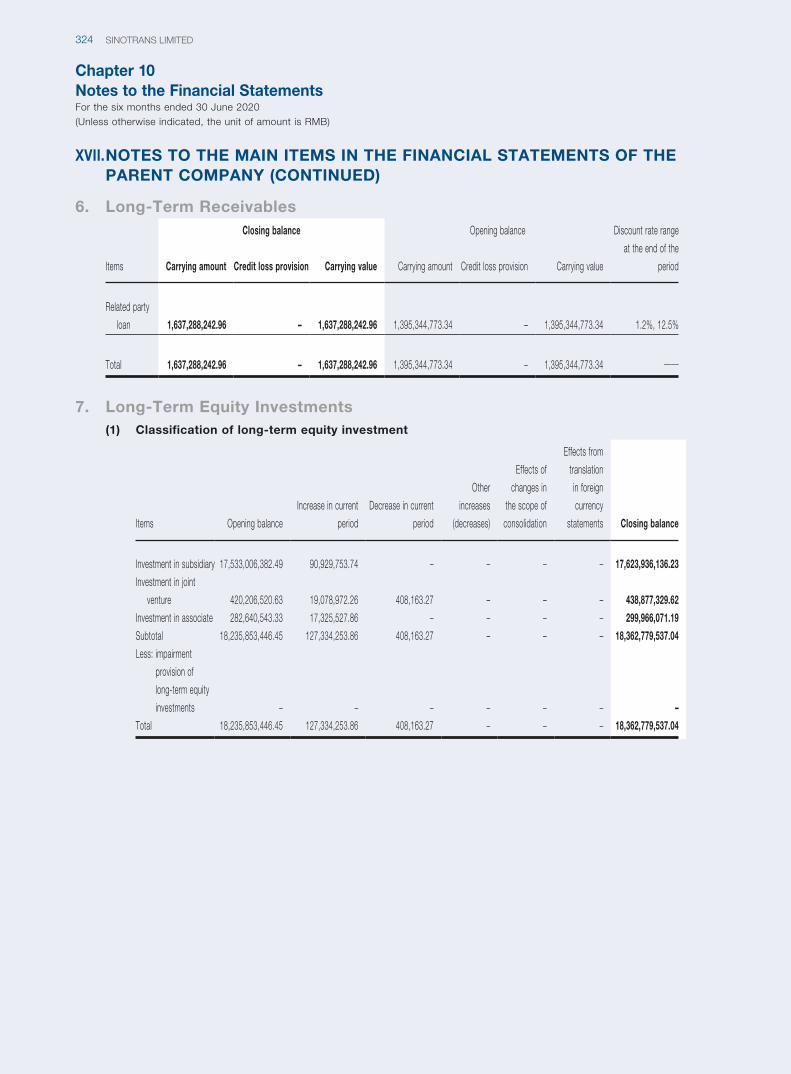
Chapter 10Notes to the Financial StatementsFor the six months ended 30 June 2020(Unless otherwise indicated, the unit of amount is RMB)
SINOTRANS LIMITED324
XVII. NOTES TO THE MAIN ITEMS IN THE FINANCIAL STATEMENTS OF THE PARENT COMPANY (CONTINUED)
6. Long-Term Receivables
Items
Closing balance Opening balance Discount rate range
at the end of the
periodCarrying amount Credit loss provision Carrying value Carrying amount Credit loss provision Carrying value
Related party
loan 1,637,288,242.96 – 1,637,288,242.96 1,395,344,773.34 – 1,395,344,773.34 1.2%, 12.5%
Total 1,637,288,242.96 – 1,637,288,242.96 1,395,344,773.34 – 1,395,344,773.34 ——
7. Long-Term Equity Investments(1) Classification of long-term equity investment
Items Opening balance
Increase in current
period
Decrease in current
period
Other
increases
(decreases)
Effects of
changes in
the scope of
consolidation
Effects from
translation
in foreign
currency
statements Closing balance
Investment in subsidiary 17,533,006,382.49 90,929,753.74 – – – – 17,623,936,136.23
Investment in joint
venture 420,206,520.63 19,078,972.26 408,163.27 – – – 438,877,329.62
Investment in associate 282,640,543.33 17,325,527.86 – – – – 299,966,071.19
Subtotal 18,235,853,446.45 127,334,253.86 408,163.27 – – – 18,362,779,537.04
Less: impairment
provision of
long-term equity
investments – – – – – – –
Total 18,235,853,446.45 127,334,253.86 408,163.27 – – – 18,362,779,537.04
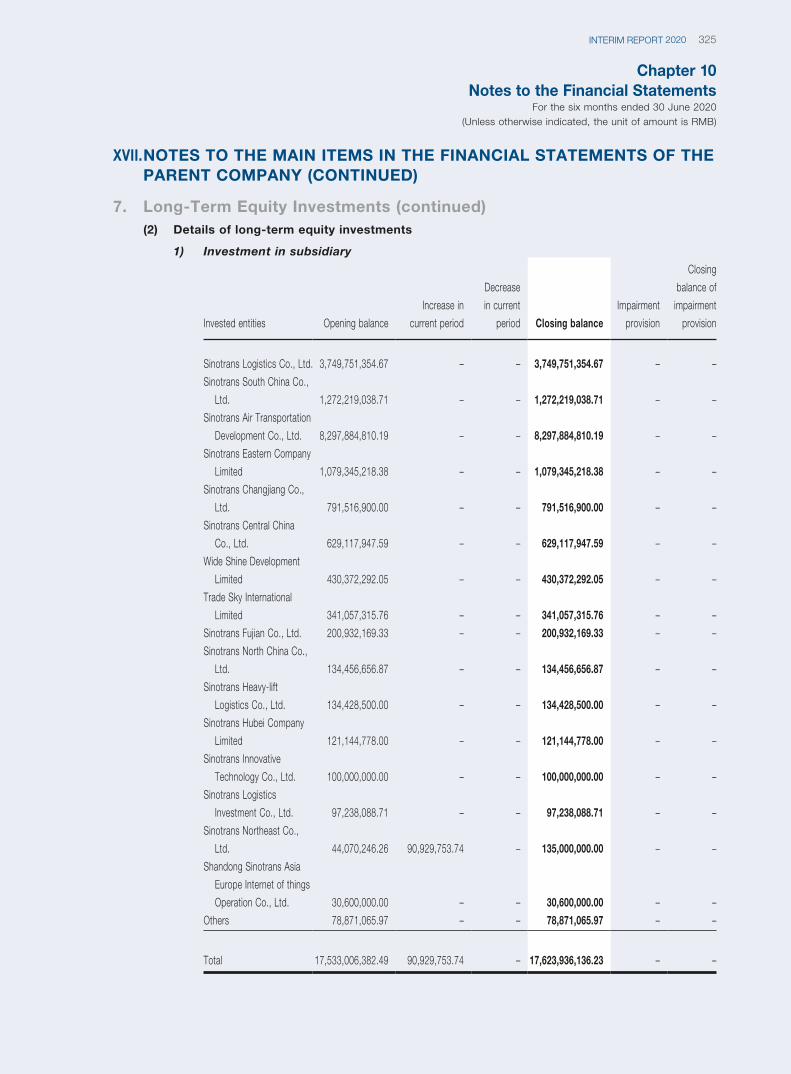
Chapter 10Notes to the Financial Statements
For the six months ended 30 June 2020(Unless otherwise indicated, the unit of amount is RMB)
325INTERIM REPORT 2020
XVII. NOTES TO THE MAIN ITEMS IN THE FINANCIAL STATEMENTS OF THE PARENT COMPANY (CONTINUED)
7. Long-Term Equity Investments (continued)(2) Details of long-term equity investments
1) Investment in subsidiary
Invested entities Opening balance
Increase in
current period
Decrease
in current
period Closing balance
Impairment
provision
Closing
balance of
impairment
provision
Sinotrans Logistics Co., Ltd. 3,749,751,354.67 – – 3,749,751,354.67 – –
Sinotrans South China Co.,
Ltd. 1,272,219,038.71 – – 1,272,219,038.71 – –
Sinotrans Air Transportation
Development Co., Ltd. 8,297,884,810.19 – – 8,297,884,810.19 – –
Sinotrans Eastern Company
Limited 1,079,345,218.38 – – 1,079,345,218.38 – –
Sinotrans Changjiang Co.,
Ltd. 791,516,900.00 – – 791,516,900.00 – –
Sinotrans Central China
Co., Ltd. 629,117,947.59 – – 629,117,947.59 – –
Wide Shine Development
Limited 430,372,292.05 – – 430,372,292.05 – –
Trade Sky International
Limited 341,057,315.76 – – 341,057,315.76 – –
Sinotrans Fujian Co., Ltd. 200,932,169.33 – – 200,932,169.33 – –
Sinotrans North China Co.,
Ltd. 134,456,656.87 – – 134,456,656.87 – –
Sinotrans Heavy-lift
Logistics Co., Ltd. 134,428,500.00 – – 134,428,500.00 – –
Sinotrans Hubei Company
Limited 121,144,778.00 – – 121,144,778.00 – –
Sinotrans Innovative
Technology Co., Ltd. 100,000,000.00 – – 100,000,000.00 – –
Sinotrans Logistics
Investment Co., Ltd. 97,238,088.71 – – 97,238,088.71 – –
Sinotrans Northeast Co.,
Ltd. 44,070,246.26 90,929,753.74 – 135,000,000.00 – –
Shandong Sinotrans Asia
Europe Internet of things
Operation Co., Ltd. 30,600,000.00 – – 30,600,000.00 – –
Others 78,871,065.97 – – 78,871,065.97 – –
Total 17,533,006,382.49 90,929,753.74 – 17,623,936,136.23 – –
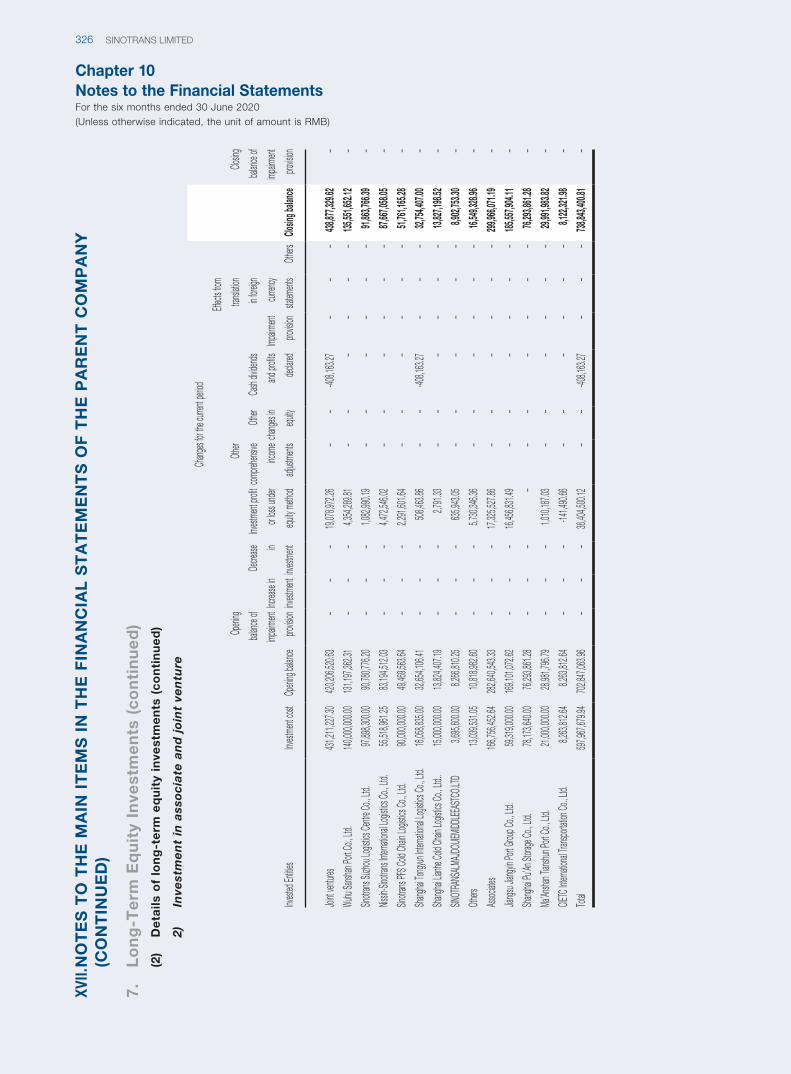
Chapter 10Notes to the Financial StatementsFor the six months ended 30 June 2020(Unless otherwise indicated, the unit of amount is RMB)
SINOTRANS LIMITED326
XVII.
NO
TE
S T
O T
HE
MA
IN I
TE
MS
IN
TH
E F
INA
NC
IAL
ST
AT
EM
EN
TS
OF
TH
E P
AR
EN
T C
OM
PA
NY
(C
ON
TIN
UE
D)
7.
Lo
ng
-Te
rm E
qu
ity
Inve
stm
en
ts (
co
nti
nu
ed
)(2
) D
eta
ils o
f lo
ng
-te
rm e
qu
ity
inve
stm
en
ts (
co
nti
nu
ed
)
2)
Inve
stm
en
t in
ass
oci
ate
an
d j
oin
t ve
ntu
re
Invest
ed En
tities
Invest
ment
cost
Openi
ng bal
ance
Openi
ng
balanc
e of
impairm
ent
provis
ion
Chang
es for
the c
urrent
period
Closin
g bala
nce
Closin
g
balanc
e of
impairm
ent
provis
ion
Increa
se in
invest
ment
Decre
ase in
invest
ment
Invest
ment
profit
or los
s unde
r
equity
metho
d
Other
compre
hensiv
e
incom
e
adjust
ments
Other
change
s in
equity
Cash
divide
nds
and pr
ofits
declare
d
Impairm
ent
provis
ion
Effect
s from
transl
ation
in fore
ign
curren
cy
statem
ents
Others
Joint
ventur
es431
,211,2
27.30
420,20
6,520.
63–
––
19,078
,972.2
6–
–-40
8,163.
27–
––
438,87
7,329.
62–
Wuhu
Sansh
an Po
rt Co.,
Ltd.
140,00
0,000.
00131
,197,3
62.31
––
–4,3
54,289
.81–
––
––
–135
,551,6
52.12
–
Sinotr
ans Su
zhou L
ogistic
s Cent
re Co
., Ltd.
97,898
,300.0
090,
780,77
6.20
––
–1,0
82,990
.19–
––
––
–91,
863,76
6.39
–
Nissin
-Sinot
rans In
ternat
ional L
ogistic
s Co.,
Ltd.
55,518
,961.2
583,
194,51
2.03
––
–4,4
72,546
.02–
––
––
–87,
667,05
8.05
–
Sinotr
ans PF
S Cold
Chain
Logis
tics Co
., Ltd.
90,000
,000.0
049,
469,56
3.64
––
–2,2
91,601
.64–
––
––
–51,
761,16
5.28
–
Shang
hai To
ngyun
Interna
tional L
ogistic
s Co.,
Ltd.
16,058
,835.0
032,
654,10
6.41
––
–508
,463.8
6–
–-40
8,163.
27–
––
32,754
,407.0
0–
Shang
hai Lia
nhe Co
ld Chai
n Logi
stics C
o., Lt
d..15,
000,00
0.00
13,824
,407.1
9–
––
2,791.
33–
––
––
–13,
827,19
8.52
–
SINOT
RANS
ALMA
JDOU
IEMIDD
LEEA
STCO
.LTD
3,695,
600.00
8,266,
810.25
––
–635
,943.0
5–
––
––
–8,9
02,753
.30–
Others
13,039
,531.0
510,
818,98
2.60
––
–5,7
30,346
.36–
––
––
–16,
549,32
8.96
–
Associ
ates
166,75
6,452.
64282
,640,5
43.33
––
–17,
325,52
7.86
––
––
––
299,96
6,071.
19–
Jiangs
u Jian
gyin P
ort Gr
oup Co
., Ltd.
59,319
,000.0
0169
,101,0
72.62
––
–16,
456,83
1.49
––
––
––
185,55
7,904.
11–
Shang
hai Pu
’An St
orage
Co., L
td.78,
173,64
0.00
76,293
,861.2
8–
––
––
––
––
–76,
293,86
1.28
–
Ma’An
shan T
ianshu
n Port
Co., L
td.21,
000,00
0.00
28,981
,796.7
9–
––
1,010,
187.03
––
––
––
29,991
,983.8
2–
CIETC
Intern
ational
Trans
porta
tion Co
., Ltd.
8,263,
812.64
8,263,
812.64
––
–-14
1,490.
66–
––
––
–8,1
22,321
.98–
Total
597,96
7,679.
94702
,847,0
63.96
––
–36,
404,50
0.12
––
-408,1
63.27
––
–738
,843,4
00.81
–
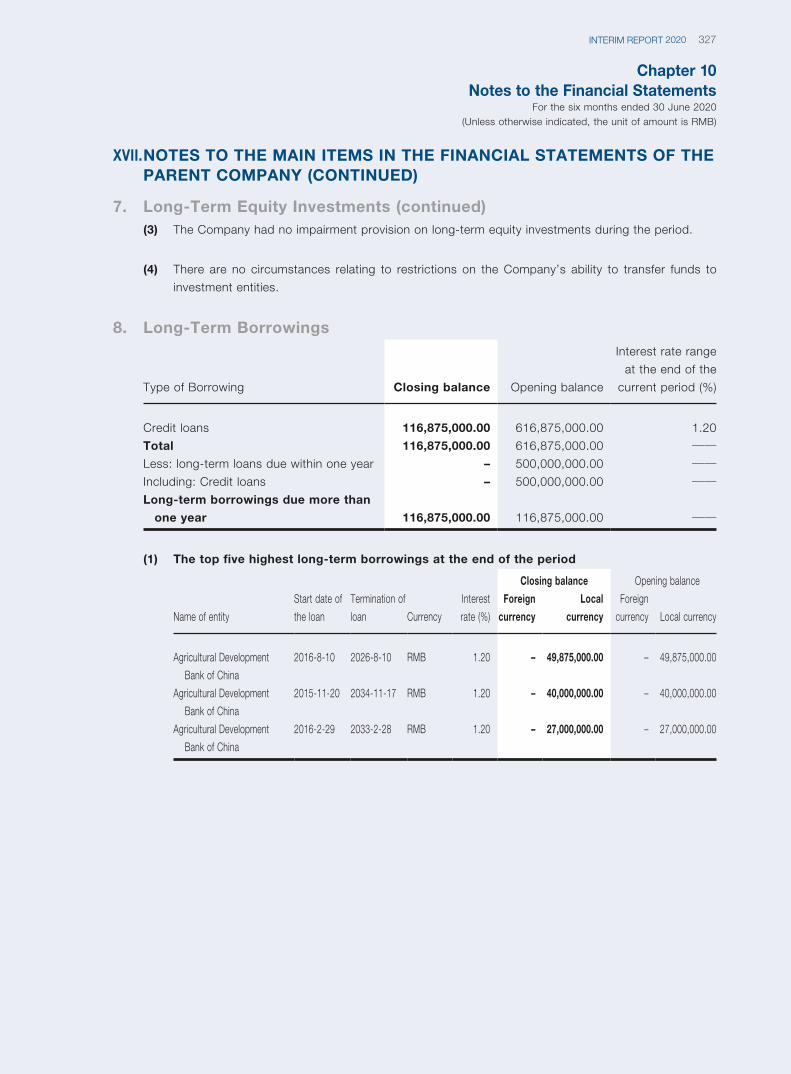
Chapter 10Notes to the Financial Statements
For the six months ended 30 June 2020(Unless otherwise indicated, the unit of amount is RMB)
327INTERIM REPORT 2020
XVII. NOTES TO THE MAIN ITEMS IN THE FINANCIAL STATEMENTS OF THE PARENT COMPANY (CONTINUED)
7. Long-Term Equity Investments (continued)(3) The Company had no impairment provision on long-term equity investments during the period.
(4) There are no circumstances relating to restrictions on the Company’s ability to transfer funds to
investment entities.
8. Long-Term Borrowings
Type of Borrowing Closing balance Opening balance
Interest rate range
at the end of the
current period (%)
Credit loans 116,875,000.00 616,875,000.00 1.20
Total 116,875,000.00 616,875,000.00 ——Less: long-term loans due within one year – 500,000,000.00 ——Including: Credit loans – 500,000,000.00 ——Long-term borrowings due more than
one year 116,875,000.00 116,875,000.00 ——
(1) The top five highest long-term borrowings at the end of the period
Name of entity
Start date of
the loan
Termination of
loan Currency
Interest
rate (%)
Closing balance Opening balance
Foreign
currency
Local
currency
Foreign
currency Local currency
Agricultural Development
Bank of China
2016-8-10 2026-8-10 RMB 1.20 – 49,875,000.00 – 49,875,000.00
Agricultural Development
Bank of China
2015-11-20 2034-11-17 RMB 1.20 – 40,000,000.00 – 40,000,000.00
Agricultural Development
Bank of China
2016-2-29 2033-2-28 RMB 1.20 – 27,000,000.00 – 27,000,000.00
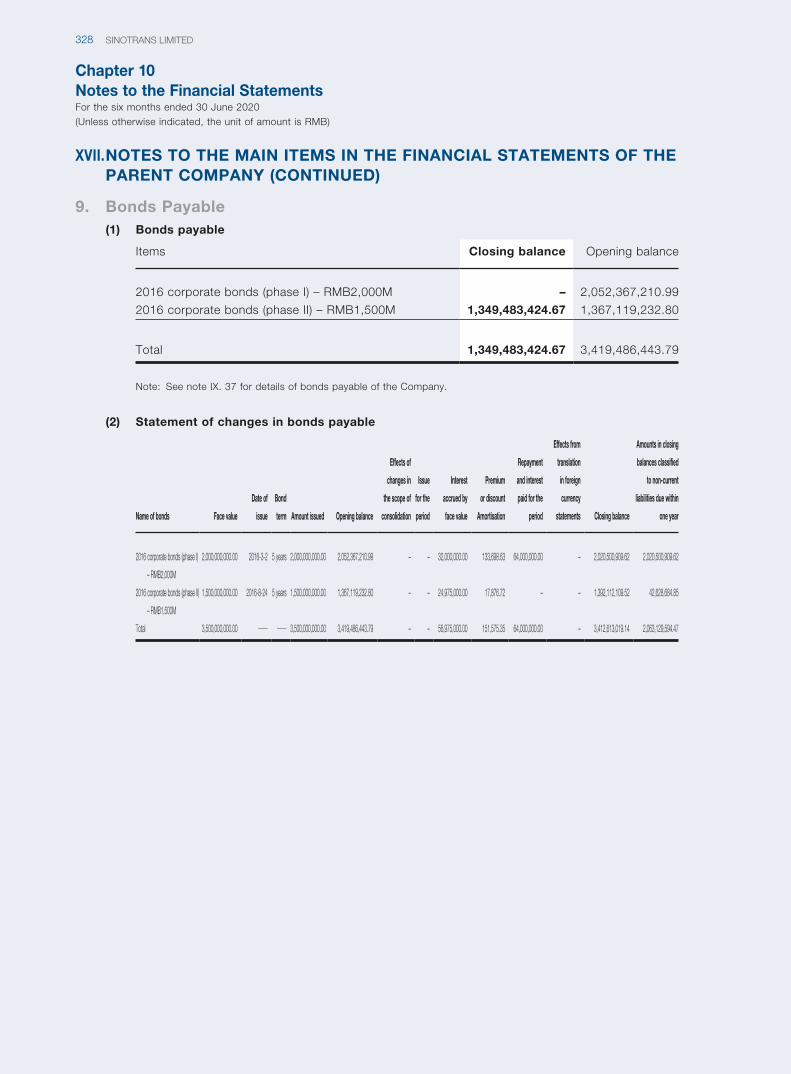
Chapter 10Notes to the Financial StatementsFor the six months ended 30 June 2020(Unless otherwise indicated, the unit of amount is RMB)
SINOTRANS LIMITED328
XVII. NOTES TO THE MAIN ITEMS IN THE FINANCIAL STATEMENTS OF THE PARENT COMPANY (CONTINUED)
9. Bonds Payable(1) Bonds payable
Items Closing balance Opening balance
2016 corporate bonds (phase I) – RMB2,000M – 2,052,367,210.99
2016 corporate bonds (phase II) – RMB1,500M 1,349,483,424.67 1,367,119,232.80
Total 1,349,483,424.67 3,419,486,443.79
Note: See note IX. 37 for details of bonds payable of the Company.
(2) Statement of changes in bonds payable
Name of bonds Face value
Date of
issue
Bond
term Amount issued Opening balance
Effects of
changes in
the scope of
consolidation
Issue
for the
period
Interest
accrued by
face value
Premium
or discount
Amortisation
Repayment
and interest
paid for the
period
Effects from
translation
in foreign
currency
statements Closing balance
Amounts in closing
balances classified
to non-current
liabilities due within
one year
2016 corporate bonds (phase I)
– RMB2,000M
2,000,000,000.00 2016-3-2 5 years 2,000,000,000.00 2,052,367,210.99 – – 32,000,000.00 133,698.63 64,000,000.00 – 2,020,500,909.62 2,020,500,909.62
2016 corporate bonds (phase II)
– RMB1,500M
1,500,000,000.00 2016-8-24 5 years 1,500,000,000.00 1,367,119,232.80 – – 24,975,000.00 17,876.72 – – 1,392,112,109.52 42,628,684.85
Total 3,500,000,000.00 —— —— 3,500,000,000.00 3,419,486,443.79 – – 56,975,000.00 151,575.35 64,000,000.00 – 3,412,613,019.14 2,063,129,594.47
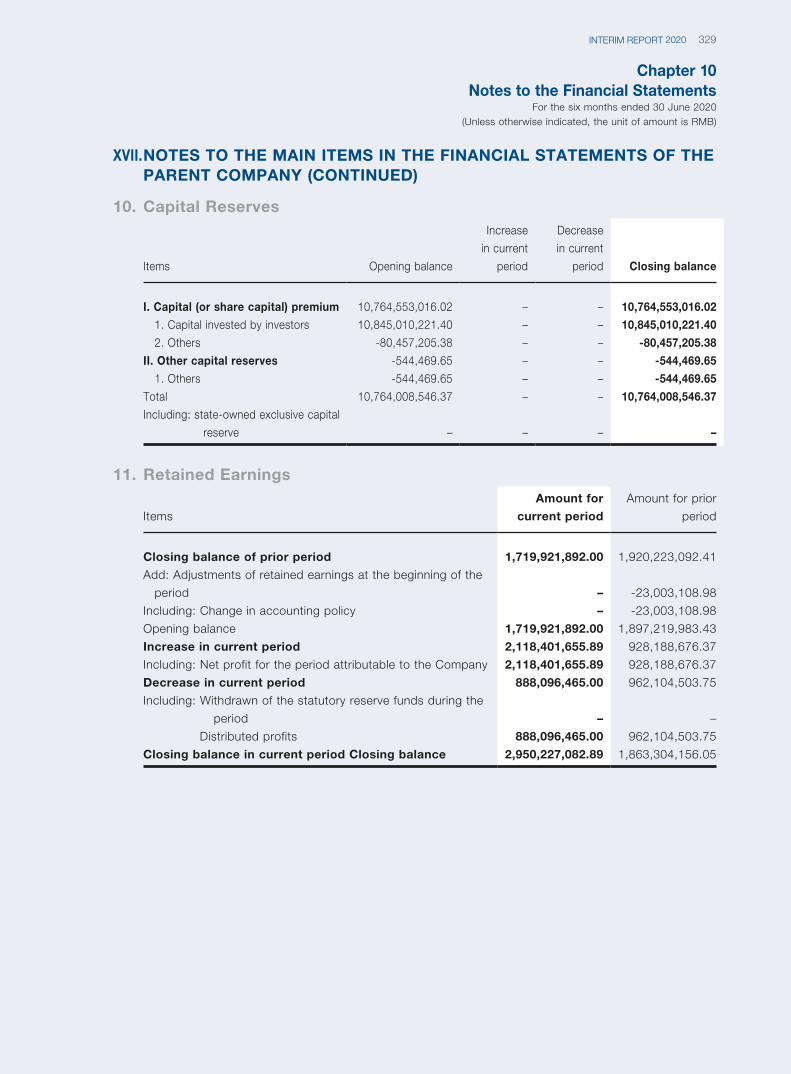
Chapter 10Notes to the Financial Statements
For the six months ended 30 June 2020(Unless otherwise indicated, the unit of amount is RMB)
329INTERIM REPORT 2020
XVII. NOTES TO THE MAIN ITEMS IN THE FINANCIAL STATEMENTS OF THE PARENT COMPANY (CONTINUED)
10. Capital Reserves
Items Opening balance
Increase
in current
period
Decrease
in current
period Closing balance
I. C apital (or share capital) premium 10,764,553,016.02 – – 10,764,553,016.02
1. Capital invested by investors 10,845,010,221.40 – – 10,845,010,221.40
2. Others -80,457,205.38 – – -80,457,205.38
II. O ther capital reserves -544,469.65 – – -544,469.65
1. Others -544,469.65 – – -544,469.65
Total 10,764,008,546.37 – – 10,764,008,546.37
Including: st ate-owned exclusive capital
reserve – – – –
11. Retained Earnings
Items
Amount for
current period
Amount for prior
period
Closing balance of prior period 1,719,921,892.00 1,920,223,092.41
Add: Adjustments of retained earnings at the beginning of the
period – -23,003,108.98
Including: Change in accounting policy – -23,003,108.98
Opening balance 1,719,921,892.00 1,897,219,983.43
Increase in current period 2,118,401,655.89 928,188,676.37
Including: Net profit for the period attributable to the Company 2,118,401,655.89 928,188,676.37
Decrease in current period 888,096,465.00 962,104,503.75
Including: Wi thdrawn of the statutory reserve funds during the
period – –
Distributed profits 888,096,465.00 962,104,503.75
Closing balance in current period Closing balance 2,950,227,082.89 1,863,304,156.05
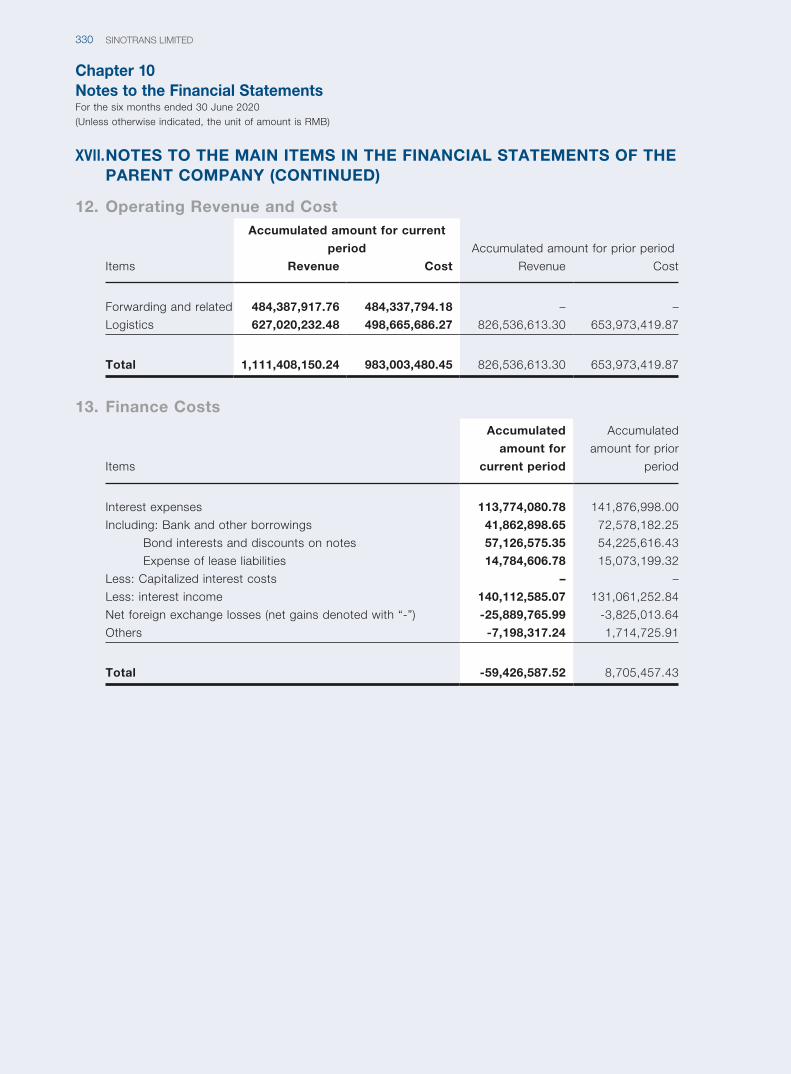
Chapter 10Notes to the Financial StatementsFor the six months ended 30 June 2020(Unless otherwise indicated, the unit of amount is RMB)
SINOTRANS LIMITED330
XVII. NOTES TO THE MAIN ITEMS IN THE FINANCIAL STATEMENTS OF THE PARENT COMPANY (CONTINUED)
12. Operating Revenue and Cost
Items
Accumulated amount for current
period Accumulated amount for prior period
Revenue Cost Revenue Cost
Forwarding and related 484,387,917.76 484,337,794.18 – –
Logistics 627,020,232.48 498,665,686.27 826,536,613.30 653,973,419.87
Total 1,111,408,150.24 983,003,480.45 826,536,613.30 653,973,419.87
13. Finance Costs
Items
Accumulated
amount for
current period
Accumulated
amount for prior
period
Interest expenses 113,774,080.78 141,876,998.00
Including: Bank and other borrowings 41,862,898.65 72,578,182.25
Bond interests and discounts on notes 57,126,575.35 54,225,616.43
Expense of lease liabilities 14,784,606.78 15,073,199.32
Less: Capitalized interest costs – –
Less: interest income 140,112,585.07 131,061,252.84
Net foreign exchange losses (net gains denoted with “-”) -25,889,765.99 -3,825,013.64
Others -7,198,317.24 1,714,725.91
Total -59,426,587.52 8,705,457.43
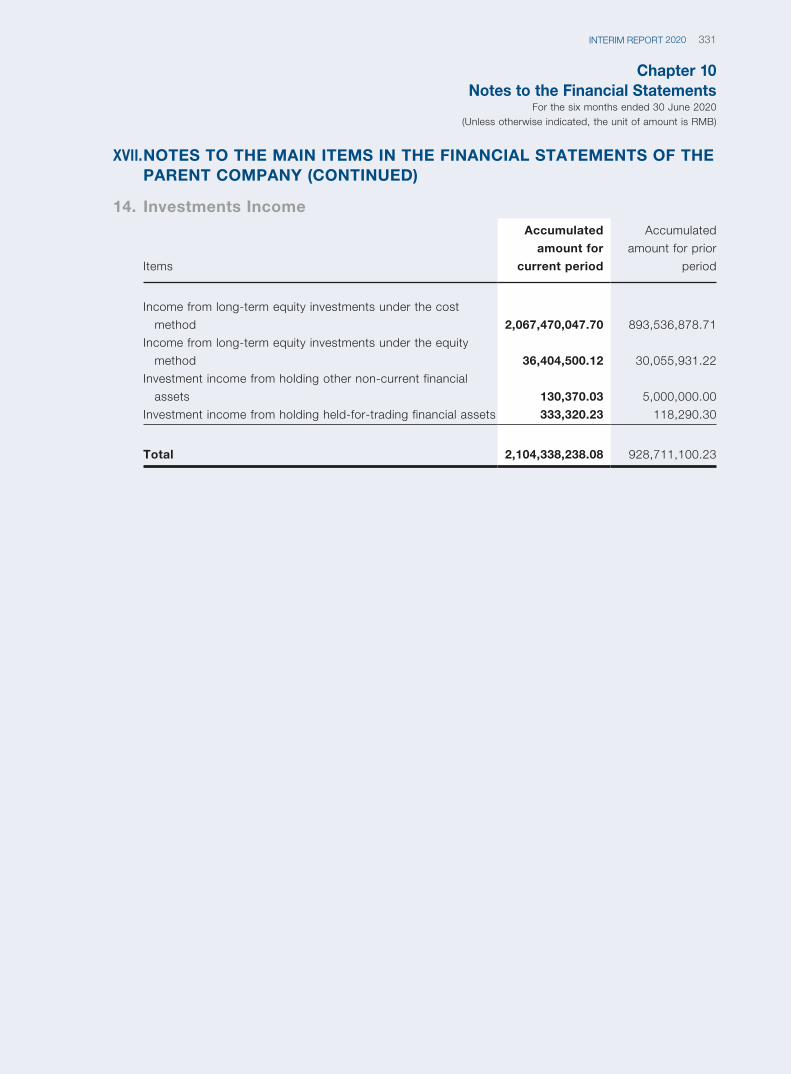
Chapter 10Notes to the Financial Statements
For the six months ended 30 June 2020(Unless otherwise indicated, the unit of amount is RMB)
331INTERIM REPORT 2020
XVII. NOTES TO THE MAIN ITEMS IN THE FINANCIAL STATEMENTS OF THE PARENT COMPANY (CONTINUED)
14. Investments Income
Items
Accumulated
amount for
current period
Accumulated
amount for prior
period
Income from long-term equity investments under the cost
method 2,067,470,047.70 893,536,878.71
Income from long-term equity investments under the equity
method 36,404,500.12 30,055,931.22
Investment income from holding other non-current financial
assets 130,370.03 5,000,000.00
Investment income from holding held-for-trading financial assets 333,320.23 118,290.30
Total 2,104,338,238.08 928,711,100.23
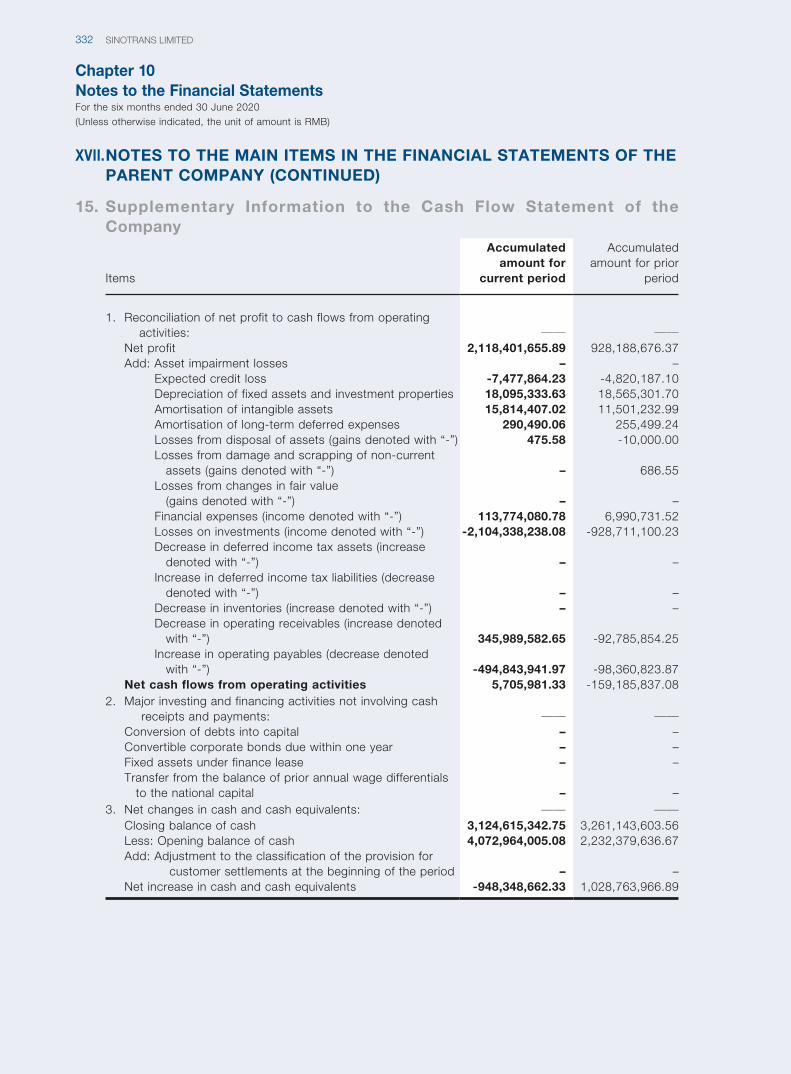
Chapter 10Notes to the Financial StatementsFor the six months ended 30 June 2020(Unless otherwise indicated, the unit of amount is RMB)
SINOTRANS LIMITED332
XVII. NOTES TO THE MAIN ITEMS IN THE FINANCIAL STATEMENTS OF THE PARENT COMPANY (CONTINUED)
15. Supplementary Information to the Cash Flow Statement of the Company
Items
Accumulated amount for
current period
Accumulated amount for prior
period
1. Re conciliation of net profit to cash flows from operating activities: —— ——
Net profit 2,118,401,655.89 928,188,676.37Add: Asset impairment losses – –
Expected credit loss -7,477,864.23 -4,820,187.10Depreciation of fixed assets and investment properties 18,095,333.63 18,565,301.70Amortisation of intangible assets 15,814,407.02 11,501,232.99Amortisation of long-term deferred expenses 290,490.06 255,499.24Losses from disposal of assets (gains denoted with “-”) 475.58 -10,000.00Losses from damage and scrapping of non-current
assets (gains denoted with “-”) – 686.55Losses from changes in fair value
(gains denoted with “-”) – –Financial expenses (income denoted with “-”) 113,774,080.78 6,990,731.52Losses on investments (income denoted with “-”) -2,104,338,238.08 -928,711,100.23Decrease in deferred income tax assets (increase
denoted with “-”) – –Increase in deferred income tax liabilities (decrease
denoted with “-”) – –Decrease in inventories (increase denoted with “-”) – –Decrease in operating receivables (increase denoted
with “-”) 345,989,582.65 -92,785,854.25Increase in operating payables (decrease denoted
with “-”) -494,843,941.97 -98,360,823.87Net cash flows from operating activities 5,705,981.33 -159,185,837.08
2. Ma jor investing and financing activities not involving cash receipts and payments: —— ——
Conversion of debts into capital – –Convertible corporate bonds due within one year – –Fixed assets under finance lease – –Transfer from the balance of prior annual wage differentials
to the national capital – –3. Net changes in cash and cash equivalents: —— ——
Closing balance of cash 3,124,615,342.75 3,261,143,603.56Less: Opening balance of cash 4,072,964,005.08 2,232,379,636.67Add: Ad justment to the classification of the provision for
customer settlements at the beginning of the period – –Net increase in cash and cash equivalents -948,348,662.33 1,028,763,966.89
Chapter 10Notes to the Financial Statements
For the six months ended 30 June 2020(Unless otherwise indicated, the unit of amount is RMB)
333INTERIM REPORT 2020
XVIII. OTHER SIGNIFICANT EVENTS
Impact of the COVID-19 pandemicThe Group’s businesses is global and closely related to international trade, and the global COVID-19
pandemic has created additional uncertainties in the Group’s operating environment.
At the date of statement of financial position, the Group has conducted a comprehensive review of
the impact of the COVID-19 pandemic on its financial position and operating results, including the
impairment of non-financial assets, expected credit losses on financial assets and the recognition of
non-financial obligations. Any significant financial impact has been appropriately reflected and disclosed
in the financial statements and its notes.
Since the second quarter of 2020, the impact of the COVID-19 pandemic on the country has
gradually weakened, and as various industries have started to gradually resume work, the Group
has conscientiously implemented the epidemic prevention and control and resumption of work and
production of China Merchants Group under the guideline of ” stability is the first priority, advancement
is the focus and work is the first order”, and insisted on the same research and development and
deployment of epidemic prevention and control and resumption of work and production simultaneously
to ensure the company’s production and operation in a smooth and orderly manner. At the same time,
through measures such as deepening cooperation, extending services and strengthening business
development, the Company expanded the incremental number of new customers while deepening
cooperative relationships with strategic customers and stimulating the stock of old customers, resulting
in counter-trend growth in many businesses. During the epidemic period, the Group’s China-European
Union (CEU) trains became an important support to stabilize the international supply chain, despite the
disruption of other logistics channels; Sinotrans Cross-border E-Commerce Company, a subsidiary
of the Group, deployed a number of scheduled and temporary international freight charter flights to
provide transportation services for customers, relying on its capacity advantage in the face of the
severe situation when domestic and overseas airlines significantly reduced their scheduled flights.
At present, the situation of overseas COVID-19 pandemic is still not optimistic, the Group will continue
to closely monitor the development of the epidemic and take active measures to deal with its impact.
In addition to the above, as of 30 June 2020, the Group had no other significant events to disclose.
XIX. APPROVAL OF THE FINANCIAL STATEMENTS
The Group’s financial statements for the six months ended 30 June 2020 were approved for issuance
by the Board of Directors of the Company on 27 August 2020.
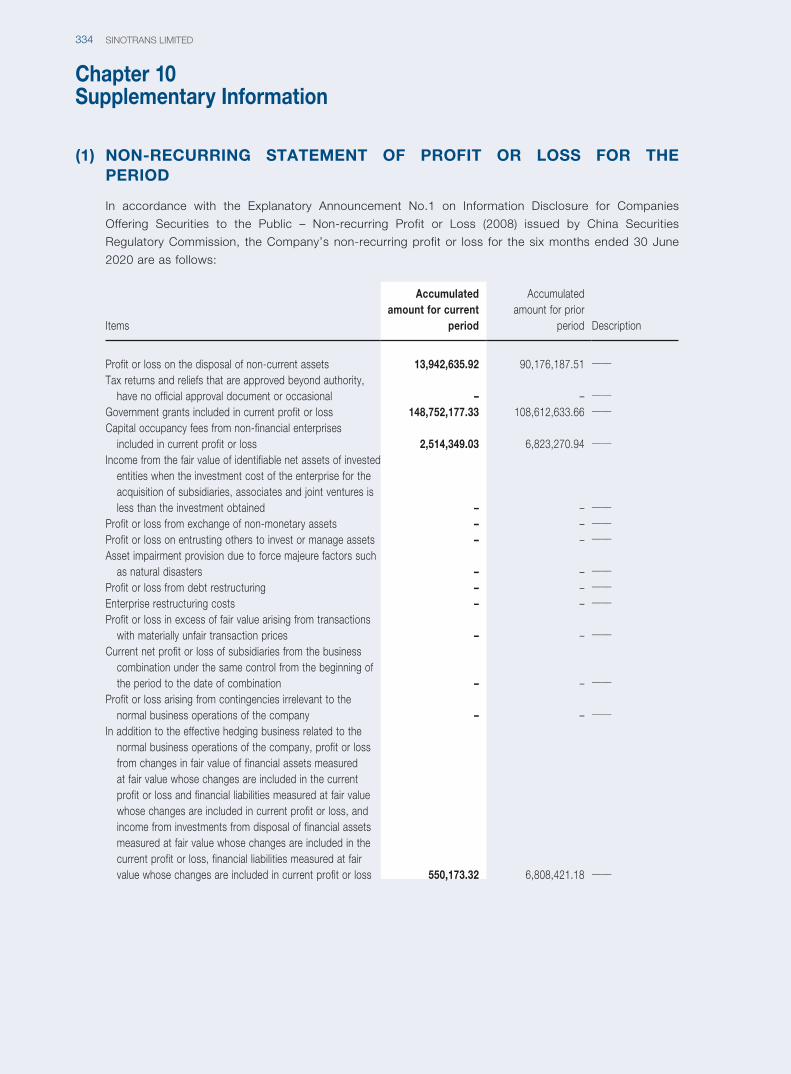
SINOTRANS LIMITED334
Chapter 10Supplementary Information
(1) NON-RECURRING STATEMENT OF PROFIT OR LOSS FOR THE PERIOD
In accordance with the Explanatory Announcement No.1 on Information Disclosure for Companies
Offering Securities to the Public – Non-recurring Profit or Loss (2008) issued by China Securities
Regulatory Commission, the Company’s non-recurring profit or loss for the six months ended 30 June
2020 are as follows:
Items
Accumulated amount for current
period
Accumulated amount for prior
period Description
Profit or loss on the disposal of non-current assets 13,942,635.92 90,176,187.51 ——Tax returns and reliefs that are approved beyond authority,
have no official approval document or occasional – – ——Government grants included in current profit or loss 148,752,177.33 108,612,633.66 ——Capital occupancy fees from non-financial enterprises
included in current profit or loss 2,514,349.03 6,823,270.94 ——Income from the fair value of identifiable net assets of invested
entities when the investment cost of the enterprise for the acquisition of subsidiaries, associates and joint ventures is less than the investment obtained – – ——
Profit or loss from exchange of non-monetary assets – – ——Profit or loss on entrusting others to invest or manage assets – – ——Asset impairment provision due to force majeure factors such
as natural disasters – – ——Profit or loss from debt restructuring – – ——Enterprise restructuring costs – – ——Profit or loss in excess of fair value arising from transactions
with materially unfair transaction prices – – ——Current net profit or loss of subsidiaries from the business
combination under the same control from the beginning of the period to the date of combination – – ——
Profit or loss arising from contingencies irrelevant to the normal business operations of the company – – ——
In addition to the effective hedging business related to the normal business operations of the company, profit or loss from changes in fair value of financial assets measured at fair value whose changes are included in the current profit or loss and financial liabilities measured at fair value whose changes are included in current profit or loss, and income from investments from disposal of financial assets measured at fair value whose changes are included in the current profit or loss, financial liabilities measured at fair value whose changes are included in current profit or loss 550,173.32 6,808,421.18 ——
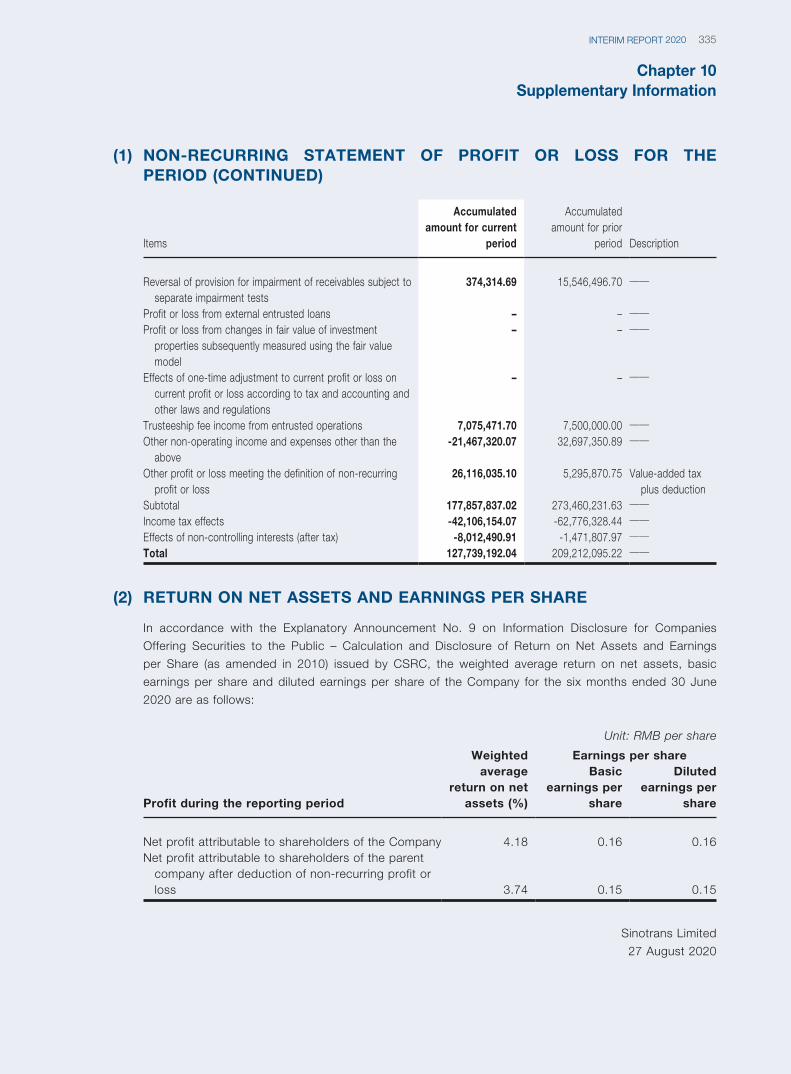
Chapter 10Supplementary Information
335INTERIM REPORT 2020
Items
Accumulated amount for current
period
Accumulated amount for prior
period Description
Reversal of provision for impairment of receivables subject to separate impairment tests
374,314.69 15,546,496.70 ——
Profit or loss from external entrusted loans – – ——Profit or loss from changes in fair value of investment
properties subsequently measured using the fair value model
– – ——
Effects of one-time adjustment to current profit or loss on current profit or loss according to tax and accounting and other laws and regulations
– – ——
Trusteeship fee income from entrusted operations 7,075,471.70 7,500,000.00 ——Other non-operating income and expenses other than the
above-21,467,320.07 32,697,350.89 ——
Other profit or loss meeting the definition of non-recurring profit or loss
26,116,035.10 5,295,870.75 Value-added tax plus deduction
Subtotal 177,857,837.02 273,460,231.63 ——Income tax effects -42,106,154.07 -62,776,328.44 ——Effects of non-controlling interests (after tax) -8,012,490.91 -1,471,807.97 ——Total 127,739,192.04 209,212,095.22 ——
(2) RETURN ON NET ASSETS AND EARNINGS PER SHARE
In accordance with the Explanatory Announcement No. 9 on Information Disclosure for Companies
Offering Securities to the Public – Calculation and Disclosure of Return on Net Assets and Earnings
per Share (as amended in 2010) issued by CSRC, the weighted average return on net assets, basic
earnings per share and diluted earnings per share of the Company for the six months ended 30 June
2020 are as follows:
Unit: RMB per share
Profit during the reporting period
Weighted average
return on net assets (%)
Earnings per shareBasic
earnings per share
Diluted earnings per
share
Net profit attributable to shareholders of the Company 4.18 0.16 0.16Net profit attributable to shareholders of the parent
company after deduction of non-recurring profit or loss 3.74 0.15 0.15
Sinotrans Limited
27 August 2020
(1) NON-RECURRING STATEMENT OF PROFIT OR LOSS FOR THE PERIOD (CONTINUED)
SINOTRANS LIMITED336
Chapter 11Documents Available for Check
Documents Available for
Inspection
Financial statements signed and sealed by legal representative, chief financial
officer and head of the financial department
Original copies of all documents and announcements of the Company which
had been disclosed to the public on the newspapers designated by the China
Securities Regulatory Commission during the Reporting Period
Chairman: Li Guanpeng
Submission Date as Approved by the Board: 27 August 2020
Revision History
□Applicable 3Not applicable
Stock Code: 0598HK 601598SH
CUSTOMERS’ SUCCESSOUR ACHIEVEMENT
INTERIM REPORT2020
INTER
IM R
EPOR
T 2020