Customer the King
21
Christian Homburg, Michael Müller, & Martin Klarmann When Should the Customer Really Be King? On the Optimum Level of Salesperson Customer Orientation in Sales Encounters In today’s age of relational selling, a key challenge for salespeople is to determine the degree to which their customer-oriented behaviors drive sales performance. Therefore, this study analyzes whether a salesperson’s customer orientation in sales encounters has an optimum level with regard to sales performance and customer attitudes. Using triadic data from a cross-industry survey of 56 sales managers, 195 sales representatives, and 538 customers, the authors provide strong empirical support for a curvilinear, inverted U-shaped effect of a salesperson’s customer orientation on sales performance, whereas the effect of customer orientation on customer attitudes is continuously positive. Moreover, the findings reveal that the optimum level of customer orientation with regard to sales performance is higher for salespeople selling individualized products, in firms pursuing a premium price strategy , and in markets with a high degree of competitive intensity. Keywords : personal selling, customer orientation, sales encounter, salesperson performance, customer satisfaction Christian Homburg is Professor of Business Administration and Market- ing, Chairman of the Department of Marketing, University of Mannheim, and Professorial Fellow, Department of Management and Marketing, Uni- versity of Melbourne (e-mail: [email protected]). Michael Müller is managing director, Oskar Widmer GmbH, Germany (e-mail: [email protected]). Martin Klarmann is Professor of Marketing and Innovation, School of Business and Economics, University of Passau (e-mail: [email protected]). © 2011, American Marketing Association ISSN: 0022-2429 (print), 1547-7185 (electronic) Journal of Marketing Vol. 75 (March 2011), 55–74 55 C ustomer orientation has become a key construct in the marketing literature. On the one hand, researchers have studied the customer orientation of firms. In this research stream, it is often subsumed under the larger concept of market orientation (e.g., Kohli and Jaworski 1990; Narver and Slater 1990). On the other hand, many studies examine the customer orientation of individ- ual employees, especially salespeople (e.g., Franke and Park 2006; Hartline, Maxham, and McKee 2000). Saxe and Weitz (1982) introduced the concept of sales- person customer orientation to the marketing literature nearly 30 years ago to oppose the prevalent selling orienta- tion of many salespeople. Since then, salesperson objectives have changed dramatically: “The salesperson’ s new impera- tive is to help forge relationships and heighten cooperation with customer firms” (Hunter and Perreault 2007, p. 16). In this new environment, customer-oriented behaviors, such as identifying customer needs and adapting the offer, have become key elements in building relationships (Cannon and Perreault 1999; Palmatier, Scheer , and Steenkamp 2007). At the same time, adopting customer-oriented behaviors also requires substantial resources, in terms of both sales- person time (e.g., Saxe and Weitz 1982) and complexity costs arising from customizing products and processes to meet customer needs (e.g., Niraj, Gupta, and Narasimhan 2001). According to their meta-analytic finding that there is no clear effect of salesperson customer orientation on sales performance, Franke and Park (2006, p. 700) warn that “the costs of implementing customer-oriented selling may be higher than salespeople realize.” Thus, it is important for salespeople in today’s sales environments to ask, “How right should the customer be?” (Anderson and Onyemah 2006, p. 59). More formally, this amounts to the important question whether there is an optimal level of a salesperson’s cus- tomer orientation with regard to sales performance. Using a rich set of survey data from 56 sales managers, 195 sales representatives, and more than 500 customers, this study addresses this question. In this context, three additional issues need to be considered. First, it is highly likely that the magnitude of the opti- mum level of customer orientation depends on product and market characteristics. For example, Tuli, Kohli, and Bharadwaj (2007) find that a key problem of many suppli- ers of highly individualized customer solutions is that they still lack proper understanding of their customers’ busi- nesses. At the same time, according to Ver beke et al. (2008), a deep understanding of a customer’s needs may even reduce sales performance, if the sales task is highly struc- tured (as is often the case for standardized products). There- fore, we test whether product individuality as well as prod- uct importance, price positioning, and competitive intensity affect the optimum level of customer orientation.
-
Upload
zoey-schully -
Category
Documents
-
view
220 -
download
0
Transcript of Customer the King
8/2/2019 Customer the King
http://slidepdf.com/reader/full/customer-the-king 1/21
Christian Homburg, Michael Müller, & Martin Klarmann
When Should the Customer ReallyBe King? On the Optimum Level of
Salesperson Customer Orientation inSales EncountersIn today’s age of relational selling, a key challenge for salespeople is to determine the degree to which theircustomer-oriented behaviors drive sales performance. Therefore, this study analyzes whether a salesperson’scustomer orientation in sales encounters has an optimum level with regard to sales performance and customerattitudes. Using triadic data from a cross-industry survey of 56 sales managers, 195 sales representatives, and 538customers, the authors provide strong empirical support for a curvilinear, inverted U-shaped effect of a salesperson’scustomer orientation on sales performance, whereas the effect of customer orientation on customer attitudes iscontinuously positive. Moreover, the findings reveal that the optimum level of customer orientation with regard tosales performance is higher for salespeople selling individualized products, in firms pursuing a premium pricestrategy, and in markets with a high degree of competitive intensity.
Keywords : personal selling, customer orientation, sales encounter, salesperson performance, customer satisfaction
Christian Homburg is Professor of Business Administration and Market-ing, Chairman of the Department of Marketing, University of Mannheim,and Professorial Fellow, Department of Management and Marketing, Uni-versity of Melbourne (e-mail: [email protected]). MichaelMüller is managing director, Oskar Widmer GmbH, Germany (e-mail:[email protected]). Martin Klarmann is Professor of Marketingand Innovation, School of Business and Economics, University of Passau(e-mail: [email protected]).
© 2011, American Marketing Association
ISSN: 0022-2429 (print), 1547-7185 (electronic)
Journal of Marketing
Vol. 75 (March 2011), 55–7455
Customer orientation has become a key construct in
the marketing literature. On the one hand,
researchers have studied the customer orientation of
firms. In this research stream, it is often subsumed under
the larger concept of market orientation (e.g., Kohli and
Jaworski 1990; Narver and Slater 1990). On the other hand,
many studies examine the customer orientation of individ-
ual employees, especially salespeople (e.g., Franke and
Park 2006; Hartline, Maxham, and McKee 2000).Saxe and Weitz (1982) introduced the concept of sales-
person customer orientation to the marketing literature
nearly 30 years ago to oppose the prevalent selling orienta-
tion of many salespeople. Since then, salesperson objectives
have changed dramatically: “The salesperson’s new impera-
tive is to help forge relationships and heighten cooperation
with customer firms” (Hunter and Perreault 2007, p. 16). In
this new environment, customer-oriented behaviors, such as
identifying customer needs and adapting the offer, have
become key elements in building relationships (Cannon and
Perreault 1999; Palmatier, Scheer, and Steenkamp 2007).
At the same time, adopting customer-oriented behaviors
also requires substantial resources, in terms of both sales-
person time (e.g., Saxe and Weitz 1982) and complexity
costs arising from customizing products and processes to
meet customer needs (e.g., Niraj, Gupta, and Narasimhan
2001). According to their meta-analytic finding that there is
no clear effect of salesperson customer orientation on sales
performance, Franke and Park (2006, p. 700) warn that “the
costs of implementing customer-oriented selling may be
higher than salespeople realize.” Thus, it is important for
salespeople in today’s sales environments to ask, “Howright should the customer be?” (Anderson and Onyemah
2006, p. 59).
More formally, this amounts to the important question
whether there is an optimal level of a salesperson’s cus-
tomer orientation with regard to sales performance. Using a
rich set of survey data from 56 sales managers, 195 sales
representatives, and more than 500 customers, this study
addresses this question. In this context, three additional
issues need to be considered.
First, it is highly likely that the magnitude of the opti-
mum level of customer orientation depends on product and
market characteristics. For example, Tuli, Kohli, and
Bharadwaj (2007) find that a key problem of many suppli-ers of highly individualized customer solutions is that they
still lack proper understanding of their customers’ busi-
nesses. At the same time, according to Verbeke et al. (2008),
a deep understanding of a customer’s needs may even
reduce sales performance, if the sales task is highly struc-
tured (as is often the case for standardized products). There-
fore, we test whether product individuality as well as prod-
uct importance, price positioning, and competitive intensity
affect the optimum level of customer orientation.
8/2/2019 Customer the King
http://slidepdf.com/reader/full/customer-the-king 2/21
Second, because of today’s importance of developing
long-term customer relationships, the utility of using finan-
cial sales performance as outcome variable in sales research
has been questioned (e.g., Hunter and Perreault 2007). In
particular, scholars fear that this may be a wrong measure in
a relational selling context because it neglects long-term
customer reactions to a successful sale. Therefore, in this
study, we also consider customer attitudes as outcomes of
customer orientation. Here, the existence of an optimum
level is specifically not expected.
Third, scholars have criticized that the concept of sales-person customer orientation has remained somewhat vague
and imprecise (e.g., Schwepker 2003). Perhaps for this rea-
son, instead of studying the concept as a whole, recent
research has focused on specific behaviors and traits that
can be considered customer oriented according to the origi-
nal definition. Examples include a predisposition to meet
customer needs (Brown et al. 2002), the tendency to build
personal relationships with customers (Donavan, Brown,
and Mowen 2004), and an employee’s customer need
knowledge (Homburg, Wieseke, and Bornemann 2009). In
line with this development, this study focuses on sales-
person customer orientation in the context of sales encoun-
ters because sales encounters represent a supplier’s mostimportant points of contact with a customer in a business
relationship (e.g., Verbeke and Bagozzi 2000).
Conceptual Background
Customer Orientation in Sales Encounters
When Saxe and Weitz (1982) introduced the concept, they
characterized salesperson customer orientation as commit-
56 / Journal of Marketing, March 2011
ment to understanding and meeting a customer’s needs and
interests and ensuring long-term customer satisfaction.
Against this background, we define “salesperson customer
orientation in sales encounters” as the degree to which a
salesperson identifies and meets customer needs and inter-
ests in the different stages of a sales encounter.
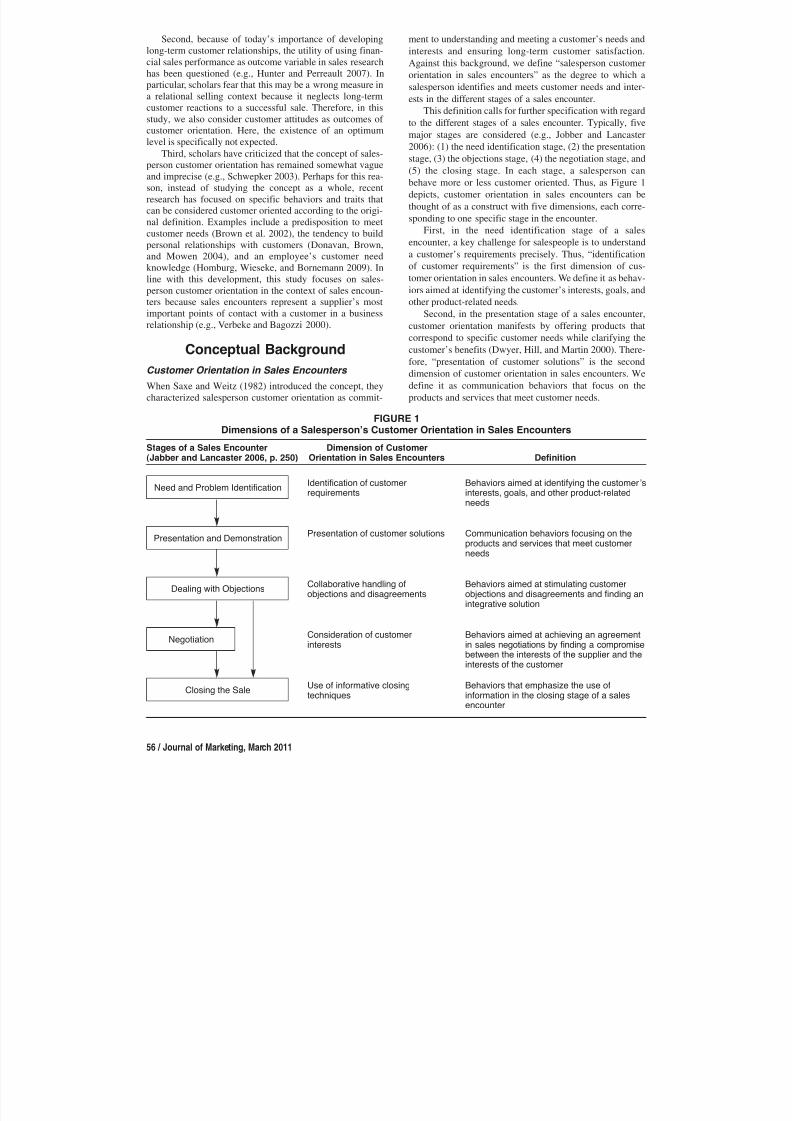
This definition calls for further specification with regard
to the different stages of a sales encounter. Typically, five
major stages are considered (e.g., Jobber and Lancaster
2006): (1) the need identification stage, (2) the presentationstage, (3) the objections stage, (4) the negotiation stage, and
(5) the closing stage. In each stage, a salesperson can
behave more or less customer oriented. Thus, as Figure 1
depicts, customer orientation in sales encounters can be
thought of as a construct with five dimensions, each corre-
sponding to one specific stage in the encounter.
First, in the need identification stage of a sales
encounter, a key challenge for salespeople is to understand
a customer’s requirements precisely. Thus, “identification
of customer requirements” is the first dimension of cus-
tomer orientation in sales encounters. We define it as behav-
iors aimed at identifying the customer’s interests, goals, and
other product-related needs.Second, in the presentation stage of a sales encounter,
customer orientation manifests by offering products that
correspond to specific customer needs while clarifying the
customer’s benefits (Dwyer, Hill, and Martin 2000). There-
fore, “presentation of customer solutions” is the second
dimension of customer orientation in sales encounters. We
define it as communication behaviors that focus on the
products and services that meet customer needs.
FIGURE 1Dimensions of a Salesperson’s Customer Orientation in Sales Encounters
Stages of a Sales Encounter Dimension of Customer
(Jabber and Lancaster 2006, p. 250) Orientation in Sales Encounters Definition
Need and Problem Identification
Presentation and Demonstration
Dealing with Objections
Negotiation
Closing the Sale
Behaviors aimed at identifying the customer’sinterests, goals, and other product-relatedneeds
Communication behaviors focusing on theproducts and services that meet customerneeds
Behaviors aimed at stimulating customerobjections and disagreements and finding an
integrative solution
Behaviors aimed at achieving an agreementin sales negotiations by finding a compromisebetween the interests of the supplier and theinterests of the customer
Behaviors that emphasize the use ofinformation in the closing stage of a salesencounter
Identification of customerrequirements
Presentation of customer solutions
Collaborative handling ofobjections and disagreements
Consideration of customerinterests
Use of informative closingtechniques
8/2/2019 Customer the King
http://slidepdf.com/reader/full/customer-the-king 3/21
Third, in the objection stage of a sales encounter, the
conflict “inherent in buyer–seller relationships” (Malhotra
1999, p. 118) is likely to become apparent. Here, customer-
oriented salespeople employ a collaboration approach (Weitz
and Bradford 1999) by actively exchanging information and
creatively identifying mutually beneficial alternatives. We
define this “collaborative handling of objections and disagree-
ments” as behaviors aimed at stimulating customer objec-
tions and disagreements and finding an integrative solution.
Fourth, because the collaboration approach cannot be
applied to all conflicts of interest (Weitz and Bradford1999), it is necessary to engage in compromising in the
negotiation stage of a sales encounter. Here, customer ori-
entation manifests as “consideration of customer interests,”
which we define as behaviors aimed at achieving an agree-
ment in sales negotiations by finding a compromise between
the interests of the supplier and the interests of the customer.
Fifth, for customer-oriented salespeople, closing a sale
becomes “relatively straightforward” (Brooksbank 1995, p.
62). Instead of employing specific persuasion tactics that
customers often perceive as manipulative and that reduce
trust (Hawes, Strong, and Winick 1996), salespeople rely on
information (Saxe and Weitz 1982). Therefore, in the clos-
ing stage of a sales encounter, customer orientationbecomes apparent through the “use of informative closing
techniques,” which we define as behaviors that emphasize
the use of information to close a sale.
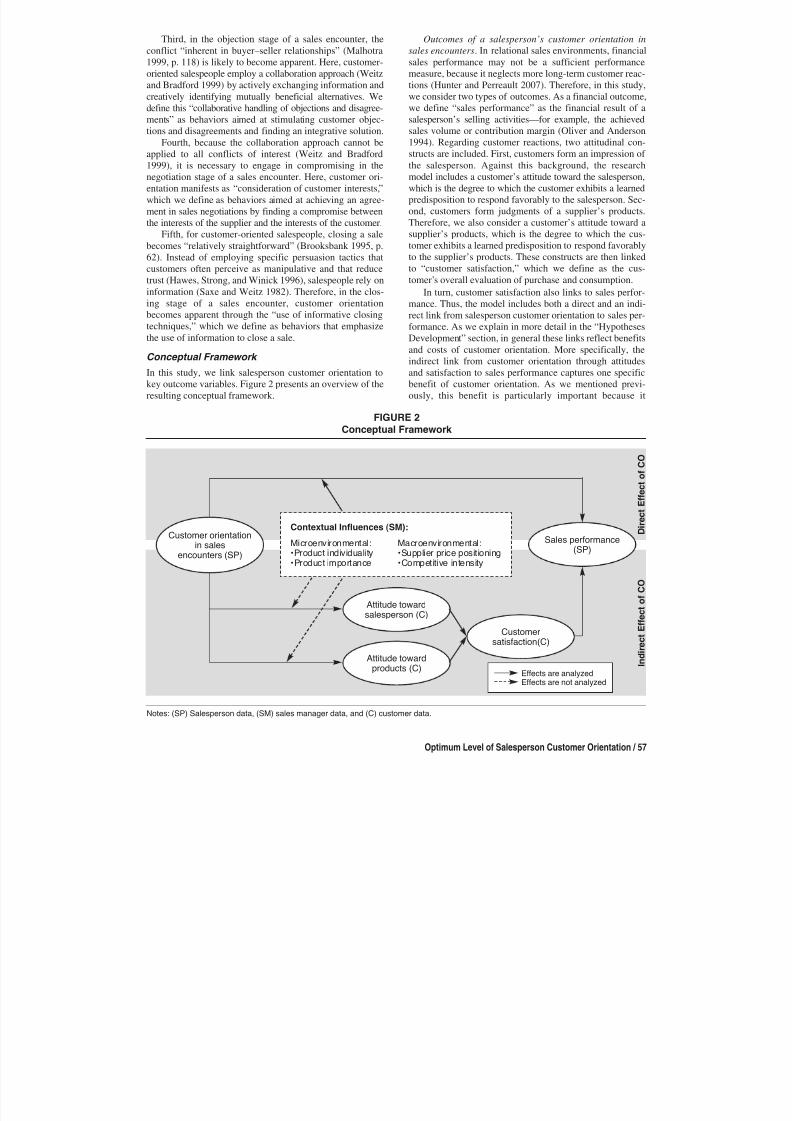
Conceptual Framework
In this study, we link salesperson customer orientation to
key outcome variables. Figure 2 presents an overview of the
resulting conceptual framework.
Optimum Level of Salesperson Customer Orientation / 57
Outcomes of a salesperson’s customer orientation in
sales encounters. In relational sales environments, financial
sales performance may not be a sufficient performance
measure, because it neglects more long-term customer reac-
tions (Hunter and Perreault 2007). Therefore, in this study,
we consider two types of outcomes. As a financial outcome,
we define “sales performance” as the financial result of a
salesperson’s selling activities—for example, the achieved
sales volume or contribution margin (Oliver and Anderson
1994). Regarding customer reactions, two attitudinal con-
structs are included. First, customers form an impression of the salesperson. Against this background, the research
model includes a customer’s attitude toward the salesperson,
which is the degree to which the customer exhibits a learned
predisposition to respond favorably to the salesperson. Sec-
ond, customers form judgments of a supplier’s products.
Therefore, we also consider a customer’s attitude toward a
supplier’s products, which is the degree to which the cus-
tomer exhibits a learned predisposition to respond favorably
to the supplier’s products. These constructs are then linked
to “customer satisfaction,” which we define as the cus-
tomer’s overall evaluation of purchase and consumption.
In turn, customer satisfaction also links to sales perfor-
mance. Thus, the model includes both a direct and an indi-rect link from salesperson customer orientation to sales per-
formance. As we explain in more detail in the “Hypotheses
Development” section, in general these links reflect benefits
and costs of customer orientation. More specifically, the
indirect link from customer orientation through attitudes
and satisfaction to sales performance captures one specific
benefit of customer orientation. As we mentioned previ-
ously, this benefit is particularly important because it
Contextual Influences (SM):
Microenvironmental: Macroenvironmental:•Product individuality •Supplier price positioning•Product importance •Competitive intensity
FIGURE 2
Conceptual Framework
Notes: (SP) Salesperson data, (SM) sales manager data, and (C) customer data.
Customer orientationin sales
encounters (SP)
Effects are analyzedEffects are not analyzed
Attitude towardsalesperson (C)
Attitude towardproducts (C)
Customersatisfaction(C)
Sales performance(SP)
I n d i r e c t E f f e c t
o f C O
D i r e c t E f f e c t o f C O
8/2/2019 Customer the King
http://slidepdf.com/reader/full/customer-the-king 4/21
addresses possible long-term effects of salesperson cus-
tomer orientation. At the same time, it is highly likely that
many other benefits of customer orientation are not covered
by the indirect effect. For example, Cronin, Brady, and Hult
(2000) find that the degree to which services are adapted to
the customers’ needs (labeled in their study “service value”)
has a direct effect on loyalty intentions that is three times as
strong as an indirect effect through customer satisfaction.
The direct link from customer orientation to sales perfor-
mance covers these remaining benefits as well as all the
costs of customer orientation.
Contextual influences. In his contingency framework for
understanding salesperson performance, Weitz (1981) pro-
poses that the effectiveness of salesperson behaviors
strongly depends on macroenvironmental and microenvi-
ronmental variables. Thus, this study also analyzes the
influence of four contextual variables (two of every type) on
the effectiveness of salesperson customer orientation with
regard to sales performance. In this regard, we focus on the
direct link from customer orientation to performance. Thus,
we assess whether the optimal level of customer orientation
varies depending on the context of the sales encounter.
With regard to microenvironmental variables, we exam-
ine two characteristics of the customer buying task (Weitz1981). Product individuality is the degree to which a sup-
plier offers individualized products, and product importance
is the general importance of a supplier’s products and ser-
vices to the customers. With regard to macroenvironmental
variables, we consider two facets of the firm’s competitive
position. Supplier price positioning is a supplier’s relative
price level, and competitive intensity is the degree of com-
petition in a marketplace (Kohli and Jaworski 1990).
Hypotheses Development
Effects of Customer Orientation in Sales
Encounters
We argue that a salesperson’s customer orientation in sales
encounters has a nonlinear, inverted U-shaped relationship
to sales performance, whereas its relationship to customer
attitudes is continuously positive. This implies that there is
an optimum level of customer orientation with regard to
sales performance but not with regard to customer attitudes.
Our argument is based on a distinction between two
ways that salesperson customer orientation affects sales-
person financial performance. On the one hand, customer-
oriented behaviors trigger customer reactions that positively
affect revenues and profits through increased sales volumes
and higher prices. We refer to these effects as benefits of
customer orientation. On the other hand, customer-oriented
behaviors require inputs in terms of salesperson resources
and firm resources that may negatively affect revenues and
profits and, thus, salesperson financial performance. We
refer to these effects as costs of customer orientation.
The reasoning behind our nonlinear hypothesis is based
on the idea that the law of diminishing returns applies to the
benefits of increasing customer orientation with regard to
sales performance, whereas costs increase steadily. We out-
line these ideas in more detail next.
58 / Journal of Marketing, March 2011
Diminishing benefits of customer orientation in sales
encounters. By identifying and satisfying customer needs,
customer-oriented salespeople create customer value (e.g.,
Brady and Cronin 2001; Franke and Piller 2004). This
added value increases the attractiveness of a firm’s offering
and thus is a strong direct predictor of customer purchasing
intentions (Cronin, Brady, and Hult 2000). Thus, customers
are likely to respond to increases in customer value through
customer orientation by purchasing more. These benefits of
customer orientation have been studied extensively. Sales-
person customer orientation has been shown to drive salesvolume through increases in cross-buying (Siders, George,
and Dharwadkar 2001), customer retention (Dean 2007;
Jones, Busch, and Dacin 2003), and immediate purchases
(George 1991).
At the same time, customers also reward additional
value of a supplier’s products with a higher willingness to
pay (Pihlström and Brush 2008). Consistent with this effect,
Homburg, Wieseke, and Bornemann (2009) find that cus-
tomers are willing to pay more if the salesperson possesses
a profound knowledge of their needs. Thus, salesperson
customer orientation should also translate into better sales-
person financial performance through increased revenues
and margins.However, some recent studies suggest that customer-
oriented behaviors are particularly effective in creating cus-
tomer value if they help customers satisfy their core needs.
Beyond that, increases in customer orientation add less
value for the customer. For example, with regard to the first
dimension (i.e., the identification of customer require-
ments), Verbeke et al. (2008) find that understanding the
core needs of the customers is an important source of value
creation, whereas understanding intricate details of the cus-
tomer’s needs is not. Likewise, regarding the second dimen-
sion (i.e., the presentation of customer solutions), Franke,
Keinz, and Steger (2009) find that adapting a product to the
customers’ needs is much more valuable if it includes fea-tures with which they are highly involved.
This logic also extends to the other dimensions of cus-
tomer orientation. Regarding the third and fourth dimension
(i.e., collaborative handling of objections and disagree-
ments and consideration of customer interests), Weitz and
Bradford (1999) argue that customers appreciate collabora-
tion and compromise approaches to buyer–seller conflicts
more if they pertain to issues perceived as important. Simi-
larly, with regard to the use informative closing techniques
(i.e., the fifth dimension), strategies such as summarizing
the offer should focus on main benefits (e.g., Jobber and
Lancaster 2006). Thus, the incremental benefits of increas-
ing customer orientation are greater if the salesperson’s ini-tial level of customer orientation is low, which implies that
there are diminishing benefits of customer orientation in
sales encounters.
Costs of customer orientation in sales encounters. Prior
research has repeatedly noted that increasing salesperson
customer orientation is a resource-intensive endeavor (e.g.,
Franke and Park 2006; Kumar, Venkatesan, and Reinartz
2008). In particular, costs arise from salesperson time and
in terms of added complexity for the selling organization.

8/2/2019 Customer the King
http://slidepdf.com/reader/full/customer-the-king 5/21
Implementing a customer orientation requires a lot of
time (e.g., Saxe and Weitz 1982), and this applies to all its
dimensions. For example, regarding the first dimension
(i.e., the identification of customer requirements), gaining
insights into customer preferences is a lengthy process
(Franke, Keinz, and Steger 2009). In addition, adapting
sales presentations to the needs of the customer instead of
using a “one-size-fits-all” style presentation (the second
dimension) requires more preparation time. Likewise, finding
integrative solutions or compromises in conflicts between
buyers and sellers instead of relying on persuasion and/or
pressure “involves the expenditure of considerable time and
effort” (Weitz and Bradford 1999, p. 247).
These time requirements may affect financial sales-
person performance because they are associated with impor-
tant opportunity costs. Salespeople wanting to increase their
customer orientation need to reallocate how they spend
their time. They are required to spend more time per cus-
tomer, which reduces the total number of customers they
can serve at all. Thus, increasing customer orientation
means shifting resources from customer acquisition to cus-
tomer retention, which does not necessarily improve perfor-
mance (e.g., Reinartz, Thomas, and Kumar 2005). In addi-
tion, in the remaining customer relationships, salespeople
must spend relatively more time on acquiring information
and adapting their offer and less on traditional selling activi-
ties, such as promoting and persuading (Weitz and Bradford
1999). This may also result in fewer sales opportunities and,
thus, reduced salesperson financial performance.
In addition, customer-oriented salesperson behaviors
result in offerings that are adapted to the specific needs of
the customer. As Joshi (2010, p. 94) notes, salespeople are
“preeminent among the individual-level drivers of product
modifications within organizations.” Consequently, sales-
person customer orientation is likely to be associated with
complexity costs for the selling organization. For example,Tuli, Kohli, and Bharadwaj (2007) find that for firms offer-
ing their customers comprehensive product solutions, over-
coming organizational complexity is a key challenge. In
particular, to maintain the required flexibility for offering
customized products, the efficiency of these organizations is
reduced (Gilmore and Pine 1997). Such additional com-
plexity results in “higher customer service costs and thus
lower customer profits” (Niraj, Gupta, and Narasimhan
2001, p. 7). Thus, it reduces salesperson financial perfor-
mance.
Optimal level of customer orientation in sales encoun-
ters. Salespeople wanting to increase their customer orien-
tation need to focus on fewer customers, and their offeringswill be more expensive to produce. Coupled with diminish-
ing returns of customer orientation, this indicates that the
relationship between customer orientation and sales perfor-
mance is shaped in the form of an inverted U, implying the
existence of an optimum level. Accordingly, we hypothesize
the following:
H1: The relationship between a salesperson’s customer orien-tation in sales encounters and his or her sales performanceis curvilinear in the shape of an inverted U.
Optimum Level of Salesperson Customer Orientation / 59
Effects of customer orientation in sales encounters on
customer attitudes. Other than with regard to sales perfor-
mance, we expect that the effect of customer orientation on
customer attitudes is continuously positive. With regard to
attitudes toward the product, it is highly likely that the supe-
rior value of products and services sold by customer-ori-
ented salespeople results in more positive customer evalua-
tions (e.g., Woodruff 1997). Several empirical studies
support the existence of a positive relationship between cus-
tomer orientation and customer attitudes toward the offering(e.g., Brady and Cronin 2001; Goff et al. 1997).
In addition to enhancing product evaluations, customer-
oriented behaviors are likely to reflect well on the sales-
person. We expect that customers appreciate salespeople
who they perceive in sales encounter as being responsive to
their needs. Again, several studies support the existence of a
positive effect of salesperson customer orientation on cus-
tomer attitudes toward the salesperson (e.g., Brady and
Cronin 2001; Ramsey and Sohi 1997).
Thus, there is reason to expect a positive relationship
between salesperson customer orientation and both types of
attitudes. At the same time, there is little to suggest that
increases in salesperson customer orientation are associatedwith any significant costs in terms of customer attitudes.
Consequently, it seems unlikely that situations arise in
which customer attitudes deteriorate as a result of increases
in salesperson customer orientation. Thus, we hypothesize
the following:
H2: The relationship between a salesperson’s customer orien-
tation in sales encounters and customer attitudes toward
the salesperson is continuously positive.
H3: The relationship between a salesperson’s customer orien-
tation in sales encounters and customer attitudes toward
the supplier’s products is continuously positive.
Effects of Customer Attitudes
Consistent with previous research (e.g., Crosby and
Stephens 1987), we expect that customer attitudes are
strong drivers of overall customer satisfaction. Thus, we
hypothesize the following:
H4: The relationship between a customer’s attitude toward the
supplier’s products and customer satisfaction is continu-
ously positive.
H5: The relationship between a customer’s attitude toward the
salesperson and customer satisfaction is continuously
positive.
Similarly, because customer satisfaction is positively asso-ciated with outcomes such as increasing share of wallet
(e.g., Keiningham, Munn, and Evans 2003), we predict the
following:
H6: The relationship between customer satisfaction and sales
performance is continuously positive.
These relationships are well established in sales research.
Thus, in Table 1, we provide only a brief summary of the
rationale behind them.
8/2/2019 Customer the King
http://slidepdf.com/reader/full/customer-the-king 6/21
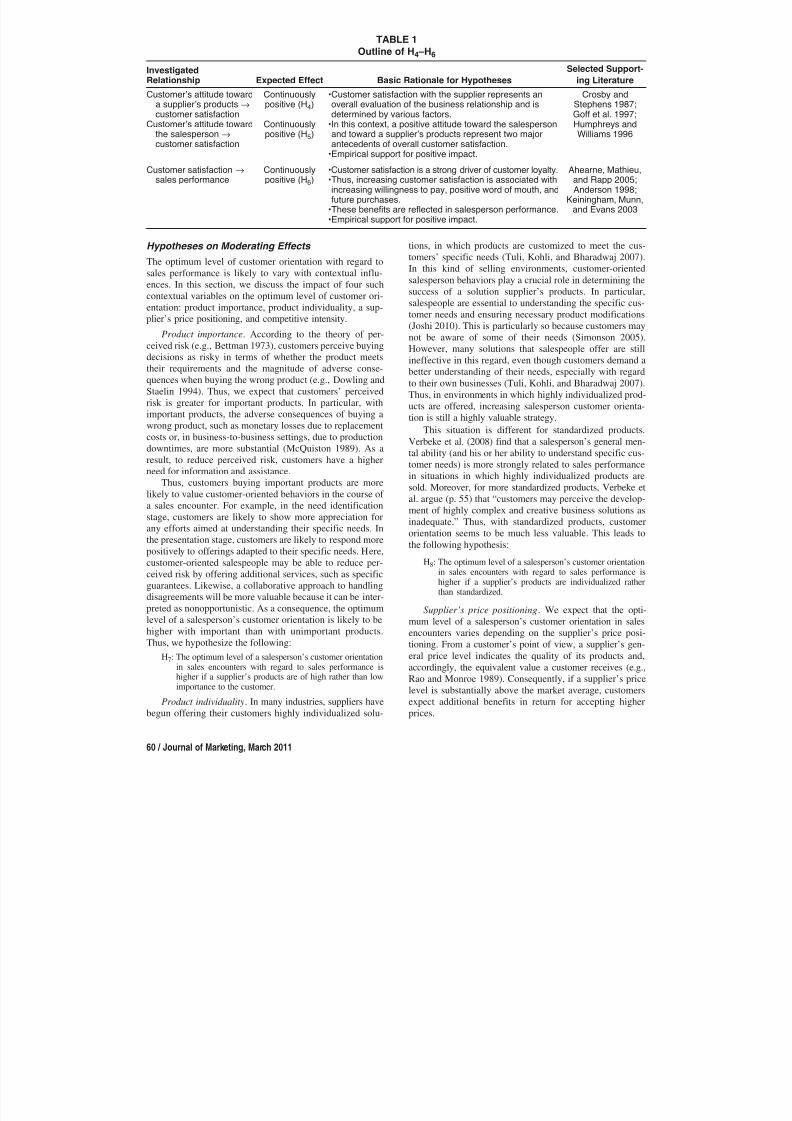
Hypotheses on Moderating Effects
The optimum level of customer orientation with regard to
sales performance is likely to vary with contextual influ-
ences. In this section, we discuss the impact of four such
contextual variables on the optimum level of customer ori-
entation: product importance, product individuality, a sup-
plier’s price positioning, and competitive intensity.
Product importance. According to the theory of per-
ceived risk (e.g., Bettman 1973), customers perceive buying
decisions as risky in terms of whether the product meets
their requirements and the magnitude of adverse conse-
quences when buying the wrong product (e.g., Dowling and
Staelin 1994). Thus, we expect that customers’ perceived
risk is greater for important products. In particular, with
important products, the adverse consequences of buying a
wrong product, such as monetary losses due to replacement
costs or, in business-to-business settings, due to production
downtimes, are more substantial (McQuiston 1989). As a
result, to reduce perceived risk, customers have a higher
need for information and assistance.
Thus, customers buying important products are more
likely to value customer-oriented behaviors in the course of
a sales encounter. For example, in the need identification
stage, customers are likely to show more appreciation for
any efforts aimed at understanding their specific needs. In
the presentation stage, customers are likely to respond more
positively to offerings adapted to their specific needs. Here,
customer-oriented salespeople may be able to reduce per-
ceived risk by offering additional services, such as specific
guarantees. Likewise, a collaborative approach to handling
disagreements will be more valuable because it can be inter-
preted as nonopportunistic. As a consequence, the optimumlevel of a salesperson’s customer orientation is likely to be
higher with important than with unimportant products.
Thus, we hypothesize the following:
H7: The optimum level of a salesperson’s customer orientationin sales encounters with regard to sales performance ishigher if a supplier’s products are of high rather than lowimportance to the customer.
Product individuality. In many industries, suppliers have
begun offering their customers highly individualized solu-
60 / Journal of Marketing, March 2011
tions, in which products are customized to meet the cus-
tomers’ specific needs (Tuli, Kohli, and Bharadwaj 2007).
In this kind of selling environments, customer-oriented
salesperson behaviors play a crucial role in determining the
success of a solution supplier’s products. In particular,
salespeople are essential to understanding the specific cus-tomer needs and ensuring necessary product modifications
(Joshi 2010). This is particularly so because customers may
not be aware of some of their needs (Simonson 2005).
However, many solutions that salespeople offer are still
ineffective in this regard, even though customers demand a
better understanding of their needs, especially with regard
to their own businesses (Tuli, Kohli, and Bharadwaj 2007).
Thus, in environments in which highly individualized prod-
ucts are offered, increasing salesperson customer orienta-
tion is still a highly valuable strategy.
This situation is different for standardized products.
Verbeke et al. (2008) find that a salesperson’s general men-
tal ability (and his or her ability to understand specific cus-tomer needs) is more strongly related to sales performance
in situations in which highly individualized products are
sold. Moreover, for more standardized products, Verbeke et
al. argue (p. 55) that “customers may perceive the develop-
ment of highly complex and creative business solutions as
inadequate.” Thus, with standardized products, customer
orientation seems to be much less valuable. This leads to
the following hypothesis:
H8: The optimum level of a salesperson’s customer orientationin sales encounters with regard to sales performance ishigher if a supplier’s products are individualized ratherthan standardized.
Supplier’s price positioning. We expect that the opti-mum level of a salesperson’s customer orientation in sales
encounters varies depending on the supplier’s price posi-
tioning. From a customer’s point of view, a supplier’s gen-
eral price level indicates the quality of its products and,
accordingly, the equivalent value a customer receives (e.g.,
Rao and Monroe 1989). Consequently, if a supplier’s price
level is substantially above the market average, customers
expect additional benefits in return for accepting higher
prices.
InvestigatedRelationship Expected Effect Basic Rationale for Hypotheses
Selected Support-
ing Literature
Customer’s attitude towarda supplier’s products Æcustomer satisfaction
Continuouslypositive (H4)
•Customer satisfaction with the supplier represents anoverall evaluation of the business relationship and isdetermined by various factors.
Crosby andStephens 1987;Goff et al. 1997;Humphreys andWilliams 1996
Customer’s attitude towardthe salesperson Æcustomer satisfaction
Continuouslypositive (H5)
•In this context, a positive attitude toward the salespersonand toward a supplier’s products represent two majorantecedents of overall customer satisfaction.
•Empirical support for positive impact.
Customer satisfaction Æsales performance
Continuouslypositive (H6)
•Customer satisfaction is a strong driver of customer loyalty.•Thus, increasing customer satisfaction is associated withincreasing willingness to pay, positive word of mouth, andfuture purchases.
•These benefits are reflected in salesperson performance.•Empirical support for positive impact.
Ahearne, Mathieu,and Rapp 2005;Anderson 1998;
Keiningham, Munn,and Evans 2003
TABLE 1
Outline of H4 –H6

8/2/2019 Customer the King
http://slidepdf.com/reader/full/customer-the-king 7/21
As a primary information source for the customer, sales-
people must be able to justify higher prices. On an overall
basis, a salesperson’s customer-oriented behaviors in the
single stages of a sales encounter may strengthen a cus-
tomer’s benefit perceptions. For example, through the defi-
nition of customer requirements and the presentation of
appropriate customer solutions, salespeople may be able to
create an equivalent value for the supplier’s higher prices.
However, if a supplier’s price level is below the market
average, salespeople probably rely on lower prices in their
argument, and as a consequence, a lower level of customerorientation in sales encounters may be sufficient to achieve
a desired outcome. In other words, we expect the additional
benefits of higher levels of customer orientation in sales
encounters to be more substantial if a supplier’s prices are
above rather than below the market average. Thus, we
hypothesize the following:
H9: The optimum level of a salesperson’s customer orientationin sales encounters with regard to sales performance ishigher if a supplier’s price positioning is above rather thanbelow the market average.
Competitive intensity. Finally, we expect that the opti-
mum level of customer orientation in sales encounters ishigher in highly competitive markets than in less competi-
tive markets. In highly competitive environments, cus-
tomers have greater relative market power (Appiah-Adu and
Singh 1998). Accordingly, customers most likely have
greater demands in highly competitive markets, for exam-
ple, with regard to product quality and service levels. More-
over, in highly competitive markets, the quality of products
and services of different suppliers is often similar, thus
complicating differentiation.
As a consequence, in highly competitive environments,
salespeople are pressured to be a means of differentiation—
for example, by establishing a relationship with the cus-
tomer that is perceived as valuable in itself (Yim, Tse, andChan 2008). Therefore, we expect that high levels of a
salesperson’s customer orientation in the single stages of a
sales encounter are more beneficial if competitive intensity
is high. If competitive intensity is low and salespeople can
more easily differentiate from competition, for example, in
terms of the quality of a supplier’s products and services, a
lower level of a salesperson’s customer orientation in sales
encounters is likely to be sufficient. Against this back-
ground, we hypothesize the following:
H10: The optimum level of a salesperson’s customer orienta-tion in sales encounters with regard to sales performanceis higher in highly competitive markets than in lesscompetitive markets.
Methodology
Collection of Triadic Data
To test these hypotheses, we conducted a large survey
among sales managers, sales representatives, and cus-
tomers. In the first step, we asked chief executives who
cooperate regularly with the University of Mannheim
whether they were interested in participating. In this way,
Optimum Level of Salesperson Customer Orientation / 61
47 companies from different industries were contacted. As
incentives, they were offered an individualized report of the
study results (including benchmark analyses) and a consult-
ing workshop. Of these companies, 12 that mainly operate
in business-to-business markets in six different industries
(financial services, logistics, health care, machine building,
chemicals, and information technology) agreed to partici-
pate (a response rate of 25.6%), most with multiple business
units. Overall, 33 business units participated.
In these business units, we conducted two separate sur-
veys among the sales managers and the sales representa-
tives. After informing them about the goals of our research,
we mailed questionnaires with a request for completion
within four weeks. We obtained usable responses from 56
sales managers (a response rate of 84.9%) and 195 sales
representatives (67.2%).
In the second step, we obtained the contact data of, on
average, ten randomly selected customers per participating
sales representative, which allowed us to survey multiple
customers per sales representative. After informing these
customers by mail about the goals of the study, we contacted
them by telephone to obtain their responses to our survey
questions, which resulted in usable responses from 538 cus-tomers. Table 2 presents the respondents’ characteristics.
Data from the three sources were matched using code
numbers. Because the unit of analysis in this study is the
individual salesperson, we matched the data at the sales-
TABLE 2Sample Composition
%
A. Industries According to Salespeople SurveyedFinancial services 32Logistics 22Health care 14
Machine building 2Chemicals 17Information technology 13
B. Sales Experience of Salespeople Surveyed<5 years 145–10 years 3111–15 years 2116–20 years 1921–25 years 526–30 years 5>30 years 5
C. Number of Customers Served by Salespeople1–10 2011–20 1621–50 22
51–100 17>100 25
D. Length of Relationship Between Supplier andCustomer<2 years 52–5 years 86–10 years 1111–20 years 2621–30 years 1631–50 years 20>50 years 14
8/2/2019 Customer the King
http://slidepdf.com/reader/full/customer-the-king 8/21
person level by averaging customer responses for each
salesperson. Aggregation may be problematic if there is
high variance in judgments related to the same salesperson;
thus, we computed the rwg(J) index (James, Demaree, and
Wolf 1984) for the customer constructs. The rwg(J) values
for the three focal constructs (i.e., attitude toward the sales-
person, attitude toward a supplier’s products, and customer
satisfaction) are all above .89, indicating strong consistency
(Brown and Hauenstein 2005). As a result, aggregating the
customer responses for each salesperson is a viable strategy.
Measure Development
For item generation, we modified existing scales; only a
few items were completely new. We further refined the
measures on the basis of an intensive pretest. A complete
list of items (including the new and original wording)
appears in the Appendix.
As in previous research (Franke and Park 2006), we
assessed salesperson customer orientation in sales encoun-
ters using salesperson self-reports (instead of customer
assessments). Given the study objectives, this is adequate
because aspects related to costs of customer orientation
(e.g., the degree to which an offer is customized) often can-
not be easily observed by customers.
In general, items come from two sources. First, we
modified items from Saxe and Weitz’s (1982) original scale
to match the specific context of sales encounters. Second,
we based the items on existing scales that measure specific
behaviors relevant for the respective stage of the sales
encounter. More specifically, to measure identification of
customer requirements, we combined two items from Saxe
and Weitz’s scale with three items referring to effective lis-
tening behaviors (Castleberry, Shepherd, and Ridnour
1999). With regard to presentation of customer solutions,
again we combined one item from Saxe and Weitz’s scale
with items referring to customer-oriented techniques in
sales presentations (Dwyer, Hill, and Martin 2000). To mea-sure collaborative handling of objections and disagree-
ments, we combined two new items with Rahim’s (1983)
scale for measuring collaborative handling of conflicts.
Similarly, we combined two modified items from Rahim’s
(1983) compromising scale with one item from Saxe and
Weitz’s customer orientation scale to measure consideration
of customer interests. The two items for measuring the use
of informative closing techniques are specifications of a
broader item from Saxe and Weitz’s scale.
In line with Oliver and Anderson (1994), the participating
salespeople rated their sales performance relative to that of
their colleagues regarding orders, sales, and contribution
margin. Thus, in line with recent sales research (e.g., Wiesekeet al. 2009), we assessed performance using subjective (vs.
objective) self-report (vs. supervisor-rated) measures.
We used a subjective (vs. objective) sales performance
measure because otherwise the performance between sales-
people from different companies could not be compared
(Behrman and Perreault 1982). In addition, empirical evi-
dence shows that subjective measures “do a better job of
tapping the content domain of the performance construct”
(Rich et al. 1999, p. 52).
62 / Journal of Marketing, March 2011
We used a self-report (vs. supervisor-rated) sales perfor-
mance measure because, to maintain employee trust, many
firms did not allow their managers to share individual per-
formance information. Moreover, it is likely that these self-
report measures are valid for at least three reasons. First,
supervisor performance ratings may be biased by supervi-
sors’ perceptions of the salesperson’s organizational citizen-
ship behaviors, such as whether he or she spends a lot of
time complaining (MacKenzie, Podsakoff, and Fetter 1993).
Second, previous research on the performance outcomes of
customer orientation yields consistent results with regard toself-reported and supervisor-rated performance (Brown et
al. 2002). Third, a series of tests, which we describe in the
“Results” section, establishes that our findings are not due
to common method variance (CMV).
Using evaluations from the participating customers, we
measured a customer’s attitude toward the salesperson with
three items adapted from a related scale employed by Ram-
sey and Sohi (1997). Likewise, we measured a customer’s
attitude toward a supplier’s products with three modified
items from a scale used by Miyazaki, Grewal and Good-
stein (2005). Finally, we measured customer satisfaction
with four items from Homburg and Stock (2004).
We include two control variables in the model. We mod-eled salesperson experience (measured as the number of
years the salesperson has worked in sales) as an antecedent
of sales performance. Quality of services and customer-
related business processes is linked to the customer attitude
constructs. We measured it using two items from Homburg
and Stock (2004).
We measured the moderator variables with sales
manager assessments. To measure product individuality,
managers assessed four new items that asked them to evalu-
ate the individuality of typical products their business unit
sells. Furthermore, we measured product importance with
two items adapted from Porter, Wiener, and Frankwick
(2003) and competitive intensity with five items adaptedfrom Jaworski and Kohli (1993). Finally, we assessed the
overall price positioning of managers’ business units com-
pared with their competitors with a single item because it
refers to a concrete and singular concept (Bergkvist and
Rossiter 2007).
Measure Assessment
We assessed reliability and validity of the measures with
confirmatory factor analyses for each factor. This included a
higher-order factor analysis (Brown 2006), with customer
orientation in sales encounters as the second-order construct
and its five dimensions as the first-order constructs. Thus,
equivalent to item reliabilities, we can compute the percent-
age of variance of the five dimensions explained with the
underlying customer orientation construct.
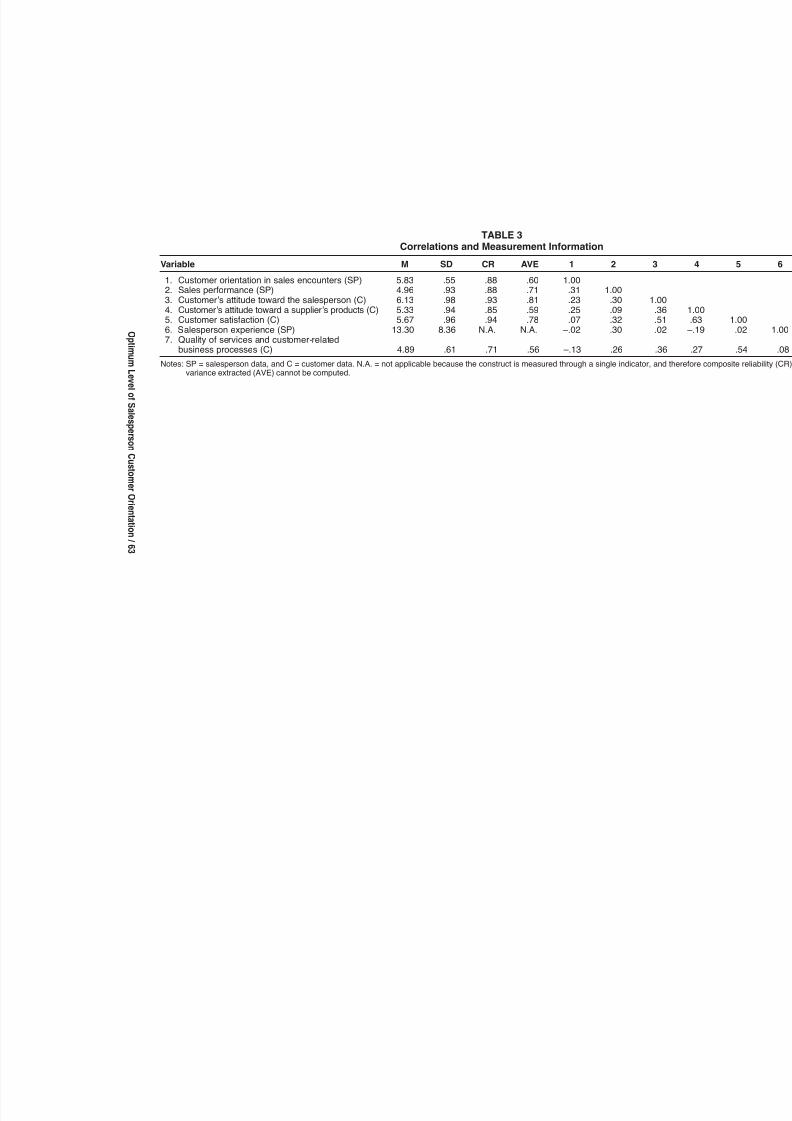
Overall, the measures exhibit good psychometric prop-
erties. All constructs exhibit composite reliabilities well
above the recommended threshold of .70 (see Table 3). For
both customer orientation and its outcomes, item loadings
(as well as the coefficients linking customer orientation to
its five dimensions) are all positive, high in magnitude, and
statistically significant, indicating unidimensionality and
establishing convergent validity (Anderson 1987).
8/2/2019 Customer the King
http://slidepdf.com/reader/full/customer-the-king 9/21
O p t i m u m L e v e l o f S a l e s p e r s o n C u s t o m e r O r i e n t a t i o n / 6 3
TABLE 3Correlations and Measurement Information
Variable M SD CR AVE 1 2 3
1. Customer orientation in sales encounters (SP) 5.83 .55 .88 .60 1.002. Sales performance (SP) 4.96 .93 .88 .71 .31 1.00
3. Customer’s attitude toward the salesperson (C) 6.13 .98 .93 .81 .23 .30 1.04. Customer’s attitude toward a supplier’s products (C) 5.33 .94 .85 .59 .25 .09 .35. Customer satisfaction (C) 5.67 .96 .94 .78 .07 .32 .56. Salesperson experience (SP) 13.30 8.36 N.A. N.A. –.02 .30 .07. Quality of services and customer-related
business processes (C) 4.89 .61 .71 .56 –.13 .26 .3
Notes: SP = salesperson data, and C = customer data. N.A. = not applicable because the construct is measured through a single indicator, anvariance extracted (AVE) cannot be computed.
8/2/2019 Customer the King
http://slidepdf.com/reader/full/customer-the-king 10/21
In addition, most item reliabilities are above the recom-
mended value of .40 (Bagozzi and Baumgartner 1994; see
the Appendix). The most important exception is the consid-
eration of customer interests dimension of customer orien-
tation with a value of .37, which we kept in the model to
preserve conceptual comprehensiveness. The few other
exceptions are for items of the five dimensions of customer
orientation. Again, deviations from .40 are rather small.
Following suggestions to prioritize conceptual concerns in
indicator selection (vs. maximizing internal consistency),
we kept these items in the model (e.g., Little, Lindenberger,and Nesselroade 1999).
It is also important to assess whether the outcomes of
customer orientation represent clearly distinguishable phe-
nomena. According to Fornell and Larcker (1981), any pair
of constructs exhibits discriminant validity if the average
item variance extracted through both constructs is higher
than their contribution to explaining the other construct
(assessed with squared correlations). In a confirmatory fac-
tor analysis model with all constructs, the outcomes of cus-
tomer orientation meet this criterion (as well as the remain-
ing constructs). In addition, the fit of the confirmatory
factor analysis model containing all constructs is satisfac-
tory (c2 /d.f. = 1.58, comparative fit index = .94, and rootmean square error of approximation = .07).
Results
Results Related to Main Effects
We employed structural equation modeling (SEM) to test
our hypothesized main effects (H1–H6) using Mplus 4.2
(Muthén and Muthén 2006). To keep the number of parame-
ters in the model at a manageable level while preserving the
multifaceted nature of the customer orientation construct,
we measured it through item parcels (Bagozzi and Edwards
1998); that is, the averages of the items for each dimension
serve as five indicators of customer orientation in sales
encounters.
To analyze the potential nonlinear, inverted U-shaped
effect of a salesperson’s customer orientation on sales per-
formance (H1), we included the square of customer orienta-
tion (x1 × x1) in our model. Using the unconstrained model
specification that Marsh, Wen, and Hau (2006) propose, to
measure the quadratic term, we squared the five indicators
of customer orientation. We mean-centered all indicators
before creating the product indicators to enable model con-
vergence (e.g., Lee, Song, and Poon 2004), while facilitat-
ing the interpretation of the path coefficients (e.g., Cohen et
al. 2003) without altering the form of the relationship
(Echambadi and Hess 2007). With mean-centered data, thelinear coefficient captures the relationship between cus-
tomer orientation and the dependent variables at the mean
level of customer orientation.
As in regression, H1 is supported if g 41 ¥ 1 linking the
latent quadratic term x1 ¥ x1 to sales performance (h4) is
statistically significant and negative, indicating a curvilinear,
inverted U-shaped effect. We also link the quadratic term to
customer attitudes. Here, nonsignificant path coefficients
can be viewed as support that (as we predicted in H2 and
64 / Journal of Marketing, March 2011
H3) the relationship between these constructs is indeed con-
tinuously positive (Cohen et al. 2003).
With regard to model fit, the ratio of chi-square value to
degrees of freedom (1.69) indicates good fit (Kline 2004),
the comparative fit index (.90) suggests acceptable fit
(Bentler and Bonett 1980; Kline 2004), and the root mean
square error of approximation (.07) is a sign of reasonable
fit (Browne and Cudeck 1993). Overall, the model fits the
data satisfactorily. Figure 3 shows the parameter estimates.
Consistent with H1, the quadratic term of customer ori-
entation has a negative impact on sales performance (g 41 ¥ 1 =–.28, p < .05), while the effect of the linear term is positive
(g 41 = .21, p < .05). Thus, the overall effect is nonlinear in
the shape of an inverted U, and there is an optimum level of
salesperson customer orientation. The positive coefficient
of the linear term implies that at the average level of cus-
tomer orientation, its effect is still positive.
We also find empirical support for H2 and H3. More
specifically, the linear term of customer orientation has a
positive impact on a customer’s attitude toward the sales-
person (g 11 = .24, p < .01) and a customer’s attitude toward
a supplier’s products (g 21 = .26, p < .01). At the same time,
the effects of the quadratic term of customer orientation on
customer attitudes are not significant (g 11 ¥ 1 = –.10, p > .10;g 21 ¥ 1 = –.02, p > .10). Thus, a salesperson’s customer ori-
entation in sales encounters has a continuously positive
effect on customer attitudes.
Consistent with H4, H5, and H6, a customer’s attitude
toward the salesperson (b31 = .22, p < .01) and a customer’s
attitude toward a supplier’s products (b32 = .45, p < .01)
influence customer satisfaction. In turn, this positively
affects sales performance (b43 = .24, p < .01).
Results Related to Moderating Effects
H7–H10 predict that contextual variables influence the opti-
mum level of salesperson customer orientation. To test
these hypotheses, we rely on multigroup regression. First,we determined the optimum level of customer orientation
across the entire sample. In line with the matching struc-
tural equation in the SEM model (see Figure 3), we
regressed sales performance (SPERF) on the linear (CO)
and quadratic (CO2) terms of a salesperson’s customer ori-
entation, on customer satisfaction (CS), and on sales experi-
ence (EXP):
(1) SPERF = a + b1 ¥ CO + b2 ¥ (CO)2 + b3 ¥ CS
+ b4 ¥ EXP + e.
Using ordinary least squares estimates for this model,
we can compute the optimum level of salesperson customer
orientation in sales encounters (COopt) based on the firstderivation of the regression equation as [bl /(–2 ¥ b2) =
(.26/(–2 ¥ –.35) = .37]. These values are based on the mean-
centered variables; a transformation back to the original
scale from 1 to 7 results in an optimum level COopt = 6.20.
On the basis of median splits, for each moderator we
created subsamples with low values and high values of the
moderator. For every moderator, we then estimated the
model from Equation 1 in both subsamples. It was then pos-
sible to compare the optimal levels of customer orientation

8/2/2019 Customer the King
http://slidepdf.com/reader/full/customer-the-king 11/21
for low and high levels of the contextual variable. Table 4
presents the results.
Table 4 shows that for each moderator, optimum levels
of customer orientation differ strongly between groups. To
test whether these differences are statistically significant, we
first used a Chow test to test the null hypothesis H0: Blow =
Bhigh
(i.e., the equality of the vector of regression coeffi-cients Blow in the group with low values of the contextual
variable and the corresponding vector of the high-values
group Bhigh). As Table 4 shows, the Chow F-statistic is
highly significant for all moderators. Thus, regression coef-
Optimum Level of Salesperson Customer Orientation / 65
ficients differ significantly between subgroups, which indi-
cates that the optimum levels of customer orientation differ
as well.
Second, using a Wald test (Muthén and Muthén 2006),
we tested more specific constraints; that is, we forced the
optimum level COoptlow of salesperson customer orientation
in the low-values group of the moderator to be equal to theoptimum level COopt
high in the high-values group (H0:
COoptlow = COopt
high). Table 4 shows the resulting chi-
square test statistics. They are significant for all contextual
variables, except product importance. In summary, these
Customerorientation (SP)
x1(linear term)
Attitude towardsalesperson (C)
h1
Quality ofservices and
processes (C)x3
Salespersonexperience (SP)
x2
(SP) Salesperson data(C) Customer data
Customersatisfaction (C)
h3
Salesperformance (SP)
h4
Attitude towardproducts (C)
h2
Customerorientation (SP)
x1 ¥ x1(quadratic term)
FIGURE 3
Results of Model Estimation
*p < .05.**p < .01.Notes: Completely standardized coefficients are shown. n.s. = not significant. The continuous lines indicate the effects of the major variables,
and the dotted lines indicate the effects of control variables used in the model.
g 41 = .21*
g 13 = .46**
g 23 = .40**
g 11 = .24** g 42 = .31**
g 41¥1 = –.28*
g 2 1
= . 2
6 * *
g 1 1
¥ 1
= –
. 1 0 n
. s .
g 21¥1 = –.02n.s.
g 33 = .37** b43 = .24**
b 3 2 =
. 4 5 *
*
b 3 1 = .2 2 *
*
TABLE 4Impact of Moderator Variables on the Optimum Level of a Salesperson’s Customer Orientation in
Sales Encounters
Moderator Variables
Product Product Supplier’s Price Competitive
Importance Individuality Positioning Intensity
Parameters Low High Low High Low High Low High
Optimum level of a .25 1.25 .13 2.52 .18 1.63 .22 1.99
salesperson’s customer
orientation in sales
encountersa
Chow statistic 3.42 4.91 4.47 3.47p -value .01 .00 .00 .01Wald statistic 2.13 6.59 5.95 4.13p -value .14 .01 .01 .04
aBased on unstandardized coefficients for mean-centered variables.
8/2/2019 Customer the King
http://slidepdf.com/reader/full/customer-the-king 12/21
analyses provide strong empirical support for H8, H9, and
H10, while H7 is only partially supported.
Robustness Checks
Nested data. The data in this study are hierarchical in
nature. Salespeople (the unit of analysis) are nested in sales
units (represented by the 56 sales managers), which are nested
in business units, which are nested in firms. Ignoring these
dependencies may result in misleading statistical conclusions.
Therefore, we also tested H1 using the following model:
(2)SPERFijk l = a jk l + b1jk lCO + b2jk lCO2 + b3jk lCS + b4jk lEXP.
This model takes the sample structure explicitly into
account. Here, the sales performance (SPERF) of sales-
person i in sales unit j, business unit k, and firm l is
explained through customer orientation (CO), the square of
customer orientation (CO2), customer satisfaction (CS), and
salesperson experience (EXP). As the subscripts indicate,
this model is specified as a random coefficient model (i.e.,
we allow the parameters to vary across all subgroups in the
sample). Hierarchical linear modeling results regarding the
average effects provide additional support for H1 because
they replicate the SEM results (b1jk l = .16, p < .05; b2jk l =
–.37, p < .05). In addition, in random coefficient models,parameters are estimated for every subgroup. Consistent
with H1, in all firms, business units, or sales units studied,
the resulting regression coefficients show that the relation-
ship between customer orientation and sales performance
takes an inverted U shape.
Common method bias. We measure both customer ori-
entation and sales performance using salesperson self-
reports. Thus, CMV may bias the findings regarding H1
(Podsakoff et al. 2003). Although this risk is reduced
because H1 is nonlinear, which implies that the relationship
between both constructs has a different form in different
subgroups of the sample, we conducted three tests to rule
out the possibility of common method bias.
First, we employed a Harman single factor test (Pod-
sakoff et al. 2003) to determine whether a single factor
would account for a large part of the variance of all mani-
fest variables based on salesperson self-reports. The single
factor model yielded a chi-square of 226.1 (d.f. = 27), and a
model in which we specified all relevant constructs individ-
ually leads to a significant improvement in fit (Dc2(d.f. = 2)
= 171.8, p < .01). This suggests that CMV is not a serious
threat.
Second, we included a common method factor in the
structural model used to test H1. It loads on all items based
on salesperson self-reports and thus controls for CMV in
hypothesis testing. To achieve model convergence (Rind-fleisch et al. 2008), we specified all loadings of the method
factor as being of the same size, reflecting the assumption
that CMV affects all items equally. In addition, we specified
the method factor as being uncorrelated with other con-
structs, reflecting the assumption that the degree of CMV is
independent of the true magnitude of customer orientation
and/or sales performance. The results regarding H1 are sta-
ble after we include the method factor, which also suggests
that CMV does not bias the results.
66 / Journal of Marketing, March 2011
Third, we replicated the nonlinear effect of customer
orientation using managerial performance information at
the sales unit level. We regressed unit sales (reported by the
managers) on the average customer orientation in the sales
unit. Again, consistent with H1, the square of customer ori-
entation negatively affects sales (g 41 ¥ 1 = –.320). The effect
is only significant at the 10% level, but this seems accept-
able given the small sample. Thus, H1 is supported using
data from multiple sources, again suggesting that CMV is
not a major threat.
Additional Analyses of Costs and Benefits of Customer Orientation in Sales Encounters
The argument behind our focal nonlinear hypothesis (H1) is
based on two key propositions. First, the benefits of increas-
ing customer orientation follow the principle of diminishing
returns, and second, increasing customer orientation is
costly. The preceding sections tested the general implication
of these ideas, that is, the existence of an inverted U-shaped
relationship between customer orientation and sales perfor-
mance. This section more closely examines some data regard-
ing these two propositions. However, the analyses we describe
here can only be considered tentative because we designed
the empirical study with the model in Figure 3 in mind.
Diminishing benefits of customer orientation in sales
encounters. Table 5 shows the results from a nonlinear mul-
tilevel regression analysis that we designed to test whether
the principle of diminishing returns applies to the benefits
of customer orientation. We analyzed three models in which
the square root of customer orientation (reflecting diminish-
ing returns) acted as an antecedent to customer intentions to
buy more, customer price insensitivity, and customer posi-
tive word of mouth. In all models, we specified customers
as being nested in salespeople (using hierarchical linear
modeling) and included several control variables pertaining
to relationship characteristics.
The square root of customer orientation is linked to allthree outcomes, though the effect on intentions to buy more
is only significant at the 10% level. In addition, Akaike
information criterion and Bayesian information criterion
both indicate that the nonlinear model is a better approxi-
mation to the data than its linear equivalent in all three
cases. Thus, these results confirm the idea that with increas-
ing levels of salesperson customer orientation, the incre-
mental benefits of further increases become smaller.
Costs of customer orientation in sales encounters. To
examine the possible costs of customer orientation, we used
data on the customer structure and time use of the partici-
pating salespeople. Table 6 lists the mean vales of these
variables for five salesperson groups, which we createdthrough a quintile split along the values of the customer ori-
entation construct.
Coincidentally, the mean customer orientation of Group
4 equals almost exactly the optimum level of customer ori-
entation we derived previously. Thus, Group 5 with even
higher values represents salespeople who are too customer
oriented according to our results. As we argued in the rea-
soning behind H1, to maintain a very high level of customer
orientation, salespeople must spend more time with the cus-

8/2/2019 Customer the King
http://slidepdf.com/reader/full/customer-the-king 13/21
tomers they serve, which requires them to serve fewer cus-
tomers in total. In line with this reasoning, the salespeople
in Group 5 serve the fewest customers in terms of absolute
number of customers and rank fourth in terms of the relative
number of customers. At the same time, these salespeople
have more purely informative customer interactions (i.e.,
without any sales element) than any other group. Thus, Table
6 provides some evidence that very high levels of customer
orientation may be too costly in terms of how salespeople
allocate their time within and across customer relationships.
DiscussionCustomer-oriented salesperson behaviors are important for
building lasting buyer–seller relationships. At the same
time, implementing a customer orientation requires time
Optimum Level of Salesperson Customer Orientation / 67
and increases complexity for the selling organization. Taken
together with the lack of evidence in support of a positive
effect of customer orientation on salesperson performance
(Franke and Park 2006), the question arises whether an
optimal level of customer orientation exists and what fac-
tors determine its magnitude. Using survey data from 195
salespeople, 56 sales managers, and more than 500 cus-
tomers, this study addresses this issue. It has implications
for researchers and managers.
Research Issues
First, in his review of the salesperson customer orientation
literature, Schwepker (2003, p. 166) concludes that “research
is needed to fully uncover the dimensions underlying cus-
tomer-oriented selling.” This study addresses this issue by
TABLE 5Results of Multilevel Regression to Assess Diminishing Returns of Salesperson Customer Orientation in
Sales Encounters
Dependent Variables (Customer Data)
Independent Intention to Price PositiveVariables Buy Morea Insensitivityb WOMc
Customer Orientation (Salesperson Data)Square root of customer orientation 1.01* .60** 1.53**
Control Variable (Salesperson Data)Salesperson experience –.00 –.00 .02
Control Variables (Customer Data)Costs of changing the supplier d .08*** .00 .11***Size of customer firme –.05 –.09*** –.10**Number of alternative suppliers .27** –.07* .09Length of firm relationship with supplier –.00 –.00* –.01Length of respondent relationship with salesperson .00 .01 .07**
*p ≤ .10.**p ≤ .05.***p ≤ .01.aMeasured through two Likert-scaled items (a = .75) asking customers to state their plans to expand the business relationship with the supplier.bMeasured through a single item (five-point scale) asking customers to state how much lower competitor prices would need to be (in percent-age of the current price of the supplier) to make them change the supplier.cMeasured through two Likert-scaled items (a = .83) referring to positive word-of-mouth (WOM) behavior.d
Measured through four Likert-scaled items (a = .65) referring to four different aspects of costs for changing the supplier (contractual obliga-tions, individualized products, specific investments, and costs for ending the relationship).eMeasured with closed-ended question (12-point scale) asking for the revenues of the customer firm.Notes: Unstandardized coefficients are shown.
TABLE 6Descriptive Analysis of Costs of Salesperson Customer Orientation in Sales Encounters
Salesperson Customer Orientation in Sales Encounters
Lowest Low High Optimal Too High
Variable (n = 38) (n = 39) (n = 38) (n = 40) (n = 38)
Customer orientation 5.13 5.64 5.90 6.21 6.68Sales performance 4.67 4.86 5.05 5.36 5.21Number of customers serveda 104 86 117 111 67Number of customers served/
sales unit averageb .91 .95 1.03 1.16 .95Percentage of purely informative
customer interactionsa 50.45 50.52 47.83 49.95 54.81Percentage of customer
interactions with sales elementsa 49.55 49.48 52.13 50.05 45.19
aMeasured with open-ended question.bAverage number of customers served calculated from responses from all participating salespeople in a sales unit.

8/2/2019 Customer the King
http://slidepdf.com/reader/full/customer-the-king 14/21
acknowledging the multidimensional nature of the construct
(Stock and Hoyer 2005). We conceptualize salesperson cus-
tomer orientation with five dimensions, each corresponding
to behaviors in one of the five stages of a sales encounter.
It is worth noting that this conceptualization explicitly
refers to salesperson conflict management behaviors (e.g.,
collaborative handling of disagreements). Thus, this study
provides evidence that salesperson customer orientation
cannot be reduced to being “simply a sales presentation
approach,” which previous scales have implied (Schwepker
2003, p. 165). At the same time, our construct does not com-prise behaviors that aim to establish a personal relationship
with the customer, such as getting to know a customer per-
sonally (Donavan, Brown, and Mowen 2004). Thus, further
research could analyze whether our more functional under-
standing of customer orientation and our results are related
to these purely relational aspects of customer orientation.
Second, this study explicitly takes a nonlinear perspec-
tive on studying performance outcomes of customer orien-
tation. In particular, we find a curvilinear, inverted U-
shaped relationship between both constructs. Thus, we
provide evidence that there is an optimum level of customer
orientation in sales encounters with regard to sales perfor-
mance. Although some scholars might find this result to beconsistent with their intuition, it severely contradicts schol-
arly and managerial practice. For example, to the best of
our knowledge, none of the studies Franke and Park (2006)
use in their comprehensive meta-analysis on outcomes of
salesperson customer orientation test nonlinear effects.
However, it is not just the salesperson customer orientation
literature that limits itself to “the-more-the-better” perspec-
tive. For example, we also find this approach in recent studies
on relational selling (e.g., Palmatier, Scheer, and Steenkamp
2007; Yim, Tse, and Chan 2008). According to our study, it
is advisable that researchers in these fields routinely con-
sider nonlinear relationships between key phenomena.
Against this backdrop, we emphasize that in this study, wedo not address why salespeople exhibit higher-than-optimal
levels of customer orientation. Perhaps salespeople under-
estimate the costs of customer orientation (Franke and Park
2006), or they experience difficulties in identifying the
appropriate time horizon in a business relationship (e.g.,
Ganesan 1994) and thus focus too much on securing long-
term outcomes. Finally, another possible reason could be an
exaggerated commitment to the customer (e.g., Siders,
George, and Dharwadkar 2001), perhaps because of a per-
sonal friendship between the customer and the salesperson
(Grayson 2007; Heide and Wathne 2006). Additional
research could examine this issue more closely. For example,
it would be important to better understand how salesperson
commitment to specific customers influences decisions in
the selling process (e.g., regarding price concessions).
Third, there is some discussion in the sales literature
whether financial sales performance is the best performance
measure in relational selling contexts. Scholars have argued
that financial sales performance might not adequately
account for more long-term customer reactions (e.g.,
Hunter and Perrault 2007). At the same time, firms adopting
a customer-focused sales campaign still refer to the bottom
line to judge the results (e.g., Kumar, Venkatesan, and
68 / Journal of Marketing, March 2011
Reinartz 2008). Therefore, in this study, we consider two
outcomes simultaneously: financial sales performance and
customer attitudes. The results show that customer orienta-
tion affects these outcomes differently. That is, it has a non-
linear effect on sales performance, while the effect on cus-
tomer attitudes is continuously positive. This also provides
an integrating explanation to the mixed findings of previous
research, in which customer orientation is consistently
found to affect customer attitudes (e.g., Brady and Cronin
2001; Goff et al. 1997), and (linear) effects on sales perfor-
mance are small at best (Franke and Park 2006).Fourth, this study responds to calls to identify the influ-
ence of moderator variables on the effectiveness of sales-
person customer orientation (Franke and Park 2006). The
optimum level of customer orientation in sales encounters is
substantially higher with individualized products, in
competitive environments, and for supplier firms that have
adopted a premium price strategy.
These findings allow for an integration of diverging
findings on salesperson customer orientation. For example,
the effect of product individuality explains why Howe,
Hoffman, and Hardigree (1994) do not find an effect of
salesperson customer orientation on performance in insur-
ance companies, but in a real estate context, McIntyre et al.(2000) do.
Managerial Implications
As a first important managerial implication of this study, we
urge practitioners to reconsider the link between sales-
person customer orientation and sales performance. In par-
ticular, while in this era of relational selling many sales-
people ask themselves, “How right should the customer
be?” they often only get an answer of the type, “The cus-
tomer is always right.” As Price (2009) recently observed,
“Perhaps the most often stated value of corporate leaders is
some variant of ‘We put customers first.’” Consider also the
advice in Marketing Week (Choueke 2009, p. 3) to “Put thecustomer first, then success will follow” or the recommen-
dation of former Orange chief executive officer Hans Snook
to “make sure that everybody in the company understands
the customer is king” (Tomkins 2005, p. 13). We find that
this widely held belief is only partially true because there is
an optimum level with regard to customer-oriented behav-
iors in sales encounters. Thus, there are times when the cus-
tomer should not be king.
This finding is especially important in the ongoing eco-
nomic crisis, in which many sales managers are searching
for ways to reduce costs while maintaining performance.
Here, reducing the customer orientation of salespeople who
are “too customer oriented” promises to be a viable strategy.
In this context, it is worth emphasizing that the number of
salespeople with customer orientation levels beyond the
optimum may be quite high. For example, in our sample,
approximately 30% of the salespeople exhibit customer ori-
entation levels higher than the optimum of 6.20.
It is necessary to point out that reducing salesperson
customer orientation is not a straightforward endeavor
(Homburg, Droll, and Totzek 2008). In particular, as cus-
tomers exhibit loss aversion, negative reactions to decreases
in perceived service levels are likely to be stronger than the
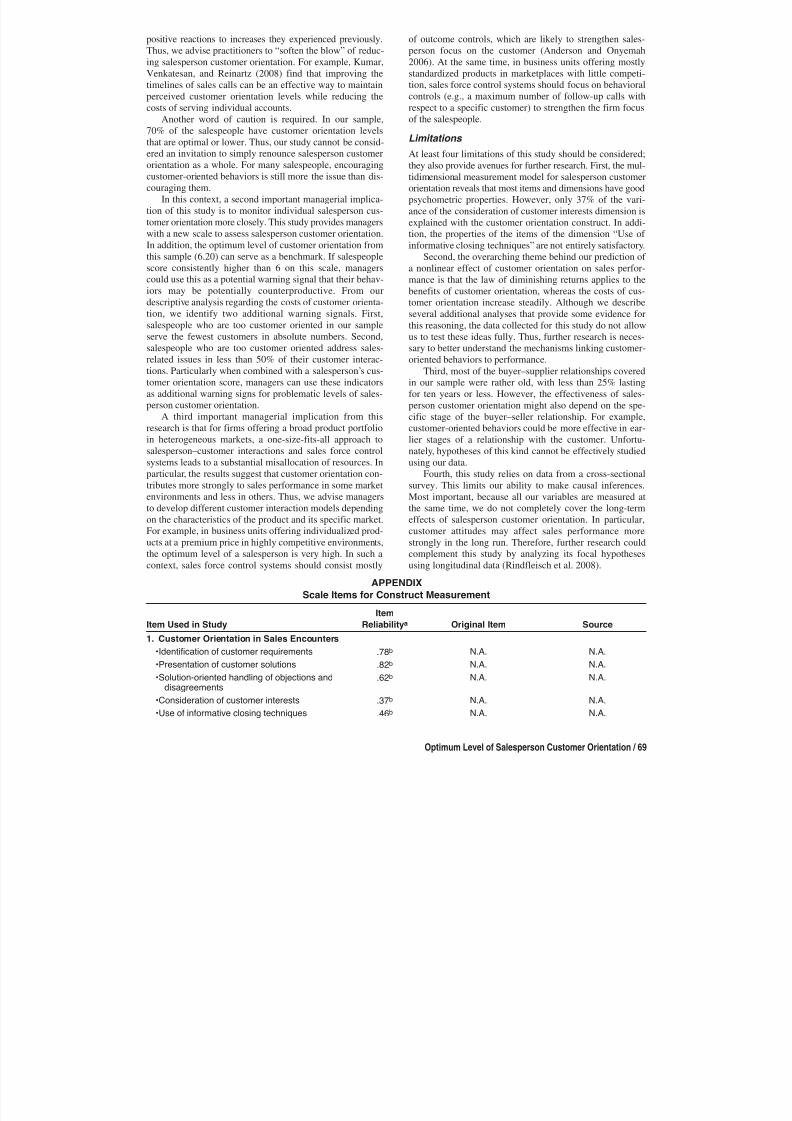
8/2/2019 Customer the King
http://slidepdf.com/reader/full/customer-the-king 15/21
positive reactions to increases they experienced previously.
Thus, we advise practitioners to “soften the blow” of reduc-
ing salesperson customer orientation. For example, Kumar,
Venkatesan, and Reinartz (2008) find that improving the
timelines of sales calls can be an effective way to maintain
perceived customer orientation levels while reducing the
costs of serving individual accounts.
Another word of caution is required. In our sample,
70% of the salespeople have customer orientation levels
that are optimal or lower. Thus, our study cannot be consid-
ered an invitation to simply renounce salesperson customerorientation as a whole. For many salespeople, encouraging
customer-oriented behaviors is still more the issue than dis-
couraging them.
In this context, a second important managerial implica-
tion of this study is to monitor individual salesperson cus-
tomer orientation more closely. This study provides managers
with a new scale to assess salesperson customer orientation.
In addition, the optimum level of customer orientation from
this sample (6.20) can serve as a benchmark. If salespeople
score consistently higher than 6 on this scale, managers
could use this as a potential warning signal that their behav-
iors may be potentially counterproductive. From our
descriptive analysis regarding the costs of customer orienta-tion, we identify two additional warning signals. First,
salespeople who are too customer oriented in our sample
serve the fewest customers in absolute numbers. Second,
salespeople who are too customer oriented address sales-
related issues in less than 50% of their customer interac-
tions. Particularly when combined with a salesperson’s cus-
tomer orientation score, managers can use these indicators
as additional warning signs for problematic levels of sales-
person customer orientation.
A third important managerial implication from this
research is that for firms offering a broad product portfolio
in heterogeneous markets, a one-size-fits-all approach to
salesperson–customer interactions and sales force controlsystems leads to a substantial misallocation of resources. In
particular, the results suggest that customer orientation con-
tributes more strongly to sales performance in some market
environments and less in others. Thus, we advise managers
to develop different customer interaction models depending
on the characteristics of the product and its specific market.
For example, in business units offering individualized prod-
ucts at a premium price in highly competitive environments,
the optimum level of a salesperson is very high. In such a
context, sales force control systems should consist mostly
Optimum Level of Salesperson Customer Orientation / 69
of outcome controls, which are likely to strengthen sales-
person focus on the customer (Anderson and Onyemah
2006). At the same time, in business units offering mostly
standardized products in marketplaces with little competi-
tion, sales force control systems should focus on behavioral
controls (e.g., a maximum number of follow-up calls with
respect to a specific customer) to strengthen the firm focus
of the salespeople.
Limitations
At least four limitations of this study should be considered;they also provide avenues for further research. First, the mul-
tidimensional measurement model for salesperson customer
orientation reveals that most items and dimensions have good
psychometric properties. However, only 37% of the vari-
ance of the consideration of customer interests dimension is
explained with the customer orientation construct. In addi-
tion, the properties of the items of the dimension “Use of
informative closing techniques” are not entirely satisfactory.
Second, the overarching theme behind our prediction of
a nonlinear effect of customer orientation on sales perfor-
mance is that the law of diminishing returns applies to the
benefits of customer orientation, whereas the costs of cus-
tomer orientation increase steadily. Although we describeseveral additional analyses that provide some evidence for
this reasoning, the data collected for this study do not allow
us to test these ideas fully. Thus, further research is neces-
sary to better understand the mechanisms linking customer-
oriented behaviors to performance.
Third, most of the buyer–supplier relationships covered
in our sample were rather old, with less than 25% lasting
for ten years or less. However, the effectiveness of sales-
person customer orientation might also depend on the spe-
cific stage of the buyer–seller relationship. For example,
customer-oriented behaviors could be more effective in ear-
lier stages of a relationship with the customer. Unfortu-
nately, hypotheses of this kind cannot be effectively studiedusing our data.
Fourth, this study relies on data from a cross-sectional
survey. This limits our ability to make causal inferences.
Most important, because all our variables are measured at
the same time, we do not completely cover the long-term
effects of salesperson customer orientation. In particular,
customer attitudes may affect sales performance more
strongly in the long run. Therefore, further research could
complement this study by analyzing its focal hypotheses
using longitudinal data (Rindfleisch et al. 2008).
Item Used in Study
Item
Reliabilitya Original Item Source
1. Customer Orientation in Sales Encounters
•Identification of customer requirements .78b N.A. N.A.
•Presentation of customer solutions .82b N.A. N.A.
•Solution-oriented handling of objections anddisagreements
.62b N.A. N.A.
•Consideration of customer interests .37b N.A. N.A.
•Use of informative closing techniques .46b N.A. N.A.
APPENDIX
Scale Items for Construct Measurement
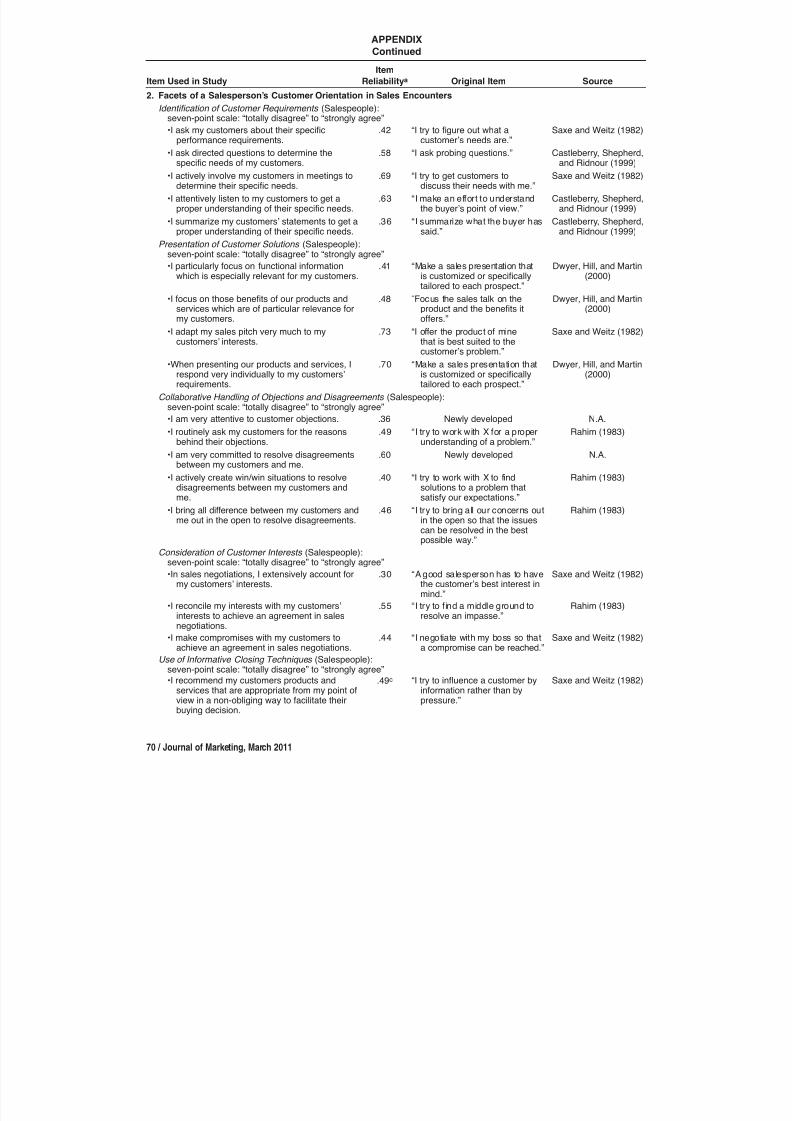
8/2/2019 Customer the King
http://slidepdf.com/reader/full/customer-the-king 16/21
70 / Journal of Marketing, March 2011
Item Used in Study
Item
Reliabilitya Original Item Source
2. Facets of a Salesperson’s Customer Orientation in Sales Encounters
Identification of Customer Requirements (Salespeople):seven-point scale: “totally disagree” to “strongly agree”
•I ask my customers about their specificperformance requirements.
.42 “I try to figure out what acustomer’s needs are.”
Saxe and Weitz (1982)
•I ask directed questions to determine thespecific needs of my customers.
.58 “I ask probing questions.” Castleberry, Shepherd,and Ridnour (1999)
•I actively involve my customers in meetings todetermine their specific needs.
.69 “I try to get customers todiscuss their needs with me.”
Saxe and Weitz (1982)
•I attentively listen to my customers to get aproper understanding of their specific needs.
.63 “I make an effort to understandthe buyer’s point of view.”
Castleberry, Shepherd,and Ridnour (1999)
•I summarize my customers’ statements to get aproper understanding of their specific needs.
.36 “I summarize what the buyer hassaid.”
Castleberry, Shepherd,and Ridnour (1999)
Presentation of Customer Solutions (Salespeople):seven-point scale: “totally disagree” to “strongly agree”
•I particularly focus on functional informationwhich is especially relevant for my customers.
.41 “Make a sales presentation thatis customized or specificallytailored to each prospect.”
Dwyer, Hill, and Martin(2000)
•I focus on those benefits of our products andservices which are of particular relevance formy customers.
.48 “Focus the sales talk on theproduct and the benefits itoffers.”
Dwyer, Hill, and Martin(2000)
•I adapt my sales pitch very much to mycustomers’ interests.
.73 “I offer the product of minethat is best suited to thecustomer’s problem.”
Saxe and Weitz (1982)
•When presenting our products and services, Irespond very individually to my customers’requirements.
.70 “Make a sales presentation thatis customized or specificallytailored to each prospect.”
Dwyer, Hill, and Martin(2000)
Collaborative Handling of Objections and Disagreements (Salespeople):seven-point scale: “totally disagree” to “strongly agree”
•I am very attentive to customer objections. .36 Newly developed N.A.
•I routinely ask my customers for the reasonsbehind their objections.
.49 “I try to work with X for a properunderstanding of a problem.”
Rahim (1983)
•I am very committed to resolve disagreementsbetween my customers and me.
.60 Newly developed N.A.
•I actively create win/win situations to resolvedisagreements between my customers andme.
.40 “I try to work with X to findsolutions to a problem thatsatisfy our expectations.”
Rahim (1983)
•I bring all difference between my customers andme out in the open to resolve disagreements.
.46 “I try to bring all our concerns outin the open so that the issuescan be resolved in the bestpossible way.”
Rahim (1983)
APPENDIX
Continued
Consideration of Customer Interests (Salespeople):seven-point scale: “totally disagree” to “strongly agree”
•In sales negotiations, I extensively account formy customers’ interests.
.30 “A good salesperson has to havethe customer’s best interest inmind.”
Saxe and Weitz (1982)
•I reconcile my interests with my customers’interests to achieve an agreement in salesnegotiations.
.55 “I try to f ind a middle ground toresolve an impasse.”
Rahim (1983)
•I make compromises with my customers toachieve an agreement in sales negotiations.
.44 “I negotiate with my boss so thata compromise can be reached.”
Saxe and Weitz (1982)
Use of Informative Closing Techniques (Salespeople):seven-point scale: “totally disagree” to “strongly agree”
•I recommend my customers products andservices that are appropriate from my point ofview in a non-obliging way to facilitate theirbuying decision.
.49c “I try to influence a customer byinformation rather than bypressure.”
Saxe and Weitz (1982)

8/2/2019 Customer the King
http://slidepdf.com/reader/full/customer-the-king 17/21
Optimum Level of Salesperson Customer Orientation / 71
Item Used in Study
Item
Reliabilitya Original Item Source
•I summarize for my customers the majorbenefits of our offer in a non-obliging way tofacilitate their buying decision.
.36c “I try to influence a customer byinformation rather than bypressure.”
Saxe and Weitz (1982)
3. Outcomes of Salespeople’s Customer Orientation
Salesperson Performance (Salespeople):
seven-point scale: “much worse” to “much better”How do you evaluate your sales performance in comparison with your colleagues, based …
•on the achieved sales in the last 12 months? .79 “Compared with other salespeopleworking for your company, howwould you evaluate your over-all performance?”
Oliver and Anderson(1994)•on the achieved orders in the last 12 months? .80
•on the achieved total contribution margin inthe last 12 months?
.55
Customer’s Attitude Toward the Salesperson (Customers):seven-point scale: “totally disagree” to “strongly agree”
•I consider my account manager at company Xto be very customer-oriented.
.60 “In general, I am pretty satisfiedwith my dealings with thissalesperson.”
Ramsey and Sohi(1997)
•Overall, I have a very positive opinion about myaccount manager at company X.
.96 Newly developed N.A.
•Overall, I am very satisfied with my account
manager at company X.
.88 “I am satisfied with the level of
service this salesperson hasprovided.”
Ramsey and Sohi
(1997)
Customer’s Attitude Toward a Supplier’s Products (Customers):seven-point scale: “totally disagree” to “strongly agree”
•The products and services of company X are ofhigh quality.
.69 “This is a high quality product.” Miyazaki, Grewal andGoodstein (2005)
•The products and services of company Xextensively meet our requirements.
.81 Newly developed N.A.
•Compared to other suppliers, the products andservices of company X are very good.
.50 “The quality of this product isvery good.”
Miyazaki, Grewal andGoodstein (2005)
Customer Satisfaction (Customers):seven-point scale: “totally disagree” to “strongly agree”
•We are very pleased with the products andservices of company X
.61 “We are very pleased with theproducts and services ofcompany X.”
Homburg and Stock(2004)
•We intensively enjoy collaborating withcompany X.
.76 “We enjoy collaborating with thiscompany.”
Homburg and Stock(2004)
•On an overall basis, our experience withcompany X has been very positive.
.85 “On an overall basis, ourexperience with company Xhas been very positive.”
Homburg and Stock(2004)
•On an overall basis, we are very satisfied withcompany X.
.92 “On an overall basis, we aresatisfied with this company.”
Homburg and Stock(2004)
APPENDIX
Continued
Anderson, Eugene W. (1998), “Customer Satisfaction and Word of Mouth,” Journal of Service Research, 1 (1), 5–17.
Anderson, James C. (1987), “An Approach for Confirmatory Mea-surement and Structural Equation Modeling of OrganizationalProperties,” Management Science, 33 (4), 525–41.
Appiah-Adu, Kwaku and Satyendra Singh (1998), “Customer Ori-entation and Performance: A Study of SMEs,” Management
Decision, 36 (6), 385–94.
REFERENCESAhearne, Michael, John Mathieu, and Adam Rapp (2005), “To
Empower or Not to Empower Your Sales Force? An Empirical
Examination of the Influence of Leadership Empowerment
Behavior on Customer Satisfaction and Performance,” Journal
of Applied Psychology, 90 (5), 945–55.
Anderson, Erin and Vincent Onyemah (2006), “How Right Should
the Customer Be?” Harvard Business Review, 84 (7–8), 59–67.
aSquared factor loading: indicating the percentage of item variance explained through the underlying construct.bPercentage of dimension variance explained through the customer orientation construct in a second-order confirmatory factor analysis.cItem reliabilities from model with two factors: consideration of customer interests and use of informative closing techniques.dItem reliabilities from model with two factors: product individuality and product importance.eConstruct measured through a single indicator; therefore, item reliability cannot be computed.fItem reliabilities from model with two factors: customer satisfaction and quality of services and business processes.
Notes: N.A. = not applicable.

8/2/2019 Customer the King
http://slidepdf.com/reader/full/customer-the-king 18/21
Bagozzi, Richard P. and Hans Baumgartner (1994), “The Evalua-
tion of Structural Equation Models and Hypotheses Testing,” in
Principles of Marketing Research, Richard P. Bagozzi, ed.
Cambridge, UK: Blackwell, 386–422.
——— and Jeffrey R. Edwards (1998), “A General Approach for
Representing Constructs in Organizational Research,” Organi-
zational Research Methods, 1 (1), 45–87.
Behrman, Douglas N. and William D. Perreault (1982), “Measur-
ing the Performance of Industrial Salespersons,” Journal of
Business Research, 10 (3), 355–70.
Bentler, Peter M. and Douglas G. Bonett (1980), “Significance
Tests and Goodness of Fit in the Analysis of Covariance Struc-tures,” Psychological Bulletin, 88 (3), 588–606.
Bergkvist, Lars and John R. Rossiter (2007), “The Predictive
Validity of Multiple-Item Versus Single-Item Measures of the
Same Constructs,” Journal of Marketing Research, 44 (May),
175–84.
Bettman, James R. (1973), “Perceived Risk and Its Components:
A Model and Empirical Test,” Journal of Marketing Research,
10 (May), 184–90.
Brady, Michael and Joseph J. Cronin (2001), “Customer Orienta-
tion: Effects on Customer Service Perceptions and Outcome
Behaviors,” Journal of Service Research, 3 (3), 241–51.
Brooksbank, Roger (1995), “The New Model of Personal Selling:
Micromarketing,” Journal of Personal Selling & Sales Man-
agement , 15 (2), 61–66.Brown, Reagan D. and Neil M.A. Hauenstein (2005), “Interrater
Agreement Reconsidered: An Alternative to the rwg Indices,”
Organizational Research Methods, 8 (2), 165–84.
Brown, Timothy (2006), Confirmatory Factor Analysis for Applied
Research. New York: Guilford Press.
Brown, Tom J., John C. Mowen, D. Todd Donavan, and Jane W.
Licata (2002), “The Customer Orientation of Service Workers:
Personality Trait Effects on Self- and Supervisor Performance
Ratings,” Journal of Marketing Research, 39 (February),
110–19.
Browne, Michael W. and Robert Cudeck (1993), “Alternative
Ways of Assessing Model Fit,” in Testing Structural Equation
Models, Kenneth A. Bollen and J.S. Long, eds. Newbury Park,
CA: Sage Publications, 136–62.
Cannon, Joseph P. and William D. Perreault (1999), “Buyer–SellerRelationships in Business Markets,” Journal of Marketing
Research, 36 (November), 439–60.
Castleberry, Stephen B., C. David Shepherd, and Rick Ridnour
(1999), “Effective Interpersonal Listening in the Personal Sell-
ing Environment: Conceptualization, Measurement, and
Nomological Validity,” Journal of Marketing Theory & Prac-
tice, 7 (1), 30–38.
Choueke, Mark (2009), “Put the Customer First, Then Success
Will Follow,” Marketing Week , (November 19), 3.
Cohen, Jacob, Patricia Cohen, Stephen G. West, and Leona S.
Aiken (2003), Applied Multiple Regression/Correlation Analy-
sis for the Behavioral Sciences. Mahwah, NJ: Lawrence Erl-
baum Associates.
Cronin, J. Joseph, Michael K. Brady, and G. Tomas M. Hult
(2000), “Assessing the Effects of Quality, Value, and Customer
Satisfaction on Consumer Behavioral Intentions in Service
Environments,” Journal of Retailing, 76 (2), 193–218.
Crosby, Lawrence A. and Nancy Stephens (1987), “Effects of
Relationship Marketing on Satisfaction, Retention, and Prices
in the Life Insurance Industry,” Journal of Marketing Research,
24 (November), 404–411.
Dean, Alison M. (2007), “The Impact of the Customer Orientation
of Call Center Employees on Customers’ Affective Commit-
ment and Loyalty,” Journal of Service Research, 10 (2),
161–73.
72 / Journal of Marketing, March 2011
Donavan, D. Todd, Tom J. Brown, and John C. Mowen (2004),“Internal Benefits of Service-Worker Customer Orientation:Job Satisfaction, Commitment, and Organizational CitizenshipBehaviors,” Journal of Marketing, 68 (January), 128–46.
Dowling, Grahame R. and Richard Staelin (1994), “A Model of Perceived Risk and Intended Risk-Handling Activity,” Journalof Consumer Research, 21 (1), 119–34.
Dwyer, Sean, John Hill, and Warren Martin (2000), “An EmpiricalInvestigation of Critical Success Factors in the Personal SellingProcess for Homogenous Goods,” Journal of Personal Selling& Sales Management , 20 (3), 151–59.
Echambadi, Raj and James D. Hess (2007), “Mean-CenteringDoes Not Alleviate Collinearity Problems in Moderated Multi-ple Regression Models,” Marketing Science, 26 (3), 438–45.
Fornell, Claes and David Larcker (1981), “Evaluating StructuralEquation Models with Unobservable Variables and Measure-ment Error,” Journal of Marketing Research, 18 (February),39–50.
Franke, George R. and Jeong-Eun Park (2006), “SalespersonAdaptive Selling Behavior and Customer Orientation,” Journalof Marketing Research, 43 (November), 693–702.
Franke, Nikolaus, Peter Keinz, and Christoph J. Steger (2009),“Testing the Value of Customization: When Do CustomersReally Prefer Products Tailored to Their Preferences?” Journalof Marketing, 73 (September), 103–121.
——— and Frank Piller (2004), “Value Creation by Toolkits for
User Innovation and Design: The Case of the Watch Market,” Journal of Product Innovation Management , 21 (6), 401–415.
Ganesan, Shankar (1994), “Determinants of Long-Term Orienta-tion in Buyer–Seller Relationships,” Journal of Marketing, 58(April), 1–19.
George, Jennifer M. (1991), “State or Trait: Effects of PositiveMood on Prosocial Behaviors at Work,” Journal of Applied Psychology, 76 (2), 299–307.
Gilmore, James H. and B. Joseph Pine II (1997), “The Four Facesof Mass Customization,” Harvard Business Review, 75 (1),91–101.
Goff, Brent G., James S. Boles, Danny N. Bellenger, and CarrieStojack (1997), “The Influence of Salesperson Behaviors onCustomer Satisfaction with Products,” Journal of Retailing, 73(2), 171–83.
Grayson, Kent (2007), “Friendship Versus Business in MarketingRelationships,” Journal of Marketing, 71 (October), 121–39.
Hartline, Michael D., James G. Maxham III, and Daryl O. McKee(2000), “Corridors of Influence in the Dissemination of Customer-Oriented Strategy to Customer Contact ServiceEmployees,” Journal of Marketing, 64 (April), 35–50.
Hawes, Jon M., James T. Strong, and Bernard S. Winick (1996),“Do Closing Techniques Diminish Prospect Trust?” Industrial
Marketing Management , 25 (5), 349–60.
Heide, Jan B. and Kenneth H. Wathne (2006), “Friends, Business-people, and Relationship Roles: A Conceptual Framework anda Research Agenda,” Journal of Marketing, 70 (July), 90–103.
Homburg, Christian, Mathias Droll, and Dirk Totzek (2008), “Cus-tomer Prioritization: Does It Pay Off, and How Should It BeImplemented?” Journal of Marketing, 72 (September), 110–30.
——— and Ruth-Maria Stock (2004), “The Link Between Sales-people’s Job Satisfaction and Customer Satisfaction in aBusiness-to-Business Context: A Dyadic Analysis,” Journal of the Academy of Marketing Science, 32 (2), 144–58.
———, Jan Wieseke, and Torsten Bornemann, (2009), “Imple-menting the Marketing Concept at the Employee–CustomerInterface: The Role of Customer Need Knowledge,” Journal of
Marketing, 73 (July), 64–81.
Howe, Vince, Douglas K. Hoffman, and Donald W. Hardigree(1994), “The Relationship Between Ethical and Customer-Oriented Service Provider Behaviors,” Journal of Business
Ethics, 13 (7), 497–506.

8/2/2019 Customer the King
http://slidepdf.com/reader/full/customer-the-king 19/21
Humphreys, Michael A. and Michael R. Williams (1996), “Explor-ing the Relative Effects of Salesperson Interpersonal ProcessAttributes and Technical Product Attributes on Customer Satis-faction,” Journal of Personal Selling & Sales Management , 16(Summer), 47–57.
Hunter, Gary K. and William D. Perreault (2007), “Making SalesTechnology Effective,” Journal of Marketing, 71 (January),16–34.
James, Lawrence R., Robert G. Demaree, and Gerrit Wolf (1984),“Estimating Within-Group Interrater Reliability With andWithout Response Bias,” Journal of Applied Psychology, 69
(1), 85–98.Jaworski, Bernard J. and Ajay K. Kohli (1993), “Market Orienta-
tion: Antecedents and Consequences,” Journal of Marketing,57 (July), 53–70.
Jobber, David and Geoff Lancaster (2006), Selling and Sales Man-
agement. Harlow, UK: Pearson Education Limited.Jones, Eli, Paul Busch, and Peter Dacin (2003), “Firm Market Ori-
entation and Salesperson Customer Orientation: Interpersonaland Intrapersonal Influences on Customer Service and Reten-tion in Business-to-Business Buyer-Seller Relationships,”
Journal of Business Research, 56 (4), 323–40.Joshi, Ashwin W. (2010), “Salesperson Influence on Product
Development: Insights from a Study of Small ManufacturingOrganizations,” Journal of Marketing, 74 (January), 94–107.
Keiningham, Timothy L., Tiffany Perkins Munn, and Heather
Evans (2003), “The Impact of Customer Satisfaction on Share-of-Wallet in a Business-to-Business Environment,” Journal of
Service Research, 6 (1), 37–50.Kline, Rex B. (2004), Principles and Practice of Structural Equa-
tion Modeling, 2d ed. New York: Guilford Press.Kohli, Ajay K. and Bernard J. Jaworski (1990), “Market Orienta-
tion: The Construct, Research Propositions, and ManagerialImplications,” Journal of Marketing, 54 (April), 1–18.
Kumar, V., Rajkumar Venkatesan, and Werner Reinartz (2008),“Performance Implications of Adopting a Customer-FocusedSales Campaign,” Journal of Marketing, 72 (September),50–68.
Lee, Sik-Yum, Xin-Yuan Song, and Wai-Tin Poon (2004), “Com-parison of Approaches in Estimating Interaction and QuadraticEffects of Latent Variables,” Multivariate Behavioral Research,
39 (4), 653–86.Levy, Michael and Arun Sharma (1994), “Adaptive Selling: The
Role of Gender, Age, Sales Experience, and Education,” Jour-
nal of Business Research, 31 (1), 39–47.Little, Todd D., Ulman Lindenberger, and John R. Nesselroade
(1999), “On Selecting Indicators for Multivariate Measurementand Modeling with Latent Variables: When ‘Good’ Indicatorsare Bad and ‘Bad’ Indicators are Good,” Psychological Meth-
ods, 4 (2), 192–211.MacKenzie, Scott B., Philip M. Podsakoff, and Richard Fetter
(1993), “The Impact of Organizational Citizenship Behavior onEvaluations of Salesperson Performance,” Journal of Market-
ing, 57 (1), 70–80.Malhotra, Naresh K. (1999), “Guest Editorial: The Past, Present,
and Future of the Marketing Discipline,” Journal of the Acad-
emy of Marketing Science, 27 (2), 116–19.Marsh, Herbert W., Zhonglin Wen, and Kit-Tai Hau (2006),
“Structural Equation Models of Latent Interaction and Qua-dratic Effects,” in Structural Equation Modeling: A Second
Course, G. Hancock and R.O. Mueller, eds. Greenwich, CT:Information Age Publishing Inc., 225–65.
McIntyre, Roger P., Reid P. Claxton, Kenneth Anselmi, andEdward W. Wheatley (2000), “Cognitive Style as anAntecedent to Adaptiveness, Customer Orientation, and Self-Perceived Selling Performance,” Journal of Business and Psy-
chology, 15 (2), 179–96.
Optimum Level of Salesperson Customer Orientation / 73
McQuiston, Daniel H. (1989), “Novelty, Complexity, and Impor-tance as Causal Determinants of Industrial Buyer Behavior,”
Journal of Marketing, 53 (April), 66–79.
Miyazaki, Anthony, Dhruv Grewal, and Ronald C. Goodstein(2005), “The Effect of Multiple Extrinsic Cues on Quality Per-ceptions: A Matter of Consistency,” Journal of Consumer
Research, 32 (2), 146–53.
Muthén, Linda K. and Bengt O. Muthén (2006), Mplus: Statistical
Analysis with Latent Variables: User’s Guide. Los Angeles:Muthén & Muthén.
Narver, John C. and Stanley F. Slater (1990), “The Effect of a
Market Orientation on Business Profitability,” Journal of Mar-keting, 54 (October), 20–35.
Niraj, Rakesh, Mahendra Gupta, and Chakravarthi Narasimhan(2001), “Customer Profitability in a Supply Chain,” Journal of
Marketing, 65 (July), 1–16.
Oliver, Richard L. and Erin Anderson (1994), “An Empirical Testof the Consequences of Behavior- and Outcome-Based SalesControl Systems,” Journal of Marketing, 58 (October), 53–67.
Palmatier, Robert W., Lisa K. Scheer, and Jan-Benedict E.M.Steenkamp (2007), “Customer Loyalty to Whom? Managingthe Benefits and Risks of Salesperson-Owned Loyalty,” Jour-
nal of Marketing Research, 44 (May), 185–99.
Pihlström, Minna and Gregory J. Brush (2008), “Comparing thePerceived Value of Information and Entertainment Mobile Ser-
vices,” Psychology & Marketing, 25 (8), 732–55.Podsakoff, Philip M., Scott B. MacKenzie, Jeong-Yeon Lee, andNathan Podsakoff (2003), “Common Method Biases in Behav-ioral Research: A Critical Review of the Literature and Recom-mended Remedies,” Journal of Applied Psychology, 88 (5),879–903.
Porter, Stephen S., Joshua L. Wiener, and Gary L. Frankwick (2003), “The Moderating Effect of Selling Situation on theAdaptive Selling Strategy: Selling Effectiveness Relationship,”
Journal of Business Research, 56 (4), 275–81.
Price, David A. (2009), “Business Bookshelf: Do as I Say and as IDo,” The Wall Street Journal (Eastern Edition), (September 2),A13.
Rahim, M. Afzalur (1983), “A Measure of Styles of HandlingInterpersonal Conflict,” Academy of Management Journal, 26
(2), 368–76.Ramsey, Rosemary P. and Ravipreet S. Sohi (1997), “Listening to
Your Customers: The Impact of Perceived Salesperson Listen-ing Behavior on Relationship Outcomes,” Journal of the Acad-
emy of Marketing Science, 25 (2), 127–37.
Rao, Akshay R. and Kent B. Monroe (1989), “The Effect of Price,Brand Name, and Store Name on Buyers’ Perceptions of Prod-uct Quality: An Integrative Review,” Journal of Marketing
Research, 26 (August), 351–57.
Reinartz, Werner, Jacquelyn S. Thomas, and V. Kumar (2005),“Balancing Acquisition and Retention Resources to MaximizeCustomer Profitability,” Journal of Marketing, 69 (January),63–79.
Rich, Gregory A., William H. Bommer, Scott B. MacKenzie,Philip M. Podsakoff, and Jonathan L. Johnson (1999), “Applesand Apples or Apples and Oranges? A Meta-Analysis of Objec-tive and Subjective Measures of Salesperson Performance,”
Journal of Personal Selling & Sales Management , 29 (4),41–52.
Rindfleisch, Aric, Alan J. Malter, Shankar Ganesan, and ChristineMoorman (2008), “Cross-Sectional Versus Longitudinal Sur-vey Research: Concepts, Findings, and Guidelines,” Journal of
Marketing Research, 45 (June), 261–79.
Saxe, Robert and Barton A. Weitz (1982), “The SOCO Scale: AMeasure of the Customer Orientation of Salespeople,” Journal
of Marketing Research, 19 (August), 343–51.
8/2/2019 Customer the King
http://slidepdf.com/reader/full/customer-the-king 20/21
Schwepker, Charles H. (2003), “Customer-Oriented Selling: AReview, Extension, and Directions for Future Research,” Jour-nal of Personal Selling & Sales Management , 23 (Spring),151–71.
Siders, Mark A., Gerard George, and Ravi Dharwadkar (2001),“The Relationship of Internal and External Commitment Focito Objective Job Performance Measures,” Academy of Manage-ment Journal, 44 (3), 570–79.
Simonson, Itamar (2005), “Determinants of Customers’ Responsesto Customized Offers: Conceptual Framework and ResearchPropositions,” Journal of Marketing, 69 (January), 32–45.
Stock, Ruth Maria and Wayne D. Hoyer (2005), “An Attitude-Behavior Model of Salespeople’s Customer Orientation,” Jour-nal of the Academy of Marketing Science, 33 (4), 536–52.
Tomkins, Richard (2005), “The Art of Keeping CustomersHappy,” Financial Times, (June 17), 13.
Tuli, Kapil R., Ajay K. Kohli, and Sundar G. Bharadwaj (2007),“Rethinking Customer Solutions: From Product Bundles toRelational Processes,” Journal of Marketing, 71 (July), 1–17.
Verbeke, Willem J. and Richard P. Bagozzi (2000), “Sales CallAnxiety: Exploring What It Means When Fear Rules a SalesEncounter,” Journal of Marketing, 64 (July), 88–101.
74 / Journal of Marketing, March 2011
———, Frank D. Belschak, Arnold B. Bakker, and Bart Dietz(2008), “When Intelligence Is (Dys)Functional for AchievingSales Performance,” Journal of Marketing, 72 (July), 44–57.
Weitz, Barton A. (1981), “Effectiveness in Sales Interactions: AContingency Framework,” Journal of Marketing, 45 (January),85–103.
——— and Kevin D. Bradford (1999), “Personal Selling andSales Management: A Relationship Marketing Perspective,”
Journal of the Academy of Marketing Science, 27 (2), 241–54.Wieseke, Jan, Michael Ahearne, Son K. Lam, and Rolf van Dick
(2009), “The Role of Leaders in Internal Marketing,” Journal
of Marketing, 73 (March), 123–45.Woodruff, Robert B. (1997), “Customer Value: The Next Sourcefor Competitive Advantage,” Journal of the Academy of Mar-keting Science, 25 (2), 139–54.
Yim, Chi K., David K. Tse, and Kimmy W. Chan (2008),“Strengthening Customer Loyalty Through Intimacy and Pas-sion: Roles of Customer–Firm Affection and Customer–Staff Relationships in Services,” Journal of Marketing Research, 45(December), 741–56.

8/2/2019 Customer the King
http://slidepdf.com/reader/full/customer-the-king 21/21
Copyright of Journal of Marketing is the property of American Marketing Association and its content may not
be copied or emailed to multiple sites or posted to a listserv without the copyright holder's express written
permission. However, users may print, download, or email articles for individual use.