CUSTOMER SATISFACTION MEASUREMENT at … SATISFACTION MEASUREMENT at DISNEYLAND ... Walt Disney...
19
CUSTOMER SATISFACTION MEASUREMENT at DISNEYLAND ® PARIS Eloi Courcoux Managing Director Business Solutions – Disneyland ® Paris
Transcript of CUSTOMER SATISFACTION MEASUREMENT at … SATISFACTION MEASUREMENT at DISNEYLAND ... Walt Disney...

CUSTOMER SATISFACTION MEASUREMENT
at DISNEYLAND® PARIS
Eloi Courcoux Managing Director
Business Solutions – Disneyland® Paris
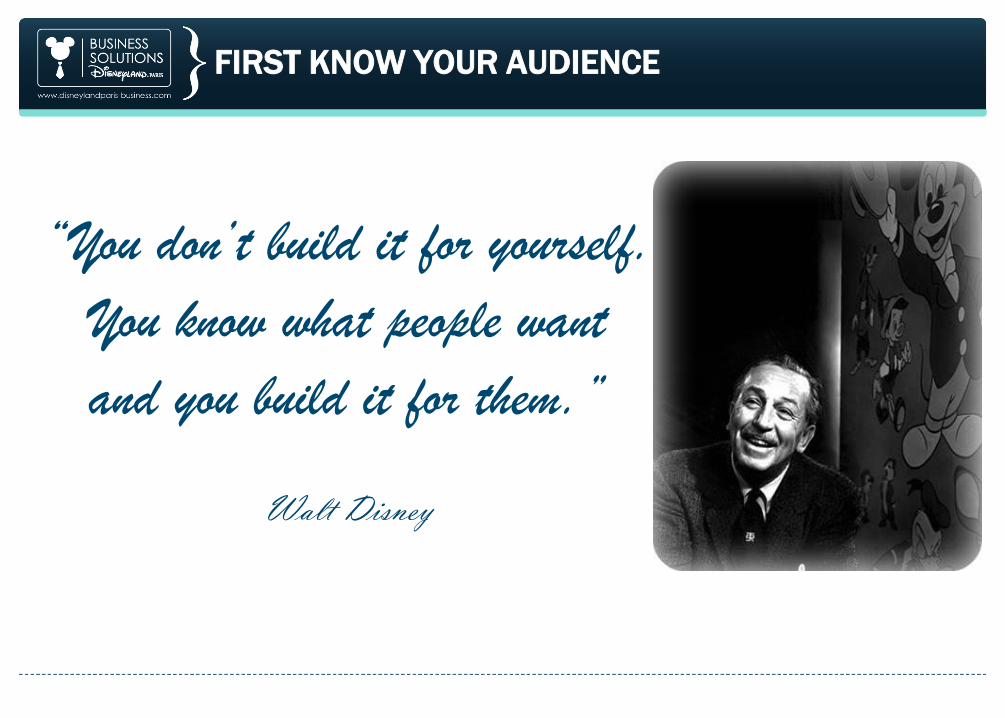
“You don’t build it for yourself.
You know what people want
and you build it for them.”
Walt Disney
FIRST KNOW YOUR AUDIENCE

CUSTOMER EXPERIENCE : OUR PRIORITY
• 16M visitors at Disneyland Paris
• 134 000 surveys sent, 40 000 respondents => return rate of 30%
• Overall Satisfaction : 63% of completely and very satisfied clients
1- Research activity fully oriented on maintaining high levels of: • Markets comprehension
• Guest Experience
• Intention to Revisit & to Recommend
2- Support our decision leveraging “ the voice of the Guest” • To shape marketing & sales, revenue and operational strategies

A PROCESS IN 3 STEPS
Disneyland Paris Consumer Insight: • A dedicated team
• EMEA Expertise center
• 100% in-house
Adapted to all targets • Leisure vs Business
• Cultural difference
• Volume of visitors

A METHODOLOGY IN ACCORDANCE WITH
EACH OF OUR GUESTS
Face to face park interview ( i.e. Food)
Internet-based study ( i.e. Hotels). Invitations containing a link to the survey are sent out weekly
Respondents have one week to respond to the invitation. 5 points scale ( Completely S, Very S, S, barly S, UnSatisfied)
In-person intercept in both parks. Coupon on the check-in form, filled in by Guests in each Disney Hotel.
Monthly Reporting
Activities penetration and Guest satisfaction with Parks, Disney Village and Hotel (Disney or S&A) experiences.
What?
How?
When?

KEY LESSONS AND IMPACTS
Case Study
• Disney Dreams
• New rooms perception
• Pricing and Communication

BUSINESS SOLUTIONS : SAME APPROACH
Disneyland® Paris is Europe’s biggest integrated events venue 20 years’ experience
1,000 events every year (external and internal)
Business Solutions : a 200-strong dedicated events team 200 strategic and operational talents
Meetings & Conferences, Gala Dinners & Privatizations, Reward & Incentive, whether the
number 50 or 25,000
Bespoke solutions Creativity
Innovation
Impeccable service
=> to ensure we meet the clients’ challenges and provide a bespoke solution for their event
Clients’ expectations are different (leisure vs corporate)
Approach and Interest remain the same
The customer experience is our priority
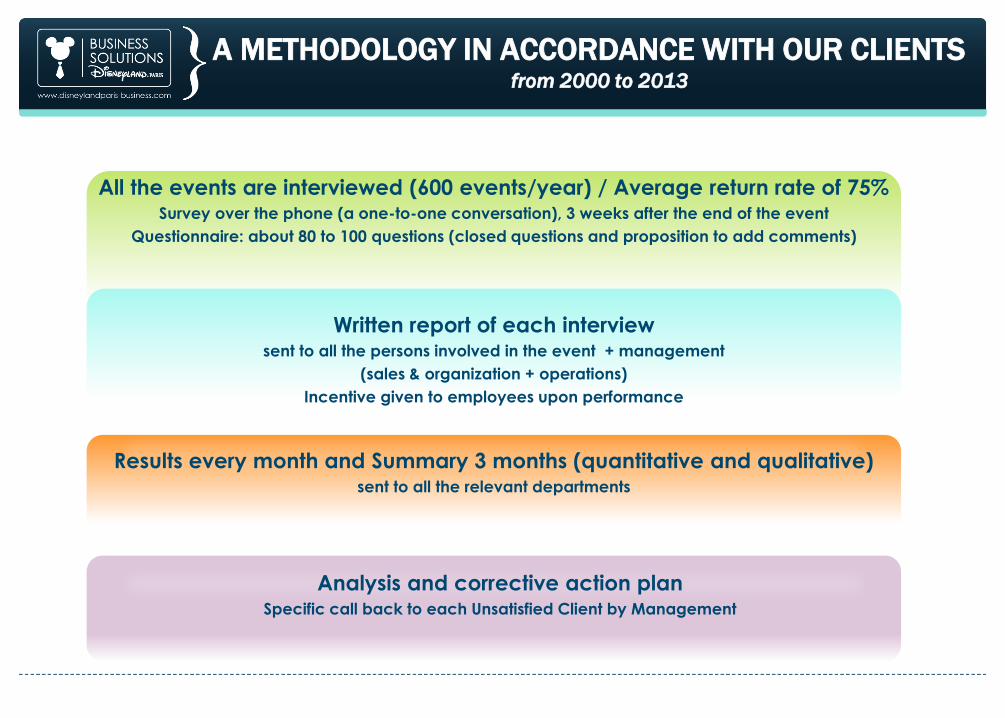
All the events are interviewed (600 events/year) / Average return rate of 75% Survey over the phone (a one-to-one conversation), 3 weeks after the end of the event
Questionnaire: about 80 to 100 questions (closed questions and proposition to add comments)
Written report of each interview sent to all the persons involved in the event + management
(sales & organization + operations)
Incentive given to employees upon performance
Results every month and Summary 3 months (quantitative and qualitative) sent to all the relevant departments
Analysis and corrective action plan Specific call back to each Unsatisfied Client by Management
A METHODOLOGY IN ACCORDANCE WITH OUR CLIENTS from 2000 to 2013

KEY LESSONS AND IMPACTS
Case study
• Preparation and Follow up
• F&B
• WI-FI
• Accommodation
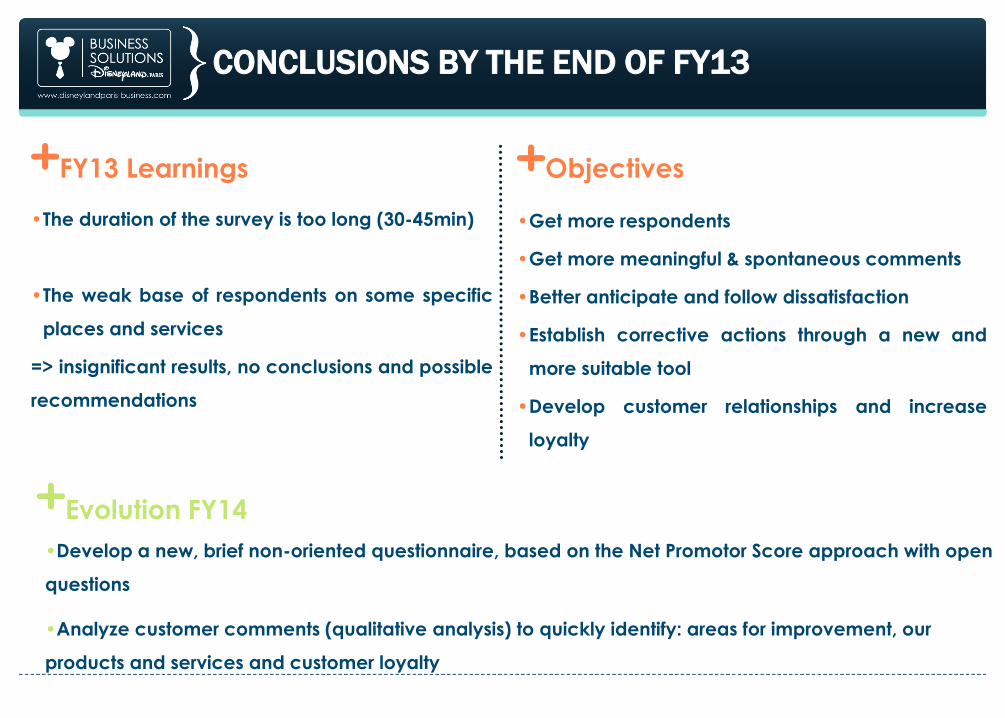
CONCLUSIONS BY THE END OF FY13
FY13 Learnings Objectives
•The duration of the survey is too long (30-45min)
•The weak base of respondents on some specific
places and services
=> insignificant results, no conclusions and possible
recommendations
•Get more respondents
•Get more meaningful & spontaneous comments
•Better anticipate and follow dissatisfaction
•Establish corrective actions through a new and
more suitable tool
•Develop customer relationships and increase
loyalty
•Develop a new, brief non-oriented questionnaire, based on the Net Promotor Score approach with open
questions
•Analyze customer comments (qualitative analysis) to quickly identify: areas for improvement, our
products and services and customer loyalty
Evolution FY14

THE STUDY IS EVOLVING
The questionnaire is different: from 80 closed questions to 3 closed questions + 4 open questions
Data processing based more on comments & semantic analysis
Monthly & Quaterly Reportings
The approach remains the same: The meeting planner is interviewed over the phone 3 weeks after the end of the event

NEW QUESTIONNAIRE

SATISFACTION RESULTS
Results Q1 FY 14 (Oct-Dec 2013)
NPS and analysis of customer verbatim
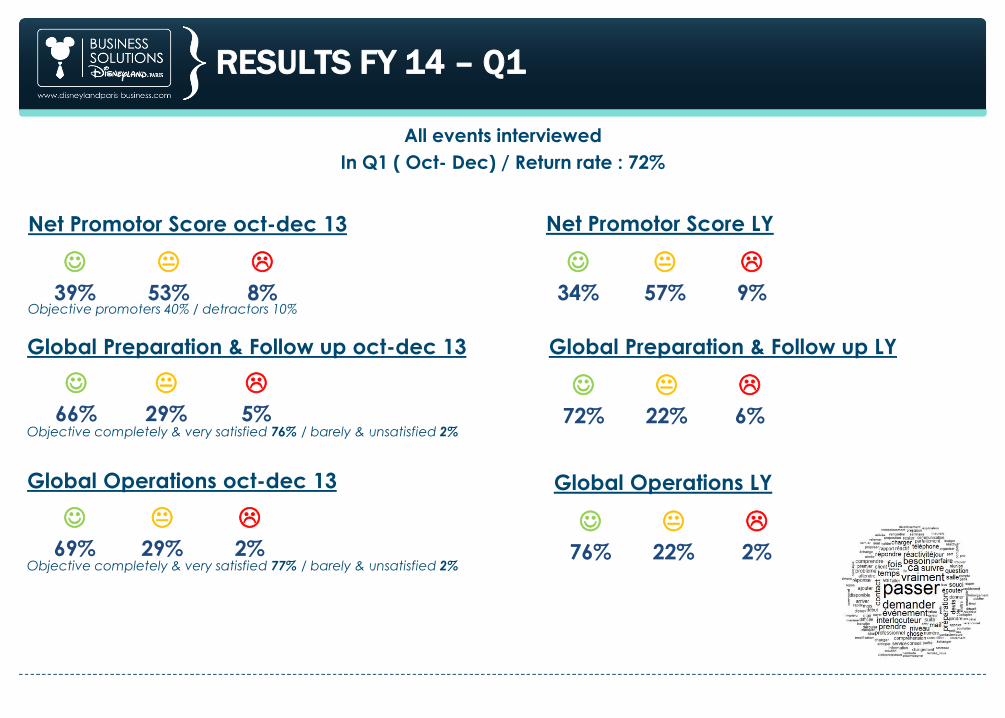
Net Promotor Score oct-dec 13
Objective promoters 40% / detractors 10%
Net Promotor Score LY
J K L
39% 53% 8%
J K L
34% 57% 9%
RESULTS FY 14 – Q1
Global Preparation & Follow up oct-dec 13
Objective completely & very satisfied 76% / barely & unsatisfied 2%
Global Operations oct-dec 13
Objective completely & very satisfied 77% / barely & unsatisfied 2%
J K L
66% 29% 5%
J K L
69% 29% 2%
Global Preparation & Follow up LY
Global Operations LY
J K L
72% 22% 6%
J K L
76% 22% 2%
All events interviewed
In Q1 ( Oct- Dec) / Return rate : 72%
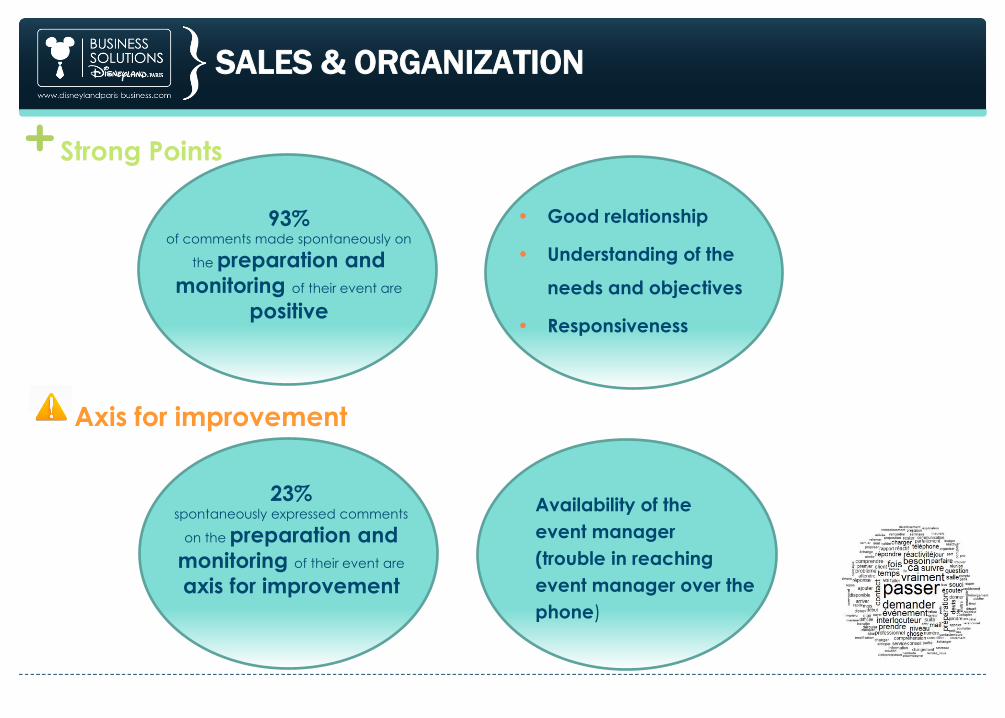
SALES & ORGANIZATION
93% of comments made spontaneously on
the preparation and
monitoring of their event are
positive
Strong Points
• Good relationship
• Understanding of the
needs and objectives
• Responsiveness
Axis for improvement
23% spontaneously expressed comments
on the preparation and
monitoring of their event are
axis for improvement
Availability of the
event manager
(trouble in reaching
event manager over the
phone)

THE EVENT ON-SITE – STRONG POINTS
49%
of comments focused on the F&B
Quality of food
Courtesy of staff
29% spontaneously expressed positive
comments on the
entertainment, gala evening
41% • of comments focused on the
professionalism of the
teams and the good
organization of their event.
25% spontaneously expressed positive
comments on the meeting rooms
More than a quarter of interlocutors offer no suggestion for improvement,
they are particularly satisfied with the conduct of their event.
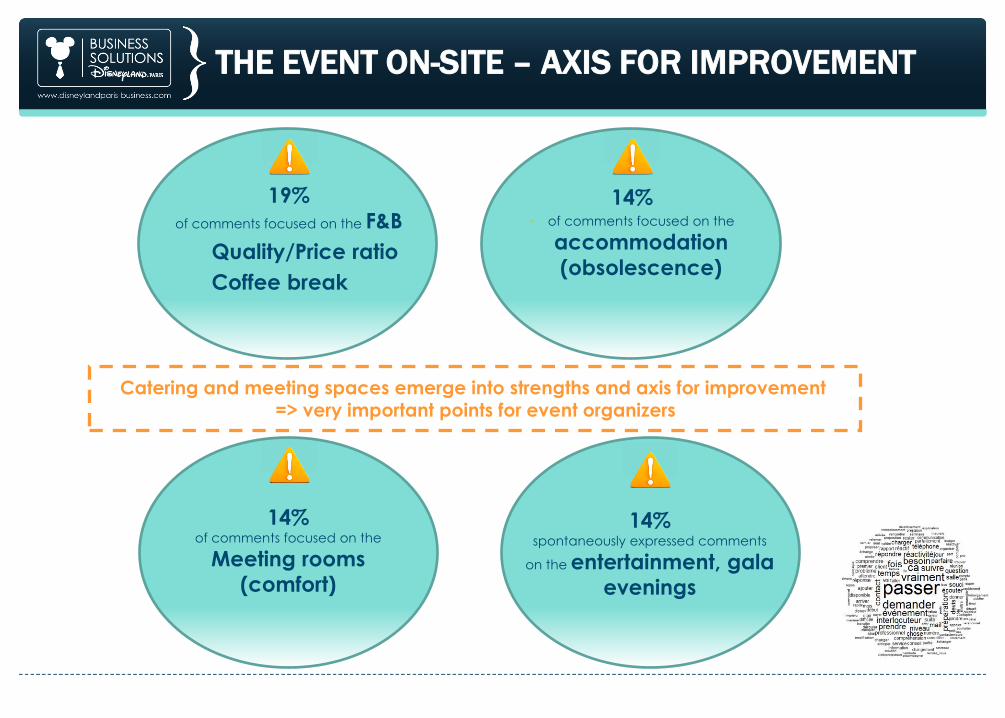
THE EVENT ON-SITE – AXIS FOR IMPROVEMENT
19%
of comments focused on the F&B
Quality/Price ratio
Coffee break
14% of comments focused on the
Meeting rooms (comfort)
14% • of comments focused on the
accommodation
(obsolescence)
14% spontaneously expressed comments
on the entertainment, gala evenings
Catering and meeting spaces emerge into strengths and axis for improvement => very important points for event organizers

NEXT STEPS
Objective: Strive for excellence
Improve reporting
Improve communication
97% of our clients are satisfied

For any further information:
Vanessa PIERRE- Marketing Executive
01 60.45.74.66
THANK YOU