internet banking Bank Customer Satisfaction Survey Bank Customer Satisfaction Survey

CUSTOMER SATISFACTION FOR PROFESSIONAL SERVICES GROUP, INC.:
Development of an Online Customer Satisfaction Survey
by
G. Scott Davis, BS, CSW
A Research Paper
Submitted in Partial Fulfillment of the
Requirements for the
Master of Science Degree
in
Applied Psychology
Approved: 4 Semester Credits
____________________________________ Research Advisor
The Graduate College
University of Wisconsin – Stout
May, 2003

Online Satisfaction Survey
The Graduate School
University of Wisconsin – Stout
Menomonie, WI 54751
ABSTRACT Davis Gerald Scott (Writer) (Last Name) (First) (Middle) Customer Satisfaction for Professional Services Group, Inc:
(Title) Development of an Online Satisfaction Survey Applied Psychology
(Graduate Major) Louis Milanesi, PhD May 2003 83 (Research Advisor) (Month/Year) (No.of Pages) American Psychological Association (APA) Publication Manual (Fifth Edition)
(Name of Style Manual Used for this Study)
The benefits of good customer satisfaction on business as well as the costs of poor customer
satisfaction have been clearly demonstrated in the research literature. The Met-Expectations
Model of Customer Satisfaction is based on the premise that quality can be defined by the
differences between the customer and the organization on the perceptions, expectations, and
actual delivery of service. These gaps provide information that can be used to identify the
relative strengths and weaknesses of the processes and components of service. In turn, the
business is able to implement adjustments in service delivery that directly improve customer
satisfaction and profit. SERVQUAL, an instrument based on this model, has been utilized in
various service industries with mixed results. The purpose of this study was to develop an online
customer satisfaction survey for a private human service agency and collect data from both
ii

Online Satisfaction Survey
internal and external sources. A modified version of SERVQUAL was emailed to 52 agency
staff and 41 customers. The two groups were similar in responses. Significant differences were
only found on three specific items – Intensity and Depth of Service, Service Innovation, and
Convenient Hours to Customers, Clients, and Families. Internal and external respondent groups
differed in the rank order of importance of the service dimensions. Possible explanations for
these results, similarities and differences of previous research, and problems with the study are
discussed. The study concludes with recommendations for the organization.
iii

Online Satisfaction Survey
ACKNOWLEDGEMENTS
The author would like to acknowledge the great patience, understanding and assistance of
several people who made this project possible. A special thanks is extended to Dr. Louis
Milanesi, who not only gave me the freedom to pursue my knowledge but also, the direction
when I seemed to founder. I would also like to thank the Board of Directors of Professional
Services Group, Inc. – David Houghton, Brian Wolf, and especially Daniel Baran – for their
continued support and feedback throughout this project as well as my graduate studies. Of course
I’d like to mention the support and encouragement of my parents, grandparents, and my
daughter, Sydnee Alyce Davis, who I hope have understood why I have invested so much time
and energy into completing graduate school. Finally, I would like to acknowledge Richard
Tafalla and the rest of the faculty and students of the Master’s in Applied Psychology Program at
the University of Wisconsin – Stout. It was what I learned from each of you that made this
project a success. Slainte!
iv

Online Satisfaction Survey
TABLE OF CONTENTS
Title Page ……………………………………………………………………………………i
Abstract ……………………………………………………………………………………..ii
Acknowledgements …………………………………………………………………………iv
Table of Contents …………………………………………………………………………...v
List of Tables ………………………………………………………………………………..vii
List of Figures ……………………………………………………………………………….viii
CHAPTER ONE: INTRODUCTION ………………………………………………………9
Importance of Customer Satisfaction ……………………………………………….9
Components and Requirements of Customer Satisfaction ………………………….11
A Model of Customer Satisfaction ………………………………………………….13
Methods of Collecting Customer Satisfaction Information …………………………15
Methods Using the Met-Expectations Model ……………………………………….17
Uses of Customer Satisfaction Information …………………………………………20
Difficulties with Customer Satisfaction in Human Services …….………………….22
Agency Description and History………………………………………………….…23
The Current Process of Customer Satisfaction Information ………………………...25
Difficulties with the Current Process ……………………………………………….26
CHAPTER TWO: PROBLEM STATEMENT ……………………………………………..29
CHAPTER THREE: METHODOLOGY …………………………………………………...32
Participants ………………………………………………………………………….32
Instrumentation ……………………………………………………………………...35
Procedure….…………………………………………………………………………36
v

Online Satisfaction Survey
CHAPTER FOUR: RESULTS..……………………………………………………………...37
Demographic Items .…………………………………………………………………37
Process Items . ……………………………………………………………………….41
Service Dimensions and Items .……………………………………………………..44
CHAPTER FIVE: DISCUSSION. .………………………………………………………….53
Summary . ..………………………………………………………………………….53
Process Items .……………………………………………………………………….54
Service Dimensions and Items ...…………………………………………………….56
Similarities and Differences with Previous Research. ...…………………………….58
Cautions and Limitations .……..…………………………………………………….60
Recommendations for Application . ..……………………………………………….62
REFERENCES ..…………………………………………………………………………….64
APPENDIX A: SERVQUAL Items by Dimension ...……………………………………….69
APPENDIX B: Modified SERVQUAL and Other Items by Dimension ….……………….70
APPENDIX C: Quality Assurance Procedures for Agency .……………………………….72
APPENDIX D: Initial List of Service Quality Items by Dimension. ……………………….74
APPENDIX E: Final List of Service Quality Items by Dimension..…..…………………….77
APPENDIX F: Customer Satisfaction Dimensions Survey. ..……………………………….79
vi

Online Satisfaction Survey
LIST OF TABLES
Table 1: Best Method of Collecting Customer Satisfaction Information. . . . . . . . . . . . . . . 42
Table 2: Length of Time Adequate for Collecting Customer Satisfaction Information. . . . 43
Table 3: Having Held Back Negative Customer Satisfaction Information. . . . . . . . . . . . . . 43
Table 4: Tangibles Dimension and Specific Item Mean Ratings of Importance. . . . . . . . . 45
Table 5: Service Delivery Dimension and Specific Item Mean Ratings of Importance. . . . 46
Table 6: Reliability Dimension and Specific Item Mean Ratings of Importance.. . . . . . . . . 47
Table 7: Responsiveness Dimension and Specific Item Mean Ratings of Importance. . . . . 48
Table 8: Assurance Dimension and Specific Item Mean Ratings of Importance. .. . . . . . . . 49
Table 9: Empathy Dimension and Specific Item Mean Ratings of Importance. . . . . . . . . . 50
Table 10: Group Rankings of Service Dimension Importance. . . . . . . . . . . . . . . . . . . . . . . 51
vii

Online Satisfaction Survey
LIST OF FIGURES
Figure 1: Current Position. . . . . . . . . . . . . . . . . . . . . . . . . . . . . . . . . . . . . . . . . . . . . . . . . . . 38
Figure 2: Time in Current Position. . . . . . . . . . . . . . . . . . . . . . . . . . . . . . . . . . . . . . . . . . . . 40
viii
Online Satisfaction Survey
CHAPTER ONE
INTRODUCTION
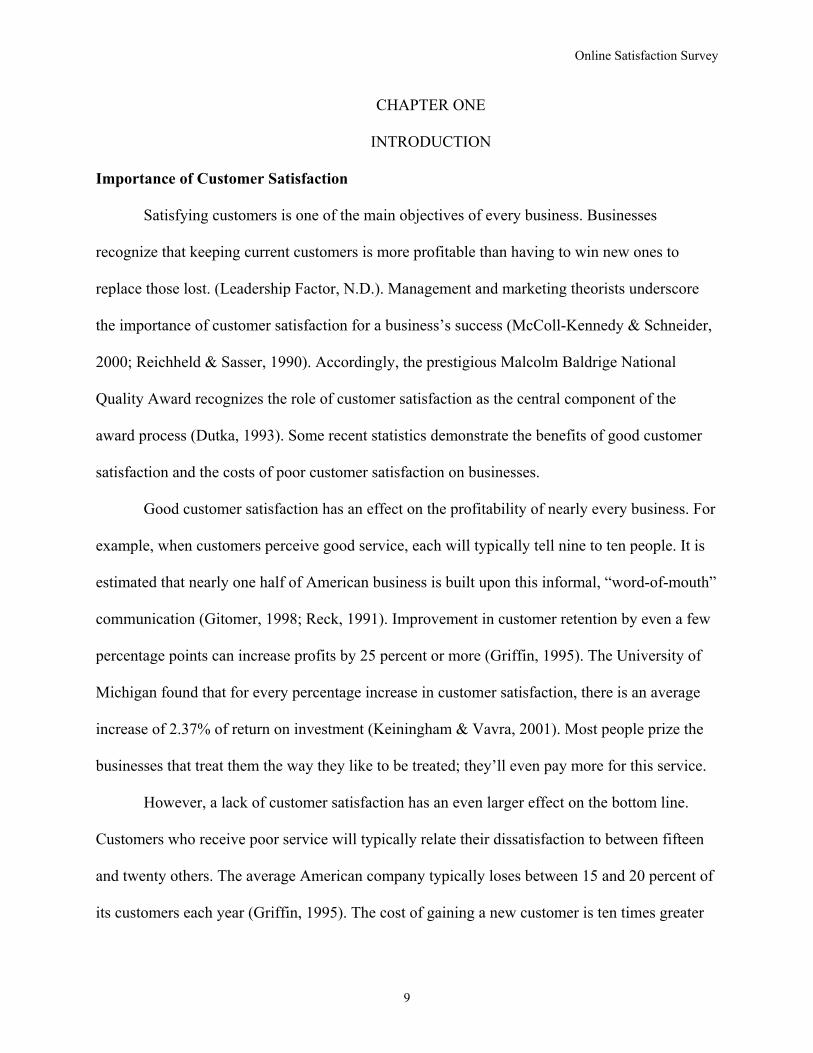
Importance of Customer Satisfaction
Satisfying customers is one of the main objectives of every business. Businesses
recognize that keeping current customers is more profitable than having to win new ones to
replace those lost. (Leadership Factor, N.D.). Management and marketing theorists underscore
the importance of customer satisfaction for a business’s success (McColl-Kennedy & Schneider,
2000; Reichheld & Sasser, 1990). Accordingly, the prestigious Malcolm Baldrige National
Quality Award recognizes the role of customer satisfaction as the central component of the
award process (Dutka, 1993). Some recent statistics demonstrate the benefits of good customer
satisfaction and the costs of poor customer satisfaction on businesses.
Good customer satisfaction has an effect on the profitability of nearly every business. For
example, when customers perceive good service, each will typically tell nine to ten people. It is
estimated that nearly one half of American business is built upon this informal, “word-of-mouth”
communication (Gitomer, 1998; Reck, 1991). Improvement in customer retention by even a few
percentage points can increase profits by 25 percent or more (Griffin, 1995). The University of
Michigan found that for every percentage increase in customer satisfaction, there is an average
increase of 2.37% of return on investment (Keiningham & Vavra, 2001). Most people prize the
businesses that treat them the way they like to be treated; they’ll even pay more for this service.
However, a lack of customer satisfaction has an even larger effect on the bottom line.
Customers who receive poor service will typically relate their dissatisfaction to between fifteen
and twenty others. The average American company typically loses between 15 and 20 percent of
its customers each year (Griffin, 1995). The cost of gaining a new customer is ten times greater
9
Online Satisfaction Survey
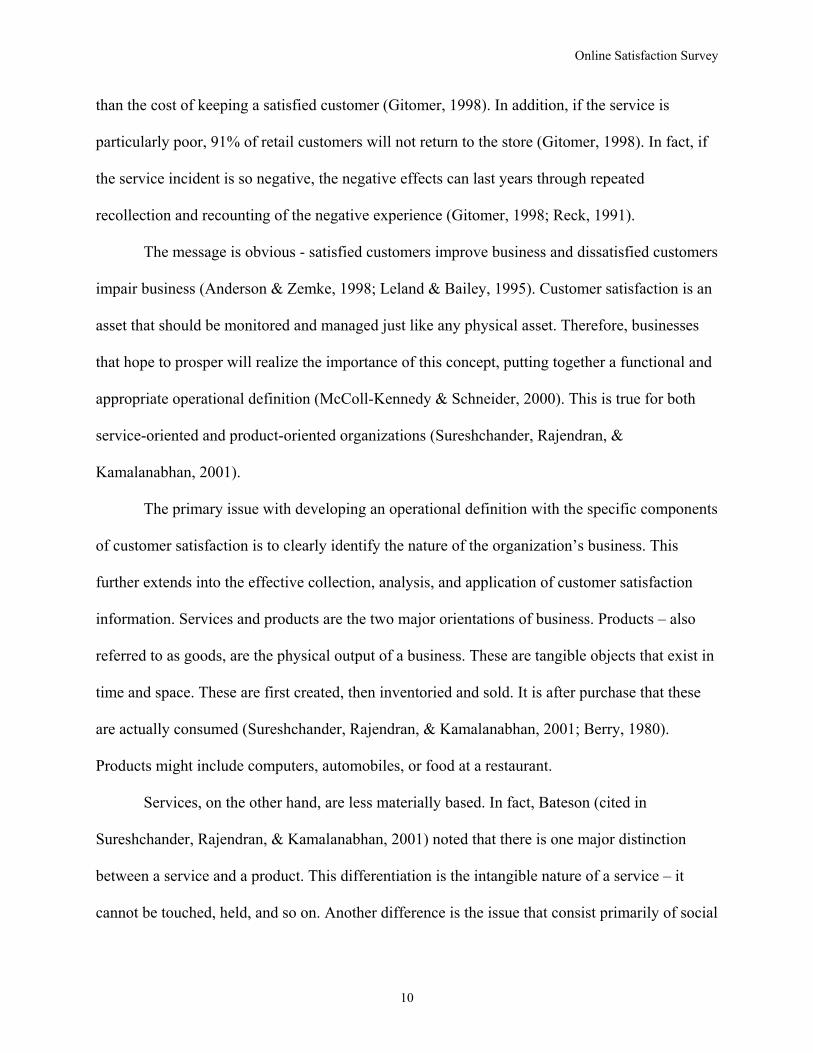
than the cost of keeping a satisfied customer (Gitomer, 1998). In addition, if the service is
particularly poor, 91% of retail customers will not return to the store (Gitomer, 1998). In fact, if
the service incident is so negative, the negative effects can last years through repeated
recollection and recounting of the negative experience (Gitomer, 1998; Reck, 1991).
The message is obvious - satisfied customers improve business and dissatisfied customers
impair business (Anderson & Zemke, 1998; Leland & Bailey, 1995). Customer satisfaction is an
asset that should be monitored and managed just like any physical asset. Therefore, businesses
that hope to prosper will realize the importance of this concept, putting together a functional and
appropriate operational definition (McColl-Kennedy & Schneider, 2000). This is true for both
service-oriented and product-oriented organizations (Sureshchander, Rajendran, &
Kamalanabhan, 2001).
The primary issue with developing an operational definition with the specific components
of customer satisfaction is to clearly identify the nature of the organization’s business. This
further extends into the effective collection, analysis, and application of customer satisfaction
information. Services and products are the two major orientations of business. Products – also
referred to as goods, are the physical output of a business. These are tangible objects that exist in
time and space. These are first created, then inventoried and sold. It is after purchase that these
are actually consumed (Sureshchander, Rajendran, & Kamalanabhan, 2001; Berry, 1980).
Products might include computers, automobiles, or food at a restaurant.
Services, on the other hand, are less materially based. In fact, Bateson (cited in
Sureshchander, Rajendran, & Kamalanabhan, 2001) noted that there is one major distinction
between a service and a product. This differentiation is the intangible nature of a service – it
cannot be touched, held, and so on. Another difference is the issue that consist primarily of social
10

Online Satisfaction Survey
interactions or actions (Berry, 1980). The consumption of a service involves the interaction
between the producer and the consumer. Also, services are produced and consumed
simultaneously (Carman & Langeard, 1980). Services might include computer repair, automobile
sales, or the attendance of a server at a restaurant. Delivering quality service is a business
necessity (Cullen, 2001).
Components and Requirements of Customer Satisfaction
The concept of customer satisfaction is composed of several components from distinct
sources (McColl-Kennedy & Schneider, 2000). Customer satisfaction begins with clear,
operational definitions from both the customer and the organization. Understanding the
motivations, expectations, and desires of both gives a foundation in how to best serve the
customer. It may even provide information on making improvements in the nature of business.
This is the heart of research into customer satisfaction (Naylor & Greco, 2002). The importance
of clearly defining the key concepts and elements of satisfaction provide a template by which
information can be gathered about what is, and what is not, working. This includes both the hard
measures – those that are more tangible and observable (i.e., number of complaints, average wait
time, product returns, etc) and the soft measures – those less tangible aspects (i.e., friendliness,
helpfulness, politeness, etc) (Hayes, 1998). These definitions often start with the most vague and
general, and become more to the highly specified and precise examples. The bottom line is that
in order to know about customer satisfaction, one needs to know what to look for (Mitchell,
1999). The organization needs to seek this information from both within and without.
The organizational requirements of customer satisfaction are the internally based
processes, components, standards, and criteria that a business strives to achieve. These are the
performance goals and benchmarks set forth by the business, for the business. These are the
11

Online Satisfaction Survey
elements of corporate culture (Hayes, 1998). Meeting or exceeding these is often an indicator of
success or failure. At times, these indigenous components of customer satisfaction may overlap
with those set forth by the customer; at others they may be divergent.
Those processes, components, and standards that are deemed important by the customer
are another important source of information. In order for a business to meet the needs and desires
of the customer, the business must know the needs and desires of the customer. This information
is vital not only for successful business, but also for understanding and improving customer
satisfaction. This important component helps to set the standards and components of satisfaction
from the perspective of the consumer (Hayes, 1998).
Satisfaction dimensions are developed from the previously identified requirements. These
are the specific components that make up the requirements. For example, if a customer and
organizational requirement is for customer service, the satisfaction dimensions may include
interactions, timeliness, and responsiveness. These are the clusters that define the requirements
(Hayes, 1998).
Critical incidents are the specific operations that relate to the satisfaction dimensions.
These are often the concrete and measurable behaviors and actions of employees, groups, or
organization. This may also include policies, procedures, and protocols in place within an
organization (Hayes, 1998).
From this continued definition and distillation of various sources of data, the actual
development of a customer satisfaction instrument or tool can begin in earnest. As always, the
planning of the research is the most important component in a successful information-gathering
process. It is further helpful that a model of customer satisfaction that incorporates the
organizational and customer requirements exists and is applicable in practice.
12

Online Satisfaction Survey
A Model of Customer Satisfaction
One model of measuring customer satisfaction that has received considerable attention in
the service industry is the Met-Expectations Model. This is also known as the Discrepancy
Model, Disconfirmation of Expectations Model, or Gap Model for Managing Quality
(Parasuraman, Berry, & Zeithaml, 1985, 1993). The basic premise of the model is that quality
can be defined by the differences between the customer and the organization in terms of service
quality (Parasuraman, Berry, & Zeithaml, 1985). This is true of perceptions, expectations, and
actual service delivery from the two perspectives. These differences, or gaps, can be used to
identify the relative strengths and weaknesses in service quality of an organization (Grapentine,
1999). Furthermore, this provides a measure of performance quality in an area that has been
more difficult to operationalize (Patti, 1987).
The Met-Expectations Model of Customer Satisfaction is based upon a framework of five
potential service quality gaps (Parasuraman, Berry, & Zeithaml, 1985). The first four are those
on the provider side of service. The fifth relates to the customer side of service. These gaps are -
Gap 1: The difference between customer expectations and management perceptions of
customer expectations.
Simply, this is the point of knowing what the customer expects. It is important for an
organization to being clearly aware of what it is exactly that the customers expect. Failure to do
so can lead to poor perceptions of satisfaction with service quality. This is a cornerstone of
effective business – knowing one’s customer (Dutka, 1993).
Gap 2: The difference between management perceptions of customer expectations and
service quality expectations.
13

Online Satisfaction Survey
This gap relates to the consistency between the organization’s established specifications
of service quality and expectations of its customers. The intended service must meet the expected
service. The more exact these are the more likely that the organization is measuring the
important qualities of service anticipated by its customers. The customer must determine the
standards of service delivery for satisfaction to be positive (Shostack, 1990; Takeuchi & Quelch,
1990).
Gap 3: The difference between actual service quality specifications and the service actually
delivered.
This is referred to as the service performance gap. This is the difference between what an
organization stipulates as service standards and practices and what employees actually deliver to
customers. These differences could be due to either the inability or the unwillingness of staff to
perform as the organization describes. An organization must be closely and carefully monitoring
the provision of service. Failure to do so will lead to lower customer satisfaction (Gitomer,
1998).
Gap 4: The difference between service delivery and what is communicated to customers.
The consistency between organizational assurances of service delivery and actual service
delivery is the issue of this gap. The premise is the follow through on promises made to
customers by an organization. Failure to deliver as promised can lead to customer dissatisfaction,
not only with the service, but the agency as well. This is identified as a significant reason for
customer defection (Reichheld & Sasser, 1990).
Gap 5: The difference between customer expectations and perceptions.
Another key difference that affects satisfaction is between customer expectations and
perception. The service delivery that is perceived must meet or exceed anticipations. Failure to
14

Online Satisfaction Survey
do so can lead to customer dissatisfaction – outrage in the extreme - while meeting or exceeding
these can lead to satisfaction – or delight in the extreme. (Keiningham & Vavra, 2001).
Obviously, happy customers help and angry customers harm business.
The model is appealing both in its simplicity and intuitive logic. Customer expectations
of service that are closely matched with perceived actual services will be satisfied customers. If
expectations exceed actual services, the client is dissatisfied (or worse). Conversely, if the actual
services surpass expectations, the customer is very satisfied.
The Met-Expectations Model of customer satisfaction has been applied in a wide variety
of service settings. These have included library usage (Cullen, 2001), tourist services (Swan &
Bowers, 1998), public health services (Bryant, Kent, Lindenberger, Schreiher, Canright, Cole,
Uccellani, Brown, Blair, & Bustillo-Hernandez, 1998), medical and dental services (Taylor &
Cronin, 1994), and human services (Selber & Streeter, 2000).
Methods of Collecting Customer Satisfaction Information
There are several methodologies of research that can be utilized to collect information
regarding customer satisfaction. Factors such as information need, resources, accessibility to
customers, sample to be used, time, and so forth must be considered prior to selection of a
methodology. As would be expected, each has its own strengths and weaknesses in relation to
one another (Dutka, 1993; Leland & Bailey, 1995). The following is a brief overview of the
more commonly selected methods.
Written Surveys. Using this common method, customers are asked to complete a
document that poses a series of specific questions regarding specific dimensions and items of
satisfaction. These are tailored to fit the identified needs of both the organization and the
15

Online Satisfaction Survey
customer base. Questions or statements may be closed-ended or open-ended, and often involve
Likert-type scales. These can be completed in person, through the postal system, or online.
Advantages include a lower cost per completed survey and the lack of pressure on
customers to provide quick answers. Disadvantages include poor response rates (average returns
of 30 to 50%) (Leland & Bailey, 1995), incomplete surveys, poor quality control due to lack of
monitoring, bias due to non-response, and respondents need to be reasonably literate to
comprehend the survey (Dutka, 1998).
Telephone Surveys. This method involves the utilization of interviews via telephone of
customers that either follows a planned, specific series of questions, or involves the discussion of
information based upon the responses given. Sometimes geographic distances or time constraints
direct the adoption of this methodology.
Advantages include monitoring of interviews for improved quality control, higher
response rates, less bias due to non-response, shorter time requirements for completion,
reasonably low cost. Disadvantages include sampling bias (telephone ownership), difficulty
reaching respondents, and the quick responses to telephone surveys do not always allow for
adequate thought. (Dutka, 1993; Leland & Bailey, 1995).
Focus Groups. This method involves bringing together eight or more customers by
invitation to answer prepared specific questions presented by a moderator. The average group
lasts about one to one and half-hours and the dynamics often provide a wealth of feedback in a
short time. All comments are usually recorded and transcribed, and techniques such as content
analysis may be used to identify themes.
Advantages include the possibility to ask complex questions, more in-depth responses,
and group interactions providing otherwise unavailable data. Disadvantages include the often-
16
Online Satisfaction Survey
qualitative nature of data and the inability at times to generalize to larger populations. (Dutka,
1993; Leland & Bailey, 1995).
In-Depth Interviews. This method is utilized when the most anecdotal information is
required regarding customer satisfaction. This often provides a more personal format in a one-
on-one setting that can encourage a customer to discuss possible controversial or difficult issues.
This includes customers who have stopped using an organization, use competitors, or employees
discussing issues about the organization. This is a requisite for customized or individual client
gap analyses – identifying the break between expectation and actual performance.
Advantages include the possibility to ask complex questions, more in-depth responses,
responses that may be viewed more negatively by a group are obtained, and a longer interview is
often possible. Disadvantages include a greater cost that other methods, a greater time needed for
completion, and the number of completed interviews is usually much less than other methods.
(Dutka, 1993; Leland & Bailey, 1995).
Methods Using the Met-Expectations Model
The Met-Expectations Model of customer satisfaction has been applied in the
development of an instrument to measure service quality. Known as SERVQUAL, this
instrument was developed and refined by Parasuraman, Berry, and Zeithaml in particular
response to the fifth gap – that of expected versus perceived service (Parasuraman, Berry, &
Zeithaml, 1988). SERVQUAL is composed of 22-items describing service quality, along five
dimensions (Selber & Streeter, 2000), as follows:
Tangibles. This quality dimension involves the appearance of physical facilities,
equipment, materials, and personnel of the organization. This is the only dimension related
specifically to the palpable and readily discernible of service provision.
17

Online Satisfaction Survey
Reliability. This quality dimension involves the consistent, dependable, and accurate
delivery of promised services. The actual provision of service is the element in this case.
Responsiveness. This dimension of service quality encompasses those aspects of
personnel that demonstrate a willingness of an organization’s personnel to help customers and
provide prompt service. The service-orientation of the staff members is the characteristic.
Assurance. This dimension includes the knowledge, skill, and ability of personnel, as
well as the level of courtesy and ability to inspire trust and confidence from customers. This
relates to the expected and perceived aptitude and abilities of personnel.
Empathy. This dimension of service quality relates to the level of caring, and
individualized attention that personnel provides to customers. The “person-to-person” or “people
skills” of staff is the question.
The items are arranged as a pair of structured statements related to specific elements of
service quality. The customer is asked to rate each statement in terms of expected levels of
service and in perceived levels of actual service. Each statement is rated along a seven-point
Likert scale that is anchored by "strongly disagree" to "strongly agree" (Parasuraman, Berry, &
Zeithaml, 1988). See Appendix A for a complete list of the SERVQUAL items.
The measure was extensively tested in diverse service firms such as banking, credit card,
repair and maintenance, and long-distance telephone service (Grapentine, 1999). Findings were
statistically significant, with coefficient alpha ratings exceeding 0.70 (Grapentine, 1999). In
addition, Selber reported promising results in the use of SERVQUAL as a measure of customer
satisfaction in twenty human service agencies (as cited in Selber and Streeter, 2000).
However, not all research has supported the five dimensions of service quality as
forwarded by SERVQUAL. There has been considerable research critical of the efficacy of
18
Online Satisfaction Survey
SERVQUAL (Cronin & Taylor, 1994; Babakus & Boller, 1992; Carman, 1990). In fact, research
conducted by Sureshchander, Rajendran, and Kamalanabhan (2001) on the items of
SERVQUAL have found that the service quality dimensions were better represented by a
different set altogether, as below:
Core service. This dimension is essentially the content of a service. It encompasses the
actual service, over and above how it is delivered. These are the appreciable features of the
service being delivered.
Systematization of Service Delivery. This dimension of quality refers to the processes,
procedures, systems, and technology that make service efficient and effective. The issue is the
smooth delivery of consistent service without undue snags or extreme variation.
Social Responsibility. This dimension relates to ethical behavior and actions by the
corporation in business and other dealings. The authors contend that this contributes to customer
perceptions of a quality organization.
Tangibles of Service. This service dimension, also known as servicescapes, is similar to
the tangibles of SERVQUAL. Items on the instrument are essentially unchanged or have been
modified from SERVQUAL. Two items were deleted after being judged as irrelevant or too
“generic” (p.115) by the authors.
Human Element of Service Delivery. This service dimension is the conglomeration of the
human-related dimensions of SERVQUAL - namely reliability, responsiveness, assurance, and
empathy. However, several items were modified.
The forty-one items are presented as structured statements related to specific elements of
service quality. The customer is asked to rate each statement in terms of performance. This is
done along a seven-point Likert scale that is anchored by "very poor" to "very good"
19
Online Satisfaction Survey
(Sureshchander, Rajendran, and Kamalanabhan, 2001). See Appendix B for a list of the items
that are not repeated on SERVQUAL.
Uses of Customer Satisfaction Information
Regardless of the method selected, there are several possible uses of information about
customer satisfaction (Dutka, 1993). Some include -
1. Customer satisfaction results can help to present the current standing of customer
satisfaction.
This utilization often goes beyond reporting statistical data such as mean, range, and standard
deviation. These descriptive data can assist in identifying specific strengths and weaknesses in
satisfaction dimensions, the specific items under each, as well as information about overall
scores. However, different types of data analysis can be used to identify not only aggregate but
also individual information. From here emerges the distinct patterns or gaps between different
individuals, groups, or among particular items.
2. Customer satisfaction results can help to identify important customer requirements.
Identification of the specific customer requirements for achieving satisfaction is useful at a
very fundamental level. An organization is able to clearly focus efforts in those areas that are
most important to the customer. Distinguishing those requirements most valued by customers
allows for pinpointing efforts for service modifications as well as further data collection.
Comparisons of specific items to the satisfaction dimension or overall score can assist in
determination of those items that are more closely linked with satisfaction.
3. Customer satisfaction results can help to monitor customer satisfaction results over time.
Quite simply, the same information gathered at different points in time can assist in
identification of trends and patterns that develop as an organization evolves and changes.
20

Online Satisfaction Survey
Furthermore, this can be helpful in demonstrating the levels of effectiveness of interventions,
services and so forth at particular points in history. What may work during a certain point in time
may not at another. This temporal collection and comparison of information allows for an
organization to adapt and modify services and products to meet the changing requirements of its
customers.
4. Customer satisfaction results can help to provide comparisons to other organizations.
Comparisons either within an organization by department or sub-group as well as with
outside agencies can provide a wealth of information. This includes not only structural and
organizational strengths and weaknesses, but also effectiveness of service components and
service delivery. This can assist in coordination of planned changes specific to each area, as
opposed to general, “blanket” approaches. Also, this can give a perspective of how one
organization is performing in relation to others, namely one’s competition. This gives the
customer the information necessary to make informed choices and selections.
5. Customer satisfaction results can help to determine the effectiveness of business practices.
Data gathered from customer satisfaction studies can provide valuable and accurate
information that can assist in evaluation of service components and delivery. Services can be
altered to become more effective, and business practices can be altered to meet the standards of
excellence within a certain business. In essence this is the comparison of a particular item against
a standard predetermined by the customer. Those scores above the standard are positive, while
those below are in need of improvement. This enables more thoughtful and considered
prioritization of any possible plans of action.
The message is clear: customer satisfaction is essential for the success – and continued
success – of any business. Not only does positive customer satisfaction help business, but also a
21
Online Satisfaction Survey
lack of satisfaction takes an even bigger toll on the bottom line. For an organization to remain
solvent, information regarding customer satisfaction must be adequately collected and analyzed.
Difficulties with Customer Satisfaction in Human Services
In 1986, Gibelman and Demone estimated that over half of all public service dollars were
spent on purchasing services (cited in Peat & Costley, 2000). The have also been increased calls
for accountability of outcomes and processes in the human services field (Bachman, cited in
Selber &, 2000). This includes pressures not only to measure quality services, but also to manage
them from a customer’s point of view (Moore, Kelly, & Lauderdale, 1998). This trend is likely to
continue and grow (Wagenheim & Reurnik, 1991). Project design in the human services field has
often has traditionally been based upon the medical model, but the customer-oriented shift has
expanded the roles and participation of customers (Selber & Streeter, 2000).
However, considerable difficulties arise from actually collecting customer satisfaction
information in the human service field. First, there are problems with defining the very
definitions, goals, objectives, and outcomes of human services. There are issues with a lack of
clarity from the initiation of the contract and conflicts between the funding source, service
provider, and identified clients (Paulson, 1988; Poertner & Rapp, 1985; Kettner & Martin, 1985).
Related to this is the fact that many services in this sector involve are highly complex and
individualized (Hasenfeld, cited in Selber & Streeter, 2000). Many are also carried out in crisis
situations. Simple definitions are not easily developed. Even when definitions are forwarded,
there remains the issue of which definitions, goals, objectives, and outcomes to select (Richard,
2000). It has been noted in the research literature that global measures are more common, but
tend to be less precise and more prone to inflated satisfaction due to social desirability (Lebow,
22

Online Satisfaction Survey
1982; Sanbourin, LaFeiriere, Sicuro, Coallier, Cournoyer, & Gendreau, 1989). Research suggests
that any measure of satisfaction in human services should be multi-dimensional (Richard, 2000).
Despite these obstacles, some dimensions of quality in human services have been
identified and include accessibility, continuity, timeliness, consistency, and efficiency (Bryant, et
al, 1998; Pruger & Miller, 1991). However, much of satisfaction research in human services is
based upon the dimensions of quality from the perspective of the professional (Heppner &
Claiborn, 1989). Further research (Tucker, Parker, Parham, Brady, & Brown, 1988) has shown
that there is a clear difference between the dimensions identified as important by the provider
and those by the customer. However, these are often moderated by other variables, as well.
These include socio-emotional factors, which refer to the interactions between the customer and
provider, and systems factors, which refer to the physical and technical processes of the
interaction. Other factors include socio-demographic factors, which refer to individual
characteristics of the customer and providers; health or situational factors; and family or
collateral influences, such as family or friends (Sharma, Durand, & Gur-Arie, 1981).
It is not only important to understand quality service from customer information, but also
who the customer actually is (Martin, 1993). There are often several levels of people involved –
for example, the perceived client, his/her family members, court officials, county agency staff,
provider staff and management of those agencies. It is also important to consider the interactions
between the customer and the provider in assessing satisfaction with service quality (Swan &
Bower, 1998). Therefore, in order to remain a sound organization within the human service field
– not only in provision to customers but also fiscally - it is recommended that an agency identify
and address a multitude of needs and perspectives (Richard, 2000; Danek, Parker, & Szymanski,
1991).
23

Online Satisfaction Survey
Agency Description and History
Professional Services Group, Inc. (PSG) is a private, for-profit social service agency
founded to provide consultations, as well as outpatient treatment to the mental health and drug
abuse service areas in the state of Wisconsin. It was incorporated in December of 1982 and
currently provides services in Kenosha, Racine, Marathon, Milwaukee, Portage, Eau Claire,
Wisconsin Rapids, Wood, and Trempealeau Counties. The goal and mission statement of PSG is
“to provide cost effective and innovative programming in the area of human services.” These
services currently include vocational, mental health, outpatient alcohol and other drug abuse,
group home alcohol and other drug abuse, delinquency intervention services, and assessment
services, both psychiatric and psychological.
PSG is recognized as an innovative organization known for its ability to work
successfully with difficult populations. A summary of the board-approved agency operational
goals follows:
1. To provide high quality and cost effective mental health outpatient services.
2. To provide high quality and cost effective alcohol and other drug abuse treatment
to individuals and families
3. To provide innovative and cost effective delinquency intervention services.
4. To continue to work with clients in vocational, educational, and work related
experiences. To make every effort to move these clients toward private sector and
non-subsidized employment.
5. To provide high-quality employee assistance programs and student assistance
programs.
24

Online Satisfaction Survey
6. To continue to innovate and experiment in an effort to provide cost effective and
high quality services.
7. To provide assessment services to the Job Center of Kenosha County.
8. To utilize the latest technology for treatment of delinquency.
9. To provide high quality and cost effective alcohol and other drug abuse treatment
in a group home setting.
Professional Services Group, Inc. strives to be an innovative and effective organization in
the social services field. In addition, the agency prides itself on providing better-than-expected
service to its customers and clients. As such, PSG needs to identify satisfaction elements in a
manner that is accurate, appropriate, and adequate.
The Current Process of Customer Satisfaction Information Collection
According to the Professional Services Group Supervisor’s Manual (2002), the process
for collecting Quality Assurance data is as follows. Program supervisors are responsible for
collecting quality assurance information on ten percent of the current cases. This involves a
thorough file review, a case manager survey, and a parent/guardian survey. These may be
collected either via telephone interview – which seems to be by far the most common method –
or face-to-face interview. For complete instruction, see Appendix C.
The instrument used to collect information regarding Customer and Client Satisfaction is
the Quality Assurance (QA) survey developed by Professional Services Group. According to the
agency’s Supervisor’s Manual, QA surveys are internal measures of customer and client
satisfaction, as well as evaluations of program processes. It is intended to “be used as a tool to
regulate the quality of services being provided to our clientele” (p. 26).
25

Online Satisfaction Survey
The Quality Assurance Survey is comprised of three separate but related sections. The
first section is known as the File Inspection. The purpose of this section is to ensure that
employees have maintained updated files and that the lead worker is familiar with all aspects of
the clients’ cases.
The second section is known as the Case Manager Survey. The purpose of this section is
to estimate the satisfaction a case manager has with the quality of services being offered. This is
collected as Customer Satisfaction data. This is the primary section for development in this
project.
The third section is known as the Parent Survey. The purpose of this section is to estimate
the degree of satisfaction parents have with the services being provided to their child. This is
collected as Client Satisfaction data.
For the purposes of continuity, the same or very similar questions are asked in both the
Case Manager and Parent Survey. General questions that were asked on both surveys were:
• Are you satisfied with the services from PSG?
• Are you satisfied with the written and verbal communication from PSG?
• Do you feel that you are being informed of necessary information?
• Do you feel that this program has helped the youth and family to be more successful?
• Is there anything we at PSG can do to make the program more successful?
However, each program has specific information needs and may have program-specific
questions.
Difficulties with the Current Process
The fundamental issues that define the purpose of this project have been identified in
previous research conducted by the author. Earlier analysis found customer and client
26

Online Satisfaction Survey
satisfaction data collected by agency staff to be problematic for several reasons (Davis &
Macomber, 2002). This analysis recommended development of a more standardized instrument
for collection of satisfaction data. An online version with both quantitative and qualitative
questions was recommended for customers, as they were more likely to have computers and
Internet access.
Some of the problematic issues with the current collection method may be corrected by
the development of a new survey. These problems include:
Response Rates. The choice whether or not to respond is always available. However,
lower response rates may be due to less investment in the validity of the instrument or questions
or in the utility of the results. Front-end involvement by both customers and agency staff may
facilitate better investment and support for the instrument. This may translate into improved
response rates.
Data Collection Methods. The lack of standardized collection and differences in those
collecting the data create a vast array of interactions and effects. Therefore, the researchers
suggest that the Quality Assurance process be redesigned and standardized in format. The
simplest method to achieve such an end is to provide a computerized or online version of the
satisfaction survey. This eliminates all of the effects of the individuals collecting the data.
The Questions. Finally, the closed-ended and often repetitive nature of current questions
suggests that an evaluation of importance and relevance may be necessary. The researchers
suggest that the organization make a concerted effort to improve the Quality Assurance Survey.
First, it would be important to clearly define the dimensions of satisfaction that the
organization and the customer find to be most important. This information should be integrated
into a prioritized list.
27

Online Satisfaction Survey
Finally, questions should be developed that address the essence of the information needs.
However, this requires a balance between depth and time spent in completion and analysis
Questions in a Likert-type format may be most practical.
28
Online Satisfaction Survey
CHAPTER TWO
PROBLEM STATEMENT
As identified in the Customer Satisfaction review, the importance of any agency
achieving and maintaining positive customer satisfaction is paramount to survival. As such,
Professional Services Group, Inc. is in need of an appropriate measure of satisfaction from its
primary source of customers. The instrument should be based on the definitions and priorities set
forth by both the administration and the program staff. This information needs to be adequately
detailed and useful for continuing satisfactory programming components and altering those that
are less than acceptable. In short, the tool must be a useful instrument for the detection of both
strengths and weaknesses in the organization, as well as possible suggestions for improvement or
alterations.
The method of acquiring this information from the customer sources needs to be both
easy to use and understand. The measure should ask appropriate questions to the intended
respondents – face validity, if you would. The method of collection should be straight- forward
and involve only the respondent and the measure. By incorporating technology, an online
instrument could fill the need.
This study is an investigation into one of the five identified gaps from the Met-
Expectations Model of customer satisfaction. As previously discussed, the basis of the model
states that service quality can be defined by the differences between the customer – external
elements - and the organization – internal elements. This is true of not only of the actual delivery
of a service, but also those perceptions and expectation of the service delivery and its
accompanying processes. Any differences, or gaps, can be used to identify the relative strengths
and weaknesses in service quality of an organization and assist in correction of any problems.
29

Online Satisfaction Survey
The specific gap that this project will investigate is known as the Expectations Gap. This
is the difference between customer expectations and management perceptions of customer
expectations. It is the internal agency being aware of the external expectations. It is important for
an organization to being clearly aware of what it is exactly that the customers expect in
comparison to its own. It is the vital first step in the process of developing an accurate measure
of customer satisfaction that is useful. From here, an organization is able to set organizational
standards, or benchmarks, that meet customer standards for service delivery. The next step in the
progression is identification of any gaps between the accepted standard and actual performance.
The final step is the use of this customer satisfaction information to implement effective changes
in organizational processes or components that please the customers, and add to the bottom line.
There are two types of information that this project will examine with respect to the
Expectations Gap. Both types may be used by the sponsoring agency to develop a current
understanding of its customers and their perceptions about satisfaction. First, data will be
gathered about the processes and methods involved in collecting customer satisfaction
information. This process-oriented information will provide a basis for the development of
adequate and appropriate measures of satisfaction. In addition, if those meet the preferences of
customers, the likelihood of collecting useful information is increased. Second, data will be
collected about the service dimensions and specific items that relate to quality service and
satisfaction. This information may allow the agency to maintain a clear understanding of not
only what is important to service, but also the requirements of customers. In addition, it can be
used to make the method and process not only efficient, but meet customer demands.
30

Online Satisfaction Survey
This study has attempted to identify the internal, organizational as well as the external,
customer-identified requirements of customer satisfaction. Differences, if present, can be
recognized and thereby reduced.
31

Online Satisfaction Survey
CHAPTER THREE
METHODOLOGY
Participants
Information for this study was collected and integrated from two primary sources of
participants. The first group of participants was considered an internal source, as these
individuals are employees of the sponsoring organization. The second group of participants was
considered an external source, as these individuals work for agencies outside of the sponsoring
organization. Participants were selected from employee lists made available to the researcher by
the sponsoring agency.
These were identified as two distinct comparison groups, as follows:
Internal Respondents: This comparison group was composed of staff members at three
levels from within the sponsoring organization, Professional Services Group, Inc, and
Community Impact Programs. The administration level includes the agency’s directors and
regional coordinators. This rank includes the top executives and the seat of organization power
for decision-making, program development and so on. The rationale for use of this subgroup is
simple- this is the project’s sponsor, and the results of the study will be used by these
individuals.
The second level of internal respondents included program supervisors and assistant
supervisors from Professional Services Group, Inc. and Community Impact Programs. The
rationale for the use of this subgroup is that many of these participants are the individuals that
directly oversee and sometimes provide the service of the organization. They may have
immediate use of results from satisfaction surveys in terms of program processes and outcomes.
32
Online Satisfaction Survey
The third level of internal respondents included direct service providers from
programming within Professional Services Group, Inc. and Community Impact Programs. The
rationale for inclusion of this subgroup is that these individuals are the immediate conveyers of
services to customers, clients, and families. Any information about what is and what is not
effective has evident bearing on job performance.
External Respondents: This comparison group included staff members from the Eau
Claire County Department of Human Services, Kenosha County Department of Human Services,
Racine County Human Services Department, and Trempealeau County Department of Social
Services. These agencies all presently contract with the sponsoring organization for services in
their respective communities. Quite simply, these are the customers. For this group, the
population was composed of staff members at three levels. The administration level includes the
agency’s directors and contract administrators. Similar to the internal group, this subgroup
wields the power to form and end contracts for services.
The second level of external respondents included program supervisors and managers
from these four customer agencies. The rationale for the use of this subgroup is that many of
these participants directly oversee authorization of services being provided by the sponsoring
organization.
The third level of external respondents included direct service providers from the
customer agencies. This subgroup has the most immediate and frequent contact with the
sponsoring organization’s personnel. The clients and families that are receiving services are
common to both respondent groups at this level in particular.
33

Online Satisfaction Survey
Instrumentation
The instrument for collecting customer satisfaction data in this study was developed by
the author. The measure is a modification of other instruments that are used to collect customer
satisfaction information. It consisted of 41-items, including a three demographic items for
comparison purposes, five questions about the process of customer satisfaction, and 33 service
dimension statements. Possible responses are provided for each question.
The first step in development of this instrument involved the development of simple
demographic items that could be used for comparison purposes without identifying respondents.
It was necessary to distinguish those internal as well as external to the sponsoring organization.
In addition, it was important to determine the level or position of the participant within the
organization. The purpose is to determine whether any differences exist between levels in terms
of customer satisfaction information. A third item inquired on the length of time in the current
position, the purpose being to determine if job experience has any affect.
The second step in development involved questions about the process of collecting
customer satisfaction information. The purpose of these questions was to determine participant
feelings about the collection of customer satisfaction information. It was intended that these
items generate information to be used in development of an accepted and efficient measurement
tool and process of data collection. From this, five items were generated. Respondents were
asked to rate the general importance of collecting customer satisfaction information. Another
item asked respondents to rate the quality of the current method of collecting information as used
by the sponsoring organization. In order to get more specific preferences for methodology and
time investment for customer satisfaction data collection, respondents were asked to identify the
best method for this and the amount of time adequate for that purpose. A fifth item was added at
34

Online Satisfaction Survey
the request of the sponsoring organization. This item asked if respondents had ever held back
negative information about customer satisfaction. The sponsoring organization had concerns that
the information currently collected has not always been completely forthright due to concerns by
customers for jobs being effected as a result.
The third step in development was the aggregation of service dimension items. These
were collected from the SERVQUAL instrument, the suggested measure forwarded by
Sureshchander, Rajendran, and Kamalanabhan (2001), and from various program descriptions
provided by the agency. Any modifications that were needed to keep the item consistent with
human services were also made at this time. The initial contained 72 potential items within 17
different dimensions. For a complete list of all items and dimensions, see Appendix D.
The final step in the development of the instrument involved pooling similar items
together into comparable dimensions. For example, many of the service dimensions suggested by
the agency description could rationally belong under the dimension of tangibles, core service, or
systematization of service delivery. Therefore, all of these items were clustered into one new
dimension – tangibles. In addition, any repetitive or duplicated items were also removed from the
item pool. In addition, any modifications needed were made to keep items consistent to human
services. The final pool was reviewed by the project sponsors and approved for use. The final
collection consisted of 33 items. For a list of the final service quality dimensions and items, see
Appendix E.
Each service dimension item is presented as a structure statement. Participants were
asked to rate the importance of each item toward a measure of customer satisfaction. Each item
dimension was rated using a seven point Likert-type response format, with semantic anchors of
“Not Important” at 1 to “Very Important” at 7. See Appendix F for a copy of the instrument.
35

Online Satisfaction Survey
Procedure
The procedure for this project involved two steps. The researcher sent out an individual
email message to each participant regarding the purpose and nature of the project. In addition,
this document contained the informed consent elements that describe the potential benefits and
risks, safeguards, confidentiality, voluntary nature of participation, and so forth. This message
included a link to the actual online survey.
The introduction to the instrument briefly repeated the purpose of the project with the
elements of informed consent regarding voluntary participation, confidentiality, potential
benefits and risk. The participant was informed that submission of the survey was considered
consent to participate in the project.
One week after the survey instrument was sent the researcher sent a reminder email
message individually to each participant. The purpose of this message was to prompt return of
the surveys by the end of data collection. As there are no identifying questions on the instrument,
the researcher had no knowledge of who had completed the survey. Therefore, this notice was
sent to all participants.
Data from the responses were conveyed to an Excel database for conversion to an SPSS
database. All of the data was entered into SPSS for analysis procedures.
36

Online Satisfaction Survey
CHAPTER FOUR
RESULTS
The Online Satisfaction Surveys were collected from April 2 through April 18, 2003. A
total of 93 surveys were sent to potential participants in six separate agencies. Of these, 59
surveys were collected, for a response rate of 63.4 percent. Of the 52 surveys sent to staff
members of the internal agencies, a total of 33 surveys were collected for a response rate of 63.5
percent. Of the 41 surveys sent to staff members of the various external customer sources, 26
surveys were collected for a response rate of 63.4 percent.
An alpha level of .05 was used for all statistical tests.
Demographic Items
Respondents by Current Position
Respondents were asked to report their current position held in their agency or
organization. See Figure 1 for a representation of the responses.
37

Online Satisfaction Survey
38
Figure 1: Current Position
21.2
36.4
42.4
15.4
3.8
80.8
0
10
20
30
40
50
60
70
80
90
100
Administration Supervisory Direct ServiceCurrent Position
InternalExternal

Online Satisfaction Survey
The figure shows that internal and external groups are similar in the percentage of
respondents identifying themselves in an administrative position. However, large differences
exist between percentage of internals who report their position as supervisory and external
respondents. A large difference was also evident at the direct service position, except more
external respondents indicated this as their current position.
Chi-square tests were conducted to determine whether any difference existed between the
two groups in terms of position. The only significant difference was found between internal and
external respondents at the supervisory level (x2 (1, N=13) = 9.308, p=.002).
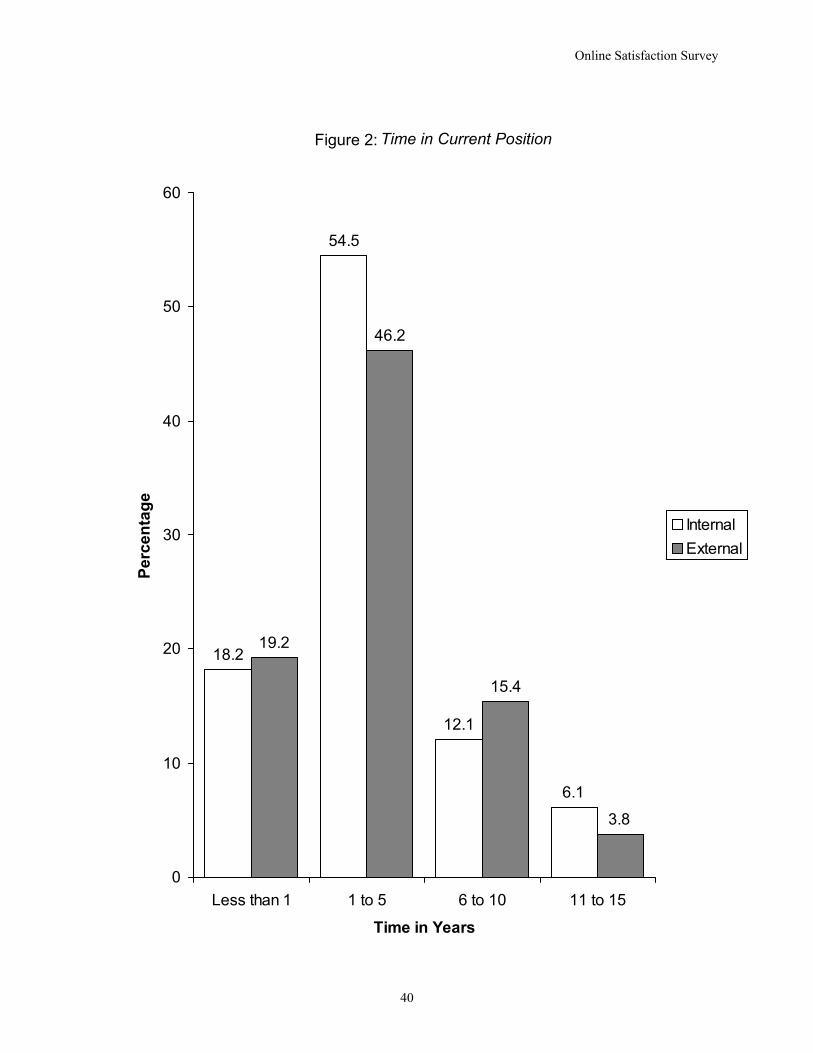
Total Years in Current Position
Respondents were asked to report the total years in their current position. See Figure 2 for
a representation of the responses.
39
Online Satisfaction Survey
40
Figure 2: Time in Current Position
18.2
54.5
12.1
6.1
19.2
46.2
15.4
3.8
0
10
20
30
40
50
60
Less than 1 1 to 5 6 to 10 11 to 15
Time in Years
Perc
enta
ge
InternalExternal

Online Satisfaction Survey
The majority of both groups have held their current positions between one and five years.
For each category, similar percentages have been identified for both respondents groups.
Chi-square tests to determine any differences between the internal and external
respondent groups in terms of job experience were non-significant.
Process Items
General Importance of Collecting Customer Satisfaction Information
All respondents were asked to rate the general importance of collecting customer
satisfaction information. Internal respondents had a mean rating of 5.48 for importance, while
external respondents had a mean rating of 5.00.
Independent means t-tests were conducted to determine if there was a difference between
these groups in their importance ratings. No significant difference was found
One-sample t-tests were conducted for each group to determine if the mean rating was
significantly different than a neutral rating. Results indicated that both the internal group
(t(32)=5.137, p=.000 (two-tailed), d=1.48) and the external group (t (25)=3.407, p=.002 (two-
tailed), d=1.00) rated the general importance of collecting customer satisfaction significantly
greater than neutral.
Current Method of Collecting Customer Satisfaction Information Participants were asked to rate the current method of collecting customer satisfaction
information used by the sponsor agency. Internal respondents had a mean rating of 3.15 for the
current method while externals had a mean rating of 3.38.
Independent means t-tests conducted to determine if a difference existed between groups
found no significant difference.
41
Online Satisfaction Survey
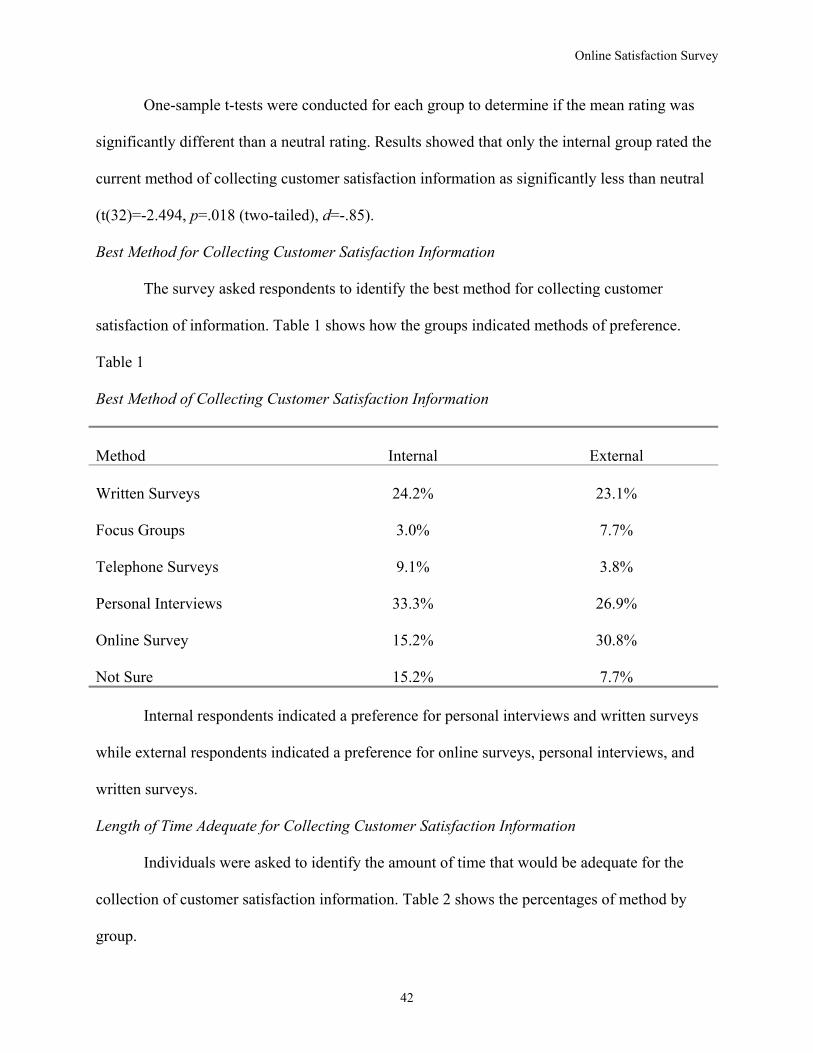
One-sample t-tests were conducted for each group to determine if the mean rating was
significantly different than a neutral rating. Results showed that only the internal group rated the
current method of collecting customer satisfaction information as significantly less than neutral
(t(32)=-2.494, p=.018 (two-tailed), d=-.85).
Best Method for Collecting Customer Satisfaction Information
The survey asked respondents to identify the best method for collecting customer
satisfaction of information. Table 1 shows how the groups indicated methods of preference.
Table 1
Best Method of Collecting Customer Satisfaction Information Method
Internal
External
Written Surveys
24.2%
23.1%
Focus Groups
3.0%
7.7%
Telephone Surveys
9.1%
3.8%
Personal Interviews
33.3%
26.9%
Online Survey
15.2%
30.8%
Not Sure
15.2%
7.7%
Internal respondents indicated a preference for personal interviews and written surveys
while external respondents indicated a preference for online surveys, personal interviews, and
written surveys.
Length of Time Adequate for Collecting Customer Satisfaction Information
Individuals were asked to identify the amount of time that would be adequate for the
collection of customer satisfaction information. Table 2 shows the percentages of method by
group.
42

Online Satisfaction Survey
Table 2
Length of Time Adequate for Collecting Customer Satisfaction Information Time
Internal
External
Less than 15 Minutes
72.7%**
69.2%**
15 to 20 Minutes
12.1%
19.2%
As Long as Necessary
15.2%
11.5%
** p<.01
Chi-square tests were conducted to determine any significant differences either between
or within groups on this item. No significant differences were found between the two groups.
However, both internal respondents (x2 (2, N=33) = 23.091, p=.000) and external respondents
(x2 (2, N=26) = 15.308, p=.000) indicated that less than 15 minutes time is adequate for
collecting customer satisfaction information, significantly more often than the other choices.
Held Back Negative Customer Satisfaction Information for Concern of Job Affects
Respondents were asked whether or not they had ever held back negative customer
satisfaction information out of concern for another’s job being affected. See Table 3 for the
results. Note that the “not applicable” response was treated as missing and not included
Table 3
Having Held Back Negative Customer Satisfaction Information Response
Internal
External
Yes
12%
19.1%
No
76%**
76.2%**
Not Sure
12%
4.7%%
**p<.01
43

Online Satisfaction Survey
Chi-square tests were conducted to determine any significant differences either between
or within groups on this item. No significant differences were found between the two groups on
any response.
However, results demonstrated that significantly more respondents in both the internal
and external groups indicated that they had not held back negative customer satisfaction
information out of concern for job effects [(x2 (2, N=25) = 20.480, p=.000) and (x2 (2, N=21) =
18.000, p=.000), respectively].
Customer Service Dimensions and Items
The bulk of the survey included specific items for each of the six service dimensions.
Respondents rated the importance of each item in relation to customer satisfaction. The specific
items were summed to obtain a mean rating on the dimension. In addition, the service dimension
means were summed to obtain a mean overall satisfaction rating.
Overall Customer Satisfaction Importance
The overall customer satisfaction ratings are the summation of every specific item under
each of the six service dimensions. It is intended to be a generalized score of the importance of
these service dimension and items perceived by each group.
Internal respondents had a mean importance rating of 6.28 while external respondents
had a mean rating of 6.29. Independent t-tests revealed no significant difference between the
groups in rating of overall customer satisfaction.
Tangibles Dimension
This service quality dimension involves the appearance of physical facilities, equipment,
materials, and personnel of the organization. Table 4 shows the mean ratings of importance for
internal and external respondents for the dimension and each specific item.
44

Online Satisfaction Survey
Table 4
Tangibles Dimension and Specific Item Mean Ratings of Importance
Dimension / Item
Internal
External
Tangibles Dimension
6.02
5.83
• Adequate and Necessary Facilities and Equipment
5.55
5.69
• Employees with Neat, Professional Appearance
5.61
5.50
• Quality of Materials, Groups, Activities
6.24
6.15
• Diversity and Range of Services
6.24
5.92
• Intensity and Depth of Service*
6.39
5.80
• Service Innovation*
5.94
5.23
• Convenient Hours to Customers, Clients, and Families*
6.18
6.62
*p<.05
Overall, internal respondents identified the Tangibles dimension and most of the specific
items higher than did external respondents. Independent-samples t-tests were conducted to
determine whether any difference existed between the internal and external groups in either the
dimension or any specific item. No significant difference was found between groups on the
dimension.
However, significant differences were found between for three specific items of the
Tangibles Dimension. Internal respondents rated the items Intensity and Depth of Service
(t(57)=2.242, p=.029, d=.59) and Service Innovation (t(57)=2.364, p=.022, d=.71) as more
important than external respondents. For Convenient Hours to Customers, Clients, and Families,
external respondents rated this item higher than internals (t(57)=-2.108, p=.039, d=-.43).
45

Online Satisfaction Survey
Service Delivery Dimension
This dimension of service quality refers to the processes, procedures, systems, and
technology that make service efficient and effective. These are the appreciable features of the
service being delivered. Table 5 displays the mean ratings of importance for the dimension and
specific items.
Table 5
Service Delivery Dimension and Specific Item Mean Ratings of Importance
Dimension / Item
Internal
External
Service Delivery Dimension
6.23
6.49
• Efficient Referral and Intake Process
5.97
6.31
• Explanation of Program Services and Expectations to Customer,
Client, and Family
6.18
6.54 • Identification of Resources and Needs of Client and Family
6.24
6.40
• Appropriate Services and Delivery Based on Needs of Client and
Family
6.48
6.44 • Adequate Client Contacts
6.48
6.72
• Adequate Family Contacts
6.16
6.52
External respondents rated this dimension and each specific item higher than did internal
respondents. However, independent samples t-tests conducted to determine whether any
difference existed between the internal and external groups in either the dimension or any
specific item revealed that no significant differences were found between groups on either the
dimension or for any item.
46

Online Satisfaction Survey
Reliability Dimension
This quality dimension involves the consistent, dependable, and accurate delivery of
promised services. Table 6 represents the mean ratings for this dimension and items.
Table 6
Reliability Dimension and Specific Item Mean Ratings of Importance
Dimension / Item
Internal
External
Reliability Dimension
6.34
6.45
• Providing Services as Promised
6.67
6.72
• Dependability in Handling Service Problems
6.53
6.48
• Providing Services at Promised Time or in a Timely Manner
6.41
6.56
• Availability and Accessibility of Staff
6.53
6.44
• Adequate Written Communication
5.61
6.04
• Adequate Oral Communication
6.41
6.44
External respondents rated this dimension and most items higher in importance than did
internal respondents. Independent-samples t-tests were conducted to determine whether any
difference existed between the groups in either the dimension or any specific item. No significant
differences were found.
Responsiveness Dimension
This dimension of service quality encompasses those aspects of personnel that
demonstrate a willingness of an organization to help customers and provide prompt service. See
Table 7 for a display of the responses.
47
Online Satisfaction Survey
Table 7
Responsiveness Dimension and Specific Item Mean Ratings of Importance
Dimension / Item
Internal
External
Responsiveness Dimension
6.48
6.42
• Willingness to Respond to Questions or Concerns
6.53
6.42
• Prompt and Timely Service to Customers, Clients and Families
6.47
6.58
• Helpfulness and Courteousness
6.53
6.42
• Fast Correction of Service Problems
6.41
6.27
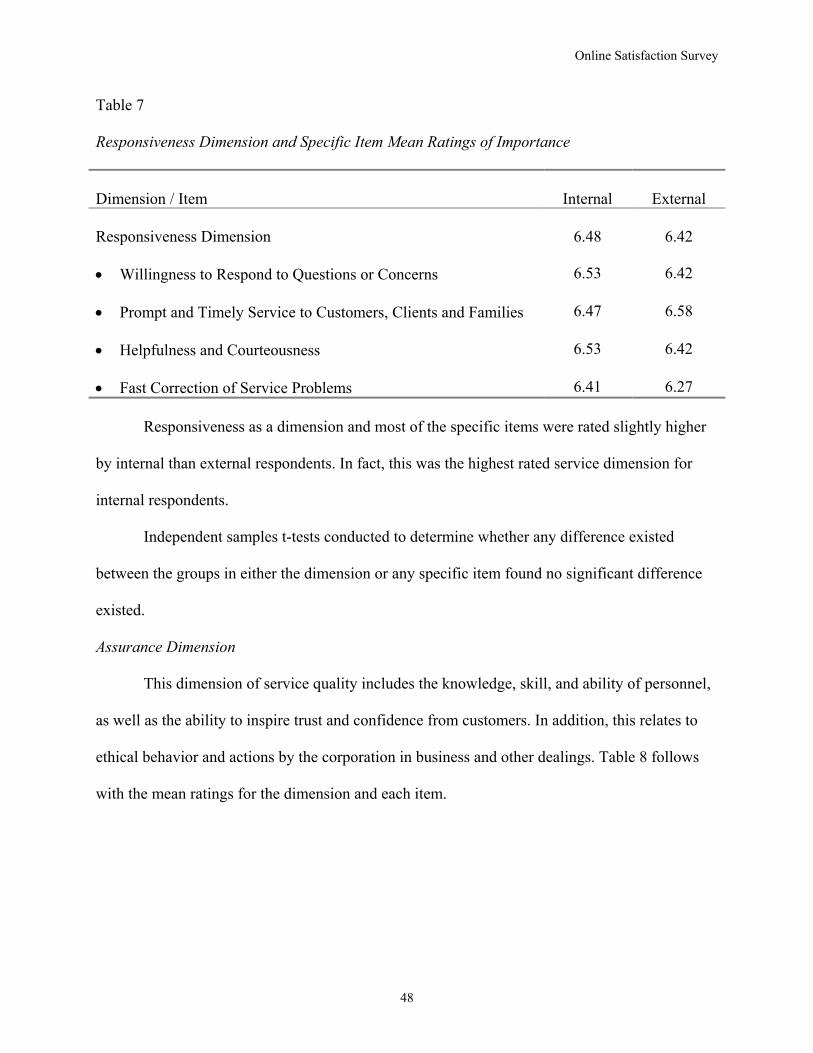
Responsiveness as a dimension and most of the specific items were rated slightly higher
by internal than external respondents. In fact, this was the highest rated service dimension for
internal respondents.
Independent samples t-tests conducted to determine whether any difference existed
between the groups in either the dimension or any specific item found no significant difference
existed.
Assurance Dimension
This dimension of service quality includes the knowledge, skill, and ability of personnel,
as well as the ability to inspire trust and confidence from customers. In addition, this relates to
ethical behavior and actions by the corporation in business and other dealings. Table 8 follows
with the mean ratings for the dimension and each item.
48

Online Satisfaction Survey
Table 8
Assurance Dimension and Specific Item Mean Ratings of Importance
Dimension / Item
Internal
External
Assurance Dimension
6.39
6.47
• Accuracy and Confidentiality
6.66
6.77
• Competence of Management
6.55
6.54
• Knowledge, Skills, and Abilities of Personnel
6.55
6.73
• Ethical Conduct
6.70
6.62
• Organization as a Good Corporate Citizen
5.70
5.85
• Regular Collaboration with Customers, Clients, Families and/or Other Providers
6.30
6.31
External respondents rated the dimension as well as a majority of items slightly higher in
importance tin comparison to internal respondents. In addition, both groups rated one item in this
dimension – Accuracy and Confidentiality – above all others in terms of importance.
Independent-samples t-tests were conducted to determine whether any difference existed
between the internal and external groups in either the dimension or any specific item. No
significant difference was found between groups on either the dimension or for any item.
Empathy Dimension
This dimension of service quality relates to the level of caring and individualized
attention that personnel provide to customers and clients. Table 9 shows the mean ratings for this
dimension and each item.
49

Online Satisfaction Survey
Table 9
Empathy Dimension and Specific Item Mean Ratings of Importance
Dimension / Item
Internal
External
Empathy Dimension
6.39
6.27
• Empathetic to Customers, Clients, and Families
6.30
6.19
• Advocacy and Support for Client and Family
6.36
6.35
• Individualized Attention to Customers, Clients, and Families
6.42
6.24
• Equal Treatment to Customers and Clients
6.44
6.38
Internal respondents rated the overall dimension and each specific item higher than did
external respondents.
However, no significant differences were detected between groups on either the
dimension or any specific item in independent samples t-tests conducted
Service Dimension Ratings
The internal and external respondent groups had different rankings of the importance of
individual service dimensions. The results are presented in Tables 10.
50

Online Satisfaction Survey
Table 10
Group Rankings of Service Dimension Importance Rank
Internal
External
1
Responsiveness
Service Delivery
2
Assurance
Assurance
3
Empathy
Reliability
4
Reliability
Responsiveness
5
Service Delivery
Empathy
6
Tangibles
Tangibles
Internal and external groups have similar rankings for two dimensions. Both groups rated
Assurance as the second most important dimension and Tangibles as the least important
dimension. On every other dimension, the two groups differ. Internal respondent rated
Responsiveness as the most important while external respondents identified Service Delivery as
the most important dimension.
Paired samples t-tests were conducted to determine if there were differences within
groups on service dimension ratings. There were several significant differences between
dimensions within each respondent group.
Internal respondents showed several significant differences between service dimensions.
The results are as follows:
• Responsiveness was rated significantly higher than Tangibles (t(31)=-2.469, p=.019).
• Assurance was rated significantly higher than Tangibles (t(30)=-5.897, p=.000).
• Empathy was rated significantly higher than Tangibles (t(31)=-4.181, p=.000).
• Reliability was rated significantly higher than Tangibles (t(31)=-4.150, p=.000).
51

Online Satisfaction Survey
• Service Delivery was rated significantly higher than Tangibles (t(31)=-3.951, p=.000).
• Reliability was rated significantly higher than Service Delivery (t(29)=-2.162, p=.039),
• Responsiveness was rated significantly higher than Service Delivery (t(30)=-2.674,
p=.012).
There were no other significant differences found.
External respondents showed several significant differences between service dimensions. The
results are as follows:
• Service Delivery was rated significantly higher than Tangibles (t(23)=-5.140, p=.000).
• Assurance was rated significantly higher than Tangibles (t(23)=-4.151, p=.000).
• Reliability was rated significantly higher than Tangibles (t(24)=-3.167, p=.004).
• Responsiveness was rated significantly higher than Tangibles (t(24)=-4.351, p=.000).
There were no other significant differences found.
52
Online Satisfaction Survey
CHAPTER FIVE
DISCUSSION
Summary
This study was an investigation of one of the five identified gaps from the Met-
Expectations Model of customer satisfaction. The basis of this model states that service quality
can be defined by the differences between the customer – external elements - and the
organization – internal elements. This is true of not only of the actual delivery of a service, but
also those perceptions and expectation of the service delivery and its accompanying processes.
These gaps can be used to identify the relative strengths and weaknesses in service quality of an
organization and assist in correction of any problems.
The specific gap that this project investigated is known as the Expectations Gap. This is
the difference between customer expectations and management perceptions of those
expectations. Businesses need to maintain a clear awareness of its customers’ demands. The
smaller this gap is the more likely that an organization can adequately meet the needs of its
constituency. This project examined the internal and external ratings of the importance of
specific items regarding quality service in the human service realm.
Two types of information were examined in this project with respect to the Expectations
Gap. First, data was collected regarding the processes and methods involved in collecting
customer satisfaction information. Process-oriented information provides a foundation for the
development of adequate and appropriate measures of satisfaction. In addition, if these measures
meet the preferences of customers, the likelihood of collecting useful information is increased.
Second, data was collected regarding the service dimensions and specific items that relate to
quality service and satisfaction. This information may allow the agency to maintain a clear
53

Online Satisfaction Survey
understanding of not only what is important to service, but also the requirements of customers. It
can also be used to make the method and process not only efficient, but meet customer demands.
The results suggested that the Expectations Gap, with few exceptions, does not exist
between the organization and its customers. The individuals from the business and from the
customers who participated in this study were similar in both their ratings of the process-oriented
items and the service dimension and specific items in achieving customer satisfaction. This may
be good news for the sponsoring agency. There is no business – customer gap. There are,
however, several interesting findings worthy of commentary.
Process Items
General Importance of Collecting Customer Service Information
Both groups rated the importance of collecting customer satisfaction significantly above a
neutral rating. This result suggests that customers and organizational staff alike recognize the
inherent value in collecting and using satisfaction information in the improvement of service
quality. The potential impact of this finding is that this appreciation by customers may relate to
improvement in response rates to the processes and methods employed.
Current Method of Collecting Customer Service Information
There were two noteworthy findings regarding the current method of collecting customer
satisfaction information. First, both groups rated the present method and process employed by
the organization below the neutral point. This suggests that neither those internal nor external to
the organization are satisfied with the process as it currently exists. Second, internal respondents
were significantly below the neutral rating of the current method. The importance of this finding
is that those who are collecting much of the satisfaction information may not feel that the method
employed is effective. This may in turn influence how or how well this information is actually
54

Online Satisfaction Survey
collected. These findings suggest the sponsoring agency may need to consider exploration of
changes in methodology that is more acceptable to both customers and staff members. The
potential impact of this finding is that better methods may result in refined processes of
collection of satisfaction information by internal staff members and improved response rates by
customers.
Best Method of Collecting Customer Satisfaction Information
Regarding the best method of collecting customer satisfaction information, two findings
stand out. First, neither group identified the current method being utilized – telephone surveys –
as the most popular choice. In fact, for the external respondents, it was the least frequently
chosen method. The second point the results demonstrate is that external participants most
frequently indicated online survey as the preferred selection. The results again suggest the
organization review and modify current methods of data collection.
Length of Time Adequate for Collecting Customer Satisfaction Information
A majority from both groups identified fifteen minutes or less as adequate time to collect
customer satisfaction information. This suggests that the process and method utilized should be
time-efficient. This underscores the results from the previous item, as online surveys can often
collect a wide variety of information in a relatively short amount of time.
Having Held Back Negative Customer Satisfaction Information
The majority of both internal and external respondents identified that they had not held
back negative customer satisfaction information. At face value, this suggests that the information
collected about customer satisfaction is honest. However, it is possible that the response is an
issue of social desirability.
55

Online Satisfaction Survey
Service Dimensions and Items
There were few differences between the internal and external groups for mean ratings of
importance for either service dimensions and specific items related to quality service and
customer satisfaction. However, the groups did rate the particular dimensions differently. The
two groups had differences between the rankings by mean score for the six service dimensions.
In particular, the groups differed on the most important service dimension.
Most Important Service Dimension
Customers rated the dimension of Service Delivery most important. This dimension
relates to the actual provision of services to the customer by the organization. This may be a
result of the issue of service delivery being the most immediate and discernible indication of
business between the organization and the customer. It relates directly to satisfaction with service
meeting expectations. As such, it would seem to be most important to the customer.
Internal respondents rated the Responsiveness dimension most important. This dimension
relates to performance and quality of the delivery of service. Since this essentially relates to how
well one carries out the job, it follows that this dimension would be most important to those
within the organization.
Similarities with Service Dimensions
Both groups rated the Assurance dimension second highest in importance. There are
possible explanations for this for both groups. First, customers would like to be confident that the
business is going to provide services as expected in an expected manner. This is the issue to
which Assurance speaks. This dimension is important because customers demand that businesses
inspire trust, confidence, and continued patronage from them.
56

Online Satisfaction Survey
Second, personnel from the organization want to feel not only effective as individuals
but also in terms of performance. Assurance relates to issues of the knowledge, skills, and
abilities of staff, and the ability to inspire the trust and confidence of customers. This appears to
link to self-esteem and self-efficacy. Therefore, this dimension would be viewed as important
within the organization as it relates to performance.
An interesting note is that one specific item in the Assurance dimension, Accuracy and
Confidentiality, was the highest rated item above all others for both groups. This suggests that
both groups may naturally hold precision and client privacy in high regard and priority, as it is
held in the human service field.
However, another possible explanation from the current timeframe is the fact that the
federal government enacted strict guidelines regarding confidentiality during the data collection
phase. These regulations, known as HIPPA (Health Insurance Privacy and Portability Act)
Protocols, came into effect for both internal and external organizations during the middle of data
collection. These high importance ratings may simply be a result of this recent history.
Both internal and external groups rated the Tangibles dimension of least importance. This
may suggest that neither group rated as much importance in appearances of staff, materials, and
equipment, and so on as they do to processes and interactions. Simply, it is not necessarily what
the business has, but how it performs.
However, significant differences were only found on three specific items in this service
dimension. The first was Intensity and Depth of Services, with internals rating this more
important than externals. This may be due to this being related to performance standards.
Personnel of the organization are those being rated. It is a matter of who is delivering the service
(internal) and not who is receiving (external). Thus, it would seem logical that internal
57

Online Satisfaction Survey
respondents would find this more important than customers as it relates directly to their job
performance.
The second item was Service Innovation, with internals rating this item more important
than externals. This seems to be in keeping with the sponsoring agency’s mission for providing
innovative services. Organizational staff may have internalized the agency’s mission statement.
It is interesting to note that this item was the least important item of all to external respondents.
This suggests that quality services, provided as expected, are more important to customers than
innovation.
The third significant difference between respondent groups was for the item Convenient
Hours to Customers, Clients, and Families. In this case, customers rated this item more important
than did internal staff members. A possible explanation for this result is that convenience is a
central issue in customer satisfaction. It is an issue of providing a service when it is demanded or
in a timely manner.
Similarities and Differences with Previous Research
These results share similarities and differences with previous research. One apparent
similarity is the successful use of a version of the SERVQUAL measure of customer satisfaction.
The measure has been extensively tested in a wide variety of service firms, including human
service agencies (Grapentine, 1999; Selber, as cited in Selber and Streeter, 2000). Coefficient
alpha ratings have exceeded 0.70 in the research (Grapentine, 1999). Despite this evidence, there
still has been criticism of the dimensions of SERVQUAL and other dimensions have been
suggested in the research literature (Cronin & Taylor, 1994; Babakus & Boller, 1992; Carman,
1990).
58
Online Satisfaction Survey
The online survey developed for this project was a modification of the original
SERVQUAL instrument. It included many of the original items, along with adaptations of
several as well as additional items from research literature regarding service quality and human
service. The results suggest that this instrument does indeed measure many of the specific
dimensions and specific items that relate to customer satisfaction in human services. This would
be true of both the original items and the suggested revisions from the research literature.
In one-sample t-tests conducted to determine whether the dimensions or items were rated
significantly higher than neutral, each of the six service dimensions and all of the 33 items were
rated significantly above neutral. The alpha coefficient for the specific dimensions was 0.8673
while for items it was 0.9247. Taken in total, this suggests that the instrument performed
similarly as SERVQUAL in other research.
Another similarity from this project to previous research is the difference between the
service dimensions identified as important by the organization and the customer. Although there
were no significant differences between the importance ratings for the dimensions, the rank order
of these did differ. It would seem that while internal and external groups may agree on the
importance of the dimensions, there is a contrast in terms of their importance relative to one
another. This finding is congruent with previous research (Tucker, Parker, Parham, Brady, &
Brown, 1988).
The major difference in this project to others has been its nomothetic approach. Most of
the gap-analyses of customer satisfaction have been ideographic in nature. Ideal models are
applied on an individual, customer-by-customer basis. However, due to issues of client
confidentiality, logistical constraints, and resource limits, the organization has opted to develop
and apply an aggregate approximation approach.
59

Online Satisfaction Survey
Another difference in this project from the research literature has been the respectable
response rate using a type of written survey. Research states that poor response rates are a
disadvantage of using of this method of collecting customer satisfaction (Leland & Bailey,
1995). However, response rates for this project were over 60 percent overall and for both internal
and external respondents.
Cautions and Limitations
Although the respondent groups in aggregate appear to be very similar, it is possible that
these two groups may differ. The respondents as groups were essentially the same in terms of
response rates and the time of position. However, there were significant differences in the current
positions of the respondents. The internal respondent group had more in the administrative and
supervisory level and fewer in the direct service level than did the external respondent group.
Despite this difference, this was more likely a function of sampling and not response rate.
The internal sample was taken from an organization-provided email listing. These were limited
to those primarily in supervisory and administrative positions. In contrast, the customer-provided
email lists consisted primarily of direct service providers.
Another limitation relates to the samples from the customer agencies. These were often
small portions of the entire agency’s personnel. It may be possible that this truncated population
may explain the results.
In addition, the results may be an artifact of non-response bias. Although the response
rates were respectable, over one-third of potential respondents chose not to complete the survey.
Those who did not respond may have had very different responses than those that did.
The use of a written survey for collection of data has common shortcomings. The
potential respondents need to be reasonably literate to comprehend the survey and also attend to
60

Online Satisfaction Survey
every item. While it may be assumed that the sampled individuals meet the literacy requirement,
it may not be true that each question was carefully attended. There may have been some
respondents that decided to select the same answer regardless of the item. This would influence
the results.
Another limitation with the instrument was the exclusive use of closed-ended items. This
is an issue not of what is there, but what may be missing. There was a limited range of responses.
Open-ended items may have provided much more information.
Although the results show that all service dimension items were deemed important to
customer service, the list may still be far from complete. There may be items that are also
applicable and worthy of consideration that were either not included or recognized by the author.
This, too, may have been addressed with open-ended items.
Another limitation is the use of global measures of customer satisfaction. Many services
in this human service are highly complex and individualized. Additionally, it has been noted in
the research literature that global measures tend to be less precise and more prone to inflated
satisfaction due to social desirability. The survey may best be used for general purposes of an
organization’s customer satisfaction collection, but much of its business is done on a case-by-
case basis.
A final limitation is the lack of validation. Simply refining a process or tool without any
connection to the organizational goals and objectives is wasteful of resources. To have items of
satisfaction that correlate little, if at all, with the objectives of the programming, provides
meaningless information with little connection to the “bottom line”. The criterion validity of the
instrument must be established. It is essential to link any measure of satisfaction with the
summative outcomes of the business, program, or project. These outcomes for this organization
61
Online Satisfaction Survey
could be both treatment-related goals, such as client success rates, and more business-related,
such as customer loyalty and retention. This connects satisfaction with the indicators of success
for the business, thereby allowing for more informed decision making about implementing
changes, adjustments and so forth.
Recommendations for Application
Developing a valid and reliable tool for collecting customer satisfaction information
involves several steps. It is a shaping process that entails integration of the expectations,
perceptions, and requirements from sources internal and external to the organization. The
information must provide an accurate reflection of the elements that define quality service and
relate directly to goals and objectives that determine success. Optimally, any gap-based measure
of satisfaction would be individually based in terms of service delivered and customer served.
However, the current online survey would probably best serve the information needs for the
sponsor agency about global customer satisfaction. This is in keeping with organizational
preferences noted earlier.
As discussed early, once an organization has clearly identified the customers’
expectations, it becomes necessary to develop standards for quality service. The organization
will need to align its criteria for quality service and treatment and business objectives in relation
to customer expectations. This synchronization will help to determine the minimally acceptable
levels of performance for the specific items. These benchmarks are gauges of performance that
directly relate to customer satisfaction. Meeting these standards results in customer satisfaction.
Failure to do so results in dissatisfaction. In either case, this will provide the organization with a
set of rules by which to measure customer satisfaction based upon customer requirements and
still remain within contractual specifications. In addition, this will provide useful information for
62

Online Satisfaction Survey
the sponsor agency to adjust or improve program components, elements, and processes. The
results from this project can be the necessary foundation for this action.
Any method that is used to collect customer satisfaction information should meet an
organization’s informational needs, but adhere to preferences identified by its customer base.
These preferences include fundamental questions of actual manner of collection and time
involved. Using a process or tool that customers favor is more likely to garner not just support,
but responses. This project demonstrated that a majority of customers indicated a propensity for
online surveys, personal interviews and written surveys over other methods. Furthermore, a
majority indicated that the amount of time adequate for collecting satisfaction information is
fifteen minutes or less. This suggests that an online survey may be the best choice, as personal
interviews are often more time consuming. In addition, a fairly large number of items can be
included that gather a large array of useful information and remain within time constraints.
Another recommendation would be the inclusion of more open-ended items on any
measure of customer satisfaction. There may be rich information lost if the opportunity to share
more in-depth responses is not available. However, these should be used with care, with
consideration of limitations on response length. This not only will keep completion time at
adequate levels, but also keep the data manageable.
In conclusion, this project provided an intriguing opportunity to collect and analyze
information from both sides of the same coin – the business and the customer. The goal was to
identify the gaps – if any – between the two regarding the important elements of quality
customer service in the human service field. This project produced several thought-provoking
results. These suggest that that few differences exist, which may be reassuring.
63

Online Satisfaction Survey
REFERENCES
Anderson, K. & Zemke, R. (1998). Delivering knock your socks off service. New York:
AMACOM.
Babakus, E. & Boller, G.W. (1992). An empirical assessment of the SERVQUAL scale. Journal
of Business Research, 24, 253-268.
Berry, L.L. (1980). Service marketing is different. Business, 30, 24-29.
Bryant, C.; Kent, E.B.; Lindenberger, J.; Schreiher, J.M.; Canright, M.W.; Cole, S.; Uccellani,
V.; Brown, C.A.; Blair, R.C.; Bustillo-Hernandez, M.M. (1998). Increasing consumer
satisfaction. Marketing Health Services, 18, 4-18.
Carman, J.M. (1990). Consumer perceptions of service quality: An assessment of the
SERVQUAL dimensions. Journal of Retailing, 66, 33-55.
Carman, J.M. & Langeard, E. (1980). Growth strategies of service firms. Strategic Management
Journal, 1, 7-22.
Cronin, J.J. & Taylor, S.A. (1994). SERVPERF versus SERVQUAL: Reconciling performance-
based and perception-minus-expectations measurement of service quality. Journal of
Marketing, 58, 125-131.
Cullen, R. (2001). Perspectives on user satisfaction surveys. Library Trends, 49(4), 662-687.
Danek, R.R., Parker, R., & Szymanski, E.M. (1991). Disability research and policy: Forging an
alliance. Journal of Applied Rehabilitation Counseling, 22, 5-10.
Davis, G. S. & Macomber, S. (2002). Quality assurance of Professional Services Group, Inc. –
Eau Claire: An analysis of customer and client satisfaction data. Unpublished manuscript.
University of Wisconsin – Stout & Professional Services Group, Inc.
Dutka, A. (1993). AMA Handbook for Customer Satisfaction. Chicago: NTC Publishing.
64

Online Satisfaction Survey
Gitomer, J. (1998). Customer satisfaction is worthless, customer loyalty is priceless: How to
make customers love you, keep them coming back, and tell everyone they know. Austin,
TX: Bard Press.
Grapentine, T. (1999). The history and future of service quality assessment. Marketing Research,
10, 4-20.
Griffin, J. (1995). Customer loyalty: How to earn it, how to keep it. New York: Lexington
Books.
Hayes, B. (1998). Measuring Customer Satisfaction. Milwaukee, WI: ASQ Quality Press.
Heppner, P. & Claiborn, P. (1989). Social influence research in counseling: A review and
critique. Journal of Counseling Psychology, 36 (3), 365-387.
Keiningham, T.L. & Vavra, T.G. (2001). The customer delight principle: Exceeding customers’
expectations for bottom-line success. Chicago: McGraw-Hill.
Kettner, P.M. & Martin, L.L. (1985). Issues in the development of monitoring systems for
purchase of service contracting. Administration in Social Work, 9 (3), 69-82.
Lebow, J. (1982). Consumer satisfaction with mental health treatment. Psychological Bulletin,
91, 244-259.
Leland, K., & Bailey, K. (1995). Customer Service for Dummies. Foster City, CA: IDG Books.
Martin, L. (1993). Total quality management in human service organizations. Newbury Park,
CA: Sage Publications.
McColl-Kennedy, J., & Schneider, U. (2000). Measuring customer satisfaction: why, what and
how. Total Quality Management, 11 (7), 1-14.
Mitchell, J. (1999). Reaching across boarders. Marketing News, 33(9), 19-21.
65

Online Satisfaction Survey
Moore, S., Kelly, M., & Lauderdale, M. (1998). Three fundamentals of service quality in welfare
reform. Family & Community Health, 21 (2), 31-49.
Naylor, M. & Greco, S. (2002). Customer chemistry: How to keep the customers you want – and
say “good-bye” to the ones you don’t. Chicago: McGraw-Hill.
Parasuraman, A., Berry, L, & Zeithaml, V. (1985). A conceptual model of service quality.
Journal of Marketing, 49, 41-50.
Parasuraman, A., Berry, L, & Zeithaml, V. (1988). SERVQUAL: A multiple-item scale for
measuring customer perceptions of service quality. Journal of Retailing, 64, 26-43.
Parasuraman, A., Berry, L, & Zeithaml, V. (1993). More on improving service quality
management. Journal of Retailing, 67, 420-450.
Patti, R. (1987). Managing for service effectiveness in social welfare: Towards a performance
model. Administration in Social Work, 11, 7-22.
Paulson, R.I. (1988). People and garbage are not the same: Issues in contracting for public
mental health services. Community Mental Health Journal, 24 (2), 91-102.
Peat, B. & Costley, D.L. (2000). Privatization of social services: Correlates of contract
performance. Administration in Social Work, 24 (1), 21-38.
Poertner, J. & Rapp, C.A. (1985). Purchase of service and accountability: Will they ever meet?
Administration in Social Work, 9 (1), 57-66.
Professional Services Group, Inc. (2002). Policy and Procedures Manual – Revised May 1, 2002.
Agency Document.
Pruger, R. & Miller, L. (1991). Efficiency and the social services: Part A. Administration in
Social Work, 15, 5-23.
Reck, R.R. (1991). Turn your customers into your sales force. New York: Prentice Hall Press.
66

Online Satisfaction Survey
Reichheld, F. & Sasser, W.E., Jr. (1990). Zero defections: Quality comes to services. In J.J.
Sviokla & B.P. Shapiro (Eds.), Keeping customers (pp.311-324). Boston: Harvard
Business Review.
Richard, M.A. (2000). A discrepancy model for measuring consumer satisfaction with
rehabilitation services. Journal of Rehabilitation, 66 (4), 37-43.
Sabourin, S.; LaFeiriere, N.; Sicuro, F. Coallier, J.C.; Cournoyer, L.G.; & Gendreau, P. (1989).
Social desirability, psychological distress and consumer satisfaction with mental health
treatment. Journal of Counseling Psychology, 36, 352-356.
Selber, K. & Streeter, C. (2000). A customer-oriented model for managing quality in human
services. Administration in Social Work, 24 (2), 1-14.
Sharma, S., Durand, R.M., & Gur-Arie, O. (1981). Identification and analysis of moderator
variables. Journal of Marketing Research, 18, 291-300.
Shostack, G.L. (1990). Designing services that deliver. In J.J. Sviokla & B.P. Shapiro (Eds.),
Keeping customers (pp.77-89). Boston: Harvard Business Review.
Sureshchander, G.S., Rajendran, C., & Kamalanabhan, T.J. (2001). Customer perceptions of
service quality: A critique. Total Quality Management, 12 (1), 111-125.
Swan, J.E. & Bowers, M.R. (1998). Services quality and satisfaction: The process of people
doing things together. Journal of Services Marketing, 12 (1), 59-72.
Takeuchi, H. & Quelch, J.A. (1990). Quality is more than making a good product. In J.J. Sviokla
& B.P. Shapiro (Eds.), Keeping customers (pp.137-149). Boston: Harvard Business
Review.
Taylor, S.A. & Cronin, J.J. (1994). Modeling patient satisfaction and service quality. Journal of
Health Care Marketing, 14, 34-44.
67

Online Satisfaction Survey
The Leadership Factor: Working With Winners (n.d.). Customer Satisfaction. Retrieved
February 5, 2002, from http://www.letssurvey.com/
Tucker, C.M., Parker, S.J., Parham, G.D., Brady, B.A., & Brown, J.G. (1988). Perceived
importance of counselor characteristics among vocational rehabilitation counselors and
clients. Journal of Applied Rehabilitation Counseling, 31, 28-31.
Wagenheim, G. & Reurnik, J. (1991). Customer service in public administration. Public
Administration Review, 51 (3), 263-270.
68

Online Satisfaction Survey
APPENDIX A
SERVQUAL Items by Dimension
Tangibles Dimension • Modern equipment • Visually appealing facilities • Employees who have a neat, professional
appearance
• Visually appealing materials associated
with the service
Assurance Dimension • Assure customers of accuracy and
confidence in transactions • Employees who are consistently
courteous • Employees have knowledge to answer
customers’ questions
• Employees who instill confidence in
customers
Reliability Dimension
• Maintaining error-free customer orders and records
• Dependability in handling customers’ service problems
• Providing services as promised
• Providing service at the promised time
• Performing services right the first time
Responsiveness Dimension
• Readiness to respond to customers’
questions • Keeping customers informed when
services are performed • Prompt service to customers
• Willingness to help customers
Empathy Dimension
• Convenient business hours • Giving customers individual attention • Employees who deal with customers in a
caring fashion
• Employees who understand the needs of
their customers • Having the customers’ best interest at
heart
69
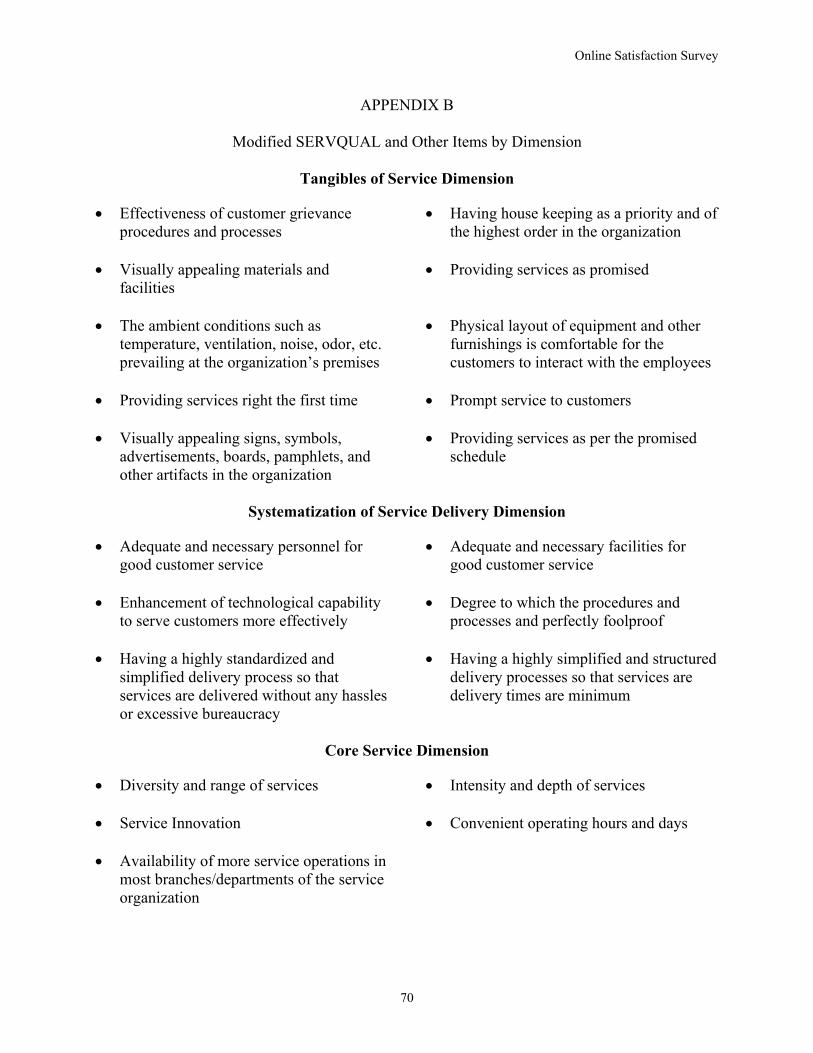
Online Satisfaction Survey
APPENDIX B
Modified SERVQUAL and Other Items by Dimension
Tangibles of Service Dimension • Effectiveness of customer grievance
procedures and processes • Having house keeping as a priority and of
the highest order in the organization • Visually appealing materials and
facilities
• Providing services as promised
• The ambient conditions such as
temperature, ventilation, noise, odor, etc. prevailing at the organization’s premises
• Physical layout of equipment and other
furnishings is comfortable for the customers to interact with the employees
• Providing services right the first time
• Prompt service to customers
• Visually appealing signs, symbols,
advertisements, boards, pamphlets, and other artifacts in the organization
• Providing services as per the promised
schedule
Systematization of Service Delivery Dimension
• Adequate and necessary personnel for
good customer service • Adequate and necessary facilities for
good customer service • Enhancement of technological capability
to serve customers more effectively
• Degree to which the procedures and
processes and perfectly foolproof • Having a highly standardized and
simplified delivery process so that services are delivered without any hassles or excessive bureaucracy
• Having a highly simplified and structured
delivery processes so that services are delivery times are minimum
Core Service Dimension
• Diversity and range of services • Intensity and depth of services • Service Innovation
• Convenient operating hours and days
• Availability of more service operations in
most branches/departments of the service organization
70

Online Satisfaction Survey
Social Responsibility Dimension • Equal treatment stemming from the
belief, every one, big or small, should be treated alike
• A social responsibility characterized by deserving service to people belonging to all strata of the society
• Giving good service at a reasonably
minimal cost, but not at the expense of quality
• Having branch locations in most places
convenient to all sections of the society
• “Service transcendence”- making
customers realize their unexpressed potential by giving more than what they expect
• Extent to which the organization leads as
a good corporate citizen, and the level to which it promotes ethical conduct in everything it does
• A sense of public responsibility among employees
Human Element of Service Delivery Dimension
• Willingness to help customers and the
readiness to respond to customers’ requests
• Making customers feel safe, secure, satisfied, and delighted in their transactions
• Apprising the customers of the nature and
schedule of services available in the organization
• Giving caring and individual attention to
customers by having the customers’ best interests at heart
• Employees who instill confidence in
customers by proper behavior
• Employees who are consistently pleasing
and courteous • Having the necessary skills and ability,
and, more importantly, the willingness of the employees for action whenever a critical incident takes place
• Whenever a critical incident takes place,
the degree to which the organization succeeds in bringing the condition back to normalcy by satisfying the customer
• Employees who understand the needs of
their customers
• Employees who have a neat and
professional appearance • Employees who have the knowledge and
competence to answer customers’ specific queries and requests
• Regularly apprising the customers about
information on service quality and actual service performance versus targets in the organization
• Extent to which the feedback from customers is used to improve service standards
71

Online Satisfaction Survey
APPENDIX C
Quality Assurance Procedures
The Quality Assurance plan proposed herein is intended to be used as a tool to regulate the
quality of services being provided to our clientele. The plan offers a standardized method of
surveying several different methods aspects of a program’s performance. It should be noted that
this plan has been developed as an aid to continue to provide quality services and does not
supercede existing policy and procedures as outlined in the Employee Handbook.
Program Description
In order to avoid confusion over the roles of employees in different programs, each program has
developed a PROGRAM DESCRIPTION that outlines the various roles and expectations of that
program. The program description will become integrated into the intake procedure and a copy
will be distributed to the parents and/ or guardian as well as the client being served. The purpose
of the program description is to define the role of the employee and to clarify the expectations of
the program on the participant and their families.
File Inspection
Each supervisor is responsible for inspection of a representative number of client files from each
program (10% of the total current program population) on a monthly basis and submitted to the
director of your program by the first working day of the following month. File inspections will
be rotated so that no employee’s caseload is either neglected or over-emphasized. The purpose of
the file inspection is to ensure that employees have maintained updated files and that the lead
worker is familiar with all aspects of the clients’ cases. A standardized form for assessing an
employee’s knowledge about a particular case has been developed. This form promotes agency
uniformity; however, it also allows for the diversity inherent to each of the varying programs.
72
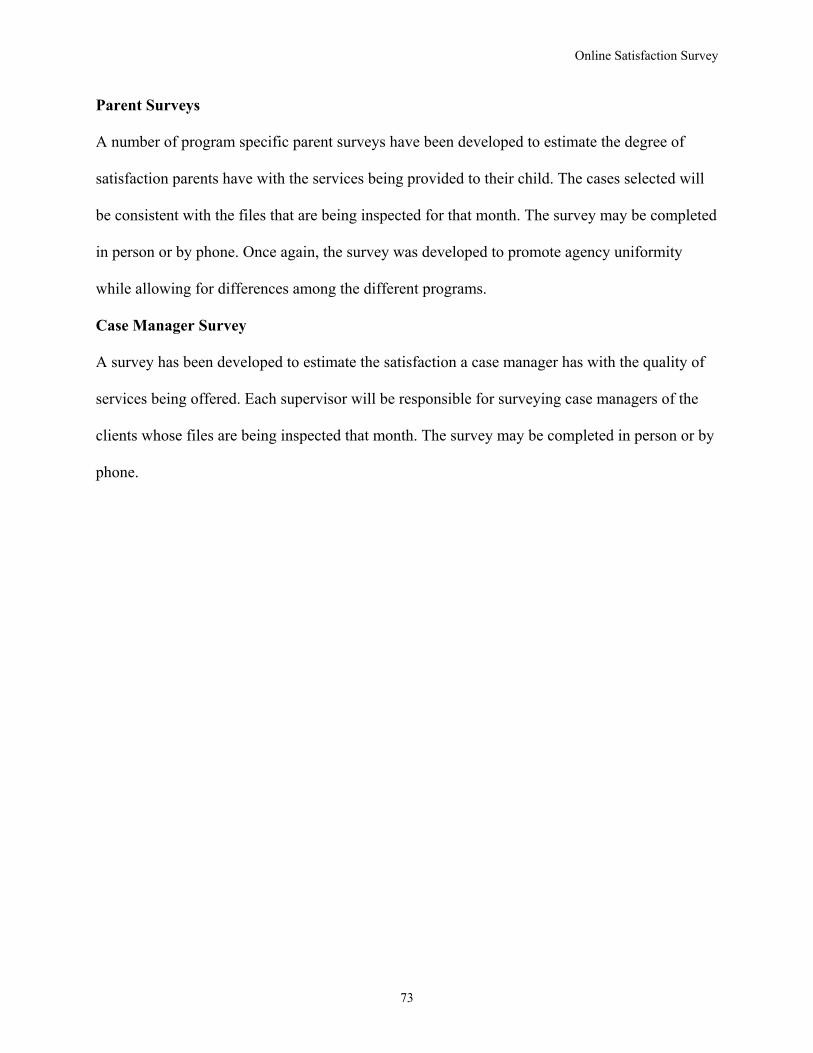
Online Satisfaction Survey
Parent Surveys
A number of program specific parent surveys have been developed to estimate the degree of
satisfaction parents have with the services being provided to their child. The cases selected will
be consistent with the files that are being inspected for that month. The survey may be completed
in person or by phone. Once again, the survey was developed to promote agency uniformity
while allowing for differences among the different programs.
Case Manager Survey
A survey has been developed to estimate the satisfaction a case manager has with the quality of
services being offered. Each supervisor will be responsible for surveying case managers of the
clients whose files are being inspected that month. The survey may be completed in person or by
phone.
73

Online Satisfaction Survey
APPENDIX D
Initial List of Service Quality Items by Dimension
Tangibles Dimension • Modern equipment • Visually appealing facilities • Visually appealing materials associated
with the service
• Employees who have a neat, professional
appearance • Quality of materials, groups, and
activities
Reliability Dimension
• Maintaining error-free customer records • Providing services as promised • Performing services right the first time
• Providing service at the promised time
• Dependability in handling customer’s
service problems
• Availability of staff
Responsiveness Dimension
• Readiness to respond to customers’
questions • Keeping customers informed when
services are performed • Willingness to help customers
• Prompt service to customers
• Helpfulness and Courteousness of staff
• Accessibility of staff of staff
• Flexibility to demands
• Fast correction of service problems
Assurance Dimension
• Employees have knowledge to answer
customer questions • Assure customers of accuracy /
confidentiality of transactions • Regular and effective communication of
case issues
• Employees who instill confidence in
customers • Employees are consistently courteous
• Competence of management
• Skills and expertise of staff
74

Online Satisfaction Survey
Empathy Dimension • Employees who deal with customers in a
caring fashion • Employees who understand the needs of
the customers • Convenient business hours
• Giving customers individual attention
• Having the customers’ best interest at
heart
Core Service Dimension
• Diversity and range of services • Service innovation • Operating hours convenient to customers
and clients
• Intensity and depth of service
Systematization of Service Delivery Dimension
• Adaptation of services or processes to
improve effectiveness • Structured and appropriate service
delivery process • Adequate and necessary personnel • Simple and efficient referral process
• Adequate and necessary facilities and
equipment
Social Responsibility Dimension • Equal treatment to customers and clients • Ethical conduct • Organization as a good corporate citizen
• Giving customers more than expected
• Sense of public responsibility among
staff
• Quality services at a reasonable cost
Referral and Intake
• Adequate explanation of program
services and expectations to client • Efficient referral and intake process
Program Assessment
• Adequately assess resources and needs of
client system • Timely assessment of service needs
75
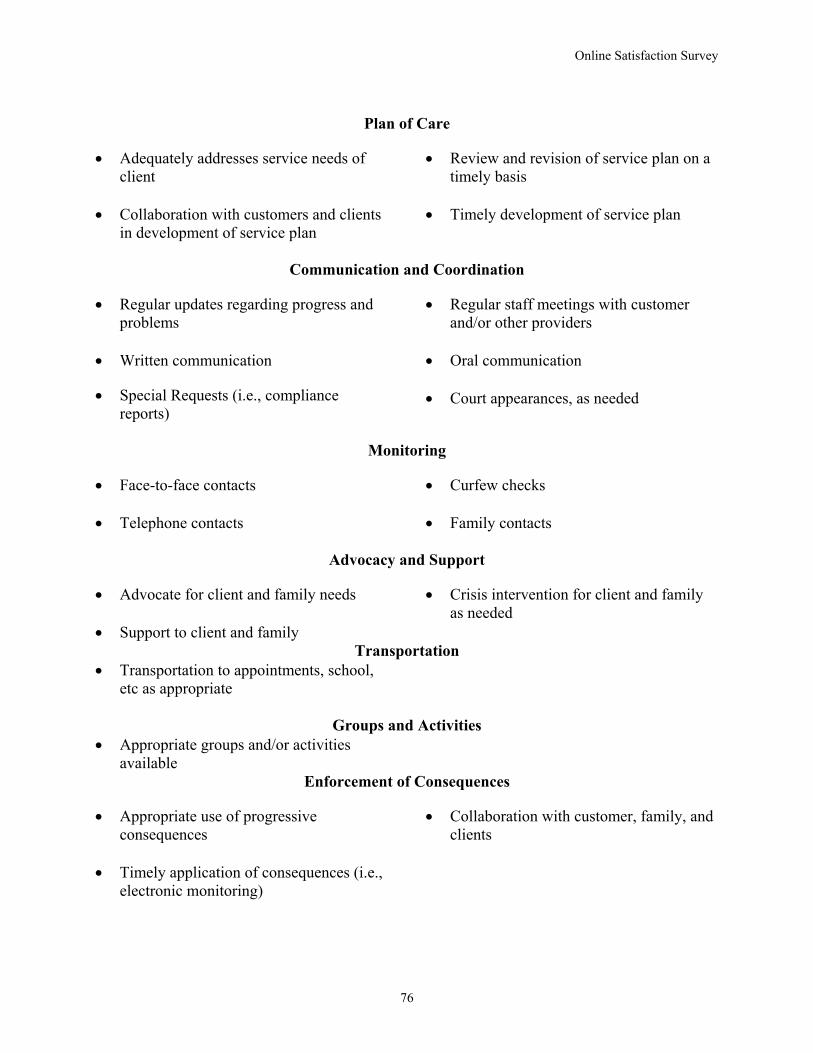
Online Satisfaction Survey
Plan of Care
• Adequately addresses service needs of
client • Review and revision of service plan on a
timely basis • Collaboration with customers and clients
in development of service plan
• Timely development of service plan
Communication and Coordination
• Regular updates regarding progress and
problems • Regular staff meetings with customer
and/or other providers • Written communication
• Oral communication
• Special Requests (i.e., compliance
reports)
• Court appearances, as needed
Monitoring
• Face-to-face contacts • Curfew checks • Telephone contacts
• Family contacts
Advocacy and Support
• Advocate for client and family needs
• Crisis intervention for client and family as needed
• Support to client and family Transportation
• Transportation to appointments, school, etc as appropriate
Groups and Activities
• Appropriate groups and/or activities available
Enforcement of Consequences • Appropriate use of progressive
consequences • Collaboration with customer, family, and
clients • Timely application of consequences (i.e.,
electronic monitoring)
76

Online Satisfaction Survey
APPENDIX E
Final List of Service Quality Items by Dimension
Tangibles Dimension • Adequate and necessary facilities and
equipment • Employees who have a neat,
professional appearance • Quality of materials, groups, and
activities
• Diversity and range of services
• Convenient hours to customers, clients
and families
• Service innovation • Intensity and depth of services
Service Delivery Dimension
• Efficient referral and intake process • Explanation of program services and
expectations to customer, client, and family
• Adequate client contacts
• Appropriate services and delivery based on identified needs
• Identification of resources and needs of
client and family • Adequate family contacts
Reliability Dimension
• Providing services as promised • Dependability in handling service
problems • Written communication
• Availability and accessibility of staff • Providing service at the promised time
or in a timely manner • Oral communication
Responsiveness Dimension
• Willingness to respond to questions or concerns
• Prompt and timely service to customers, clients, and families
• Helpfulness and courteousness
• Fast correction of service problems
Assurance Dimension
• Accuracy and confidentiality • Competence of management • Knowledge, skills, and abilities of
personnel
• Ethical conduct • Organization as a good corporate citizen • Regular collaboration with customer,
client, family, and/or other providers
77

Online Satisfaction Survey
Empathy Dimension • Empathetic to customers, clients, and
families • Advocacy and support for client and
family needs
• Giving customers, clients, and families individualized attention
• Equal treatment to customers and clients
78
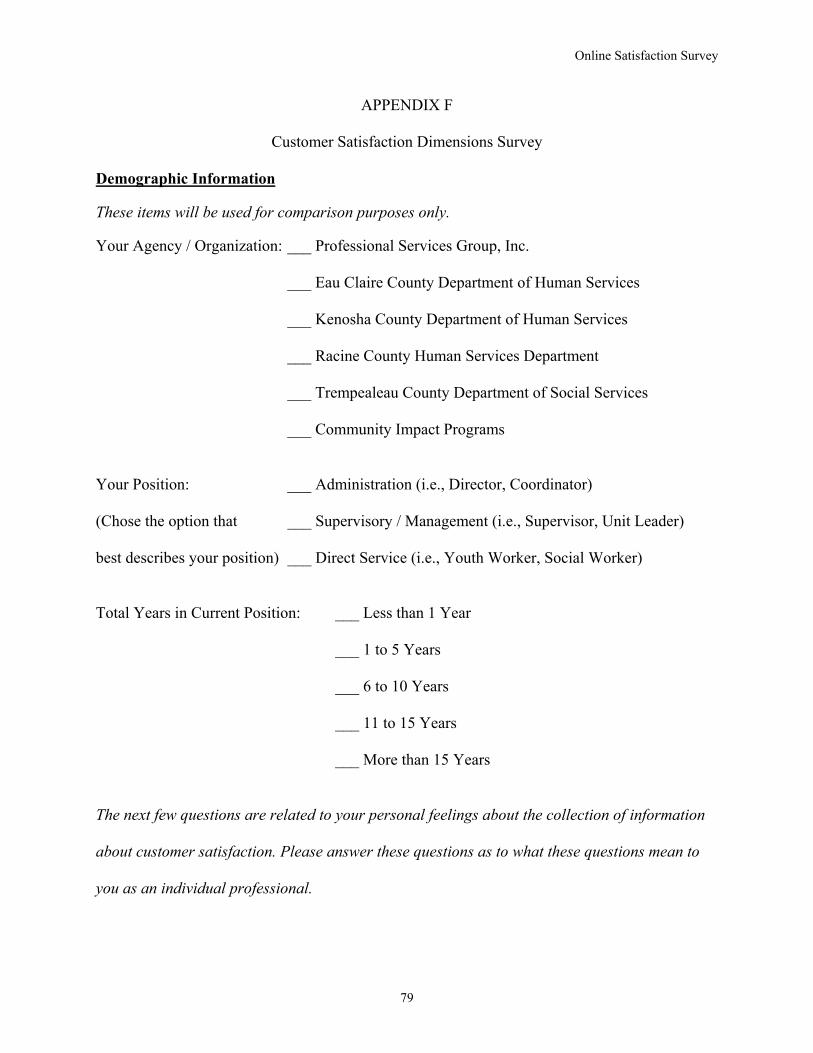
Online Satisfaction Survey
APPENDIX F
Customer Satisfaction Dimensions Survey
Demographic Information These items will be used for comparison purposes only. Your Agency / Organization: ___ Professional Services Group, Inc.
___ Eau Claire County Department of Human Services
___ Kenosha County Department of Human Services
___ Racine County Human Services Department
___ Trempealeau County Department of Social Services
___ Community Impact Programs
Your Position: ___ Administration (i.e., Director, Coordinator)
(Chose the option that ___ Supervisory / Management (i.e., Supervisor, Unit Leader)
best describes your position) ___ Direct Service (i.e., Youth Worker, Social Worker)
Total Years in Current Position: ___ Less than 1 Year
___ 1 to 5 Years
___ 6 to 10 Years
___ 11 to 15 Years
___ More than 15 Years
The next few questions are related to your personal feelings about the collection of information
about customer satisfaction. Please answer these questions as to what these questions mean to
you as an individual professional.
79

Online Satisfaction Survey
1. How important to you as an individual is the collection of customer satisfaction information? Not Sure Not at All
Important Very
Important 0 1 2 3 4 5 6 7
2. How would you rate the current method of collecting customer satisfaction information by
Professional Services Group, Inc.?
Not Sure Very Poor
Excellent
0 1 2 3 4 5 6 7 3. Which method do you think works BEST in collecting customer satisfaction information?
(Select one)
___ Written Surveys ___ Telephone Surveys ___ Online Survey
___ Focus Groups ___ Personal Interviews ___ Not Sure
4. How long do you as an individual think collection of customer satisfaction information
should take?
___ Less than 15 Minutes ___ 21 to 30 Minutes
___ 15 to 20 Minutes ___ As Long as Necessary 5. Have you ever held back negative information about services provided by Professional
Services Group, Inc. during collection of customer satisfaction information out of concern
about someone’s job status being affected?
___ Yes ___ No ___ Not Sure ___ Not Applicable
The next section contains a variety of specific service dimensions related to measuring customer
satisfaction with services like those provided by Professional Services Group, Inc.
Based upon your personal beliefs, please rate how important each service dimension is in
achieving customer satisfaction from your perspective as an individual.
80

Online Satisfaction Survey
Service Dimension Importance in Terms of Satisfaction Not At
All Important
Very Important
6. Adequate and necessary
facilities and equipment
1 2 3 4 5 6 7
7. Employees who have a neat,
professional appearance
1 2 3 4 5 6 7
8. Quality of materials, groups,
and activities
1 2 3 4 5 6 7
9. Diversity and range of
services
1 2 3 4 5 6 7
10. Intensity and depth of
services
1 2 3 4 5 6 7
11. Service innovation 1 2 3 4 5 6 7
12. Convenient hours to
customers, clients and families
1 2 3 4 5 6 7
13. Efficient referral and intake
process
1 2 3 4 5 6 7
14. Explanation of program
services and expectations to
customer, client, and family
1 2 3 4 5 6 7
15. Identification of resources
and needs of client and family
1 2 3 4 5 6 7
81

Online Satisfaction Survey
16. Appropriate services and
delivery based on identified
needs
1 2 3 4 5 6 7
17. Adequate client contacts 1 2 3 4 5 6 7
18. Adequate family contacts 1 2 3 4 5 6 7
19. Providing services as
promised
1 2 3 4 5 6 7
20. Dependability in handling
service problems
1 2 3 4 5 6 7
21. Providing service at the
promised time or in a timely
manner
1 2 3 4 5 6 7
22. Availability and
accessibility of staff
1 2 3 4 5 6 7
23. Written communication 1 2 3 4 5 6 7
24. Oral communication 1 2 3 4 5 6 7
25. Willingness to respond to
questions or concerns
1 2 3 4 5 6 7
26. Prompt and timely service
to customers, clients, and
families
1 2 3 4 5 6 7
27. Helpfulness and
courteousness
1 2 3 4 5 6 7
82

Online Satisfaction Survey
83
28. Fast correction of service
problems
1 2 3 4 5 6 7
29. Accuracy and
confidentiality
1 2 3 4 5 6 7
30. Competence of
management
1 2 3 4 5 6 7
31. Knowledge, skills, and
abilities of personnel
1 2 3 4 5 6 7
32. Ethical conduct 1 2 3 4 5 6 7
33. Organization as a good
corporate citizen
1 2 3 4 5 6 7
34. Regular collaboration with
customer, client, family, and/or
other providers
1 2 3 4 5 6 7
35. Empathetic to customers,
clients, and families
1 2 3 4 5 6 7
36. Advocacy and support for
client and family needs
1 2 3 4 5 6 7
37. Giving customers, clients,
and families individualized
attention
1 2 3 4 5 6 7
38. Equal Treatment to Customers and Clients
1 2 3 4 5 6 7