Customer Retention and Interoperability Research · PDF fileCustomer Retention and...
159
Customer Retention and Interoperability Research Report of Findings Prepared for Ofcom 14 th June, 2013
Transcript of Customer Retention and Interoperability Research · PDF fileCustomer Retention and...

Customer Retention and Interoperability Research Report of Findings
Prepared for
Ofcom
14th June, 2013
Customer Retention and Interoperability Research
Prepared for Ofcom
Contents 1 Executive Summary ........................................................... 5
1.1 Introduction ........................................................................... 5
1.2 Definitions ............................................................................. 6
1.3 Summary of key insights from the research ...................................... 7
2 Introduction .................................................................. 10
2.1 Background and objectives ........................................................10
2.2 Research methodology .............................................................11
2.3 About the analysis and report .....................................................12
3 Services: Switching Provider and Making Choices ...................... 14
3.1 Introduction ..........................................................................14
3.2 Switchers and Considerers: Profile ...............................................14
3.2.1 Overview of switching/switching consideration activity ................14
3.2.2 Attitudes of Switchers and Considerers ...................................17
3.2.3 Contract lengths ..............................................................19
3.2.4 Profile of ‘inactive’ participants ...........................................23
3.3 Switchers and Considerers: Decision Drivers ....................................25
3.3.1 How strongly wanted to review existing arrangements .................25
3.3.2 Triggers prompting initial review of existing arrangements ............26
3.3.3 Factors underpinning choice when considering or switching to a new communications provider ..............................................30
3.3.4 Use of OTT services and their impact on traditional pay TV services .........................................................................36
3.4 Switchers and Considerers: Decision Making Process ..........................39
3.4.1 Information gathering stage .................................................39
3.4.2 Active consideration stage ..................................................40
3.4.3 Switching stage ...............................................................42
4 Services: Difficulties Encountered in the Switching Journey ......... 45
4.1 Introduction ..........................................................................45
4.2 Difficulties that stop consumers from switching or considering switching .46
4.2.1 Inactive participants .........................................................46
4.2.2 Considerers ....................................................................49
4.3 Difficulties experienced during switching .......................................53
Customer Retention and Interoperability Research
Prepared for Ofcom
4.3.1 Differences by type of switching process .................................58
4.4 Understanding switching barriers and hurdles in detail .......................62
4.4.1 Comparing offerings ..........................................................62
4.4.2 Contract restrictions .........................................................64
4.4.3 Installing new services .......................................................66
4.4.4 Interoperability ...............................................................66
5 Services: Save Activity ..................................................... 68
5.1 Introduction ..........................................................................68
5.2 Incidence of save activity ..........................................................68
5.2.1 Switchers .......................................................................68
5.2.2 Considerers ....................................................................69
5.3 Experience of save activity ........................................................70
5.3.1 Switchers .......................................................................70
5.3.2 Considerers ....................................................................72
6 Devices: Changing Devices and Making Choices ........................ 75
6.1 Introduction ..........................................................................75
6.2 Relationship between services and devices .....................................76
6.3 Smartphones .........................................................................78
6.3.1 Overview of smartphone usage and changing devices ..................78
6.3.2 Factors driving choice of device/operating system ......................79
6.3.3 Switching hurdles: issues experiences during switching ................81
6.4 Tablets ................................................................................82
6.4.1 Overview of tablet usage and changing devices .........................82
6.4.2 Tablet user profile ............................................................83
6.4.3 Content affected by switching activity ....................................84
6.4.4 Factors driving decision to purchase device/operating system ........85
7 Devices: Interoperability and Content Sharing ......................... 89
7.1 Introduction ..........................................................................89
7.2 Usage and attitude: types of content ............................................89
7.3 Usage and attitude: sharing/transferring content between devices ........90
Appendices ....................................................................... 96
A. Qualitative guide ..........................................................................96

Customer Retention and Interoperability Research
Prepared for Ofcom
Introduction & Background ...............................................................96
Technology and communications profile (25 mins) ...................................97
Switching Providers (10 mins) ...........................................................98
Barriers to switching (30 mins) ..........................................................99
Retention of Customers (10 mins) .................................................... 102
Interoperability issues (10 mins) ...................................................... 102
Wrap up (5 mins) ........................................................................ 103
B. Questionnaire ............................................................................ 104
C. Methodology .............................................................................. 154

Customer Retention and Interoperability Research
Prepared for: Ofcom 5
1 Executive Summary
1.1 Introduction The overall objective of this research was to gain insight into the impact of changes in the communications sector on consumers’ propensity to switch services and/or devices, both now and in the future, and the barriers that might influence behaviour as communications markets evolve. Specifically, the research looked at the service and device elements that drive decisions to switch providers, and explored potential barriers that may impact ease of switching – with a particular focus on the role and impact of the following issues:
Interoperability (i.e. the ability for different services, platforms and operating systems to work with one another)
Portability (i.e. the ability to transfer content for one service/device to another)
Ecosystems (i.e. where individuals have multiple devices which use the same operating system, for example a mobile phone and a tablet which use either the Apple iOS, or the Android OS).
The research also looked at consumer response to attempts by previous or existing communications providers to retain their business, before a switch or during the consideration period. It also explored usage of OTT (over the top) services (i.e. the delivery of content over an infrastructure that is not under the same administrative control as the content or communications provider services).
Full details of the research background and approach can be found in the Introduction in Section 2 of this report, which is supported by a technical appendix (Appendix 2). For the purposes of this Executive Summary we provide a few key details as follows.
The study was an online survey with the decision-maker for communications services within the household.
The initial screening to identify qualifying respondents was conducted among a representative sample of 7497 residential consumers in the UK, across key social demographic variables (age, gender and socio-economic grade) and Government Office Regions.
Respondent eligibility for the main survey was determined on the basis of ‘active participation’ - either switched communications provider in the last 2 years (referred to in this report as Switchers), or actively considered switching communications provider in the last 12 months but decided against it (referred to in this report as Considerers) - in relation to one of the following four service areas:
A current pay monthly mobile phone service
One or more services within a current Dual Play bundle (including fixed line phone and fixed broadband)
One or more services within a current Triple Play bundle (including fixed line phone, fixed broadband and Pay TV)
A current standalone Pay TV service (where this service has been purchased as a standalone service, not in a bundle with any other service(s)).
A total of 2612 residential consumers qualified for the main survey on this basis.

Customer Retention and Interoperability Research
Prepared for: Ofcom 6
A sub-set of 10 questions were asked to respondents not eligible for the main survey. These respondents have been defined in this report as ‘inactive’ participants.
In order to provide a more robust sample for analysis a separate ‘boost’ survey was conducted with an additional 1,010 telecoms decision makers who had actively considered switching communications provider for one or more of the services noted above, but decided against it.
This quantitative research was supported by 10 focus groups with people who had switched communications provider in the last 2 years, or actively considered switching communications provider in the last 12 months but decided not to. The primary purpose of this qualitative stage was to inform the design of the quantitative stage, in terms of both the sample structure and the content of the questionnaire.
Fieldwork for the main sample took place between 13th and 25th November, 2012.
Fieldwork for the boost sample took place between 21st December 2012 and 7th January 2013.
The following findings are the key highlights from the quantitative online survey with ‘active participants’ (Switchers and Considerers) in the pay-monthly Mobile, Dual Play, Triple Play and Standalone Pay TV markets.
The findings from the qualitative research are included in the main body of this report where they add depth to the quantitative findings, or cover a topic that is not covered by the quantitative research. However they are not referenced in this executive summary.
1.2 Definitions
A number of key definitions are relevant for this section of the report:
Service Areas
Pay-monthly Mobile: on a pay-monthly contract (post-pay) that is personally used and paid for
Dual Play: have fixed line phone AND fixed broadband internet access in a bundle or package from the SAME supplier
Triple Play: have landline/fixed line phone AND fixed broadband internet access AND pay TV service in a bundle or package from the SAME supplier
Standalone Pay TV: have Pay TV but not bundled with other services (respondent may have other services but with different suppliers)
Market participation
Switchers: changed communications provider for one of the following four services in the last 2 years (the last 12 months and last 13-24 months are split out where base sizes allow)
Considerers: actively considered changing communications provider for one of the following four services in the last 12 months but decided against it
– A current pay-monthly mobile phone service
– One or more services within a current Dual Play bundle (including fixed line phone and fixed broadband)
– One or more services within a current Triple Play bundle (including fixed line phone, fixed broadband and Pay TV)
– A current standalone Pay TV service (where this service has been purchased as a standalone service, not in a bundle with any other service(s)).

Customer Retention and Interoperability Research
Prepared for: Ofcom 7
Active participants: the combined sample of all Switchers and Considerers based on the above definitions.
Inactive participants: those respondents who have neither switched (in the last 2 years) nor considered switching (in the last 12 months) any of these services (pay-monthly mobile phone/fixed line phone/fixed broadband/Pay TV).
1.3 Summary of key insights from the research
1.3.1.1 Importance of interoperability/portability in choice of provider and device
Cost, package and reliability/functionality are more important than interoperability and portability when choosing a provider. Cost alone accounts for around half of overall importance when choosing a new provider, regardless of service area. Interoperability factors (ease of integrating with existing devices/other services) account for between 2% (for Dual Play markets) and 6% (for standalone Pay TV markets) of overall importance in these decisions.
Device functionality identified as most important factor when choosing a new device (namely smartphones and tablet computers) accounting for 40% of overall importance for both smartphones and tablets. The second most important factor when choosing a new smartphone is cost, which accounts for 18% of overall importance in the decision. Whereas the second most important factor when choosing a new tablet is interoperability, which accounts for 17% of overall importance in the decision.
Interoperability factors are more important when choosing a new device than a new provider, most notably for tablets, which are often used as storage devices. Interoperability elements account for between 11% (for smartphones) and 17% (for tablets) of overall importance in the decision. When choosing a new tablet, interoperability is the second greatest driver of choice after functionality. When choosing a new smartphone, both functionality and cost have more influence on decisions than interoperability.
1.3.1.2 Impact of interoperability and portability when switching provider
Active participants’ desire to keep their TV content when switching provider does not appear to be fulfilled in all cases. When it comes to Pay TV services, recording and storing content are important elements in the day-to-day user experience: stored TV content is important to half of active participants. The majority of Switchers (78%) claimed they wanted to keep some content when they changed provider (and subsequently, their device), most often films/individual TV programmes. However difficulties are sometimes encountered when attempting to transfer content to the new service/device, with an indication of knowledge gaps for some users. Among the 37% of Pay TV Switchers who successfully transferred content, the majority (63%) found it easy to do. However, of the 63% who wanted to transfer content but didn’t, most said this was because it was difficult or impossible to do (80% for films, 78% for individual TV programmes).
Active participant’s desire to share or transfer content between devices is also unfulfilled in some cases. When it comes to devices, keeping content is a similarly important element of the day-to-day user experience: 41% of those with more than one device share or transfer content between them. However, similar interoperability challenges to those noted in relation to switching communications provider are apparent. The majority (74%) of smartphone Switchers

Customer Retention and Interoperability Research
Prepared for: Ofcom 8
(i.e. those who have changed or upgraded their handset/operating system in the last two years) claimed they wanted to keep at least some stored content when they switched, most often self-created/personalised (i.e. free) content such as photos, music and home videos. Among the 78% of smartphone Switchers who successfully transferred content, the vast majority thought it was easy to do (86% for photos and music, 82% for own videos). However, of the 22% who did not transfer content, but wanted to, at least three in five said it was difficult or impossible (63% for photos, 59% for music).
1.3.1.3 Difficulties experienced when switching provider
When it comes to switching provider, interoperability and portability issues tend not to have a major impact for either Switchers (i.e. switched in the last two years) or Considerers (i.e. considered switching in the last 12 months, but remained with current provider), with the exception of Pay TV.
Switchers: The most common issues faced by Switchers are transitional or related to cost.
Transitional (arranging for services to start and stop at the same time, loss of service during the switch, paying for two services at the same time): and the costs involved are the most common issues stated by Switchers. Around one in five across all services claim these factors to be the main/a major issue experienced when switching provider.
Provider intervention (including ‘save activity’ - i.e. attempts by current provider to persuade the consumer to stay): At least one in ten Switchers, rising to a quarter (26%) in the Pay TV standalone market say their provider made it difficult to switch. Between 12%-17% say provider persuasions was a main/major issue experienced. Of the 77% of Switchers who spoke to their previous communications provider, three-quarters were subject to ‘save’ activity. Of these, 41% were unhappy with these efforts and 17% felt pressurised as a result. The vast majority (91%) were happy with their decision to switch.
Interoperability (specifically difficulties with new devices not working with other devices, e.g. a mobile handset changed at the same time as switching provider, or a different set-top box acquired with a new Pay TV provider) was recalled as a main/major issue by around one in ten in each of the Dual play, Triple Play and pay monthly Mobile. Interoperability is more of an issue in the standalone Pay TV market, where closer to one in five claim this to be the main/a major problem when switching provider.
Considerers: Most likely to be put off switching due to cost concerns (most commonly, perceptions of insufficient difference in price and/or the overall costs involved) or provider intervention i.e. persuading them to stay.
Costs: Around half cite costs as the main/a major issue, these more common amongst Triple Play and Pay TV standalone switchers than the other markets.
Provider intervention (including ‘save activity’ - i.e. attempts by current provider to persuade the consumer to stay): At least half cite provider intervention as the main/a major issue that impacted on their decision not to switch. Of the 55% of Considerers who spoke to their previous provider at some point, most (82%) recall their provider persuading them to stay. The majority have a positive experience. A minority (20%) are unhappy with these interventions and similar proportions (17%) are dissatisfied with their decision to stay.
Clarity of the switching process is the main/a major issue for one in five of those in the Triple Play and Pay TV markets and one in six of those in the Dual Play and pay-monthly Mobile markets.

Customer Retention and Interoperability Research
Prepared for: Ofcom 9
Interoperability: (specifically difficulties with other devices not working with the new device) is less likely to be recalled as a reason for not switching provider (around one in five claim this to be the main/a major factor in the pay-monthly Mobile, Dual Play and Triple Play markets rising to around one in four in the Pay TV market).
Interoperability and portability are issues for one in five when changing device. Looking specifically at smartphone Switchers (i.e. those who have changed or upgraded their handset/operating system in the last two years), the cost of a new handset (33%) and contract restrictions (29%) appear to cause the most widespread difficulties with issues transferring paid/personal content at around one in five.
1.3.1.4 Extent device/content ecosystems create feeling of being ‘locked-in’
Just over a third of active participants (37%) agree that taking more than one device from the same brand ‘locks you in’.
Those in an ecosystem (i.e. where individuals have multiple devices which use the same operating system, for example a mobile phone and a tablet which use either the Apple iOS, or the Android OS) display higher tendencies towards feeling locked in than other active participants.
Those in an ecosystem are also more likely to identify interoperability as a barrier to changing device brand or service provider. One in ten consumers who had switched provider for at least one of their service in the last two years said they had major issues with other devices/products they own not working with their new service. Three in ten consumers who had considered switching in the last 12 months claim this was the main/a major reason why they chose not to change provider.

Customer Retention and Interoperability Research
Prepared for: Ofcom 10
2 Introduction
2.1 Background and objectives Two key market developments are changing competitive dynamics within the communications sector and may impact switching levels:
Saturation: As markets approach saturation, operators are increasingly focusing on retention rather than acquisition. Retention strategies are varied but include incentivising customers to move from pre-pay to post-pay (in mobile) and commit to longer contracts, and focusing on save activity by offering special offers to existing customers - in some cases targeting customers with an intention to switch, and providing enhanced propositions to existing customers (examples include O2’s priority moments and Sky’s Rewards).
Convergence: As content, devices and networks become more closely integrated, increased barriers to switching are created:
– Hardware subsidisation (e.g. smartphones, DVRs), locking consumers in to contracts;
– Risk of consumers losing stored content when switching, due to the link between content storage and service providers (e.g. pay TV and Sky+/TiVo boxes);
– Inability to transfer content and applications from one operating system to another due to device ecosystems (e.g. Apple, the App Store and iTunes);
– Network effects, whereby the utility of one service in increased by the number of people using a particular gateway/platform (e.g. communications via Facebook);
– Multi-play service bundles which potentially incorporate all of the above, plus potentially increase complexity through managing multiple contract lengths, and at least the perceived hassle of changing communications provider;
– Complexity, creating reluctance among consumers to ‘learn’ how to use another service, and difficulties in comparing current service with alternatives.
Ofcom has previously undertaken research on the types of barriers created by current switching processes, with a focus on fixed broadband. Additional research was required to supplement this work, by providing insight into the impact of changes in the communications sector on consumers’ propensity to switch services and/or devices, both now and in the future, and the barriers that might influence behaviour as communications markets evolve.
The specific objectives that were identified for this research are as follows:
To understand consumer behaviour when making decisions and choices in relation to:
– Services: current pay-monthly mobile phone customers, current Dual Play customers, current Triple Play customers, current standalone Pay TV customers
– Devices: Smartphone and tablet
To understand the relative importance of the types of barriers influencing behaviour
To explore how consumers are using services and devices
To explore interoperability issues, both in terms of their overall importance and their impact in the context of other issues, including:
– Service related interoperability issues
– Device related interoperability issues

Customer Retention and Interoperability Research
Prepared for: Ofcom 11
To better understand consumers’ experiences and attitudes towards ‘save’ activity (i.e. efforts by providers to win back the business of defecting customers).
2.2 Research methodology
The main quantitative stage of the research programme comprised an online survey, conducted via the Research Now consumer online panel.
The survey was conducted with the decision-maker for communications services within the household.
The initial screening survey to identify qualifying respondents was conducted among a representative sample of 7497 residential consumers in the UK, across key social demographic variables (age, gender and socio-economic grade) and Government Office Regions.
Respondent eligibility for the main survey was determined on the basis of ‘active participation’ - either switched communications provider in the last 2 years (referred to in this report as Switchers), or actively considered switching communications provider in the last 12 months but decided against it (referred to in this report as Considerers) - in relation to one of the following four services:
A current pay-monthly mobile phone service
One or more services within a current Dual Play bundle (including fixed line phone and fixed broadband)
One or more services within a current Triple Play bundle (including fixed line phone, fixed broadband and Pay TV)
A current standalone Pay TV service (where this service has been purchased as a standalone service, not in a bundle with any other service(s)).
A total of 2612 residential consumers qualified for the main survey on this basis.
A small sub-set of 10 questions were asked to respondents not eligible for the main survey and defined in this report as ‘inactive’ consumers. For quota purposes, respondents were allocated to one of these four service areas only, as either a Switcher or a Considerer. As such, even if they qualified for more than one service area (for example, they could have qualified as a dual play switcher and a Standalone Pay TV considerer), they were allocated to only one, and answered questions on only one.
The screening data were weighted by age, gender, social class and region to ensure that the overall sample of 7497 interviews was representative of the profile of UK residential consumers – thereby ensuring the representativeness of the main, qualifying sample of 2612 switchers and considerers in each of the pay-monthly Mobile, Pay TV, Dual-Play and Triple-Play markets. Weighting targets were identified based on the 2001 census.
A separate ‘boost’ survey was conducted with an additional 1,010 telecoms decision makers who had actively considered switching communications provider for one or more of the services noted above, but decided against it.
Fieldwork for the main sample took place between 13th and 25th November, 2012.
Fieldwork for the boost sample took place between 21st December 2012 and 7th January 2013.
The main questionnaire was 25-30 minutes in length and consisted of mainly closed-ended (yes/no, rating scale) questions, however a limited number of open-ended questions were also

Customer Retention and Interoperability Research
Prepared for: Ofcom 12
included. The boost questionnaire was 10-12 minutes in length and consisted entirely of closed-end questions. The full questionnaire used in this survey can be found in Appendix 1.
This quantitative research was supported by 10 focus groups with actual/attempted ‘switchers’. The primary purpose of this qualitative stage was to inform the design of the quantitative stage, in terms of both the sample structure and the content of the questionnaire.
Full details of the research methodology can be found in Appendix 2.
2.3 About the analysis and report Sub-group analysis has been conducted for this report, with a particular focus on Switchers and Considerers amongst current consumers in each of the pay-monthly Mobile, Dual Play, Triple Play and standalone Pay TV markets. Where differences are reported as ‘significant’ they are statistically significant to a 95% confidence level based on the effective sample (equivalent to 99% confidence level). More details on effective sample are also included in Annex 2.
This report focuses on the main findings from the quantitative research. The key findings from the qualitative stage are also included in this report to help interpret the quantitative findings.
In reading this report, a number of key definitions should be borne in mind:
Service Areas
Pay-monthly Mobile: on a pay-monthly contract (post-pay) that is personally used and paid for
Dual Play: have fixed line phone AND fixed broadband internet access in a bundle or package from the SAME supplier
Triple Play: have fixed line phone AND fixed broadband internet access AND pay TV service in a bundle or package from the SAME supplier
Standalone Pay TV: have Pay TV but not bundled with other services (respondent may have other services but with different suppliers)
Market participation
Switchers: changed communications provider for one of the following four services in the last 2 years (the last 12 months and last 13-24 months are split out where base sizes allow)
Considerers: actively considered changing communications provider for one of the following four services in the last 12 months but decided against
– A current pay-monthly mobile phone service
– One or more services within a current Dual Play bundle (including fixed line phone and fixed broadband)
– One or more services within a current Triple Play bundle (including fixed line phone, fixed broadband and Pay TV)
– A current standalone Pay TV service (where this service has been purchased as a standalone service, not in a bundle with any other service(s)).
Active participants: the combined sample of all Switchers and Considerers based on the above definitions
Inactive participants: those respondents who have neither switched (in the last 2 years) nor considered switching (in the last 12 months) any of these services (pay-monthly mobile phone/fixed line phone/fixed broadband/Pay TV).

Customer Retention and Interoperability Research
Prepared for: Ofcom 13
This report has been prepared with collaboration between Ofcom and Jigsaw Research and it is presented in the following sections:
Section 1: Executive Summary
Section 2: Introduction
Section 3: Services: Switching Provider and Making Choices
Section 4: Services: Difficulties Encountered in the Switching Journey
Section 5: Services: Save Activity
Section 6: Devices: Changing Devices and Making Choices
Section 7: Devices: Interoperability and Content Sharing
The Appendices include example discussion guides (Appendix A), the questionnaire (Appendix B) and a more detailed explanation of the methodology (Appendix C).

Customer Retention and Interoperability Research
Prepared for: Ofcom 14
3 Services: Switching Provider and Making Choices
3.1 Introduction This section provides an overview of the profiles of both ‘inactive participants’ as well as ‘active participants’ across each of the pay-monthly Mobile, Dual Play, Triple Play and standalone Pay TV markets. It considers the factors that drive Switchers and Considerers to first review their existing arrangements and the factors that are important in the subsequent decision to switch or stay with their communications provider.
A number of key definitions are relevant for this section of the report:
Service Areas
Pay-monthly Mobile: on a pay-monthly contract (post-pay) that is personally used and paid for
Dual Play: have fixed line phone AND fixed broadband internet access in a bundle or package from the SAME supplier
Triple Play: have landline/fixed line phone AND fixed broadband internet access AND pay TV service in a bundle or package from the SAME supplier
Standalone Pay TV: have Pay TV but not bundled with other services (respondent may have other services but with different suppliers)
Market participation
Switchers: changed communications provider for one of the following four services in the last 2 years (the last 12 months and last 13-24 months are split out where base sizes allow)
Considerers: actively considered changing communications provider for one of the following four services in the last 12 months but decided against it
– A current pay-monthly mobile phone service
– One or more services within a current Dual Play bundle (including fixed line phone and fixed broadband)
– One or more services within a current Triple Play bundle (including fixed line phone, fixed broadband and Pay TV)
– A current standalone Pay TV service (where this service has been purchased as a standalone service, not in a bundle with any other service(s)).
Active participants: the combined sample of all Switchers and Considerers based on the above definitions.
Inactive participants: those respondents who have neither switched (in the last 2 years) nor considered switching (in the last 12 months) any of these services (pay-monthly mobile phone/fixed line phone/fixed broadband/Pay TV).
3.2 Switchers and Considerers: Profile
3.2.1 Overview of switching/switching consideration activity
To qualify for the main survey, respondents had either to have switched providers across the pay-monthly Mobile, Dual Play, Triple Play or Standalone Pay TV markets in the last two years (referred to in this report as ‘Switchers’), or to have considered switching providers across one

Customer Retention and Interoperability Research
Prepared for: Ofcom 15
of these services within the last 12 months but decided against it (referred to in this report as ‘Considerers’).
In the initial screening sample of UK residential consumers, all had at least one of the four services (mobile phone, landline/fixed line phone, fixed broadband and Pay TV), and 93% had more than one. A little over half (58%) were in a bundled package of some sort; 27% in a Dual Play bundle, 25% in a Triple Play bundle and 6% in some other type of bundle1. The vast majority owned a personal mobile (96%) and one in four (28%) had Standalone Pay TV (not as part of a bundle).
However, close to two thirds (65%) had neither switched nor considered switching any of these services within the relevant time periods, and therefore failed to qualify for the main survey. These respondents were classified as ‘inactive participants’ and responded to a subset of 10 questions relating to their decision not to switch or to consider switching, as reported below.
Within each of the mobile phone, fixed line phone and fixed broadband markets, the screening survey identified one Switcher (i.e. switched in the last two years) in every five users, and one Considerer (i.e. considered in the last twelve months) in every ten users. Active participation levels found within the Pay TV market were significantly lower (15% Switchers and 8% Considerers).
Figure 1: Extent to which people have changed company providing services in the last two years
Source: QB1/QB7 Base: Total Sample n=7497; Mobile n=6349; Fixed Line Phone n=6016; Fixed Broadband n=6107; Pay TV n=4313
Those with a Dual Play bundle are more likely to have switched communications provider in the last 2 years for the relevant services in their bundle (namely their fixed phone or fixed broadband provider) than either their mobile or Pay TV provider.
Compared to the average consumer, Dual Play users are less likely to have switched Pay TV provider in this time period, whereas Triple Play users are more likely to have switched Pay TV provider in this time period.
1 Broadly comparable with Ofcom’s technology tracker Q3 2012 – 56% bundlers
64
54
56
53
16
16
15
16
8
9
9
12
6
9
10
9
9
13
13
13
Pay TV
Fixed line broadband
Fixed line phone
Mobile Phone network
None of these Currently considering Actively considered Switched >12m Switched <12m
22
23
22
15
% switched
57
90
91
96
Pay TV
Landline Phone
Fixed Broadband
Mobile Phone
% using

Customer Retention and Interoperability Research
Prepared for: Ofcom 16
Figure 2: Extent to which Dual Play and Triple Play bundle users have changed company providing services in the last two years
Source: QB1/QB7 Base: Dual Play n=2000 and Triple Play n=1870; Dual Play; with each service in household
A more detailed analysis provides further insight into the type of switching conducted by those using bundled packages, as follows:
Dual Play Switchers2:
16% switched broadband only
19% switched telephone only
65% switched both services.
Triple Play Switchers3:
3% switched broadband only
8% switched telephone only
4% switched TV only
19% switched BB and telephone
3% switched BB and TV
1% switched telephone and TV
62% switched all three services.
2 Data reporting proportions switching two or more services may include consumers switching both services
at the same time as well as those switching multiple services within the same period but not at the same time.
3 Data reporting proportions switching two or more services may include consumers switching both services at the same time as well as those switching multiple services within the same period but not at the same time.
67
52
53
56
16
15
14
16
9
11
10
11
4
10
10
8
4
14
15
12
Pay TV
Fixed line broadband
Fixed line phone
Mobile Phone network
None of these Currently considering Actively considered
61
58
57
52
15
15
15
17
8
8
8
12
8
10
10
10
11
14
15
14
Pay TV
Fixed line broadband
Fixed line phone
Mobile Phone network
None of these Currently considering Actively considered
24
25
24
19
% switched
20
25
24
8
% switched
Dual Play Triple Play

Customer Retention and Interoperability Research
Prepared for: Ofcom 17
3.2.2 Attitudes of Switchers and Considerers4
A series of questions were included to better understand/ profile consumer attitudes towards technology.
Switchers and Considerers differ from users as a whole in terms of attitudes to technology; they express significantly more interest in keeping up with technology, display significantly greater confidence in their own knowledge, and are significantly more likely to agree that friends come to them for technical help.
Figure 3: Agreement with attitudinal statements about technology - mobile users
Source: QA7 Base: Mobile in HH n=7199: Mobile Network Switchers < 12 months n=477; Mobile Network Switchers > 12 months n=307; Considerers n=426
Recent Switchers in the Dual Play market (those changing communications provider within the last 12 months) have the most technically minded profile of all Dual Play users. While they are no more likely to keep up-to-date with technology and no more confident in their knowledgeable levels, they are significantly more likely to agree that their friends come to them with technical questions (49%, 9% higher than Dual Play users overall).
4 Data reporting proportions switching two or more services may include consumers switching both services
at the same time
4
14
3
11
18
8
25
27
17
39
28
46
21
13
26
I'm as knowledgeable as the next person
Friends come to me with tech. questions
I try to keep up with technology
Disagree strongly Disagree slightly Neither Agree slightly Agree strongly
72
41
60
Mobile in HH% agree
% agreeSwitchers
< 12 months
81 82 82
53 54 57
71 72 75
% agreeSwitchers
> 12 months
% agreeConsiderers

Customer Retention and Interoperability Research
Prepared for: Ofcom 18
Figure 4: Agreement with attitudinal statements about technology - Dual Play users
Source: QA7 Base: All Dual Play n=2000: Dual Play Switchers < 12 months n=248; Dual Play Switchers > 12 months n=172; Considerers n=100
Both Switchers and Considerers in the Triple Play market are significantly more ‘techy’ than Triple Play users as a whole.
Figure 5: Agreement with attitudinal statements about technology - Triple Play users
Source: QA7 Base: All Triple Play n=1928: Triple Play Switchers < 12 months n=285; Triple Play Switchers > 12 months n=203; Considerers n=124
Pay TV users display a similar profile to Triple Play users; both Switchers and Considerers are significantly more ‘techy’ than Pay TV users overall.
4
14
2
11
18
9
26
28
16
38
27
48
21
12
25
I'm as knowledgeable as the next person
Friends come to me with tech. questions
I try to keep up with technology
Disagree strongly Disagree slightly Neither Agree slightly Agree strongly
73
40
59
All Dual Play% agree
% agreeSwitchers
< 12 months
76 76 74
49 35 38
64 63 55
% agreeSwitchers
> 12 months
% agreeConsiderers
4
14
3
10
18
8
21
25
16
40
28
45
25
15
28
I'm as knowledgeable as the next person
Friends come to me with tech. questions
I try to keep up with technology
Disagree strongly Disagree slightly Neither Agree slightly Agree strongly
73
43
65
All Triple Play% agree
% agreeSwitchers
< 12 months
82 78 82
54 52 49
70 73 76
% agreeSwitchers
> 12 months
% agreeConsiderers
Customer Retention and Interoperability Research
Prepared for: Ofcom 19
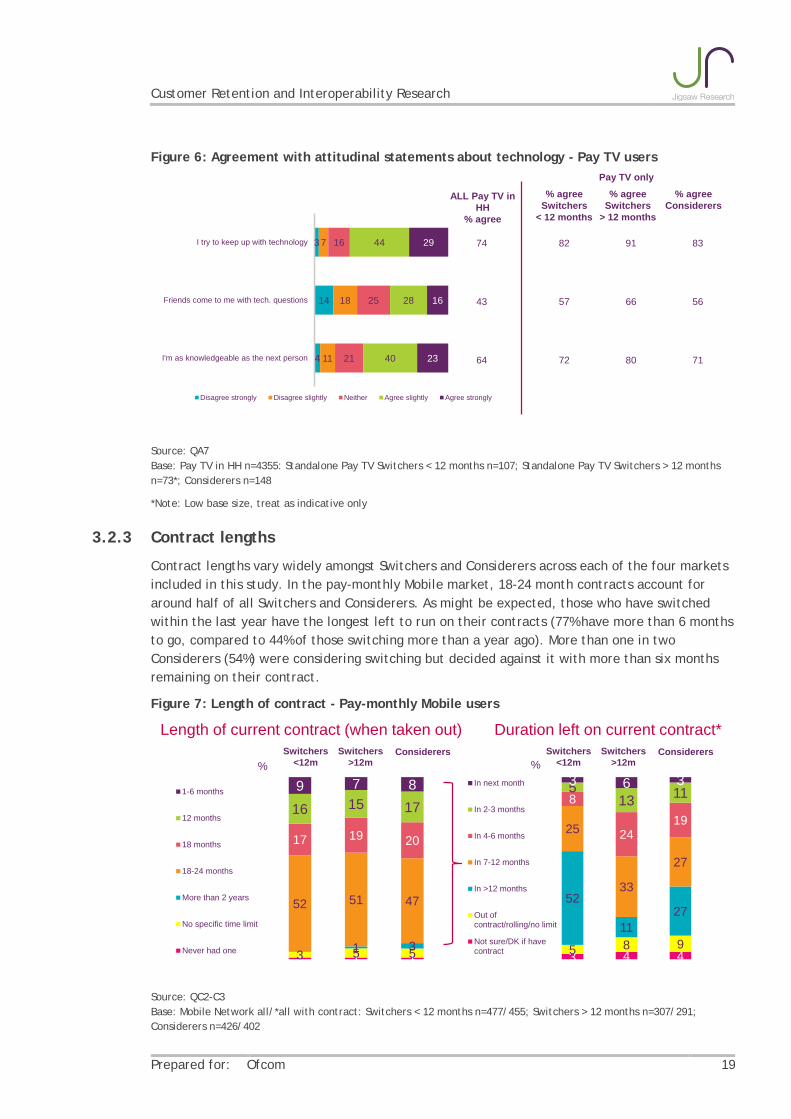
Figure 6: Agreement with attitudinal statements about technology - Pay TV users
Source: QA7 Base: Pay TV in HH n=4355: Standalone Pay TV Switchers < 12 months n=107; Standalone Pay TV Switchers > 12 months n=73*; Considerers n=148
*Note: Low base size, treat as indicative only
3.2.3 Contract lengths
Contract lengths vary widely amongst Switchers and Considerers across each of the four markets included in this study. In the pay-monthly Mobile market, 18-24 month contracts account for around half of all Switchers and Considerers. As might be expected, those who have switched within the last year have the longest left to run on their contracts (77% have more than 6 months to go, compared to 44% of those switching more than a year ago). More than one in two Considerers (54%) were considering switching but decided against it with more than six months remaining on their contract.
Figure 7: Length of contract - Pay-monthly Mobile users
Source: QC2-C3 Base: Mobile Network all/*all with contract: Switchers < 12 months n=477/455; Switchers > 12 months n=307/291; Considerers n=426/402
4
14
3
11
18
7
21
25
16
40
28
44
23
16
29
I'm as knowledgeable as the next person
Friends come to me with tech. questions
I try to keep up with technology
Disagree strongly Disagree slightly Neither Agree slightly Agree strongly
74
43
64
ALL Pay TV in HH
% agree
% agreeSwitchers
< 12 months
82 91 83
57 66 56
72 80 71
% agreeSwitchers
> 12 months
% agreeConsiderers
Pay TV only
Switchers >12m%
1 1 13 5 51 3
52 51 47
17 19 20
16 15 179 7 81-6 months
12 months
18 months
18-24 months
More than 2 years
No specific time limit
Never had one
%
Length of current contract (when taken out)
3 4 45 8 9
52
1127
25
33
27
8
2419
513 11
3 6 3In next month
In 2-3 months
In 4-6 months
In 7-12 months
In >12 months
Out ofcontract/rolling/no limit
Not sure/DK if havecontract
Switchers <12m
Considerers
Duration left on current contract*Switchers
>12mSwitchers
<12mConsiderers

Customer Retention and Interoperability Research
Prepared for: Ofcom 20
Initial contract lengths in the landline and broadband Dual Play market look very similar. They are shorter on average than in the pay-monthly Mobile market, most commonly one year in length. As a result, both Switchers and Considerers tend to have less time remaining. However close to one in five are not aware of having a specified time limit.
Almost one in two Considerers (46% with fixed line phone/44% with fixed broadband) were considering switching but decided against it with more than six months remaining on their contract.
Figure 8: Length of contract - Fixed Line Phone Dual Play users
Source: QC2-C3 Base: Dual Play all/*all with contract: Switchers < 12 months n=248/199; Switchers > 12 months n=172/128; Considerers n=100/75**
** Note: Low base size, treat as indicative only
Figure 9: Length of contract - Fixed Broadband Dual Play users
Source: QC2-C3 Base: Dual Play all/*all with contract: Switchers < 12 months n=248/203; Switchers > 12 months n=172/129; Considerers n=100/73**
** Note: Low base size, treat as indicative only
Switchers >12m%
9 7 52 7 9
18 18 161 1 25
9 717
1913
43 33 48
5 5 11-6 months
12 months
18 months
18-24 months
More than 2 years
No specific time limit
Never had one
Don't know
%
Length of current contract (when taken out)
13 18 143
16 1716
6 6
41 23 40
1820
13
6 11 83 5 4In next month
In 2-3 months
In 4-6 months
In 7-12 months
In >12 months
Out ofcontract/rolling/no limit
Not sure/DK if havecontract
Switchers <12m
Considerers
Duration left on current contract*Switchers
>12mSwitchers
<12mConsiderers
Switchers >12m%
9 9 62 5 8
17 20 191
248
518
1915
4229 44
7 8 41-6 months
12 months
18 months
18-24 months
More than 2 years
No specific time limit
Never had one
Don't know
%
Length of current contract (when taken out)
13 18 182
14 1215
8 5
41 25 39
19 2213
6 9 75 5 5In next month
In 2-3 months
In 4-6 months
In 7-12 months
In >12 months
Out ofcontract/rolling/no limit
Not sure/DK if havecontract
Switchers <12m
Considerers
Duration left on current contract*Switchers
>12mSwitchers
<12mConsiderers

Customer Retention and Interoperability Research
Prepared for: Ofcom 21
Landline, broadband and Pay TV Triple Play users have similar lengths of contracts. As in the Dual Play market one year contracts dominate among both Switchers and Considerers, the majority of whom are aware of having a fixed time period.
Relatively high proportions of Triple Play users who have been out of the market for more than a year claim not to have a specified time limit on their contract: around one in four of those who switched more than a year ago, rising to around one in three Considerers. It follows that some of these same users (more than one in three) are unable to identify how long they have remaining on their contract, either because they are on a rolling contract or because they are not aware of their contractual situation.
Figure 10: Length of contract - Fixed Line Phone Triple Play users
Source: QC2-C3 Base: Triple Play all/*all with contract: Switchers < 12 months n=285/244; Switchers > 12 months n=203/150; Considerers n=124/72**
** Note: Low base size, treat as indicative only
Figure 11: Length of contract - Fixed Broadband Triple Play users
Source: QC2-C3 Base: Triple Play all/*all with contract: Switchers < 12 months n=285/243; Switchers > 12 months n=203/149; Considerers n=124/72**
Switchers >12m%
7 15 1132 612
2334
3
4
3
5
13
8
45040
32
9 8 51-6 months
12 months
18 months
18-24 months
More than 2 years
No specific time limit
Never had one
Don't know
%
Length of current contract (when taken out)
1329
174
1619
12
54
3515 18
17 17 15
10 8 159 11 3In next month
In 2-3 months
In 4-6 months
In 7-12 months
In >12 months
Out ofcontract/rolling/no limit
Not sure/DK if havecontract
Switchers <12m
Considerers
Duration left on current contract*Switchers
>12mSwitchers
<12mConsiderers
Switchers >12m%
9 15 92
3 614
23 351
12
3
44
15
84
48 37 32
9 9 81-6 months
12 months
18 months
18-24 months
More than 2 years
No specific time limit
Never had one
Don't know
%
Length of current contract (when taken out)
1426 19
3
20 2614
5 43315 19
19 16 14
10 9 157 11 3In next month
In 2-3 months
In 4-6 months
In 7-12 months
In >12 months
Out ofcontract/rolling/no limit
Not sure/DK if havecontract
Switchers <12m
Considerers
Duration left on current contract*Switchers
>12mSwitchers
<12mConsiderers

Customer Retention and Interoperability Research
Prepared for: Ofcom 22
** Note: Low base size, treat as indicative only
Figure 12: Length of contract – Pay TV Triple Play users
Source: QC2-C3 Base: Triple Play all/*all with contract: Switchers < 12 months n=285/210; Switchers > 12 months n=203/138; Considerers n=204/68**
** Note: Low base size, treat as indicative only
Switchers and Considerers in the Standalone Pay TV market are similarly unsure of their contractual arrangements, suggesting either that fixed time period contracts are less commonplace, or that users are less familiar with what their contractual situation is.
Figure 13: length of contract – Standalone Pay TV users
Source: QC2-C3 Base: Triple Play all/*all with contract: Switchers < 12 months n=285/243; Switchers > 12 months n=203/149; Considerers n=124/72**
** Note: Low base size, treat as indicative only
Switchers >12m%
8 13 64
45
2329 39
22 2
54 4
139 3
40 32 33
6 8 81-6 months
12 months
18 months
18-24 months
More than 2 years
No specific time limit
Never had one
Don't know
%
Length of current contract (when taken out)
1122 16
5
20 2417
4 434 17 19
14 13 17
9 1216
9 11 3In next month
In 2-3 months
In 4-6 months
In 7-12 months
In >12 months
Out ofcontract/rolling/no limit
Not sure/DK if havecontract
Switchers <12m
Considerers
Duration left on current contract*Switchers
>12mSwitchers
<12mConsiderers
Switchers >12m%
11 13 53 2
3
1223 432
3
2
6
5
17
93
47 3231
7 13 81-6 months
12 months
18 months
18-24 months
More than 2 years
No specific time limit
Never had one
Don't know
%
Length of current contract (when taken out)
14 18 145
202112
63
37 11 21
20
1624
816
144 9 3In next month
In 2-3 months
In 4-6 months
In 7-12 months
In >12 months
Out ofcontract/rolling/no limit
Not sure/DK if havecontract
Switchers <12m
Considerers
Duration left on current contract*Switchers
>12mSwitchers
<12mConsiderers

Customer Retention and Interoperability Research
Prepared for: Ofcom 23
3.2.4 Profile of ‘inactive’ participants
‘Inactive’ participants (i.e. those who have neither switched, nor considered switching any of the four services within the relevant timeframe) are significantly older and less affluent than the sample of residential consumers as a whole, and are significantly more likely to live outside London:
Almost one in two (45%) are aged 55 or above, 9 percentage points more than the UK average
– Fewer than one in five (17%) are aged under 35 years, 11 percentage points less than the UK average
Three in ten (30%) are in the lowest social grades, DE, 6 percentage points more than the UK average
– One in five (21%) are in the highest social grade, AB, 5 percentage points less than the UK average
Fewer than one in ten (9%) live in London, 3 percentage points less than the UK average.
‘Inactive’ participants are also significantly less likely to consider themselves technically minded than the sample of residential consumers overall:
Although the majority (63%) agree that they try to keep up with technology, this is 9 percentage points less than the UK average
One in two (51%) agree they are as knowledgeable about technology as the next person, 9 percentage points less than the UK average
A smaller minority (29%) agree that friends come to them with questions about technology, 12 percentage points less than the UK average.
Supporting comments from the qualitative stage
Participants in the qualitative stage who had either switched communications provider in the last two years, or actively considered switching communications provider in the last 12 months but decided not to, tended not to feel there was much differentiation between providers in the mobile market; they often felt there was little to distinguish between the tariffs, coverage, service and availability of handsets offered by different mobile networks.
In the triple play market, participants stated that they tend to select an ‘anchor’ service that is considered more important than the other services, and that this tends to determine which communications provider they choose:
If Pay TV is the most important element of their package, then they claimed they were more inclined to select the communications provider perceived to be offering the best pay TV service and also use this communications provider for their broadband and phone services
If they prioritise their internet service, providers are chosen for having the perceived fastest and most reliable services – they are willing to make compromises on their Pay TV
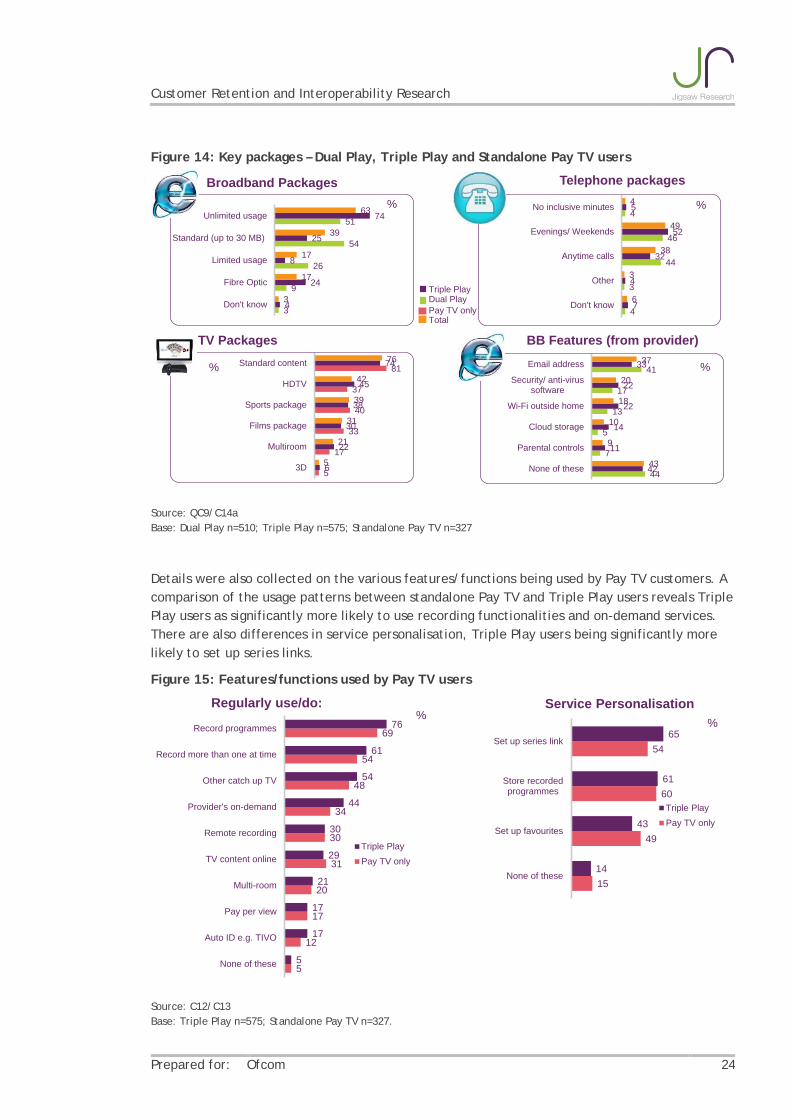
During the quantitative survey, detailed information was also collected on the different packages held in each market. The results of this audit are illustrated below.
Customer Retention and Interoperability Research
Prepared for: Ofcom 24
Figure 14: Key packages – Dual Play, Triple Play and Standalone Pay TV users
Source: QC9/C14a Base: Dual Play n=510; Triple Play n=575; Standalone Pay TV n=327
Details were also collected on the various features/functions being used by Pay TV customers. A comparison of the usage patterns between standalone Pay TV and Triple Play users reveals Triple Play users as significantly more likely to use recording functionalities and on-demand services. There are also differences in service personalisation, Triple Play users being significantly more likely to set up series links.
Figure 15: Features/functions used by Pay TV users
Source: C12/C13 Base: Triple Play n=575; Standalone Pay TV n=327.
3
9
26
54
51
4
24
8
25
74
3
17
17
39
63
Don't know
Fibre Optic
Limited usage
Standard (up to 30 MB)
Unlimited usage
4
3
44
46
4
7
4
32
52
5
6
3
38
49
4
Don't know
Other
Anytime calls
Evenings/ Weekends
No inclusive minutes
Broadband Packages Telephone packages
TV Packages BB Features (from provider)
5
17
33
40
37
81
6
22
30
38
45
74
5
21
31
39
42
76
3D
Multiroom
Films package
Sports package
HDTV
Standard content
44
7
5
13
17
41
42
11
14
22
22
33
43
9
10
18
20
37
None of these
Parental controls
Cloud storage
Wi-Fi outside home
Security/ anti-virussoftware
Email address
%%
%%
Triple PlayDual PlayPay TV onlyTotal
5
12
17
20
31
30
34
48
54
69
5
17
17
21
29
30
44
54
61
76
None of these
Auto ID e.g. TIVO
Pay per view
Multi-room
TV content online
Remote recording
Provider's on-demand
Other catch up TV
Record more than one at time
Record programmes
Triple PlayPay TV only
15
49
60
54
14
43
61
65
None of these
Set up favourites
Store recordedprogrammes
Set up series link
Triple PlayPay TV only
Regularly use/do: Service Personalisation%
%

Customer Retention and Interoperability Research
Prepared for: Ofcom 25
3.3 Switchers and Considerers: Decision Drivers
3.3.1 How strongly wanted to review existing arrangements
Supporting qualitative comments
The qualitative research highlighted a strong perceived stated need amongst some consumers to periodically review the market to determine whether or not they were still getting the best/a good enough deal. Two different types of mind-set emerged in this regard:
Browsing and trying to save money: consumers who are less committed to switching communications provider and will only do a limited amount of information gathering. These consumers describe their efforts to engage in the switching journey as part of their ‘due diligence’. Casual considerers are more inclined to stay with their communications provider than go through the upheaval of switching, and are therefore really looking for a reason to stay rather than a reason to switch, as reflected in the following quote:
– “You need to look around every now and again to make sure you are not being ripped off and as long as you save money, it’s not usually worth switching.” Male, Wales, triple play bundle
Comprehensively comparing the market: consumers who are more serious about switching communications provider and will undertake a more comprehensive review of the market that takes more time and effort. Active considerers are less likely to be persuaded by their communications provider:
– “It really annoyed me that my communications provider didn’t give me their best deal straight away and it was a point of principle that I switched.” Male, London, pay TV owner
In the main quantitative stage, the majority of Switchers claim they wanted to change communications provider ‘very’ or ‘fairly’ strongly (at least three in four across the four service areas) when they first started to think about switching.
It is useful to recall here – as originally noted on page 16 of this report - that most Dual Play switchers (65%) changed communications provider for both services (Fixed Line Phone and Fixed Broadband), and most Triple Play switchers (62%) changed provider for all three services (Fixed Phone, Fixed Broadband and Pay TV).5
Around a third of Considerers (around one in three) claim they didn’t strongly want to change communications provider when they started to think about switching. Those who are currently in a Dual Play bundle were more motivated to switch communications provider at the time than other users (71% say they strongly wanted to change their communications provider at the time, at least ten percentage points more than Considerers in the other markets).
5 Those switching two or more services may include consumers switching both services at the same time as
well as those switching multiple services within the same period but not at the same time.

Customer Retention and Interoperability Research
Prepared for: Ofcom 26
Figure 16: How strongly wanted to change communications provider when started to think about switching
Source: QC17b Base: All Mobile Phone Switchers/Considerers n=774/426; All Dual Play Switchers/Considerers n=410/100; All Triple Play Switchers/Considerers n=451/124; All Pay TV (only) Switchers/Considerers n=179/148
3.3.2 Triggers prompting initial review of existing arrangements
The qualitative research indicated that consumers felt that there were a range of push and pull factors across different services and providers that encourage consumers to think about switching:
In the main quantitative stage, the results suggest that cost is the primary trigger prompting users to review their existing arrangements among both Switchers and Considerers, across all services; whether this takes the form of a ‘push factor’ (a sense that they are paying too much to their existing communications provider) or a ‘pull factor’ (spotting a better deal from a new communications provider), as the following data illustrates.
8
9
8
9
30
28
19
33
51
45
57
43
10
16
14
14
Pay TV (only)
Triple Play
Dual Play
Mobile Phone
Not at all (hoping for deal)Not very stronglyFairly stronglyVery strongly
2
4
5
6
16
11
14
19
50
44
46
45
26
39
33
29
Pay TV (only)
Triple Play
Dual Play
Mobile Phone
Not at all (hoping for deal)Not very stronglyFairly stronglyVery strongly
ALL SWITCHERS% strongly
74
79
83
76
ALL CONSIDERERS
% strongly
57
71
61
61

Customer Retention and Interoperability Research
Prepared for: Ofcom 27
Among pay-monthly Mobile users, the desire to get a new handset is the factor most likely to be claimed by Switchers as triggering them to first think about switching (cited by 42%). The desire to reduce cost is also a common trigger: 35% claim they were prompted by a better deal/price with an alternative communications provider, 23% spotted a specific deal or tariff from an alternative communications provider and 20% claim they were dissatisfied with the high prices charged by their current communications provider. Another key factor is the contract situation; more than one in four (28%) claim they were prompted into reviewing their arrangements when their contract came to an end.
The key factors that Considerers claim made them first think about switching their mobile service were a desire to get a new handset (cited by 38%), a contract coming to an end (cited by 35%) and high prices from their communications provider (cited by 25%). However one in four (24%) claim they simply reviewed their mobile service as part of a regular review of the deals available on the market.
Figure 17: Reasons for first deciding to review arrangements – Pay-monthly Mobile users
Source: QC17a Base: All Mobile Phone Switchers/Considerers n=774/426
In the Dual Play market, the top three tipping points that Switchers claim prompted them to review their service at the time were spotting a better deal/price (cited by 41%), dissatisfaction with current charges (cited by 34%) and product/service issues (cited by 29%).
One in three Considerers (35%) claim they were prompted to review their existing service as part of a regular review of the deals available on the market. A similar proportion (34%) claim they were prompted to consider switching by the desire for faster broadband. The other two key triggers claimed by Considerers include their contract expiring and product/service issues (both cited by 29%).
42
35
28
23
20
18
17
14
10
9
7
7
5
4
3
38
21
35
15
25
20
12
10
24
8
10
5
3
5
2
Want new handset
Better deal/price with other provider
Contract/deal came to an end
Specific deal/tariff
High prices current provider
Want more minutes/data
Unhappy with product/service
Unhappy with customer service
Regularly review for best deal
Friends/family have it (discounts)
Heard about other technology/services
Access more content
Bundling convenience
Better device compatibility
Moved new property/area
SwitcherConsiderer
%

Customer Retention and Interoperability Research
Prepared for: Ofcom 28
Figure 18: Reasons for first deciding to review arrangements – Dual Play users
Source: QC17a Base: All Dual Play Switchers/Considerers n=410/100
Price is again a key trigger in the Triple Play market, both in terms of spotting a better deal/price or dissatisfaction with current charges. Among Switchers, these two triggers were cited by 36% and 31% respectively; among Considerers, they were cited by 26% and 46% respectively.
The convenience of combining services with a single communications provider and the desire for faster broadband are also influential triggers to switching for at least one in four Switchers (cited by 29% and 24% respectively).
One in five Considerers (21%) also claim to have reviewed their service as part of a regular review of the deals available on the market.
41
34
29
25
19
15
15
14
13
10
7
3
3
2
2
24
25
29
23
34
29
5
35
7
10
11
6
0
1
3
Better deal/price with other provider
High prices current provider
Unhappy with product/service
Unhappy with customer service
Wanted faster Broadband
Contract/deal came to an end
Bundling convenience
Regularly review for best deal
Moved new property/area
Specific deal/tariff
Better download allowance
Heard about other technology/services
Better device compatibility
Friends/family have it (discounts)
Access more content
SwitcherConsiderer
%

Customer Retention and Interoperability Research
Prepared for: Ofcom 29
Figure 19: Reasons for first deciding to review arrangements – Triple Play users
Source: QC17a Base: All Triple Play Switchers/Considerers n=451/124
In the standalone Pay TV market, price is again the key tipping point. Around one in five claim they were prompted to review their arrangements as a result of seeing a better deal (cited by 23% of both Switchers and Considerers). High prices from current providers follow, cited as a trigger by 19% of Switchers and 50% of Considerers.
In addition, a similar proportion of Switchers claim they were prompted to consider switching as a result of being dissatisfied with their existing product/service (cited by 22%) and/or claim they were seeking more/better content/channels (cited by 19%). Moving house is also a natural switching trigger for this audience (cited by 20%).
Besides price, Considerers’ activity is again most likely to result from a regular review of the market (cited by 27%).
3631
2924
2020
1515
12111111
9999
88
64
2646
612
1715
114
114
38
211010
812
256
Better deal/price with other providerHigh prices current provider
Bundling convenienceWant faster broadband
Unhappy with product/serviceUnhappy with customer service
Contract/deal came to an endMoved new property/areaWanted better set-top box
Specific deal/tariffWant bigger download allowance
Wanted more/better sports contentRegularly review for best deal
Access more contentWanted other content/channels
Wanted HD or 3DHeard about other technology/services
Better device compatibilityFriends/family have it (discounts)
Wanted more/better movie content
SwitcherConsiderer
%

Customer Retention and Interoperability Research
Prepared for: Ofcom 30
Figure 20: Reasons for first deciding to review arrangements – Standalone Pay TV users
Source: QB10a/b Base: All Pay TV (only) Switchers/Considerers n=179/148
3.3.3 Factors underpinning choice when considering or switching to a new communications provider
To determine the relative importance of the various elements that underpin the choice of a new communications provider in these markets, a simple trade-off approach was conducted (Maximum Difference Scaling - or MaxDiff).
Details of this methodology are provided in Appendix 2 but in summary, active participants were shown different groups of criteria that could affect their choice of communications provider, in various combinations. For each combination, respondents were asked to indicate which of the elements in the combination was the most important and which was the least important to them when switching, or considering, a new communications provider. Respondents were also asked to take into consideration anything that may have changed between the time of the fieldwork and the time they previously switched or considered switching communications provider (in terms of how they use the services or what services are available) in order to take account of current attitudes to the services as opposed to those they may have had when they switched previously.
The precise list of criteria that each respondent rated was tailored by service from the following:
OPERATING SYSTEM
– Availability of specific operating systems
INTEROPERABILITY
– Ease of transferring content
– Ease of integration
DEVICE/FUNCTIONALITY
– Availability of specific devices
%23
2220
1919
1716
1414
1212
1199
84
3
238
750
44
1114
615
1110
612
273
6
Better deal/price with other provider
Unhappy with product/service
Moved new property/area
High prices current provider
Wanted other content/channels
Access more content
Wanted better set-top box
Bundling convenience
Wanted more/better sports content
Contract/deal came to an end
Wanted more/better movie content
Unhappy with customer service
Wanted HD or 3D
Heard about other technology/services
Regularly review for best deal
Better device compatibility
Friends/family have it (discounts)
SwitcherConsiderer

Customer Retention and Interoperability Research
Prepared for: Ofcom 31
– Latest technology/functions
– Amount of storage on set top box
– Best viewing experience
– Auto ID of shows you may like
PACKAGE
– Call packages offered
– Amount of data included
– Contract length
– Additional benefits
– Ability to access TV content online
– Catch up / anytime TV
– Exclusive channels
– Sports package
– Film package
BRAND
– Previous experience
– Preferred brand
– Customer service
NETWORK RELIABILITY
– Reliability of network/broadband service
– Speed of broadband connection
– Internet traffic management policies
COST
– On-going monthly costs
– Cost of mobile handset
– Introductory offer
– Bundling discount
– Upfront costs
– Installation costs
BUNDLING
– Bundling convenience
WORD OF MOUTH (WOM)
– Recommended by family/friends
– Recommended by experts
The resulting scores are reported on a 0 to 100 scale to indicate their relative importance when switching/considering switching to a new communications provider. The individual or ‘micro’ criteria (e.g. ‘recommended by family/friends’ and ‘recommended by experts’) were grouped together into high level ‘macro’ factors (e.g. ‘word of mouth’) at the analysis stage.

Customer Retention and Interoperability Research
Prepared for: Ofcom 32
Looking first at this macro level, the MaxDiff analysis identifies cost, package, reliability and functionality elements as key decision drivers for active participants when considering a new communications provider, across all services. Cost and package elements have the greatest impact on provider choice, accounting for between 50% and 57% of importance, depending on the service. While network reliability and device functionality also exert an influence on decisions, their respective impact depends on the service (network reliability elements were not included in the exercise for Pay TV users, device functionality elements were not included in the exercise for Dual Play users).
The analysis indicates that interoperability is a minor consideration, accounting for between 2% and 6% of provider choice depending on the service.
Figure 21: Relative importance of macro decision-making criteria when changing communications provider
Source: QC18a Base: All Mobile Phone Switchers/Considerers n=1154; All Dual Play Switchers/Considerers n=495; All Triple Play Switchers/Considerers n=553; All Pay TV (only) Switchers/Considerers n=329 (clean data only)
Over the next few pages we present a detailed analysis of the Max Diff scores on each individual element, for each service area. In order to show how these scores vary from the overall sample of active participants, Max Diff scores for each service area are presented as an index, showing the extent to which the scores are above or below the average.
Pay-monthly Mobile
A more detailed analysis of the individual elements driving provider choice among pay-monthly Mobile Switchers and Considerers indicates that network reliability and on-going monthly costs have the greatest influence overall. Individual package elements (the calls/amount of data included), as well as the availability and cost of specific handsets, are also key drivers for these users.
24.337.4
26.8 31.2
25.7
20.1
24.325.4
13.2
24.4
16.6
1314.3
22
10.210.3 7.9 11.4
4.51.9 3.2 5.94.5 2.4 2.6 43.8 4.24.6
Mobile (1154) Dual (495) Triple (553) Pay TV (329)
OperatingSystemBundling
Word of Mouth
Interoperability
Brand
Device/functionalityNetworkreliabilityPackage
Cost

Customer Retention and Interoperability Research
Prepared for: Ofcom 33
Figure 22: Relative importance of individual decision-making criteria when changing communications provider – Pay-monthly Mobile
Source: QC18a Base: All Mobile Phone Switchers/Considerers n=1154 Bars show relative importance of the different elements that make up the various purchase decisions. Max diff scores sum to 100
A more detailed analysis of the individual elements driving choice of pay-monthly Mobile provider among Switchers and Considers reveals that when considering a new provider, Considerers place above average importance on recommendations from family and friends, with an index of 72 on this factor, 15 points more than the average mobile user.
Dual Play
For Dual Play Switchers and Considerers, reliability and speed of connection, as well as on-going monthly costs, are the most important factors guiding provider choice. Individual package elements (the calls/amount of data included), as well as other price elements (bundling discounts and upfront costs) also have an above average impact for these users.
Figure 23: Relative importance of individual decision-making criteria when changing communications provider – Dual Play
83
66
57
45
45
45
36
33
25
Availability of specific OS
Introductory offer
Recommended by family/friends
Ease of transferring content
Previous experience
Preferred brand
Easy to integrate
Additional benefits
Recommended by experts
237
235
169
162
135
131
103
100
94
Reliability of network service
On-going monthly costs
Call packages offered
Amount of data included
Cost of handset
Availability of specific device
Latest technology/functions
Contract length
Customer service
Above average Below averageMax diff score
13.2
13.1
9.4
9.0
7.5
7.3
5.7
5.5
5.2
Max diff score
4.6
3.7
3.1
2.5
2.5
2.5
2.0
1.8
1.4
258
231
215
178
177
153
133
120
111
177
153
133
120
111
Reliability of bb service
On-going monthly costs
Speed of connection
Call packages offered
Bundling discount
Upfront costs
Amount of data included
Customer service
Installation costs
80
77
49
47
37
33
25
24
21
18
13
80
77
49
47
37
33
25
24
21
13
Introductory offer
Bundling convenience
Previous experience
Contract length
Easy to integrate
Preferred brand
Ability to access TV content online
Recommended by family/friends
Internet traffic mgmt policies
Recommended by experts
Additional benefits
Above average Below averageMax diff score*
12.7
11.4
10.6
8.8
8.8
7.6
6.6
6.0
5.6
Max diff score*
4.0
3.8
2.5
2.5
1.9
1.8
1.4
1.3
1.1
1.0
0.8

Customer Retention and Interoperability Research
Prepared for: Ofcom 34
Source: QC18a Base: All Dual Play Switchers/Considerers n=495 Bars show relative importance of the different elements that make up the various purchase decisions. Max diff scores sum to 100
A more detailed analysis of the individual elements driving choice of Dual Play provider among Switchers and Considers reveals that when considering a new provider, Considerers place greater importance on bundling discounts and costs of installation, and less importance on introductory offers, with index scores as follows:
Installation costs: an index of 143, 32 points more than the average Dual Play user
Bundling discounts: an index of 196, 19 points more than the average Dual Play user
Introductory offers: an index of 51, 29 points less than the average Dual Play user.
Triple Play
The most important reliability elements to Triple Play Switchers and Considerers when choosing/considering a new provider relate to the connection itself (reliability and also speed). The cost elements that are most likely to drive provider choice include bundling discounts, on-going monthly costs and upfront costs. The package elements that have the greatest influence on decisions for these users relate to the calls and data included.
Figure 24: Relative importance of individual decision-making criteria when changing communications provider – Triple Play
Source: QC18a Base: All Triple Play Switchers/Considerers n=553 Bars show relative importance of the different elements that make up the various purchase decisions. Max diff scores sum to 100
A more detailed analysis of the individual elements driving choice of Triple Play provider among Switchers and Considers reveals that when considering a new provider, Considerers place greater than average importance on costs (on-going costs and the costs of installation) and catch-up/anytime TV:
On-going costs: an index of 217, 16 points more than the average Triple Play user
Installation costs: an index of 158, 24 points more than the average Triple Play user
246
220
211
201
169
145
144
136
134
129
125
119
102
101
Reliability of bb service
Speed of connection
Bundling discount
On-going monthly costs
Upfront costs
Call packages offered
Amount of data included
Latest technology/functions
Installation costs
Customer service
Bundling convenience
Catch up / Anytime TV
Introductory offer
Amount of storage on set-top box
90
70
68
68
59
58
53
53
51
47
41
40
40
32
27
25
Best viewing experience
Availability of exclusive channels
Sports package
Availability of specific device
Previous experience
Contract length
Easy to integrate
Ability to access TV content online
Preferred brand
Recommended by family/friends
Film package
Internet traffic mgmt policies
Ease of transferring content
Automatic ID of shows you may like
Recommended by experts
Additional benefits
Above average Below averageMax diff score*
8.0
7.2
6.9
6.6
5.5
4.8
4.8
4.5
4.4
4.2
4.2
3.9
3.4
3.4
Max diff score*
3.0
2.4
2.3
2.3
2.0
2.0
1.8
1.8
1.7
1.6
1.4
1.4
1.4
1.1
1.0
0.9

Customer Retention and Interoperability Research
Prepared for: Ofcom 35
Catch-up/anytime TV: an index of 146, 27 points more than the average Triple Play user
Introductory offers are less important to Considerers when considering a new Triple Play provider, along with the convenience of bundling:
Bundling convenience: an index of 93, 32 points less than the average Triple Play user
Introductory offers: an index of 71, 31 points less than the average Triple Play user.
This analysis also shows that those switching only one of the services in their Triple Play bundle (either their Fixed Line Phone, or their Fixed Broadband, or their Pay TV) place more importance on having the latest technology, with an index of 13 points above the average Triple Play user.
To those switching at least two of the services in their Triple Play bundle, bundling discounts and bundling convenience are more important factors, with indexes of 25 and 22 points above the average Triple Play user respectively.
Those switching all three services place greater importance on introductory offers, with an index of 16 points above the average Triple Play user. In general, introductory offers appear to have more influence on provider choice for those switching their Fixed Broadband or Pay TV provider.
Standalone Pay TV
For standalone Pay TV Switchers and Considerers, cost is the greatest priority when choosing/considering a new provider. On-going monthly costs, upfront costs, installation costs and introductory offers are all key drivers of provider choice, each with above average influence in this market.
The elements of device functionality that are most likely to drive choice for standalone Pay TV users are having the latest technology/functions and set-top box storage. Online access and ID features are assigned less than average importance by these users.
At an overall level, content appears to be less important for those with a standalone Pay TV service than cost and functionality, with the exception of catch-up/anytime TV. Availability of exclusive channels is of average importance, while sports and film packages are both below average in importance (although the latter are more important for those with Pay TV through a Triple Play bundle).
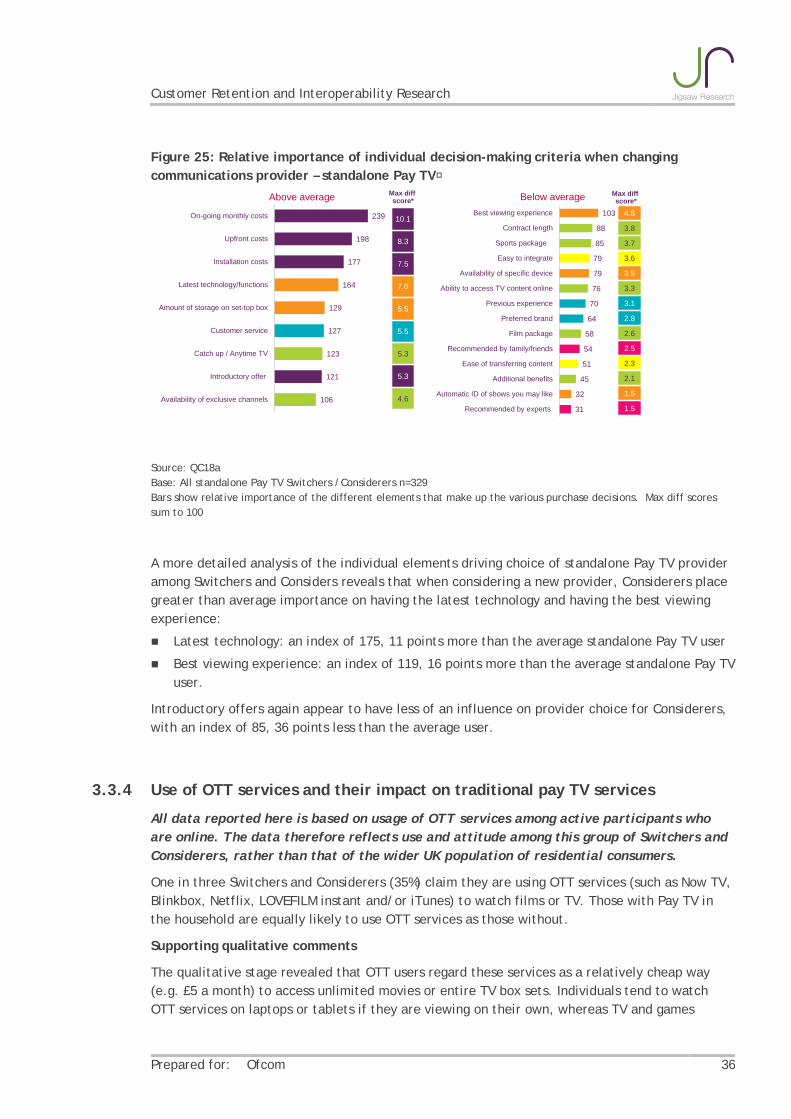
Customer Retention and Interoperability Research
Prepared for: Ofcom 36
Figure 25: Relative importance of individual decision-making criteria when changing communications provider – standalone Pay TV
Source: QC18a Base: All standalone Pay TV Switchers /Considerers n=329 Bars show relative importance of the different elements that make up the various purchase decisions. Max diff scores sum to 100
A more detailed analysis of the individual elements driving choice of standalone Pay TV provider among Switchers and Considers reveals that when considering a new provider, Considerers place greater than average importance on having the latest technology and having the best viewing experience:
Latest technology: an index of 175, 11 points more than the average standalone Pay TV user
Best viewing experience: an index of 119, 16 points more than the average standalone Pay TV user.
Introductory offers again appear to have less of an influence on provider choice for Considerers, with an index of 85, 36 points less than the average user.
3.3.4 Use of OTT services and their impact on traditional pay TV services
All data reported here is based on usage of OTT services among active participants who are online. The data therefore reflects use and attitude among this group of Switchers and Considerers, rather than that of the wider UK population of residential consumers.
One in three Switchers and Considerers (35%) claim they are using OTT services (such as Now TV, Blinkbox, Netflix, LOVEFILM instant and/or iTunes) to watch films or TV. Those with Pay TV in the household are equally likely to use OTT services as those without.
Supporting qualitative comments
The qualitative stage revealed that OTT users regard these services as a relatively cheap way (e.g. £5 a month) to access unlimited movies or entire TV box sets. Individuals tend to watch OTT services on laptops or tablets if they are viewing on their own, whereas TV and games
85
239
198
177
164
129
127
123
121
106
On-going monthly costs
Upfront costs
Installation costs
Latest technology/functions
Amount of storage on set-top box
Customer service
Catch up / Anytime TV
Introductory offer
Availability of exclusive channels
103
88
85
79
79
76
70
64
58
54
51
45
32
31
Best viewing experience
Contract length
Sports package
Easy to integrate
Availability of specific device
Ability to access TV content online
Previous experience
Preferred brand
Film package
Recommended by family/friends
Ease of transferring content
Additional benefits
Automatic ID of shows you may like
Recommended by experts
Above average Below averageMax diff score*
10.1
8.3
7.5
7.0
5.5
5.5
5.3
5.3
4.6
Max diff score*
4.5
3.8
3.7
3.6
3.5
3.3
3.1
2.8
2.6
2.5
2.3
2.1
1.5
1.5

Customer Retention and Interoperability Research
Prepared for: Ofcom 37
consoles are more likely to be utilised when watching content with other viewers. There were few reported difficulties connecting OTT services to different devices.
As noted previously, the quantitative data shows that Switchers and Considerers often have significantly younger, more affluent and more technically minded profiles than the overall user population. OTT service users are even younger, even more affluent and even more technically minded, as the following data indicates:
Stated usage of OTT services rises significantly to 50% among 18-34 year olds and falls to 17% among those aged 55 or above
Stated usage of OTT services rises significantly to 44% in the highest social grades (AB) and falls to 17% among the lowest social grades (DE)
OTT users are significantly more likely to agree that friends come to them with questions about technology (45%).
OTT users are also significantly more likely to live in London (50%) and to have significantly larger households (usage rises to 42% among households of three or more).
Figure 26: Whether used to watch films/TV programmes
Source: QC15c Base: Total Sample n=2612: Mobile in HH n=2554; Dual Play n=912; Triple Play n=858; Pay TV in HH n=1752
The majority of these OTT users claim to have committed to a monthly subscription, and to be using these services at least once per week. Almost two in five are using free trials.
Preferred viewing methods among this sample of OTT users vary widely by service:
Nearly two-thirds of LOVEFILM customers claim to view content via the main household TV (60%), although laptop/desktop computers are a common alternative (43%).
NetFlix customers are equally as likely to view content via TV as via computer.
Meanwhile, the majority of those using iTunes prefer to use their computer (70%). Tablets and smartphones are the most likely alternative for iTunes customers, with around one in five claiming to use each of these methods respectively.
Mobile in HH
65
4
2
3
13
15
15
35
None of these
Other
Now TV
Blinkbox
Netflix
LOVEFILM instant
iTunes
ANY
% use
35 30 34 35
16 11 16 17
15 12 16 17
13 9 13 15
3 2 4 4
2 1 3 3
4 6 3 3
65 70 66 65
Dual Play Triple Play Pay TV in HH
SERVICES USED

Customer Retention and Interoperability Research
Prepared for: Ofcom 38
Figure 27: When, where and how OTT services used
Source: QE23-25 Base: OTT users LOVEFILM n=211; Netflix n=193; iTunes n=204
Amongst those with Pay TV in the household, while more than one in two (54%) claim that using OTT services has had no effect on their viewing habits, almost one in three (29%) claim to watch Pay TV less now. A further one in six (16%) claim they cancelled their movie package altogether as a result of using OTT services and initial indications* are that most (two in three of those who cancelled) intentionally do so at the point of subscription, rather than deciding at a later stage.
*NOTE: Low base size, n= 52 removed movie package.
Figure 28: Impact of OTT on Pay TV viewing behaviour
Source: QE26a/b Base: All with triple play/Standalone Pay TV who use any OTT service n=329; all who removed movie package n=52*.
* Note: Low base size, treat as indicative only
OTT SERVICE USED
When & HowOften? LOVEFILM NETFLIX ITUNES
Monthly Subscription 60 58
On a free trial 38 38
Don’t know 2 4
LOVEFILM NETFLIX ITUNES
Every day 14 18 18
3-4 times per week 27 29 31
Once or twice a week 30 30 22
2-3 times per month 11 13 15
Once a month 6 4 4
Less often 13 7 9
OTT SERVICE USED
Where?LOVEFILM NETFLIX ITUNES
Main household TV 63 47 14
Laptop or Desktop 43 45 70
Tablet 15 19 25
Secondary household TVs 14 26 11
Smartphone 4 10 21
MP3 Player 1 2 6
54
29
16
No effect
Watch Pay TV less
Removed moviepackage
%
34
66
Decided later
Intended to do this
%

Customer Retention and Interoperability Research
Prepared for: Ofcom 39
3.4 Switchers and Considerers: Decision Making Process
3.4.1 Information gathering stage
When deciding whether or not to change their Mobile or Pay TV providers previously, active participants are most likely to have calculated the cost of the new service/the cost of changing and/or to have looked at individual communications provider websites. In each service area, around one in two Switchers and Considerers claim they undertook these activities.
Review or price comparison websites, along with personal networks of family and friends are information sources used by around one in three Switchers and Considerers at the time.
At least one in three Considerers also claim they read about available products on review or price comparison sites.
Retail outlets are a more popular port of call for those in the pay-monthly Mobile market, with around one in three users visiting their provider’s store at the time. Those who have switched or considered switching their Pay TV service are more likely to have called their communications provider to ask questions about products or services than to have visited them in-store (a minority, around one in ten, actually went to the store).
Figure 29: Activities undertaken when switched/considered switching Mobile / Pay TV provider previously
Source: QB9 Base: All Mobile Switchers/Considerers n=774/426; All standalone Pay TV Switchers/Considerers n=179/148; All Triple Play Switchers/Considerers n=315/98*
* Note: Low base size, treat as indicative only
When deciding whether or not to change their Dual Play or Triple Play providers previously, active participants are again most likely to have calculated the cost of the new service/the cost of changing and/or to have looked at individual communications provider websites. In each service area, at least one in two Switchers and Considerers claim they undertook these activities.
50
48
39
39
36
19
7
58
56
30
45
36
30
0
Provider websites
Cost calculations
Provider shops
Reviews/PCW
Talked to family/friends
Provider telephone
None of these
SwitcherConsiderer
%
Mobile Network
55
42
38
35
31
11
12
55
55
34
51
28
13
0
Cost calculations
Provider websites
Talked to family/friends
Reviews/PCW
Provider telephone
Provider shops
None of these
SwitcherConsiderer
%
Standalone Pay TV
51
47
34
32
27
9
8
67
51
36
37
39
3
0
Cost calculations
Provider websites
Talked to family/friends
Provider telephone
Reviews/PCW
Provider shops
None of these
SwitcherConsiderer
%
Triple Play

Customer Retention and Interoperability Research
Prepared for: Ofcom 40
Review or price comparison websites are information sources used by at least two in five Considerers at the time. Around one in four Triple Play users and around one in three Dual Play users referred to these websites at the time.
Relatively few Dual Play and Triple Play users claim to have gone into a retail store at this time. They are more likely to have called their communications provider to ask questions about products or services – around one in three Switchers and Considerers report this activity.
Around one in four make use of personal networks of family and friends.
Figure 30: Activities undertaken when switched/considered switching Dual Play / Triple Play provider previously
Source: QB9 Base: All Dual Play fixed line switchers/considerers n=349/91; All Dual Play BB switchers/considerers n= 336/94; All Triple Play fixed line switchers/considerers n=408/93; All Triple Play BB switchers/considerers n=393/89.
3.4.2 Active consideration stage
Around one in two Considerers claim to have looked for information about alternative providers when they were considering switching and around one in three familiarised themselves with the process they would need to go through to change communications provider.
At least two in five spoke to their current communications provider to tell them they were thinking about cancelling their service. However in this situation, relatively few Considerers (around one in ten) claim they actually started to switch by telling their communications provider they wanted to go ahead and cancel their service (and subsequently reversed their decision).
The results suggest that only a minority of Considerers talk to an alternative communications provider when they are considering switching (around one in ten claim this is what they did at the time).
60
51
42
30
25
5
9
63
59
51
37
28
5
0
Cost calculations
Provider websites
Reviews/PCW
Provider telephone
Talked to family/friends
Provider shops
None of these
SwitcherConsiderer
60
44
35
29
23
3
11
61
54
45
36
30
3
1
Cost calculations
Provider websites
Reviews/PCW
Provider telephone
Talked to family/friends
Provider shops
None of theseSwitcherConsiderer
%
Dual Play – Fixed Line Phone
%
Dual Play – Fixed Broadband
53
43
33
27
25
8
8
66
54
30
26
38
2
1
Cost calculations
Provider websites
Provider telephone
Talked to family/friends
Reviews/PCW
Provider shops
None of theseSwitcherConsiderer
%
Triple Play - Fixed Line Phone
52
47
33
30
29
9
7
67
53
35
31
45
7
0
Cost calculations
Provider websites
Provider telephone
Talked to family/friends
Reviews/PCW
Provider shops
None of theseSwitcherConsiderer
%
Triple Play – Fixed Broadband

Customer Retention and Interoperability Research
Prepared for: Ofcom 41
Figure 31: Information sources used when considered switching previously
Source: QC25 Base: All Considerers: pay-monthly Mobile/Dual Play/Triple Play/Standalone PayTV n=426/100/124/148
When asked what would have encouraged them to go ahead and switch service(s), the majority of Considerers claim they could have been persuaded by a better price/deal and/or a better service, as illustrated by the word cloud below.
Figure 32: Word cloud to indicate frequency of mentions in response to question: what would have encouraged you to switch service(s)? – OPEN QUESTION
Source: QC26 Base: All considerers: mobile/dual/triple/PayTV n=426/100/124/148
%
5
4
13
15
29
44
47
2
8
10
22
37
46
46
2
1
11
13
26
43
60
3
6
13
13
33
41
47
Cancelled during cool-off
Told new wanted to use them
Told current wanted to cancel
Contacted any other provider
Looked into the process
Contacted provider aboutpossibly cancelling
Looked for info about providers
Mobile PhoneDual PlayTriple PlayPay TV (only)

Customer Retention and Interoperability Research
Prepared for: Ofcom 42
3.4.3 Switching stage
The majority of Switchers6 in this study claim to have found it at least fairly easy to switch communications provider (between 80% and 90% depending on the service) while around one in ten found it either ‘fairly’ or ‘very’ difficult.
Figure 33: How easy or difficult it was to switch communications provider7
Source: QC23 Base: All switchers: mobile/dual play/triple play/Standalone Pay TV n=774/410/451/179.
Sub-group analysis has also been conducted in relation to the type of switching process that consumers went through, i.e.:
Cease and re-provide (C&R): When consumers are required to contact their old communications provider to tell them they wanted to cancel and also to contact the new communications provider to tell them they want to start using them for the service. No switching/MAC/PAC code is needed. The services stop and start independently.
Losing communications provider led (LPL): When consumers need to contact their old communications provider to get a switching/MAC/PAC code and give this to the new communications provider. The new communications provider then arranges the switch.
Gaining communications provider led (GPL): When consumers need to contact only their new communications provider to start the switch. The new communications provider then arranges the switch for the consumer. The consumer does not need a switching/MAC/PAC code, and does not need to contact their old communications provider.
Switchers in this research have been allocated to each process type based on a combination of factors which indicate the process the consumer is likely to have followed e.g. communications provider they switched to/from, which services they switched and, if necessary, whether they
6 Sample based on those switching mobile contract, one service in their dual or triple play bundle, Pay TV
standalone. Sample excludes standalone service purchasers and does not reflect ease of switching in each market as a whole.
7 Further details on ease of switching in each of the communications markets as a whole can be found in Ofcom’s Consumer Experience of 2012 Report
2
3
3
2
14
6
9
11
44
47
41
47
36
43
46
39
Pay TV (only)
Triple Play
Dual Play
Mobile Phone
Very difficult Fairly difficult Fairly easy Very easy
86
87
90
80

Customer Retention and Interoperability Research
Prepared for: Ofcom 43
requested a code or only contacted their new communications provider. Switchers were subsequently categorised into one of the four processes for analysis:
Cease and re-provide (C&R): those switching to/from Virgin or switching Pay TV or switching pay-monthly Mobile and contacted both providers
Losing provider led (LPL): those switching Fixed Line Phone or Fixed Broadband or pay-monthly Mobile (who have not already been allocated to the C&R process) and contacted previous provider for a “switching/MAC/PAC code”
Gaining provider led (GPL): those switching Fixed Line Phone or Fixed Broadband (who have not already been allocated to the C&R) and “only contacted their new provider”
Unallocated: those switching their Fixed Line Phone or Fixed Broadband or pay-monthly Mobile but did not fall into any of the above categories.
In reality consumers switching both their fixed voice and fixed broadband services may have followed both a GPL and LPL process however, for the purpose of analysis these respondents have been allocated to LPL as they were required to contact their losing provider in order to complete their switch.
Some of the following analysis excludes mobile switchers. It has been made clear in charts and text where mobile switching has been excluded.
It is worth noting at this stage that the profiles of the Fixed Line Phone and Fixed Broadband ‘LPL’ and ‘GPL’ categories show some differences in terms of the services that were switched.
Previous research8 suggests that switching fixed voice services is comparatively easier than switching fixed broadband services. In light of this, and the varying profile of users of each switching process in terms of services switched, further analysis has been run amongst the common groups in each process (i.e. those who switched both fixed line and fixed broadband services). This analysis was conducted in order to accurately compare switching ‘difficulties/issues’ by process, and increase confidence that any differences relate to the process as opposed to the services being switched.
Losing provider led (LPL LL/BB)*: 23% switched Fixed Broadband only, 6% switched Fixed Line Phone only9 and 71% switched both Fixed Line Phone and Fixed Broadband10
Gaining provider led (GPL): 10% switched Fixed Broadband only, 31% switched Fixed Line Phone only and 59% switched both Fixed Broadband and Fixed Line Phone
The ‘LPL’ and ‘GPL’ categories also show some differences in terms of demographic profile which may also reflect the different service combinations being switched; GPL Switchers are significantly older and less tech savvy than LPL Switchers:
Losing provider led (LPL LL/BB only)*: 80% agree they try to keep up with technology, 68% agree they are as confident as the next person, 47% agree that people come to them with technical questions.
8 See figure 120 in Ofcom’s Consumer Experience of 2012 Report 9 Responses from 5 respondents led them to be allocated to the LPL process. This is not a process applicable
to fixed line only switches. The small number of respondents affected means their responses will not have a significant impact on the data.
10 Those switching fixed voice and fixed broadband multiple services will have followed two separate processes - GPL NoT for their fixed voice and LPL MAC for their fixed broadband switch. For the purpose of analysis these consumers have been allocated to LPL process as during their switch they were required to contact their losing provider.

Customer Retention and Interoperability Research
Prepared for: Ofcom 44
Gaining provider led (GPL): 75% agree they try to keep up with technology, 60% agree they are as confident as the next person, 43% agree that people come to them with technical questions.
– *The C&R and LPL categories include some Mobile switchers at an overall level, however the Mobile and Fixed Line Phone/Broadband data has been split out within our detailed subgroup analysis (see Appendix 2).
Analysing Switchers on this basis suggests that those going through the GPL process are more likely to say they find changing communications provider easier than those going through any other type of process. Specifically, three in five GPL Switchers (60%) claim they found it ‘very’ easy to switch, significantly higher than either LPL Switchers (32%) or C&R Switchers (40%). Similarly, reported difficulty amongst GPL Switchers is significantly lower at 7%, compared to 17% for LPL Switchers and 10% for C&R Switchers.
Figure 34: How easy or difficult it was to switch communications provider
Source: QC23 Base: All Switchers/C&R/C&R excluding mobile/GPL/All LPL/LPL excluding mobile n=1814/724/497/196/483/94*
*Note: Low base size, treat as indicative only
3
3
3
2
2
3
15
14
4
11
8
9
40
51
32
46
48
46
42
32
60
40
40
41
LPL EXCLMOBILE
LPL TOTAL
GPL TOTAL
C&R EXCLMOBILE
C&R TOTAL
All Switchers
Very difficult Fairly difficult Fairly easy Very easy
% Easy
87
88
86
92
83
82

Customer Retention and Interoperability Research
Prepared for: Ofcom 45
4 Services: Difficulties Encountered in the Switching Journey
4.1 Introduction This section provides an overview of the factors that consumers say have stopped them from switching communications provider, and the hurdles they claim to have encountered during the switching journey. These ‘difficulties’ are considered across each of the pay-monthly Mobile, Dual Play, Triple Play and Standalone Pay TV markets.
A number of key definitions are relevant for this section of the report:
Service Areas
Pay-monthly Mobile: on a pay-monthly contract (post-pay) that is personally used and paid for
Dual Play: have fixed line phone AND fixed broadband internet access in a bundle or package from the SAME supplier
Triple Play: have fixed line phone AND fixed broadband internet access AND pay TV service in a bundle or package from the SAME supplier
Standalone Pay TV: have Pay TV but not bundled with other services (respondent may have other services but with different suppliers)
Market participation
Switchers: changed communications provider for one of the following four services in the last 2 years (the last 12 months and last 13-24 months are split out where base sizes allow)
Considerers: actively considered changing communications provider for one of the following four services in the last 12 months but decided against
– A current pay-monthly mobile phone service
– One or more services within a current Dual Play bundle (including fixed line phone and fixed broadband)
– One or more services within a current Triple Play bundle (including fixed line phone, fixed broadband and Pay TV)
– A current standalone Pay TV service (where this service has been purchased as a standalone service, not in a bundle with any other service(s)).
Active participants: the combined sample of all Switchers and Considerers based on the above definitions.
Inactive participants: those respondents who have neither switched (in the last 2 years) nor considered switching (in the last 12 months) any of these services (pay-monthly mobile phone/fixed line phone/fixed broadband/Pay TV).
The qualitative research indicates that the switching journey is commonly perceived to be a ‘hassle’, and that hassle can occur at different stages and for different reasons:
The research and information gathering process (for example, the time needed to actually undertake these activities, challenges comparing offerings etc.)

Customer Retention and Interoperability Research
Prepared for: Ofcom 46
The physical process of actually changing over suppliers (for example, the time needed to manage and oversee the process and lack of seamlessness during the transition)
Contract barriers that may exist.
The quantitative research validates these findings, as detailed in the following sections.
4.2 Difficulties that stop consumers from switching or considering switching
4.2.1 Inactive participants
Those who have not switched or considered switching any of the services included in this study in the specified timeframe (so called ‘inactive consumers’) are ‘inactive’ mainly because they say they are happy with their current arrangements. At least one in two inactive participants claim not to have thought about switching because they are satisfied with their current communications provider - and this is true regardless of which service they consume.
Inactive consumers in the Triple Play market are the most content with their current arrangements, around two in three giving this as their main reason for not being ‘active’ in the market.
For a minority of inactive consumers (around one in ten), lack of differentiation in the market (either in terms of cost or in terms of product) is the primary reason for not thinking about switching, there being little incentive to switch if the alternatives do not provide sufficient advantages.
Less than one in ten inactive consumers claim they have not thought about switching because of their existing contractual restrictions.
Other reasons were mentioned by fewer than 4% of inactive consumers and are not illustrated in the summary figure below. The most notable of these include ‘expect current supplier to offer deal to stay’, ‘switching process too time consuming’ and ‘losing channels’ among standalone Pay TV users. The full detail is covered in the following paragraphs, service by service.
Figure 35: Main reason for not considering switching
Source: QB10b Base: All NOT switched or considered switching particular service mobile/dual fixed/triple fixed/dual bb/triple bb/triple Pay TV/Standalone Pay TV n=3289/1036/1071/1029/1087/1145/180
5
4
6
59
2
5
5
66
5
5
7
58
2
4
8
63
7
5
7
58
2
6
4
51
1
4
5
66
Contractualrestrictions
Service similarity
Cost similarity
Satisfied withcurrent
Pay TV (have Triple)Pay TV (only)MobileFixed Line (have Triple)Fixed Line (have Dual)BB (have Triple)BB (have Dual)
%
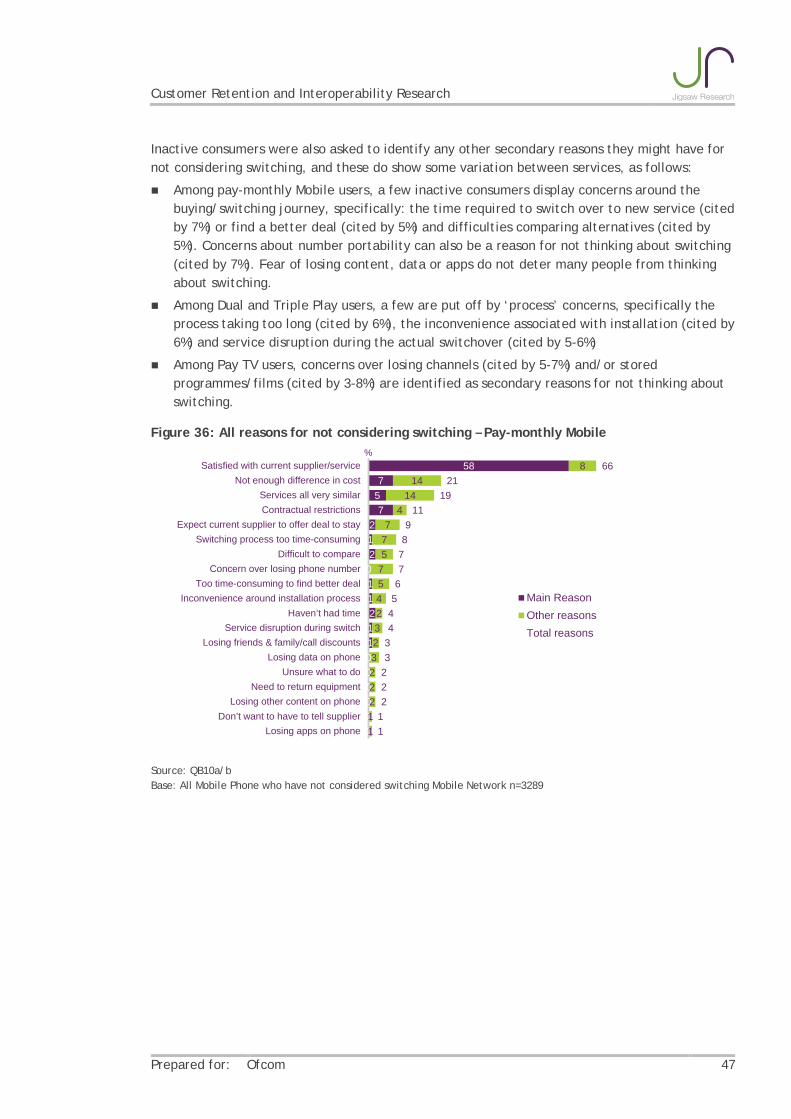
Customer Retention and Interoperability Research
Prepared for: Ofcom 47
Inactive consumers were also asked to identify any other secondary reasons they might have for not considering switching, and these do show some variation between services, as follows:
Among pay-monthly Mobile users, a few inactive consumers display concerns around the buying/switching journey, specifically: the time required to switch over to new service (cited by 7%) or find a better deal (cited by 5%) and difficulties comparing alternatives (cited by 5%). Concerns about number portability can also be a reason for not thinking about switching (cited by 7%). Fear of losing content, data or apps do not deter many people from thinking about switching.
Among Dual and Triple Play users, a few are put off by ‘process’ concerns, specifically the process taking too long (cited by 6%), the inconvenience associated with installation (cited by 6%) and service disruption during the actual switchover (cited by 5-6%)
Among Pay TV users, concerns over losing channels (cited by 5-7%) and/or stored programmes/films (cited by 3-8%) are identified as secondary reasons for not thinking about switching.
Figure 36: All reasons for not considering switching – Pay-monthly Mobile
Source: QB10a/b Base: All Mobile Phone who have not considered switching Mobile Network n=3289
587
57
212
011211000000
814
144
775
754232322211
6621
1911
98
77
65
44
33
222
11
Satisfied with current supplier/serviceNot enough difference in cost
Services all very similarContractual restrictions
Expect current supplier to offer deal to staySwitching process too time-consuming
Difficult to compareConcern over losing phone number
Too time-consuming to find better dealInconvenience around installation process
Haven’t had timeService disruption during switch
Losing friends & family/call discountsLosing data on phone
Unsure what to doNeed to return equipment
Losing other content on phoneDon’t want to have to tell supplier
Losing apps on phone
Main ReasonOther reasonsTotal reasons
%

Customer Retention and Interoperability Research
Prepared for: Ofcom 48
Figure 37: All reasons for not considering switching – Fixed Line Phone (Dual Play/Triple
Play)
Source: QB10a/b Base: All Dual Play/Triple Play who have not considered switching fixed line phone n=1036/1071
Figure 38: All reasons for not considering switching – Fixed Broadband (Dual Play/Triple Play
Source: QB10a/b Base: All Dual Play/Triple Play who have not considered switching fixed broadband n=1029/1087
638
42211212210010
710
132465356
23
2111
701817
4676568
44
2121
58755222112210100
89
94
564456
25
3111
6616
149
78
6568
46
3211
Satisfied with current supplier/service
Not enough difference in cost
Services all very similar
Contractual restrictions
Expect current supplier to offer deal to stay
Switching process too time-consuming
Difficult to compare
Concern over losing phone number
Too time-consuming to find better deal
Inconvenience around installation process
Haven’t had time
Service disruption during switch
Losing friends & family/call discounts
Unsure what to do
Need to return equipment
Don’t want to have to tell supplier
MainReason
Otherreasons
Totalreasons
%%
Dual Play Triple Play
66
5
5
2
1
2
2
2
1
1
2
1
0
0
0
6
6
8
1
5
6
3
3
4
6
1
5
1
2
0
72
11
13
3
6
8
5
5
5
7
3
6
1
2
0
59
6
4
5
1
1
1
3
1
2
2
2
1
0
0
7
7
7
4
5
6
4
4
4
5
1
6
1
2
1
66
13
11
9
6
7
5
7
5
7
3
8
2
2
1
Satisfied with current supplier/service
Not enough difference in cost
Services all very similar
Contractual restrictions
Expect current supplier to offer deal to stay
Switching process too time-consuming
Difficult to compare
Concern over losing email address
Too time-consuming to find better deal
Inconvenience around installation process
Haven’t had time
Service disruption during switch
Unsure what to do
Need to return equipment
Don’t want to have to tell supplier
MainReason
Otherreasons
Totalreasons
%%
Dual Play Triple Play

Customer Retention and Interoperability Research
Prepared for: Ofcom 49
Figure 39: All reasons for not considering switching – Pay TV (Triple Play/Standalone Pay TV)
Source: QB10a/b Base: All Triple Play/Standalone Pay TV who have not considered switching Pay TV service n=1145/180
4.2.2 Considerers
Pay-monthly Mobile Considerers
The quantitative research indicates that being ‘persuaded to stay’ is one of the most commonly cited major factors in Considerers’ decisions to remain with their current pay-monthly Mobile provider (rather than switch to a new one). This was identified as the main/a major issue for more than one in two Considerers (57%) in this market. Related to this, more than one in three (37%) claim it was worth waiting in case their current pay-monthly Mobile provider offered them a better deal in future.
Insufficient price differences were identified as a major issue by a similar proportion of Considerers (55%), and the overall costs involved were cited as a major issue by 44%.
Concerns over number portability, concerns that signal/service/ speed won’t be as good, and lack of service differentiation are also major issues identified by over two in five Considerers. Being under contract is a main/major issue for a similar proportion (38%).
Other factors are more likely to be regarded as ‘minor’ than ‘major’ issues.
51642431011421130120
610
10676
53281331
5434
2
5716
14811
96
33
9554
28
446
2
6645
1121111111111000
586
6533333222222110
711211
7654444333333
110
Satisfied with current supplier/serviceServices all very similar
Not enough difference in costInconvenience around installation process
Losing other channelsExpect current supplier to offer deal to stay
Difficult to compareToo time-consuming to find better dealSwitching process too time-consuming
Losing stored programmes/filmsHaven’t had time
Contractual restrictionsNeed to return equipment
Service disruption during switchLosing sports channels
Learning to use a new systemUnsure what to do
Losing movie channelsDon’t want to have to tell supplier
MainReason
Otherreasons
Totalreasons
% %Triple Play Standalone Pay TV

Customer Retention and Interoperability Research
Prepared for: Ofcom 50
Figure 40: Issues affecting decisions during switching consideration, ranked in order of main plus major – Pay-monthly Mobile Considerers
Source: QE1/2 Base: All Mobile considerers in last 12 months n=440
Dual Play Considerers
Considerers in the Dual Play market identify a similarly wide range of major issues that put them off switching.
Insufficient difference in price, and being persuaded to stay by the current communications provider, are the most common stated reasons for not switching, each being identified as the main issue by one in five Considerers (21%) in this market.
Fifteen other ‘major’ barriers are identified by at least one in three users. The most commonly cited of these include concerns over changing telephone number/email address, concerns that the service won’t be as good, lack of perceived difference between offerings, worries about losing service during the transition and the overall cost of switching. Contracts are also more likely to be identified as a ‘major’ rather than a ‘minor’ issue, and affect slightly more than one in three Considerers.
During the qualitative research, a number of consumers stated that they would appreciate the option to buy their email address and take it with them when switching providers, as illustrated by the following quote:
“I would have loved to have been able to keep hold of <<provider>> email address, rather than having to email all my contacts with a new email address.”
%23%
18%8%5%3%3%3%
9%5%
2%1%2%2%4%
0%1%2%0%1%2%0%1%1%1%0%0%
34%37%
40%42%
41%41%
34%29%
28%28%28%24%22%19%
22%19%18%
17%16%14%
14%13%12%
10%10%
0%
21%31%
27%34%
34%36%
37%24%
43%31%37%
37%41%
37%41%
38%40%
35%31%
38%29%
24%35%
28%28%
30%
Provider trying to persuade me to stayInsufficient difference in priceChanging telephone number
Worry signal/speed won't be as goodCosts involved
Little real difference between offeringsWorth waiting in case current provider offers better…
Being under contractWorry service won't be as good
Didn't have handet wantedPaying for both services
Losing cost benefitsComparing offerings
Too time consuming to switchBeing without service during switch
Worry something will go wrongLack of info about switching
Worry moving contentOther devices not working with new service
Finding time to research marketLosing 'personalised' services
Losing ‘add-on’ servicesClarity of switching process
Learning how to use new serviceLosing ‘extra’ services
Losing data/access services
Main issueMajor issueMinor Issue
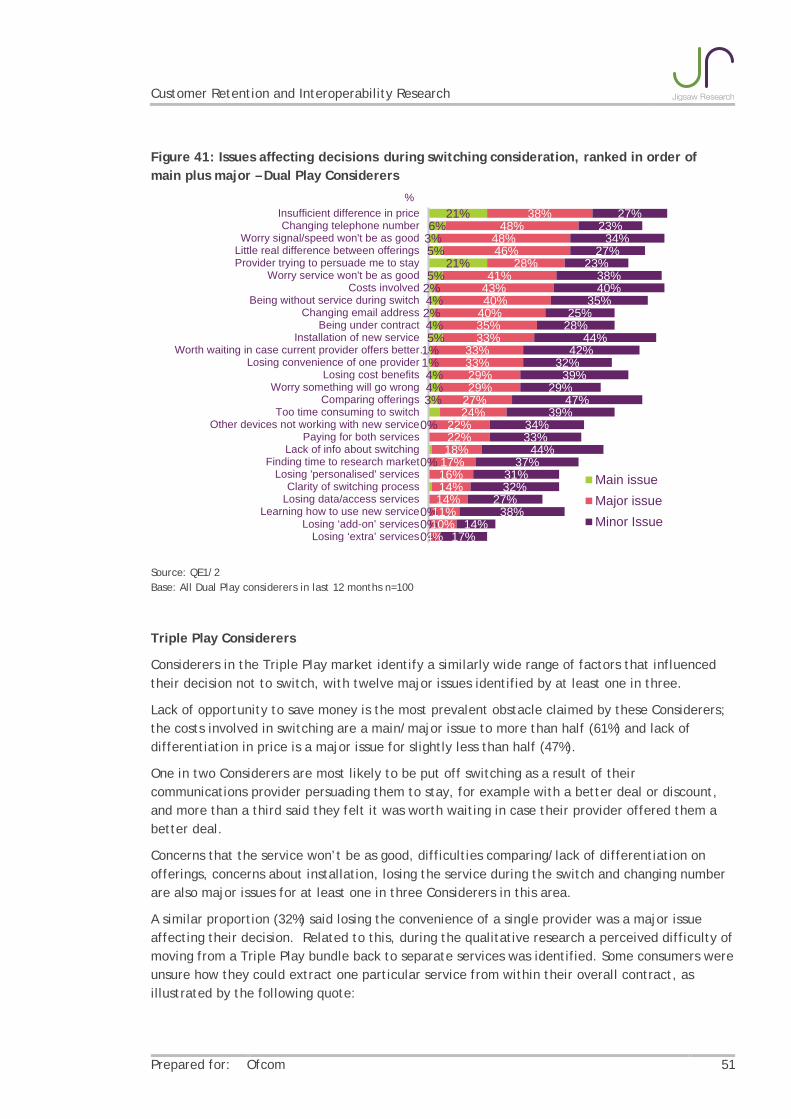
Customer Retention and Interoperability Research
Prepared for: Ofcom 51
Figure 41: Issues affecting decisions during switching consideration, ranked in order of main plus major – Dual Play Considerers
Source: QE1/2 Base: All Dual Play considerers in last 12 months n=100
Triple Play Considerers
Considerers in the Triple Play market identify a similarly wide range of factors that influenced their decision not to switch, with twelve major issues identified by at least one in three.
Lack of opportunity to save money is the most prevalent obstacle claimed by these Considerers; the costs involved in switching are a main/major issue to more than half (61%) and lack of differentiation in price is a major issue for slightly less than half (47%).
One in two Considerers are most likely to be put off switching as a result of their communications provider persuading them to stay, for example with a better deal or discount, and more than a third said they felt it was worth waiting in case their provider offered them a better deal.
Concerns that the service won’t be as good, difficulties comparing/lack of differentiation on offerings, concerns about installation, losing the service during the switch and changing number are also major issues for at least one in three Considerers in this area.
A similar proportion (32%) said losing the convenience of a single provider was a major issue affecting their decision. Related to this, during the qualitative research a perceived difficulty of moving from a Triple Play bundle back to separate services was identified. Some consumers were unsure how they could extract one particular service from within their overall contract, as illustrated by the following quote:
%21%
6%3%5%
21%5%
2%4%2%4%5%
1%1%4%4%3%
0%
0%
0%0%0%
38%48%
48%46%
28%41%
43%40%
40%35%33%
33%33%29%29%
27%24%
22%22%18%
17%16%14%14%
11%10%
4%
27%23%
34%27%
23%38%40%
35%25%
28%44%
42%32%
39%29%
47%39%
34%33%
44%37%
31%32%
27%38%
14%17%
Insufficient difference in priceChanging telephone number
Worry signal/speed won't be as goodLittle real difference between offeringsProvider trying to persuade me to stay
Worry service won't be as goodCosts involved
Being without service during switchChanging email address
Being under contractInstallation of new service
Worth waiting in case current provider offers better…Losing convenience of one provider
Losing cost benefitsWorry something will go wrong
Comparing offeringsToo time consuming to switch
Other devices not working with new servicePaying for both services
Lack of info about switchingFinding time to research market
Losing 'personalised' servicesClarity of switching process
Losing data/access servicesLearning how to use new service
Losing ‘add-on’ servicesLosing ‘extra’ services
Main issueMajor issueMinor Issue

Customer Retention and Interoperability Research
Prepared for: Ofcom 52
“I’m not even sure how you would cancel your broadband contract but keep your TV contract with the same communications provider. My broadband with <<provider>> is slow but because I’ve got the bundle, I just have to put up with it.”
Figure 42: Issues affecting decisions during switching consideration, ranked in order of main plus major – Triple Play Considerers
Source: QE1/2 Base: All Triple Play considerers in last 12 months n=130
Standalone Pay TV Considerers
Similar to Triple Play Considerers, costs are the most prevalent obstacle for those with standalone Pay TV, with around two in three Considerers (63%) identifying this as the main/a major issue in their decision not to switch standalone Pay TV provider. Insufficient difference in price was also mentioned as a major issue by 42%.
Provider intervention is another prominent factor likely to persuade Considerers in this market to stay with their existing communications provider identified by around one in two Considerers (54%) as the main/a major factor in their decision. Related to this, more than two in five considerers said ‘worth waiting for their provider to offer better deal’ was a major factor in their decision to remain with their existing provider.
Being under contract and concerns that the signal might not be as good were mentioned as the main/major barrier preventing two in five Pay TV Considerers (41%) from switching.
Most other obstacles, with the exception of losing add-on services and paying for two services at the same time, are more likely to be regarded as ‘minor’ than ‘major’ issues.
%9%12%12%
5%2%5%2%3%4%5%
0%3%4%2%5%4%4%2%0%4%2%4%
1%2%0%0%0%1%
52%38%
35%42%
38%33%
35%34%32%
28%32%29%26%27%24%23%21%22%
24%18%20%16%
18%18%18%
15%13%
5%
31%25%
45%33%
38%40%
36%29%
38%43%41%39%
37%32%
20%32%
33%31%33%
43%38%
31%32%
28%32%
35%23%
18%
Costs involvedProvider trying to persuade me to stay
Insufficient difference in priceWorry signal/speed won't be as good
Little real difference between offeringsComparing offerings
Installation of new serviceChanging telephone number
Worth waiting in case current provider offers better…Worry service won't be as good
Losing convenience of one providerBeing without service during switch
Too time consuming to switchPaying for both servicesChanging email address
Being under contractFinding time to research market
Losing ‘add-on’ servicesLosing cost benefits
Worry something will go wrongLack of info about switchingClarity of switching process
Transferring content from set-top boxOther devices not working with new service
Losing data/access servicesLosing 'personalised' services
Learning how to use new serviceLosing ‘extra’ services
Main issueMajor issueMinor Issue

Customer Retention and Interoperability Research
Prepared for: Ofcom 53
Figure 43: Issues affecting decisions during switching consideration, ranked in order of main plus major – Standalone Pay TV Considerers
Source: QE1/2 Base: All Pay TV (only) considerers in last 12 months n=150
4.3 Difficulties experienced during switching The quantitative results indicate that Switchers have experienced a wide range of difficulties during the switching journey, some of which they describe as ‘major’ rather than ‘minor’ issues.
Pay-monthly Mobile Switchers
Switchers in the pay-monthly Mobile market are generally more likely to recall ‘minor’ rather than ‘major’ issues during the switching journey. Nonetheless, at least one in ten claim to have encountered major difficulties in one or more area.
In particular, several aspects of the transition between services appear in the most commonly cited issues experienced by Switchers. Around one in five Switchers (21%) claim to have experienced difficulties paying for both services at the same time, and similar proportions report issues arranging for services to stop and start at the same time (18%) or with loss of service during the transition (17%). Related to this, a minority (15%) claim they had major issues with their communications provider making it difficult for them to switch, and a further 22% report this was a minor issue. Provider persuasion to stay was also mentioned as a major issue by 17%.
Issues with costs and contractual restrictions are equally common, reported by one in five Switchers in both cases. Number portability (changing phone number) and comparing offerings were also each mentioned by just under one in five as main/major issue.
%7%
21%3%6%11%7%5%5%5%5%
2%2%3%
1%1%2%1%1%0%2%4%
0%1%
57%33%
41%38%31%
34%33%32%31%30%
31%29%27%
27%25%22%
21%19%20%17%
10%12%9%
23%23%
34%29%
40%23%
44%39%39%
29%31%35%39%
39%35%
33%38%43%42%
34%41%
31%28%
Costs involvedProvider trying to persuade me to stay
Worth waiting in case current provider offers better…Worry signal/speed won't be as good
Insufficient difference in priceBeing under contract
Little real difference between offeringsComparing offerings
Worry service won't be as goodLosing ‘add-on’ servicesPaying for both services
Being without service during switchInstallation of new service
Transferring content from set-top boxOther devices not working with new service
Too time consuming to switchWorry something will go wrong
Lack of info about switchingLosing 'personalised' services
Clarity of switching processFinding time to research market
Learning how to use new serviceLosing ‘extra’ services
Main issueMajor issueMinor Issue

Customer Retention and Interoperability Research
Prepared for: Ofcom 54
Four of the top ten main/major issues are common across both Switchers (as issues they have actually experienced) and Considerers (as factors that impacted their decision to stay with their communications provider) in the pay-monthly Mobile market;
Costs involved
Being under contract
Provider trying to persuade me to stay
Changing telephone number.
Major issues with interoperability (new devices not working with old devices) are relatively uncommon (reported by 9%). As are major issues with moving content, losing personalised settings, data/access services, ‘add-on’ services and ‘extra’ services, which are each reported by around one in ten Switchers.
While fewer Switchers report major issues on these factors, minor issues are relatively widespread – affecting around two in five Switchers - in relation to research and information gathering (difficulties comparing offerings and/or finding time to research the market), clarity of the process and learning how to use a new service.
Figure 44: Issues experienced during the switching journey, ranked in order of main plus major – Pay-monthly Mobile Switchers
Source: QE1/2 Base: All Mobile switchers in last 12 months n=477
Dual Play Switchers
Switchers in the Dual Play market are also more likely to report ‘minor’ rather than ‘major’ issues during the switching journey – and fewer issues are reported by at least one in ten Switchers compared to the other markets assessed.
Loss of service during the transition is most likely to present difficulties, described as the main/major problem by one in five Switchers (21%) in this market. Related matters of arranging services to start and stop at the right time, and paying for two services at the same time are the
5%5%6%
3%6%7%
4%7%
5%4%3%5%
1%2%3%2%1%0%0%1%1%
16%16%
13%15%11%10%
13%10%
10%10%10%9%
12%10%9%
9%10%10%9%8%
5%
28%27%
15%38%
31%30%
28%42%
22%41%
38%47%
32%36%37%
34%25%
19%20%
14%16%
Paying for both servicesCosts involved
Being under contractArranging services to start/stop at right time
Provider trying to persuade me to stayChanging telephone number
Being without service during switchComparing offerings
Provider making it difficult to switchFinding time to research market
Clarity of switching processLearning how to use new service
Lack of info about moving contentProblems moving content e.g. contacts, photos
Losing ‘personalised’ settingsContacting more than one provider
Losing cost benefitsLosing data/access services
Other devices not working with new serviceLosing ‘add-on’ services
Losing 'extra' services
Main issueMajor issueMinor Issue
%

Customer Retention and Interoperability Research
Prepared for: Ofcom 55
main/major problems for some (17% and 13% respectively). Other commonly mentioned main/major issues relate to the clarity of the switching process (14%) and the installation of the new service (13%).
A minority (10%) claim they had a main/major issue with their communications provider making it difficult for them to switch, and a further 15% report this was a minor issue. A similar proportion said they experienced issues with their provider persuading them to stay (12%).
As in the pay-monthly Mobile market, four of the top ten main/major issues are common across both Switchers (as issues they have actually experienced) and Considerers (as factors that impacted their decision to stay with their communications provider) in the Dual Play market:
Being without service during switch
Provider trying to persuade me to stay
Being under contract
Costs involved.
Major issues with interoperability (old devices not working with new service) are relatively uncommon (reported by 5%). As are major issues with losing data/access services, ‘add-on’ services and ‘extra’ services, which are each reported by fewer than one in ten Switchers.
While fewer Switchers report major issues on these factors, minor issues are relatively widespread in relation to research and information gathering (with almost one in two reporting difficulties with comparing offerings and one in three finding it difficult to make time to research the market). Around one in three also have minor issues with the costs involved.
Figure 45: Issues experienced during the switching journey, ranked in order of main plus major – Dual Play Switchers
Source: QE1/2 Base: All Dual Play switchers in last 12 months n=248
%
9%3%4%5%6%
4%5%
1%3%2%2%2%2%2%2%0%1%2%0%0%
12%14%
10%8%6%
9%7%
9%6%
6%4%4%4%5%4%
5%4%3%
3%0%
20%29%
30%33%
33%27%
44%15%
13%35%37%
19%18%
15%14%19%
23%25%
10%12%
Being without service during switchArranging services to start/stop at right time
Clarity of switching processInstallation of new service
Provider trying to persuade me to stayPaying for both services
Comparing offeringsProvider making it difficult to switch
Being under contractCosts involved
Finding time to research marketLosing cost benefits
Changing email addressLosing data/access servicesChanging telephone number
Other devices not working with new serviceContacting more than one provider
Learning how to use new serviceLosing ‘add-on’ services
Losing 'extra' services
Main issueMajor issueMinor Issue

Customer Retention and Interoperability Research
Prepared for: Ofcom 56
Triple Play Switchers
Difficulties transitioning between services also appear in the top ten major issues in the Triple Play market, with main/major issues reported by around one in five Switchers on the following factors; experiencing a loss of service in between (22%), getting services to start/stop at the right time (18%), and/or having to pay for two overlapping services (17%). Costs were also cited as a major issue by one in five switchers, comparatively higher than for Dual Play switchers.
A minority (15%) claim they had major issues with their communications provider making it difficult for them to switch, with similar proportions (16%) stating major issues with their provider persuading them to stay.
Three of the top ten main/major issues are common across both Switchers (as issues they have actually experienced) and Considerers (as factors that impacted their decision to stay with their communications provider):
Costs involved
Provider trying to persuade me to stay
Installation of new service.
Interoperability appears to create more difficulties in this market compared to Dual Play, with more than one in ten Switchers (12%) claiming to have experienced main/major issues with new devices not working with old devices. Major issues with losing personalised settings, ‘add-on’ services, data/access services, ‘extra’ services and transferring content, each reported by around one in ten Switchers.
Minor issues were noted by more than one in three Switchers in relation to research and information gathering (difficulties comparing offerings and/or finding time to research the market), clarity of the process and learning how to use a new service.
Figure 46: Issues experienced during the switching journey, ranked in order of main plus major – Triple Play Switchers
Source: QE1/2 Base: All Triple Play switchers in last 12 months n=285
%7%
4%1%
5%4%4%3%2%2%1%1%3%3%3%1%2%1%3%3%
0%1%2%1%1%
15%15%
17%12%12%12%
12%13%
12%11%10%9%7%7%9%8%8%7%7%
9%8%6%8%
6%
30%32%36%
27%35%
18%31%
19%33%
14%18%
36%35%
43%20%
15%37%
25%25%
18%16%
25%16%23%
Being without service during switchCosts involved
Arranging services to start/stop at right timePaying for both services
Provider trying to persuade me to stayBeing under contract
Installation of new serviceProvider making it difficult to switchContacting more than one provider
Other devices not working with new serviceLosing cost benefits
Learning how to use new serviceFinding time to research market
Comparing offeringsChanging email address
Returning provider’s equipmentClarity of switching process
Changing telephone numberLosing ‘personalised’ settings
Losing ‘add-on’ servicesLosing data/access services
Transferring content from set-top boxLosing 'extra' services
Lack of info about moving content
Main issueMajor issueMinor Issue

Customer Retention and Interoperability Research
Prepared for: Ofcom 57
Standalone Pay TV Switchers
Switchers in the standalone Pay TV market report a slightly different set of issues to those in other markets. More issues are reported by at least one in ten of these Switchers compared to the other markets assessed.
Costs were cited as a major issue for one in four switchers with a further one in three saying costs were a minor issue.
At least one in five cited major issues with each of the following transition factors; provider making it difficult to leave, being without the service during the switch, and paying for both services.
A range of other main/major issues are cited by similar proportions of Switchers, including:
Clarity of process (22%)
Arranging for services to start/stop at the same time (19%)
Installation of new service (19%).
For around one in ten, being under contract and/or difficulties comparing offers were the main/a major issue faced – each cited by comparatively more than other issues as the main factor.
Four of the top ten main/major issues are common across both Switchers (as issues they have actually experienced) and Considerers (as factors that impacted their decision to stay with their communications provider):
Costs involved
Provider making it difficult to switch
Provider trying to persuade me to stay
Being under contract.
Interoperability issues are more prevalent in the Standalone Pay TV market than any other service area; around one in six (17%) say they experience ‘major’ issues and a further one in four (25%) say they experience ‘minor’ issues with new devices not working with old devices. Major issues with losing personalised settings, ‘add-on’ services, ‘extra’ services and transferring content, are less common, each reported by closer to one in ten Switchers.
While fewer Switchers report major than minor issues on these factors, minor issues are relatively widespread - affecting two in five Switchers - in relation to learning how to use a new service and provider persuasions to stay.

Customer Retention and Interoperability Research
Prepared for: Ofcom 58
Figure 47: Issues experienced during the switching process, ranked in order of main plus major – Standalone Pay TV Switchers
Source: QE1/2 Base: All Pay TV (only) switchers in last 12 months n=107
4.3.1 Differences by type of switching process
The following definitions are relevant for this section (full details can be found in section 3.4.3):
Cease and re-provide (C&R): those switching to/from Virgin or switching Pay TV or switching pay-monthly Mobile and contacted both providers
Losing provider led (LPL): those switching Fixed Line Phone or Fixed Broadband or pay-monthly Mobile (who have not already been allocated to the C&R process) and contacted previous provider for a “switching/MAC/PAC code”
Gaining provider led (GPL): those switching Fixed Line Phone or Fixed Broadband (who have not already been allocated to the C&R) and “only contacted their new provider”
Unallocated: those switching their Fixed Line Phone or Fixed Broadband or pay-monthly Mobile but did not fall into any of the above categories.
Across all services, at least one in three Switchers experienced issues, either ‘minor’ or ‘major’ during switching. An analysis of this experience by the type of process that Switchers went through reveals some differences.
Earlier, it was noted that those going through the GPL process claim they find it easier to change communications provider than those going through other switching processes. This next analysis shows the specific drivers behind differing experiences by switching process.
%6%
4%12%
7%11%
2%3%
1%3%5%
2%3%5%
0%3%3%
0%1%0%0%
20%22%
14%17%13%
21%19%
18%16%13%
15%14%11%
16%11%11%
14%10%
10%10%
34%20%22%
39%37%
19%35%
35%31%
30%25%
23%41%
32%45%
27%26%
30%23%
18%
Costs involvedProvider making it difficult to switch
Being under contractBeing without service during switch
Comparing offeringsPaying for both services
Clarity of switching processArranging services to start/stop at right time
Installation of new serviceFinding time to research market
Other devices not working with new serviceContacting more than one provider
Provider trying to persuade me to stayLack of info about moving contentLearning how to use new service
Losing ‘personalised’ settingsLosing ‘add-on’ services
Transferring content from set-top boxReturning provider’s equipment
Losing 'extra' services
Main issueMajor issueMinor Issue
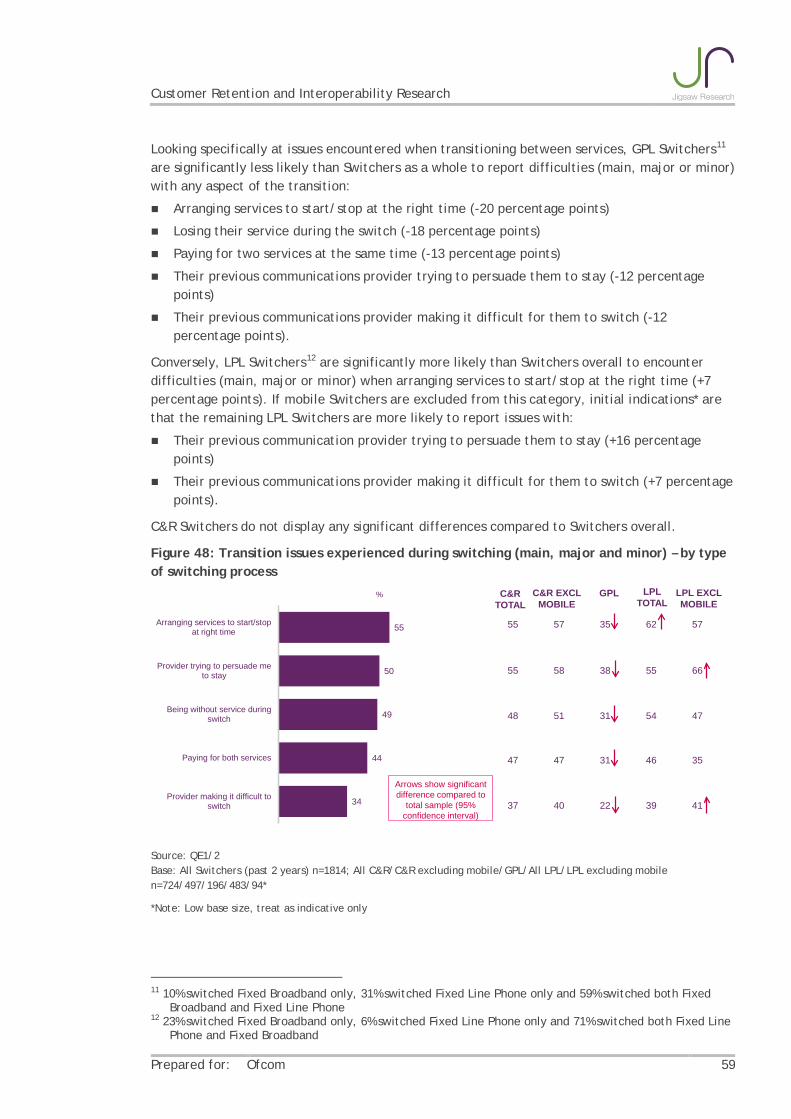
Customer Retention and Interoperability Research
Prepared for: Ofcom 59
Looking specifically at issues encountered when transitioning between services, GPL Switchers11 are significantly less likely than Switchers as a whole to report difficulties (main, major or minor) with any aspect of the transition:
Arranging services to start/stop at the right time (-20 percentage points)
Losing their service during the switch (-18 percentage points)
Paying for two services at the same time (-13 percentage points)
Their previous communications provider trying to persuade them to stay (-12 percentage points)
Their previous communications provider making it difficult for them to switch (-12 percentage points).
Conversely, LPL Switchers12 are significantly more likely than Switchers overall to encounter difficulties (main, major or minor) when arranging services to start/stop at the right time (+7 percentage points). If mobile Switchers are excluded from this category, initial indications* are that the remaining LPL Switchers are more likely to report issues with:
Their previous communication provider trying to persuade them to stay (+16 percentage points)
Their previous communications provider making it difficult for them to switch (+7 percentage points).
C&R Switchers do not display any significant differences compared to Switchers overall.
Figure 48: Transition issues experienced during switching (main, major and minor) – by type of switching process
Source: QE1/2 Base: All Switchers (past 2 years) n=1814; All C&R/C&R excluding mobile/GPL/All LPL/LPL excluding mobile n=724/497/196/483/94*
*Note: Low base size, treat as indicative only
11 10% switched Fixed Broadband only, 31% switched Fixed Line Phone only and 59% switched both Fixed
Broadband and Fixed Line Phone 12 23% switched Fixed Broadband only, 6% switched Fixed Line Phone only and 71% switched both Fixed Line
Phone and Fixed Broadband
55 57 35 62 57
55 58 38 55 66
48 51 31 54 47
47 47 31 46 35
37 40 22 39 41
55
50
49
44
34
Arranging services to start/stopat right time
Provider trying to persuade meto stay
Being without service duringswitch
Paying for both services
Provider making it difficult toswitch
% C&RTOTAL
C&R EXCL MOBILE
LPL TOTAL
LPL EXCL MOBILE
GPL
Arrows show significant difference compared to
total sample (95% confidence interval)

Customer Retention and Interoperability Research
Prepared for: Ofcom 60
In order to better understand the impact of the process, analysis was run on a subset of respondents switching both their fixed line and fixed broadband services within each of the processes set out above13. This provides a more comparable view of the issues being experienced by process.
Broadly the results of this additional analysis indicate a slight uplift in stated experience of issues amongst GPL users, significant uplift in stated experience of some issues amongst C&R users and little change amongst LPL users, when comparing against LPL users excluding mobile.
However, the overall story remains that GPL users are significantly less likely than users of other processes to cite issues with arranging for services to start and stop at the right time, or with providers persuading them to stay or making it difficult to switch. GPL users are also significantly less likely than LPL users to state issues with being without the service during the switch and significantly less likely than C&R users to say they had to pay for both services.
Figure 49: Transition issues experienced during switching (main, major and minor) – by type of switching process - switching both their fixed landline and their fixed broadband
Source: QE1/2 Base: All Switchers (past 2 years) n=1814; All C&R/GPL/LPL switching both their fixed landline and their fixed broadband n=50/116/68*
*Note: Low base size, treat as indicative only
Looking at the broader range of barriers, LPL and C&R Switchers appear to encounter the greatest number of problems overall, with a higher number of issues identified as a problem by at least one in two such Switchers compared to switchers using the GPL process.
Some of the differences identified below are likely to relate to the service being switched or the number of services being switched as opposed to being directly linked to the process. For example, ‘learning how to use a new service’ was lower amongst GPL which is likely a reflection of the lower proportion of this group switching their fixed broadband (a service requiring a
13 Analysis was only run on those switching both services by process as robust samples were not available for
other service combinations. Some consumers may not have switched both services at the same time.
66 37 54
63 40 69
36 36 48
47 31 36
41 24 42
55
50
49
44
34
Arranging services to start/stopat right time
Provider trying to persuade meto stay
Being without service duringswitch
Paying for both services
Provider making it difficult toswitch
C&R F/FBB switching both
LPL F/FBB switching both
GPL F/FBB switching both
Arrows show significant difference compared to
total sample (95% confidence interval)

Customer Retention and Interoperability Research
Prepared for: Ofcom 61
degree of learning to set up and install) compared to LPL users - 94% of LPL total switched their fixed broadband compared to 69% amongst GPL users.
All pay TV switching was allocated to C&R which might account for the higher proportion citing ‘learning how to use a new service’ as an issue (58% compared to 30% for GPL and 39% LPL excl mobile). Arguably this service requires a greater amount of ‘learning’ not just during set up and installation but also the ongoing use of the service.
The differing scores for ‘finding time to research the market’ may reflect the number of services being switched – 41% of GPL users only switched a single service which compares to 29% amongst LPL process users.
As noted above, transitional issues (which have been compared across processes amongst those switching common service combinations) and other issues such as; clarity of the switching process, and needing to contact more than one provider, differs between processes. The latter aspects report significantly lower levels of difficulty amongst GPL switchers than either of the other processes.
Figure 50: Issues experienced during the switching process (main, major and minor) – by type of switching process
Source: QE1/2 Base: All Switchers (past 2 years) n=1814; All C&R/C&R excluding mobile/GPL/All LPL/LPL excluding mobile n=724/497/196/483/94*
Boxes shaded in pink represent scores of 50% or higher, boxes shaded in purple represent scores of 40-49%, boxes shaded in green represent scores of 30-39% and boxes shaded in grey represent scores lower than 30%. These do not represent significant differences.
*Note: Low base size, treat as indicative only
TOTAL(1814)
C&R TOTAL
(724)
C&R EXCL MOBILE
(497)GPL(196)
LPL TOTAL (483)
LPL EXCL MOBILE
(94)Comparing offerings 59% 58% 61% 51% 61% 60%
Arranging for services to stop/start at right time 55% 55% 57% 35% 62% 57%Finding time to research the market 51% 50% 52% 38% 52% 46%Learning how to use a new service 50% 58% 58% 30% 51% 39%
Provider trying to persuade me to stay 50% 55% 58% 38% 55% 66%Clarity of switching process 50% 50% 53% 34% 55% 55%
Costs involved 50% 53% 54% 45% 46% 49%Being without the service during switch 49% 48% 51% 31% 54% 47%
Issues regarding installation of the new service 47% 50% 51% 31% 48% 41%Problems moving content 47% 45% 53% 46% 49% 51%
Paying for both services at the same time 44% 47% 47% 31% 46% 35%Needing to contact more than one provider 44% 43% 44% 22% 54% 58%
Losing ‘personalised’ settings 44% 42% 40% 29% 45% 39%Lack of information about moving content 41% 40% 40% 28% 44% 35%
Having to change telephone number 38% 46% 38% 22% 29% 20%Having to return provider's equipment 36% 39% 39% 14% 40% 25%
Previous provider made it difficult for me 34% 37% 40% 22% 39% 41%Being under contract with previous supplier/ 34% 37% 39% 21% 33% 26%
Losing cost benefits 32% 37% 37% 22% 32% 24%Having to change email address 30% 30% 29% 22% 42% 46%
Other devices/products I own not working with new 29% 32% 35% 17% 29% 26%Transferring programmes stored on my old set-top 29% 32% 32% 18% 30% 9%
Losing data/access services 27% 31% 34% 13% 29% 27%Losing other ‘add-on’ services 24% 29% 31% 11% 23% 22%
Losing ‘extra’ services 22% 24% 25% 9% 23% 11%

Customer Retention and Interoperability Research
Prepared for: Ofcom 62
The same patterns hold true across both the main/major issues and the minor issues reported by these Switchers.
Figure 51: Issues experienced during the switching process (main and major) – by type of switching process
Source: QE1/2 Base: All Switchers (past 2 years) n=1814; All C&R/C&R excluding mobile/GPL/All LPL/LPL excluding mobile n=724/497/196/483/94*
Boxes shaded in pink represent scores of 50% or higher, boxes shaded in purple represent scores of 40-49%, boxes shaded in green represent scores of 30-39% and boxes shaded in grey represent scores lower than 30%. These do not represent significant differences.
*Note: Low base size, treat as indicative only
4.4 Understanding switching barriers and hurdles in detail A deep dive into the issues experienced by Switchers and Considerers reveals important additional details.
4.4.1 Comparing offerings
Those admitting that they had difficulties comparing communications provider offerings (either major or minor issues) were asked a more detailed set of questions to establish where these problems occurred.
TOTAL(1814)
C&R TOTAL
(724)
C&R EXCL MOBILE
(497)GPL(196)
LPL TOTAL (483)
LPL EXCL MOBILE
(94)Being without the service during switch 20% 19% 21% 9% 20% 19%
Costs involved 19% 23% 23% 15% 17% 9%Arranging for services to stop/start at right time 18% 17% 19% 13% 21% 19%
Paying for both services at the same time 18% 20% 19% 11% 20% 14%Being under contract with previous supplier 17% 19% 20% 10% 15% 10%
Comparing offerings 15% 14% 17% 10% 16% 13%Previous provider made it difficult for me 15% 17% 18% 6% 17% 18%
Provider trying to persuade me to stay 14% 17% 17% 9% 14% 20%Clarity of switching process 14% 14% 16% 8% 16% 16%
Issues regarding installation of the new service 14% 15% 15% 9% 16% 10%Having to change telephone number 13% 16% 15% 8% 14% 10%Finding time to research the market 12% 12% 13% 6% 11% 7%
Needing to contact more than one provider 12% 13% 14% 5% 15% 15%Losing ‘personalised’ settings 12% 11% 12% 6% 10% 3%
Lack of information about moving content 12% 11% 11% 8% 10% 6%Problems moving content 12% 12% 20% 11% 11% 0%
Losing cost benefits 11% 15% 16% 4% 8% 7%Learning how to use a new service 10% 13% 14% 5% 11% 8%
Other devices/products I own not working with new 10% 13% 15% 4% 8% 9%Having to change email address 10% 11% 11% 4% 11% 12%
Transferring programmes stored on my old set-top 10% 10% 10% 6% 15% 0%Losing data/access services 9% 10% 12% 3% 8% 6%
Having to return provider's equipment 9% 9% 8% 2% 8% 5%Losing other ‘add-on’ services 8% 10% 11% 3% 10% 8%
Losing ‘extra’ services 6% 7% 8% 0% 7% 2%

Customer Retention and Interoperability Research
Prepared for: Ofcom 63
The results suggest that while comparisons are hard to make across multiple elements of communications provider offerings, overall cost, relevant functionality/features and quality of service are consistently the most challenging areas to compare, and this is true across all service areas.
Figure 52: What comparisons are difficult to make, among those who mentioned comparisons as an issue
Source: QE11. Base: All who found it difficult to compare what providers were offering n=Mobile Network switcher/considerer n=461/277; Dual Play switcher/considerer n=253/77*; Triple Play switcher/considerer n=239/96*; Standalone Pay TV switcher considerer n=113/111
*Note: Low base size, treat as indicative only
Supporting qualitative comments
The qualitative stage reveals a perception amongst some consumers that cost comparisons are particularly difficult because packages and tariffs vary so much by providers. Even price comparison websites are sometimes considered difficult to navigate due to the complex nature of the packages, as illustrated by the following quote.
“Price Comparison Websites don’t work as easily for this sort of thing as they do for car insurance.” Female, London, Pay TV owner
Another issue sometimes raised during the qualitative stage is a perception of lack of clarity around the ‘add on costs’ of services. For example providers were not always considered to be sufficiently transparent with their additional fees, e.g. for multi-room services or the cost of their insurance services. The resulting desire for greater transparency is reflected in the following quote:
“The costing is not always made transparent. Providers always add things on, for example the cost of a landline onto your Internet. I didn’t really expect that after
464240
292828
161514
9
5653
4632
1630
392225
4
Service qualityBB speeds
Overall costSpecific elements cost
Data usage allowancesLL calls package
Installation processContract length
Traffic mgmt policiesOther BB details
39
39
36
27
26
22
16
48
44
41
31
31
24
21
Overall cost
Network coverage
Service quality
Data allowance
Specific elements cost
# minutes/texts
Contract length
%
SwitchersConsiderers
Mobile Phone
%
Dual Play
39
39
38
33
32
18
53
41
39
35
24
24
Overall cost
TV package/channels
Specific elements cost
Service quality
Installation process
Contract length
%
Pay TV (only)
393533
262221202018
153
503937363738
3030
1618
9
Overall costBB speeds
Service qualitySpecific elements cost
Installation processTV package/channels
Data usage allowancesLL calls package
Traffic mgmt policiesContract length
Other BB details
%
Triple Play
60% 66%
Comparison was an issue
61% 75%
Comparison was an issue
53% 78%
Comparison was an issue
61% 77%
Comparison was an issue

Customer Retention and Interoperability Research
Prepared for: Ofcom 64
having seen the initial price. I think all providers need to be more transparent about their costs.” Male, Birmingham, Triple play bundle
It is evident from the quantitative results that several factors serve to make comparisons difficult, including; inconsistent terminology, information being unavailable, providers hiding things and the whole area being complicated. However, claimed lack of personal knowledge and the perception that information is presented in a complicated way are the two most widespread stumbling blocks. Both these issues are equally likely to be raised by Switchers (around one in three) across the different services.
Among Considerers, the most prevalent issue appears to be information being presented in complicated way. Initial indications* suggest that this is a particular issue in the Dual and Triple Play markets, where more than two in five cite this as the main reason for comparisons being difficult to make. Considerers in the Dual Play and Triple Play markets are also likely to claim that the whole area is complex (around two in five) and that providers try to hide things (around one in three).
Figure 53: Why comparisons are difficult to make, among those who mentioned comparisons as an issue
Source: Customer Retention & Interoperability Research 2012. QE13. Base: All who found it difficult to compare what providers were offering: Mobile Network switcher/considerer n=461/277; Dual Play switcher/considerer n=253/77*; Triple Play switcher/considerer n=239/96*; Standalone Pay TV switcher considerer n=113/111
*Note: Low base size, treat as indicative only
4.4.2 Contract restrictions
The qualitative stage revealed the following concerns amongst some consumers about contracts:
32
31
28
26
22
17
24
35
32
33
31
18
Lack personal knowledge
Info in complicated way
Whole area complicated
Inconsistent terminology
Providers hide things
Info unavailable
%
Mobile Phone
Dual Play
Pay TV (only)
Triple Play
38
30
28
22
20
15
27
29
26
25
32
21
Lack personal knowledge
Info in complicated way
Inconsistent terminology
Providers hide things
Whole area complicated
Info unavailable
%
36
32
30
28
27
18
47
34
37
41
35
16
Info in complicated way
Lack personal knowledge
Inconsistent terminology
Whole area complicated
Providers hide things
Info unavailable
% 32
29
28
26
22
16
40
23
37
29
37
18
Info in complicated way
Lack personal knowledge
Whole area complicated
Inconsistent terminology
Providers hide things
Info unavailable
%
60% 66%
Comparison was an issue
61% 75%
Comparison was an issue
53% 78%
Comparison was an issue
61% 77%
Comparison was an issue
SwitchersConsiderers

Customer Retention and Interoperability Research
Prepared for: Ofcom 65
Consumers feel that it is difficult to find out when their contract actually expires. This is particularly the case for Pay TV users, where there is felt to be an absence of proactive notifications on the part of the communications provider regarding contract renewal.
Consumers are reluctant to sign up to the 18-24 month contracts that are becoming increasingly common in the pay-monthly Mobile market as this means they have a long time to wait for their next handset upgrade. The penalties for breaking these contracts are also considered to be ‘harsh’. This is reflected in the following quote:
“It’s always very tempting to go with the longer contract because the breakdown is lower. I took out a two year contract, didn’t pay anything for the phone, but I had to stay two years to make it worthwhile. It was foolish because I probably could have bought forty iPhones by now but I would have been penalised if I had broken the contract.” Male, London, Technology group
During the quantitative stage those that were still within their contract period and who reported this as an issue during switching or a factor in their decision not to switch, were asked to explain what type of barrier this presents.
Cancellation charges are the most frequently cited issue for around two fifths of both Switchers and Considerers in each service area. Other concerns (length of contract, not wanting to pay two providers at the same time, contracts ending at different times) are less prevalent overall, and are most likely to be raised by Switchers.
Figure 54: Specific issues regarding contract restrictions, among those who mentioned contractual restrictions as an issue
Source: QE14. Base: All who mentioned “still within contract period” as a switching barrier: Mobile Network switcher/considerer n=275/260; Dual Play switcher/considerer n=105/67*; Triple Play switcher/considerer n=162/73*; Standalone Pay TV switcher considerer n=89/94*
*Note: Low base size, treat as indicative only
41
25
24
23
10
11
48
29
24
27
6
12
Cancellation charge
Can't leave
Pay two providers at once
Long contract
Contracts end different times
Can't remember
%
Mobile Phone
Dual Play
Pay TV (only)
Triple Play
40
25
25
23
8
15
44
18
14
18
13
22
Cancellation charge
Can't leave
Pay two providers at once
Long contract
Contracts end different times
Can't remember
%
46
26
23
18
13
13
48
14
17
20
5
29
Cancellation charge
Long contract
Can't leave
Pay two providers at once
Contracts end different times
Can't remember
% 48
29
19
18
9
40
13
17
25
7
Cancellation charge
Long contract
Pay two providers at once
Can't leave
Contracts end different times
%
35% 62%
Contractwas an issue
48% 64%
Contractwas an issue
35% 60%
Contractwas an issue
25% 67%
Contractwas an issue
SwitchersConsiderers

Customer Retention and Interoperability Research
Prepared for: Ofcom 66
4.4.3 Installing new services
The qualitative stage revealed some strong levels of dissatisfaction with a minority of consumers about the inconvenience of the installation process and how long it can take (especially for Pay TV services), as illustrated by the following quote:
“You have to take time off work, wait in for engineers who are always late and then it can take multiple visits before things are ready.” Female, Wales, Pay TV owner
This concern is mirrored in the quantitative stage. Switchers experiencing issues with installation, and Considerers for whom issues with installation affected their decision to stay with their current communications provider, were asked to explain what worried them most about this.
The most frequently encountered problem for Switchers during the installation process was being given an convenient time/having to take time off work (cited by around two in five across all services).
For Considerers, initial indications* are that installation costs are the most widespread concern. Installation costs are identified as an issue by around three in four Considerers in relation to Pay TV and Triple Play, and by closer to one in two Considerers in relation to Dual Play.
Figure 55: Specific issues regarding installation process, among those who mentioned installation as an issue
Source: QE22. Base: All worried about issues regarding installation: DP switcher/considerer n=188/82*; TP switcher/considerer n=207/91*; Standalone Pay TV switcher considerer n=98*/103
*Note: Low base size, treat as indicative only
4.4.4 Interoperability
Switchers who had issues with interoperability and Considerers for whom interoperability was a factor affecting their decision to stay with their current communications provider, were asked to identify which devices/products they were worried about.
SwitchersConsiderersDual Play
Pay TV (only)40
38
26
19
19
17
36
77
28
29
17
29
Inconvenient time
Cost of installation
Poor quality workmanship
Possible not done properly
Damage to home (outside)
Damage to home (inside)
%
39
31
29
12
10
2
32
58
42
20
13
12
Inconvenient time
Cost of installation
Possible not done properly
Poor quality workmanship
Damage to home (inside)
Damage to home (outside)
% 43
40
29
22
21
8
38
70
23
23
15
11
Inconvenient time
Cost of installation
Possible not done properly
Poor quality workmanship
Damage to home (inside)
Damage to home (outside)
%
Triple Play
55% 70%
Installationwas an issue
45% 75%
Installationwas an issue
46% 83%
Installationwas an issue

Customer Retention and Interoperability Research
Prepared for: Ofcom 67
Differences emerge between services in this regard.
Switchers in the pay-monthly Mobile and Dual Play markets claim to have encountered most difficulties getting their computers/laptops to connect with the new service when they switched communications provider. Whereas those switching to a Triple Play bundle with Pay TV or standalone Pay TV service, are most likely to report difficulties getting their games consoles to connect with the new service.
Considerers are most likely to been concerned about being able to connect their computers/laptops to a new service. This is the case for all services/bundles with the exception of standalone Pay TV, where games consoles are equally as likely to be cited as a concern.
Figure 56: Existing devices raising concern or causing difficulty in relation to interoperability issues with new devices, among those who mentioned interoperability as an issue
Source: QE15-16. Base: All worried/found it difficult about other devices/products not working with the new service (inter-operability): Mobile Network switcher/considerer n=242/204; DP switcher/considerer n=100/56; TP switcher/considerer n=117/56*; Standalone Pay TV switcher considerer n=80*/90*
*Note: Low base size, treat as indicative only
2826
1714118633
3836
201213
6758
Computer/laptopSmartphones
TabletMP3
Games consolePVR/DVRSmart TV
Hand-held games consolee-reader
%
SwitchersConsiderers
Mobile Phone
Dual Play
Pay TV (only)
Triple Play
3726
222120
151198
313128
1020
1011
511
Games consoleSmartphones
Computer/laptopPVR/DVR
TabletHand-held games console
Smart TVMP3
e-reader
%
372424
1399877
657
1618
96
179
3
Computer/laptopTablet
SmartphonesGames console
PVR/DVRHand-held games console
e-readerSmart TV
MP3
% 403231
271918171413
2024
5124
151215
715
Games consoleSmartphones
Computer/laptopTablet
PVR/DVRMP3
Smart TVHand-held games console
e-reader
%
31% 48%
Interoperabilitywas an issue
44% 62%
Interoperabilitywas an issue
25% 47%
Interoperabilitywas an issue
24% 56%
Interoperabilitywas an issue

Customer Retention and Interoperability Research
Prepared for: Ofcom 68
5 Services: Save Activity
5.1 Introduction This section explores the incidence and experience of save activity, namely discussions with providers as they try to retain customers who express an interest or an intention to switch service(s).14
A number of key definitions are relevant for this section of the report:
Service Areas
Pay-monthly Mobile: on a pay-monthly contract (post-pay) that is personally used and paid for
Dual Play: have fixed line phone AND fixed broadband internet access in a bundle or package from the SAME supplier
Triple Play: have fixed line phone AND fixed broadband internet access AND pay TV service in a bundle or package from the SAME supplier
Standalone Pay TV: have Pay TV but not bundled with other services (respondent may have other services but with different suppliers)
Market participation
Switchers: changed communications provider for one of the following four services in the last 2 years (the last 12 months and last 13-24 months are split out where base sizes allow)
Considerers: actively considered changing communications provider for one of the following four services in the last 12 months but decided against
– A current pay-monthly mobile phone service
– One or more services within a current Dual Play bundle (including fixed line phone and fixed broadband)
– One or more services within a current Triple Play bundle (including fixed line phone, fixed broadband and Pay TV)
– A current standalone Pay TV service (where this service has been purchased as a standalone service, not in a bundle with any other service(s)).
Active participants: the combined sample of all Switchers and Considerers based on the above definitions.
5.2 Incidence of save activity
5.2.1 Switchers
The quantitative stage reveals that the majority of Switchers (76%) claim to have spoken to their previous communications provider once they had decided to switch – 62% report having called their previous provider and 14% report their previous provider contacting them.
14 For the purposes of this report save activity has been defined as any attempt by the provider to retain
their customer and does not distinguish between reactive or proactive save activity. Reactive save is a type of save activity, but is not specifically dealt with in this research report.

Customer Retention and Interoperability Research
Prepared for: Ofcom 69
Of those who spoke to their previous provider, the majority (72%) recall being the subject of at least some sort of persuasive effort to remain with that provider. For the most part consumers perceived this save activity as unpressurised, although almost one in five (17%) felt that their provider put them under pressure to stay.
Persuasion approaches in this situation revolve mainly around the previous provider conveying their own product benefits; 43% of Switchers who recall experiencing such efforts on the part of their provider claim this information was shared with them. However deals and discounts in different forms are also recalled as a key topic during these conversations; 30% recall being told about a deal on a new product, 21% recall being offered a temporary discount and 15% recall being offered a permanent discount.
Figure 57: Incidence of save activity and approach – Switchers
Source: QD6-D7 Base: D6 All switchers who spoke to previous suppler n=1390; D7 All switchers who were subject to persuasion n=1008
5.2.2 Considerers
Close to one in two Considerers (50%) claim to have spoken to their communications provider while they were considering switching - 43% report having called their provider and 7% report their provider contacting them.
Of those who spoke to their communications provider at this time, the majority (82%) recall being the subject of at least some sort of persuasive effort. For the most part this save activity is experienced as unpressurised, although around one in seven (14%) felt that their provider put them under pressure to stay.
Considerers who recall experiencing such interventions on the part of their provider are most likely to recall being offered some type of deal or discount during the conversation. Around one in three claim they were offered a deal on a new product (37%), and slightly fewer claim they were given a permanent (31%) or temporary (30%) discount. Almost one in three Considerers (31%) also recall their communications provider discussing their own product benefits during these conversations.
17%
55%
24%
4%
Put me underpressure to stay
Tried to persuade(no pressure)
Did not try topersuade
Can't remember
43%
30%
21%
21%
19%
16%
15%
7%
Talked about own product benefits
Deal on new product
Discount for limited time
Compared customer service to other providers
Talked about new developments
Talked about cancellation costs
Permanent reduced price
Money off previous bill

Customer Retention and Interoperability Research
Prepared for: Ofcom 70
Figure 58: Incidence of save activity and approach - Considerers
Source: QD6-D7 Base: D6 All considerers who spoke to previous suppler n=992: D7 All considerers who were subject to persuasion n=813
5.3 Experience of save activity
Supporting qualitative comments
The qualitative research identified two different views towards save activity:
Consider efforts to persuade them to stay as an intrusion: Some older consumers regard any supplier activity as unwelcome. This is particularly the case within a face-to-face context, such as inside a provider’s store. This attitude can be summed up by the following quote:
“It’s annoying dealing with companies and bartering to get the best rates. They should give you the best deal straight away.” Female, Wales, Triple play bundle
Welcome the opportunity to negotiate: Other predominantly younger consumers enjoy comparing providers against each other and negotiating a deal. This attitude can be summed up by the following quote:
“As soon as the billboards go up with a new deal, that’s when I consciously start thinking about shopping around and seeing what I can get knocked off from my communications provider.” Male, Birmingham, Triple play bundle
In the quantitative stage, views on save activity were canvassed in order to assess whether consumer experiences are predominantly negative or predominantly positive.
5.3.1 Switchers
Of those Switchers who recall being subject to ‘save’ activity (that is, they recall their communications provider trying to persuade them, or putting pressure on them, to stay), two in five (41%) are unhappy with their experience. In fact almost all (91%) are happy that they decided to switch and few (8%) are unhappy with this decision.
14%
68%
15%
3%
Put me underpressure to stay
Tried to persuade(no pressure)
Did not try topersuade
Can't remember
37%
31%
31%
30%
17%
16%
12%
8%
Deal on new product
Permanent reduced price
Talked about own product benefits
Discount for limited time
Talked about new developments
Compared Customer Service to others
Talked about cancellation costs
Money off previous bill

Customer Retention and Interoperability Research
Prepared for: Ofcom 71
Figure 59: Satisfaction with save activity / decision to switch
Source: QD8/D13 Base: D8 All switchers who were subject to persuasion n=1008. D13 All switchers n=1814
A more detailed analysis of communications provider persuasion efforts reveals that those Switchers who claim to have had a negative ‘save’ experience cite broadly similar topics of conversation, but are twice as likely to recall being told about cancellation costs (24% of those who are unhappy recall this being mentioned, compared to 11% of those who are happy).
Figure 60: Save approach used by communications provider
Source: QD8/D13 Base: D8 All Switchers subject to persuasion n=1008; happy with efforts to persuade n=491; unhappy with efforts to persuade n=414
10
15
26
44
4
All Switchers
Very happy
Fairly happy
Fairly unhappy
Very unhappy
Don't know
Happiness with efforts to persuade
226
42
49
All Switchers
Happiness with decision to switch
48%
91%
41%
31%
20%
20%
19%
11%
15%
8%
45%
32%
23%
24%
21%
24%
16%
7%
Talked about own product benefits
Deal on new product
Discount for limited time
Compared customer service to other providers
Talked about new developments
Talked about cancellation costs
Permanent reduced price
Money off previous bill
Happy witheffortsUnhappywith efforts

Customer Retention and Interoperability Research
Prepared for: Ofcom 72
Those who are happy with their ‘save’ experience are most likely to describe it as polite (45%), friendly (40%) and professional (37%). Those who are unhappy are most likely to refer to it as annoying (49%), persistent (44%) and pushy (41%).
5.3.2 Considerers
Of the Considerers who recall being subject to ‘save’ activity (that is, they recall their communications provider trying to persuade them, or putting pressure on them, to stay), the majority claim they had a positive experience (79%), and a similar proportion claim to be satisfied with their decision to stay with their communications provider (78%).
Figure 61: Satisfaction with save activity / decision to stay
Source: QD8/D13 Base: D8 All considerers who were subject to persuasion n=813. D13 All considerers n=1808
Considerers who claim to have had a negative ‘save’ experience are three times more likely to recall being told about cancellation costs (24% of those who are unhappy recall this tactic, compared to 9% of those who are happy). By contrast, deals and discounts are more likely to be front of mind among Considerers who are happy with their provider’s intervention (by at least 12%).
26
14
60
19
All Considerers
Very happy
Fairly happy
Fairly unhappy
Very unhappy
Don't know
Happiness with efforts to persuade
5314
58
20
All Considerers
Happiness with decision to stay
79% 78%

Customer Retention and Interoperability Research
Prepared for: Ofcom 73
Figure 62: Save approach used by communications provider
Source: QD8/D7 Base: All Considerers subject to persuasion n=813; happy with efforts to persuade n=640; unhappy with efforts to persuade n=156
Considerers who are happy with their ‘save’ experience are most likely to describe it as helpful (55%), friendly (53%), polite (50%) and professional (45%). Those who are unhappy are most likely to refer to it as annoying (36%), pushy (33%) and persistent (31%).
The majority of Considerers who spoke to their communications provider were made some sort of offer by their communications provider in an attempt to persuade them to stay (45% were, 10% were not). Most of those who experienced such an attempt accepted the offer they were made (36% accepted, 9% did not). Most of those accepting their provider’s offer did so right away, i.e. while they were on the call (59%).
Regardless of how quickly they responded to the offer, almost all (96%) agreed that it was a factor in their decision to stay with their communications provider; whether it was the primary reason for staying (44%), whether it was an important reason in the decision to stay (39%) or whether it simply tipped the balance (12%).
40%
36%
34%
30%
16%
14%
9%
8%
28%
11%
15%
33%
19%
21%
24%
11%
Deal on new product
Permanent reduced price
Discount for limited time
Talked about own product benefits
Talked about new developments
Compared customer service to other providers
Talked about cancellation costs
Money off previous bill
Happy witheffortsUnhappywith efforts
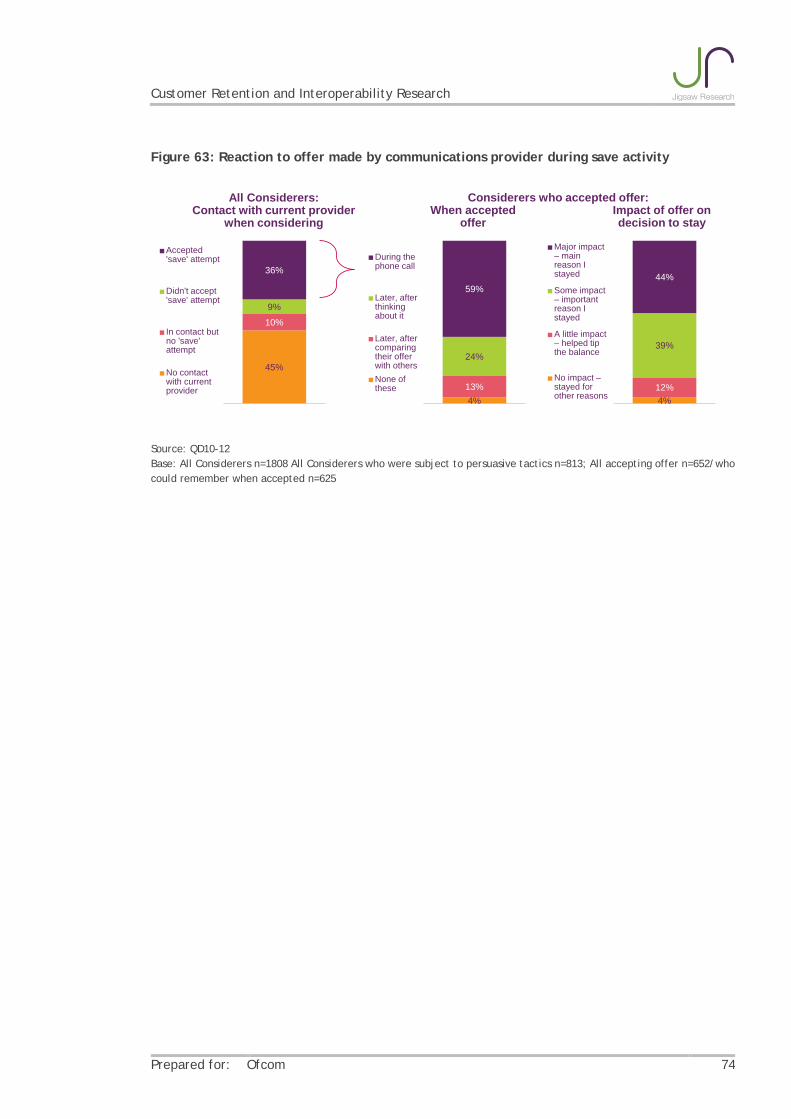
Customer Retention and Interoperability Research
Prepared for: Ofcom 74
Figure 63: Reaction to offer made by communications provider during save activity
Source: QD10-12 Base: All Considerers n=1808 All Considerers who were subject to persuasive tactics n=813; All accepting offer n=652/who could remember when accepted n=625
45%
10%
9%
36%
Accepted 'save' attempt
Didn't accept 'save' attempt
In contact but no 'save' attempt
No contact with current provider
4%12%
39%
44%
Major impact – main reason I stayed
Some impact – important reason I stayed
A little impact – helped tip the balance
No impact –stayed for other reasons4%
13%
24%
59%
During the phone call
Later, after thinking about it
Later, after comparing their offer with othersNone of these
All Considerers:Contact with current provider
when consideringWhen accepted
offerImpact of offer on decision to stay
Considerers who accepted offer:

Customer Retention and Interoperability Research
Prepared for: Ofcom 75
6 Devices: Changing Devices and Making Choices
6.1 Introduction The research focused on respondents who had switched or considered switching services within one of the areas of pay-monthly Mobile, Dual Play, Triple Play or standalone Pay TV. Questions about devices were also only asked to these participants. Therefore all data reported here is among the qualifying sample of Switchers and Considerers, and reflects usage and attitude among this group of active participants, rather than that of the wider general UK population.
This section provides a snapshot of the devices used by these Switchers and Considerers. It focusses on the smartphone and tablet markets in particular - covering usage and switching activity, user profiles, the content affected by switching activity, the factors that drive the purchase decision and, for smartphone users, their switching barriers and hurdles.
A number of key definitions are relevant for this section of the report:
Service Areas
Pay-monthly Mobile: on a pay-monthly contract (post-pay) that is personally used and paid for
Dual Play: have landline/fixed line phone AND fixed broadband internet access in a bundle or package from the SAME supplier
Triple Play: have landline/fixed line phone AND fixed broadband internet access AND pay TV service in a bundle or package from the SAME supplier
Standalone Pay TV: have Pay TV but not bundled with other services (respondent may have other services but with different suppliers)
Market participation
Switchers: changed communications provider for one of the following four services in the last 2 years (the last 12 months and last 13-24 months are split out where base sizes allow)
Considerers: actively considered changing communications provider for one of the following four services in the last 12 months but decided against
– A current pay-monthly mobile phone service
– One or more services within a current Dual Play bundle (including fixed line phone and fixed broadband)
– One or more services within a current Triple Play bundle (including fixed line phone, fixed broadband and Pay TV)
– A current standalone Pay TV service (where this service has been purchased as a standalone service, not in a bundle with any other service(s)).
Active participants: the combined sample of all Switchers and Considerers based on the above definitions.

Customer Retention and Interoperability Research
Prepared for: Ofcom 76
6.2 Relationship between services and devices The following section provides information on usage patterns within the qualifying sample of 2612 ‘active participants’ in the pay-monthly Mobile, Dual Play, Triple Play and standalone Pay TV markets. These data are not representative of the general population of consumers, but rather the specific sample of active participants in this survey.
The most common household devices used by active participants are laptop or desktop computers (used by 88%), followed closely by smartphones (used by 66%).
The rapidly expanding market for tablet computers (such as iPads, Samsung Galaxy tablets, etc.) appears to be less established within this sample of active participants than the market for smartphones (it is instructive to note that fieldwork was conducted before Christmas). Not only is penetration significantly lower (27%) but most tablet users are new to the market (67% are new purchasers versus 36% of smartphone users). It follows that few tablet users have been in the market long enough to change brand of device(s), with 9% having changed brand of device in the last two years, versus 24% of smartphone users.
It is worth noting that devices other than smartphones and tablets were not asked about in detail in this particular research.
Figure 64: Devices used
Source: QF1a-F7 Base: Total Sample n=2612; All using laptop/desktop n=2297; All using MP3 n=1142; All using Games Console n=1073; All using Hand-held console n=586; All using e-reader n=580; All using Smart TV n=300
2
11
22
22
27
38
39
43
66
88
None
Smart TV
e-Reader
Hand-held Games Console
Tablet Computer
PVR/DVR
Games console (TV)
MP3 Player
Smart Phones
Laptop/Desktop Computer
%

Customer Retention and Interoperability Research
Prepared for: Ofcom 77
Figure 65: Device ownership among smartphone and tablets users
Source: QF1a/F9/F18-20 Base: Total Sample n=2612* (NOT nationally representative sample); All with Smartphones n=1764; All with Tablets n=710
The brands most commonly used by the Switchers and Considerers surveyed are as follows:
Laptop/Desktop Computer:
– Dominant providers: Dell 22%, HP 19% and Toshiba 13%
– Other key providers: Apple 10%, Sony 6%, Asus 5% and others 35%
Smartphones:
– Dominant providers: iPhone 29% and Samsung 28%
– Other key providers: HTC 15%, Blackberry 13%, Nokia 7% and others 9%
Operating systems are most likely to be Android 48%, iOS 26% or Blackberry 13%
MP3 Player:
– Dominant providers: Apple iPod 66%
– Other key providers: Sony 15%, Creative 7% and others 11%
Games console (TV):
– Dominant providers: Xbox 360 35%, Nintendo Wii 31% and Sony PS3 29%
Tablet Computers:
– Dominant providers: Apple iPad 61%
– Other key providers: Samsung Galaxy Note 10%, Asus 4%, Google Nexus 4% and others 20%
Operating systems are most likely to be iOS 58% or Android 31%
Hand-held Games Console:
– Dominant providers: Nintendo DS 63%
– Other key providers: Nintendo 3DS 17%, Sony PSP 15% and others 5%
e-Reader:
– Dominant providers: Kindle 84%
– Other key providers: Sony Reader 8%, Kobo 7% and other 2%
1
3
23
37
67
36
9
24
Tablet
Smartphone
RP considerer Repeat purchaser New purchaser Switcher
27
66
Tablet
Smartphone
% use%

Customer Retention and Interoperability Research
Prepared for: Ofcom 78
Smart TV:
– Dominant providers: Samsung 38% and Sony 25%
– Other key providers: Panasonic 15%, LG 12% and others 9%.
6.3 Smartphones
6.3.1 Overview of smartphone usage and changing devices
The qualitative research indicates three different levels of backing up amongst smartphone users:
Some consider their phone to be a discrete entity and are not concerned about backing up any of the content
Some periodically connect their phone to their laptop/PC and download or share photos (particularly to Facebook), contacts, music and videos
Some more regularly back-up and update their content, sometimes automatically via iCloud syncing.
Problems are not widely encountered by those who back-up their data, with fewer than one in ten reporting that the process is ‘fairly’ or ‘very’ difficult.
One issue raised during the qualitative research was a frustration with connection leads and peripherals (e.g. docks / speakers) which are brand specific, rather than generic, and can make backing-up more difficult.
Figure 66: Method and ease of backing-up data
Source: QF26/27/28 Base: Al with Smartphone n=1764; iOS n=476; Android n=841. All who back-up iOS/Android n=413/508; All who do NOT back-up iOS/Android n=63*/333
*Note: Low base size, treat as indicative only
40
7
7
14
45
14
5
40
20
55
Don't back up data
Cloud (other)
Cloud (manufacturer)
Wi-Fi
USB cableiOSAndroid
%
31
4
1
26
43
38
1
31
30
Don't know how
Difficult
Not possible
Don't getaround/forget
Contentunimportant
iOSAndroid
48 41
43 48
8 81 1
iOS Android
VerydifficultFairlydifficultFairlyeasyVery easy

Customer Retention and Interoperability Research
Prepared for: Ofcom 79
6.3.2 Factors driving choice of device/operating system
The MaxDiff exercise described in previous sections (and detailed in full in Appendix 2) was also employed to determine the relative importance of the various elements that underpin the choice of a new smartphone. Respondents were asked to think about what would be important to them when next switching to, or considering, a new smartphone, and to focus on the choice of device and operating system, rather than the choice of mobile network.
Respondents were also asked to take into consideration anything that may have changed between the time of the fieldwork, and the time they previously switched or considered switching handset (in terms of how they use the device or what devices/operating systems are available). The criteria that each respondent rated were tailored by service from the following:
OPERATING SYSTEM (OS)
– Has the OS I want
– Range of apps/games available
– Same OS as other devices I own
– Same OS as previous tablet/smartphone
INTEROPERABILITY
– Compatible with other devices I own
– Easy to integrate
– Easy to transfer content between devices
– Easy to back up data
Interoperable
DEVICE/FUNCTIONALITY
– Reliability of device
– Good battery life
– Ease of use
– Most up to date technology
– Amount of storage
– Looks good/stylish
BRAND
– Brand of handset/tablet
– Previous experience
– Same brand as other devices I own
– Customer service
NETWORK RELIABILITY
– Available on network I prefer
COST
– Initial costs
– On-going costs
WORD OF MOUTH (WOM)
– Recommended by family/friends
– Recommended by experts.

Customer Retention and Interoperability Research
Prepared for: Ofcom 80
The resulting scores are reported on a 0 to 100 scale to indicate their relative importance when switching/considering switching to a new smartphone. The individual or ‘micro’ (e.g. recommended by family/friends and recommended by experts) criteria were grouped together into high level ‘macro’ (e.g. word of mouth) factors at the analysis stage.
Looking first at this macro level, the MaxDiff analysis identifies device/functionality as the key decision driver for smartphone Switchers and Considerers when choosing a new smartphone, alone driving 40% of the decision. Cost elements exert the second largest influence on choice of device, driving 18% of the decision, and operating system (12%) and interoperability (11%) factors follow closely behind.
Interoperability is twice as important when choosing a smartphone device as when choosing mobile service provider (driving 11% of the decision over device, compared to 4.5% of the decision over service).
Figure 67: Relative importance of macro decision-making criteria when choosing the next smartphone device/operating system
Source: QH1a Base: All Smartphone n=1145 (clean data only)
Over the next few pages we present a detailed analysis of the Max Diff scores on each individual element. In order to show how these scores vary from the overall sample of participants, Max Diff scores for each service area are presented as an index, showing the extent to which the scores are above or below the average.
A more detailed analysis of the individual elements that smartphone Switchers and Considerers claim would drive their choice of device/operating system, shows that the most important elements of device/functionality are reliability, battery life and ease of use. Having the most up-to-date technology, storage and look and feel are less likely to be seen as important when choosing a new smartphone.
The importance of the availability of the preferred network and operating system in this market can be seen by their position in the ranking of the individual criteria (6th and 7th respectively).
No individual aspect of interoperability stands out as a key driver of smartphone choice.
39.8
18.1
11.5
11
10.6
5.5 3.2
Device/functionality
Cost
Operating System
Interoperability
Brand
Network /connectionreliability
WOM

Customer Retention and Interoperability Research
Prepared for: Ofcom 81
Figure 68: Relative importance of individual decision-making criteria when choosing the next smartphone device/operating system
Source: QH1a Base: All Smartphone Switchers/Considerers n=1145 Bars show relative importance of the different elements that make up the various purchase decisions. Max diff scores sum to 100
6.3.3 Switching hurdles: issues experienced when changing device
Costs (whether they relate to the cost of the new handset or the new contract), in addition to length of contract are the most commonly reported major issues experienced by smartphone Switchers (i.e. those who have changed or upgraded their handset/operating system in the last two years).
Besides these two elements, smartphone Switchers are more likely to have encountered ‘minor’ rather than ‘major’ difficulties during switching. However, around one in five of those who have switched smartphone identify major problems with interoperability, insofar as they were either unable to transfer, or had difficulties transferring, personal and paid-for content, and generally felt they lacked information about moving content at the time.
259
231
217
213
206
132
129
111
106
102
Reliability of device
On-going costs
Good battery life
Initial costs
Ease of use
Available on preferred network
Preferred OS
Preferred brand handset
Most up to date technology
Amount of storage
77
67
62
59
57
55
54
49
42
40
37
36
33
25
Looks good / stylish
Range of Apps/games available
Easy transfer content between…
Previous experience with brand…
Customer service from manufacturer
Easy to back up data
Easy to integrate
Compatible with other devices owned
Recommended by family/friends
Same OS as previous smartphone
Same OS as other devices owned
Inter-operability
Recommended by expert
Same brand as other devices owned
Above average Below averageMax diff score*
10.6
9.4
8.9
8.7
8.4
5.5
5.3
4.6
4.4
4.2
Max diff score*
3.3
2.8
2.6
2.5
2.4
2.4
2.3
2.1
1.8
1.8
1.6
1.6
1.4
1.1
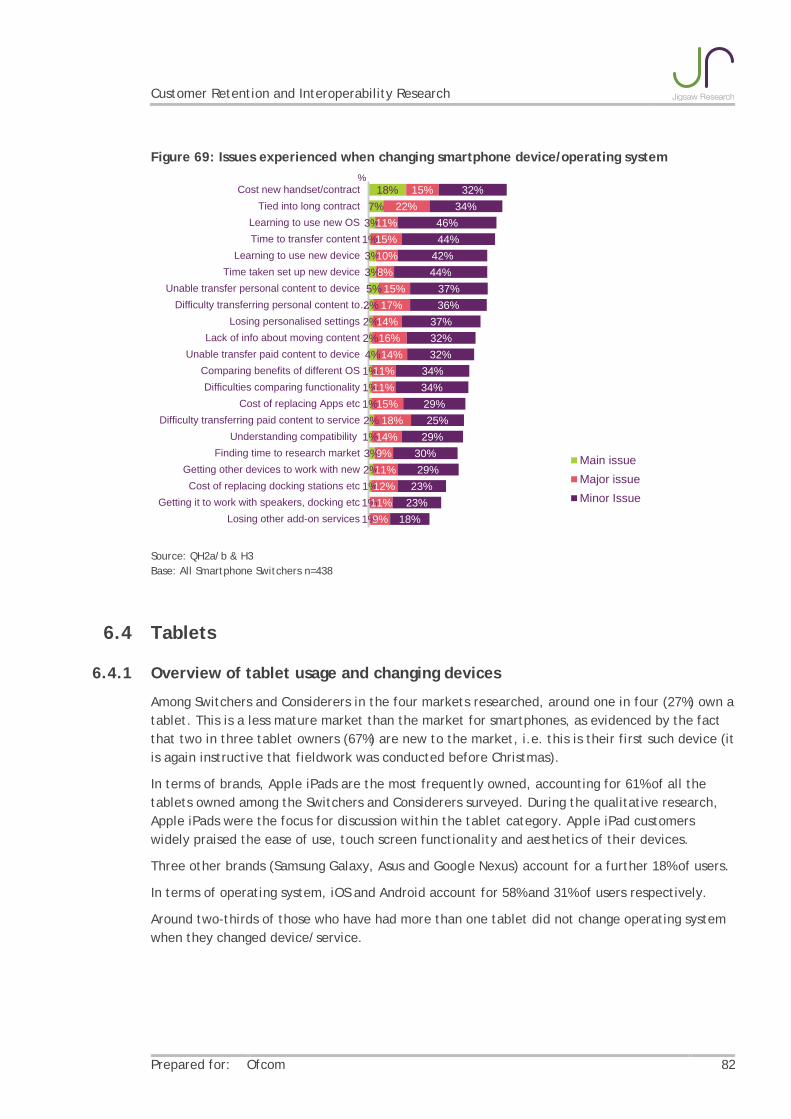
Customer Retention and Interoperability Research
Prepared for: Ofcom 82
Figure 69: Issues experienced when changing smartphone device/operating system
Source: QH2a/b & H3 Base: All Smartphone Switchers n=438
6.4 Tablets
6.4.1 Overview of tablet usage and changing devices
Among Switchers and Considerers in the four markets researched, around one in four (27%) own a tablet. This is a less mature market than the market for smartphones, as evidenced by the fact that two in three tablet owners (67%) are new to the market, i.e. this is their first such device (it is again instructive that fieldwork was conducted before Christmas).
In terms of brands, Apple iPads are the most frequently owned, accounting for 61% of all the tablets owned among the Switchers and Considerers surveyed. During the qualitative research, Apple iPads were the focus for discussion within the tablet category. Apple iPad customers widely praised the ease of use, touch screen functionality and aesthetics of their devices.
Three other brands (Samsung Galaxy, Asus and Google Nexus) account for a further 18% of users.
In terms of operating system, iOS and Android account for 58% and 31% of users respectively.
Around two-thirds of those who have had more than one tablet did not change operating system when they changed device/service.
%18%
7%3%1%3%3%5%2%2%2%4%1%1%1%2%1%3%2%1%1%1%
15%22%
11%15%10%8%
15%17%
14%16%14%
11%11%15%18%
14%9%11%12%11%9%
32%34%
46%44%
42%44%
37%36%
37%32%32%
34%34%29%25%
29%30%29%
23%23%
18%
Cost new handset/contractTied into long contract
Learning to use new OSTime to transfer content
Learning to use new deviceTime taken set up new device
Unable transfer personal content to deviceDifficulty transferring personal content to…
Losing personalised settingsLack of info about moving content
Unable transfer paid content to deviceComparing benefits of different OSDifficulties comparing functionality
Cost of replacing Apps etcDifficulty transferring paid content to service
Understanding compatibilityFinding time to research market
Getting other devices to work with newCost of replacing docking stations etc
Getting it to work with speakers, docking etcLosing other add-on services
Main issueMajor issueMinor Issue
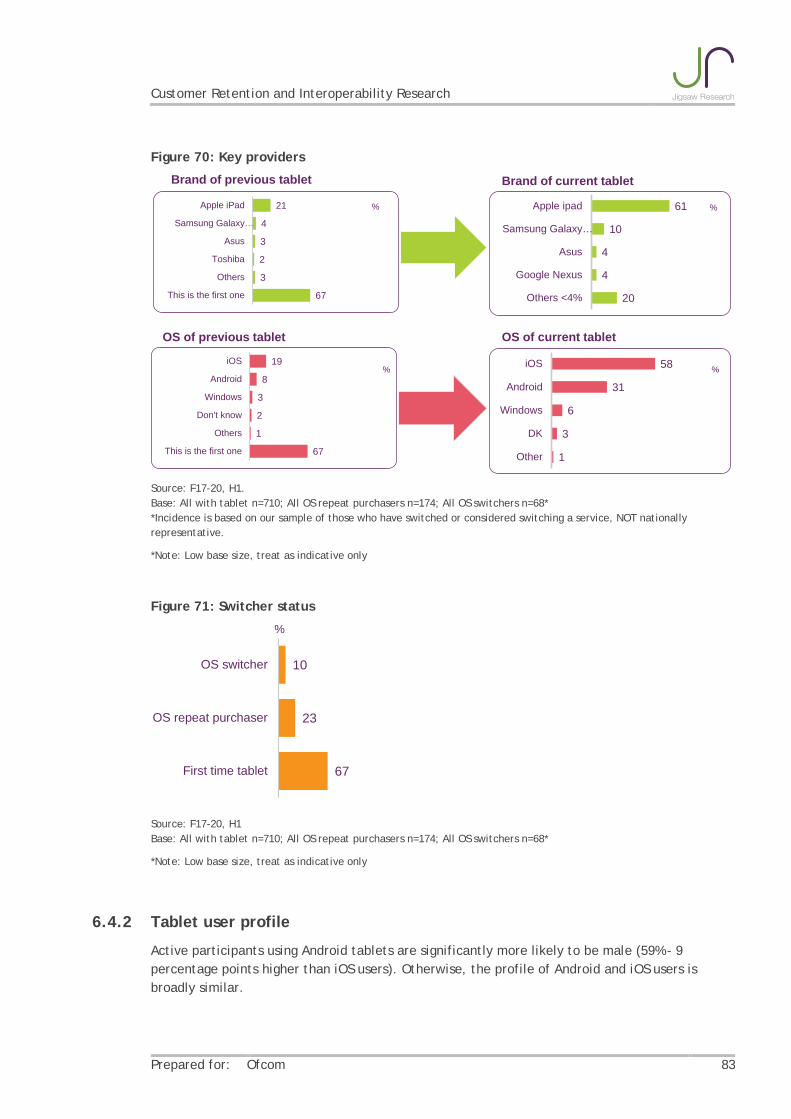
Customer Retention and Interoperability Research
Prepared for: Ofcom 83
Figure 70: Key providers
Source: F17-20, H1. Base: All with tablet n=710; All OS repeat purchasers n=174; All OS switchers n=68* *Incidence is based on our sample of those who have switched or considered switching a service, NOT nationally representative.
*Note: Low base size, treat as indicative only
Figure 71: Switcher status
Source: F17-20, H1 Base: All with tablet n=710; All OS repeat purchasers n=174; All OS switchers n=68*
*Note: Low base size, treat as indicative only
6.4.2 Tablet user profile
Active participants using Android tablets are significantly more likely to be male (59% - 9 percentage points higher than iOS users). Otherwise, the profile of Android and iOS users is broadly similar.
%
OS of previous tablet OS of current tablet
% %
Brand of previous tablet
%
Brand of current tablet
20
4
4
10
61
Others <4%
Google Nexus
Asus
Samsung Galaxy…
Apple ipad
1
3
6
31
58
Other
DK
Windows
Android
iOS19
8
3
2
1
67
iOS
Android
Windows
Don't know
Others
This is the first one
21
4
3
2
3
67
Apple iPad
Samsung Galaxy…
Asus
Toshiba
Others
This is the first one
10
23
67
OS switcher
OS repeat purchaser
First time tablet
%

Customer Retention and Interoperability Research
Prepared for: Ofcom 84
6.4.3 Content affected by switching activity
The large majority (three in four) use their tablets to browse the internet. Other principal activities for at least one in three iOS and Android users include games, apps, social networking and storing content. iOS users are significantly more likely than Android users to use their device to download apps, read books/magazines, listen to music, watch video clips and Skype.
The majority of tablet users store a variety of content on their devices, a greater proportion of which is paid-for compared to smartphone users.
Storage of apps is almost universal (97%), and storage of photos and games is also widespread (89% and 88% respectively).
Closer to three in four also use their tablet to store books and music. Other types of content are less popular.
Storage patterns among iOS and Android users are almost identical, the only difference being a significantly higher inclination to store apps, photos and music among iOS users than Android users.
Figure 72: Features/functions used by tablet users
Source: QF1a/QF10/QF11 Base: Total Sample n=2612; All with tablet n=710; IOS n=411; Android n=224
Claimed backing-up behaviour among tablet users is broadly similar to that among smartphone users:
The majority of tablet users are backing up their content and iOS users are significantly more likely to do so (76%) than Android users (63%).
Most (around two in five) back-up their content using a USB cable but more than one in three iOS users (38%) take advantage of the manufacturer’s cloud service – Android users are significantly less likely to back up using this method (18%).
755458
54484747
4245
3729
26252524
131311
7353
4648
4445
3437
3022222022
1718
1411
16
Browsing the internet using a browser Games
Downloading Apps Using services such as Facebook, Twitter,
LinkedIn, etc. Accessing internet services via Apps
Reading books/magazines Storing photos, music, video etc.
Listening to music Watching video clips or TV
Camera TV streaming
Video streaming VoIP (such as Skype)
Video calling Watching services like Lovefilm, Netflix etc.
Recording video clips Sending/receiving video clips
iOSAndroid
56
38
36
25
20
12
11
3
12
6
17
37
38
36
5
44
38
57
52
55
55
73
86
85
Other content
Self-taken videos
TV/films/videos
Books etc
Music
Games
Photos
Apps
Don't have Paid for Free
97 99 94
89 91 85
88 89 87
80 82 73
75 76 75
64 66 61
62 62 64
44 43 48
iOS Android
Have on main tablet %
Use main tablet for: ALL

Customer Retention and Interoperability Research
Prepared for: Ofcom 85
Among those who are backing up the content on their tablets, problems are not widely encountered, with fewer than one in ten reporting that the process is ‘fairly’ or ‘very’ difficult.
There are two notable differences however:
iOS tablet users are significantly less likely to back up their device (76%) than their smartphone counterparts (86%).
Initial indications* are that many of those who don’t back-up their content are intentional in this behaviour; around one in two don’t feel their content is sufficiently important to warrant backing up. Lack of knowledge affects a minority (around one in four on average) and even fewer (less than one in five) simply forget.
Figure 73: Method and ease of backing-up data
Source: QF13/14/15 Base: All with tablet n=710; IOS n=411; Android n=224; All who do NOT back up IOS/Android n=94*/79*; All who DO back up IOS/Android n=317/145
*Note: Low base size, treat as indicative only
6.4.4 Factors driving decision to purchase device/operating system
The MaxDiff exercise described in previous sections (and detailed in full in Appendix 2) was also employed to determine the relative importance of the various elements that underpin the choice of a new tablet. Respondents were asked to think about what would be important to them when next switching to, or considering, a new tablet, and to focus on the choice of device and operating system, rather than the choice of broadband communications provider.
Respondents were also asked to take into consideration anything that may have changed between the time of the fieldwork, and the time they previously switched or considered switching tablet (in terms of how they use the device or what devices/operating systems are available). The precise criteria that each respondent rated were tailored by service from the following list:
OPERATING SYSTEM (OS)
37
10
18
35
34
24
7
38
25
39
Don't back up data
Cloud (other)
Cloud (manufacturer)
Wi-Fi
USB cableiOSAndroid
%
21
4
2
17
58
27
8
3
17
47
Don't know how
Difficult
Not possible
Don't getaround/forget
Contentunimportant
iOSAndroid
43 46
46 50
8 31
iOS Android
VerydifficultFairlydifficultFairly easy
Very easy
Customer Retention and Interoperability Research
Prepared for: Ofcom 86
– Has the OS I want
– Range of apps/games available
– Same OS as other devices I own
– Same OS as previous tablet/smartphone
INTEROPERABILITY
– Compatible with other devices I own
– Easy to integrate
– Easy to transfer content between devices
– Easy to back up data
Interoperable
DEVICE/FUNCTIONALITY
– Reliability of device
– Good battery life
– Ease of use
– Most up to date technology
– Amount of storage
– Looks good/stylish
BRAND
– Brand of handset/tablet
– Previous experience
– Same brand as other devices I own
– Customer service
NETWORK RELIABILITY
– Available on network I prefer
COST
– Initial costs
– On-going costs
WORD OF MOUTH (WOM)
– Recommended by family/friends
– Recommended by experts
The resulting scores are reported on a 0 to 100 scale to indicate their relative importance when switching/considering switching to a new tablet. The individual or ‘micro’ (e.g. recommended by family/friends and recommended by experts) criteria were grouped together into high level ‘macro’ (e.g. word of mouth) factors at the analysis stage.
Looking first at this macro level, the MaxDiff analysis confirms that device/functionality is equally as important when choosing a new tablet as it is when choosing a new smartphone, alone driving two fifths (39%) of the decision.
However in this market, interoperability is the second most important element, driving 17% of the decision over which tablet to choose, 6% more than for choice of smartphone. The operating

Customer Retention and Interoperability Research
Prepared for: Ofcom 87
system also plays a greater part in the decision, driving 15% of the decision for tablets, 3% more than for choice of smartphone.
However cost is a less important factor when choosing a new tablet, driving 12% of the decision, 6% less than for choice of smartphone.
Figure 74: Relative importance of macro decision-making criteria when choosing the next tablet device/operating system
Source: QH1a Base: All Tablet Switchers/Considerers n=645
A more detailed analysis of the individual elements that tablet Switchers and Considerers claim would drive their choice of device/operating system, shows that reliability, battery life and ease of use are the most important elements of device/functionality. Having the most up-to-date technology and storage are also above average in importance. However look and feel ranks lower in the list of criteria in relation to tablet choice than it does in relation to smartphone choice.
The availability of the preferred operating system, the preferred brand, and the range of games/apps are also important drivers in this market, indicated by their ranking in the list of important criteria (7th, 10th and 9th respectively).
No individual aspect of interoperability stands out as a key driver of tablet choice.
Figure 75: Relative importance of individual decision-making criteria when choosing the next tablet device/operating system
38.8
16.9
15
12.1
12
3.12.4
Device/functionality
Interoperability
Operating System
Cost
Brand
WOM
Network /connectionreliability
236
207
189
161
142
136
125
121
114
101
Reliability of the device
Good battery life
Ease of use
Initial costs
The most up to date technology
On-going costs
Has the operating system I want
Amount of storage
Range of Apps/games available
The brand of handset/tablet
98
91
89
71
67
63
62
58
54
54
51
44
35
31
Compatible with other devices I own
Easy to integrate
Transfer content between devices
Same OS as other devices I own
Previous exp. devices same brand
Easy to back-up data
Looks good/stylish
Customer service from device…
Available on the network I prefer
Inter-operable
Same brand as other devices I own
Same OS as previous tablet
Recommended by expert
Recommended by family/friends
Above average Below averageMax diff score*
9.5
8.3
7.6
6.6
5.8
5.5
5.2
5.0
4.7
4.2
Max diff score*
4.1
3.8
3.8
3.1
2.9
2.8
2.6
2.6
2.4
2.4
2.3
2.0
1.6
1.5
Customer Retention and Interoperability Research
Prepared for: Ofcom 88
Source: QH1a Base: All Tablet Switchers/Considerers n=645 Bars show relative importance of the different elements that make up the various purchase decisions. Max diff scores sum to 100

Customer Retention and Interoperability Research
Prepared for: Ofcom 89
7 Devices: Interoperability and Content Sharing
7.1 Introduction The research focused on respondents who had switched or considered switching services within one of the areas of pay-monthly Mobile, Dual Play, Triple Play or standalone Pay TV. Questions about devices were also only asked to these participants. Therefore all data reported here is among the qualifying sample of Switchers and Considerers, and reflects usage and attitude among this group of active participants, rather than that of the wider general UK population.
This section provides an overview of usage and attitude towards different types of content, brand ‘ecosystems’ and the sharing/transferring of the different types of content between devices.
7.2 Usage and attitude: types of content
Tablet and smartphone users claim they store a mixture of temporary and permanent content on their devices.
iOS users are more likely to regard their content as permanent than Android users, regardless of which device they are using:
36% of iOS tablet users describe their content as primarily permanent, 10 percentage points more than Android tablet users
40% of iOS smartphone users describe their content as primarily permanent, 8 percentage points more than Android smartphone users.
Figure 76: Status of stored content as either permanent or temporary
Source: QF12/F25 Base: All with iOS tablet n=411; all with Android tablet n=224; all with iOS smartphone n=476; all with Android smartphone n=841
Android%
2 27 1218
29
37
30
2721
9 5Almost all permanent
Mainly permanent
About half/half
Mainly temporary
Almost all temporary
Don't know
%iOS Android
1 35 917
21
3735
3127
9 5Almost all permanent
Mainly permanent
About half/half
Mainly temporary
Almost all temporary
Don't know
iOS
Tablet Smartphone

Customer Retention and Interoperability Research
Prepared for: Ofcom 90
7.3 Usage and attitude: sharing/transferring content between devices Two in five (41%) Switchers and Considerers with more than one device ever share or transfer content between these devices – and this does not differ significantly by type of device.
Tablet users who share/transfer content between devices are most likely to do so with their smartphone (72%).
Smartphone users who share content are most likely to share/transfer content with their laptop/PC (82%) and vice versa (72%).
Laptops/PCs are also the most likely recipient of content among those transferring data from e-readers (81%) and MP3 players.
Figure 77: Incidence of content sharing between devices (amongst those who do)
Source: QF33/34. Base: All who share content between devices n=933 NOTE: Low base of those with hand-held games consoles that share content between devices n=40 Boxes shaded in green represent scores of 70% or higher.
Photos and music are more frequently shared than any other form of content among those who claim to share content.
Smartphone users who share content do so more frequently than those sharing content on other devices, with more than one in two moving music and photos, one in three moving apps and one in five moving books/publications.
Tablet users who share content tend to focus on one type of content, which is equally likely to be photos, music, apps or books/publications.
Games Console Tablet PVR/DVR Smart
Phones
Hand-held
games console
E-readers Smart TV MP3
Laptopor
Desktop
(148) (305) (66) (677) (46) (118) (65) (309) (744)
Games Console 19% 42% 12% 70% 20% 55% 13% 10%
Tablet 41% 37% 32% 59% 45% 38% 28% 25%
PVR/DVR 20% 8% 5% 39% 12% 34% 5% 5%
Smartphones 59% 72% 53% 67% 60% 69% 62% 72%
Hand held console 22% 8% 26% 4% 14% 23% 5% 2%
E-readers 17% 18% 23% 11% 40% 27% 17% 13%
Smart TV 24% 8% 32% 6% 33% 14% 7% 5%
MP3 29% 29% 25% 29% 38% 44% 35% 36%
Laptop or Desktop 52% 61% 58% 81% 36% 81% 60% 87%

Customer Retention and Interoperability Research
Prepared for: Ofcom 91
Figure 78: Type of content shared between devices (amongst those who do)
Source: QF33/34/35 Base: All who share content between devices n=933 Boxes shaded in green represent scores that are significantly higher than those shaded in grey.
Not only is USB the primary means for backing-up content, it is also the primary means for sharing/transferring content between devices, with 69% of those who share content across their devices using this approach. Wi-Fi is the second most popular method, used by almost one in two (47%). This rises to a majority (61%) of those with an Apple ecosystem who share content across devices (three or more devices with Apple).
Cloud storage is less prevalent overall (11%) but is almost three times as likely to be utilized among those with an Apple ecosystem who share content across devices, where usage rises to 30%.
At least one in four of those with multiple devices are not able to comment on how easy they think it is to transfer content, indicating either lack of experience and/or lack of knowledge. A minority (no more than one in seven) of those who share content between devices believe content sharing is difficult. Problems are most likely to be anticipated when sharing content between devices with different operating systems, where more than one in ten (14%) perceive that the process is difficult.
Games Console Tablet PVR/
DVRSmart
Phones
Hand-held
games console
E-readers
Smart TV MP3
Laptopor
Desktop
DON’T SHARE
ONDEVICES
DON’T HAVE
ON DEVICES
Apps 6 22 2 32 2 2 3 5 22 45 11
Programmesfrom Pay TV 6 9 2 8 2 1 2 2 8 39 43
Books / Publications 4 18 2 21 2 11 1 3 22 34 28
Music 9 22 3 51 2 3 3 30 59 15 8
Programmes from OTT 7 9 2 9 3 1 3 2 11 35 43
Photos 8 25 2 62 2 4 4 9 62 16 5

Customer Retention and Interoperability Research
Prepared for: Ofcom 92
Figure 79: Content sharing methods and experiences
Source: QF36/37/38 Base: F37/37 All who have more than one device and share content n=933. F38: All using 2 or more devices n=2235
The qualitative research identified some concerns about losing content when switching and upgrading mobile phones, particularly when changing network or operating system. There were felt to be two types of content:
Permanent content (e.g. contact numbers and photos): Amongst people that have actually switched content between mobile phone devices, it is generally considered to be easy to do. Amongst people that have not actually personally transferred the content, there is a widespread awareness that mobile phone providers will offer assistance for those lacking the technical competency to personally undertake this content transfer.
Temporary content (e.g. texts, free Apps): Even amongst the more technologically confident and competent individuals there was an acceptance that some of this type of content can be lost when changing handset device.
This is borne out in the quantitative research and looking at the actual experience of those who have changed smartphone and who attempted to share/transfer content is instructive in this regard.
Smartphone sharers
The majority of those who changed smartphone handset (74%) claim they were keen to keep at least some type of stored content when they changed handsets. Photos and music are the most highly valued items/the ones they most wanted to keep.
However some smartphone Switchers did not end up keeping the content they initially wanted to. For example, more than one in two expressed a desire to keep their photos (57%) but fewer actually kept them (39%). Similarly, while two in five (40%) wished to keep their music, just over half of these (24%) managed to keep it.
Content sharing methods used (all)
5
11
20
22
47
69
Cloud (other)
Cloud (devicemanufacturer)
Over Internet
Bluetooth
Wi-fi
USB cable
% use
39
29
27
14
6
2
31
41
23
16
24
48
Different OS
Different manufacturers
Same manufacturer
Don't know Difficult (1-3) Rating 4-7 Easy (8-10)
Ease of transferring content%

Customer Retention and Interoperability Research
Prepared for: Ofcom 93
Figure 80: Content wished to keep versus actually kept
Source: QH4a-d Base: All Mobile who switched mobile handset (who previously had a Smartphone) n=423; with any stored content n=407
Of the 78% of smartphone Switchers who managed to transfer content, at least four in five claim they found it at least ‘fairly’ easy to do, and around one in two found it ‘very’ easy. Transferring home produced videos is more likely to be reported as difficult than transferring other types of content: 18% found it very/fairly difficult to move this content between devices compared to 13% of those transferring either photos or music. However, of the 22% who did not transfer any content, but wanted to, at least three in five said it was difficult or impossible to do so (63% for photos, 59% for music).
Figure 81: Ease of sharing/transferring content and difficulties encountered
Source: QH4d-H5 Base: All Mobile who switched mobile handset (who previously had a Smartphone) n=423; with stored content n=407; who transferred content n=(varies by type); who did not transfer certain content n=(varies by type)
886765
576264
2121
15
320
122222
5116
4
9077
737070
6728
2619
PhotosGames
RingtonesMusicApps
Self taken videosBooks etc
TV/films/videosOther content
Free
Paid
Total
%
Stored on previous handset (Smartphone)
3924
17988
54
22
PhotosMusic
Self taken videosRingtones
AppsGames
Books etcTV/films/videos
NONE OF THESE
%
Actually kept when switched(amongst all who store)
5740
25222019
86
26
PhotosMusic
Self taken videosRingtones
AppsGames
Books etcTV/films/videos
NONE OF THESE
Wanted to keep when switched(amongst all who store)
%
3 2 510 11 13
40 41 27
46 4555
Photos (n=163) Music (n=103) Own Videos (n=70)
Veryeasy
Fairlyeasy
Fairlydifficult
Verydifficult
Ease of transferring kept content Why did not transfer certain desired content
3425 29
2934
40
30 3325
9 10 6
Photos (n=71) Music (n=61) Ringtones (n=52)
Ran outof time
Changedmind
Notpossible
Toodifficult

Customer Retention and Interoperability Research
Prepared for: Ofcom 94
Pay TV sharers
The experiences of Pay TV users are also instructive in this regard.
On average, around one in two Pay TV users confirm that their stored set-top content is important to them (slightly more than one in two Pay TV only users and slightly less than one in two Triple Play users).
Figure 82: Importance of stored set-top content
Source: QE29. Base: All triple play switchers/considerers n=451/124; all Pay TV only switchers/considerers n=179/148
Considerable uncertainty exists for these active participants in relation to the transfer of stored recordings.
Around one in ten claim that they do think transferring content is feasible and that they know how to do it. However the majority are unable to confirm this:
At least a fifth of Pay TV users were unable to confirm whether or not they thought transfer was even possible, and this knowledge gap exists regardless of whether or not they have switched their Pay TV provider.
More than one in ten Switchers believe it is possible but don’t know how to do it.
As with smartphone users, the majority of Pay TV Switchers (78%) claim they were keen to keep at least some type of stored content when they changed service. Individual TV programmes and films are the most highly valued items/the content they most wanted to keep.
However not all Pay TV Switchers end up keeping the content they initially wanted to. While two in five (43%) wished to keep individual TV programmes, around a third (16%) ended up keeping it. A similar proportion (40%) wanted to keep their films but around half (20%) actually did so.
1 6 3 533 3 4
1722
17 8
3125
2626
35 22 3939
1322
12 18
Triple PlaySwitchers
Triple PlayConsiderers
Pay TV onlySwitchers
Pay TV onlyConsiderers
Very important
Fairly important
Not very important
Not at all important
Don't know
No set-top box
%Triple Play Standalone Pay TV

Customer Retention and Interoperability Research
Prepared for: Ofcom 95
Figure 83: Content wished to keep versus actually kept
Source: QE3-E6 Base: QE3 All Pay TV Switchers with recordable box n=477; QE5/6 with stored content n=365
While the vast majority of those who managed to transfer content found the process easy, initial indications* among those who failed to transfer their content are that most found it too difficult or impossible to do.
Figure 84: Ease of sharing/transferring content and difficulties encountered
Source: QE7/8 Base: QE7 All Pay TV switchers who transferred content from set-top box to new communications provider n=138. QE8 All Pay TV switchers who wanted to transfer content but did NOT: films/full TV/individual TV n=83*/58*/108
*Note: Low base size, treat as indicative only
55
45
33
24
63
50
35
16
44
44
32
30
Individual TVprogrammes
Films
A full TV series
None
All Pay TVswitchers
Switch fromSky
Switch fromVirgin
Stored on (previous) set-top box
16
20
21
63
Individual TVprogrammes
Films
A full TV series
None
%
Actually kept when switched(amongst all who stored content)
43
40
33
22
Individual TVprogrammes
Films
A full TV series
None
Wanted to keep when switched(amongst all who stored content)
%
%
11
22
47
16
ALL Pay TV Switchers
Veryeasy
Fairlyeasy
Fairlydifficult
Verydifficult
Ease of transferring kept content Why did not transfer certain desired content
52 4860
2623
18
1822
16
6 15 6
Films Full TV series Individual TV
Ran outof time
Wasn'timportant
Toodifficult
Notpossible

Customer Retention and Interoperability Research
Prepared for: Ofcom 96
Appendices
A. Qualitative guide
Example of Group discussion guide (1 of 6)
Considerers - Triple Play
Moderator Note – This is a guide (not a script) and the research objectives should NOT be shared with respondents
Understand the extent to which changes in the communications sector are impacting on consumers propensity to switch services/service provider and devices/operating system
Understand consumer behaviour when choosing/making decisions about services and devices
Explore the content consumption cycle
Explore interoperability issues and the ease of transferring content between devices
Understand the relative importance of different barriers to switching and compare them to ‘expected vs. ‘actual’ difficulty
Introduction & Background
We are conducting some research about changes in the communications sector and the propensity to switch services and devices. We will explore issues surrounding people’s ability to switch content/devices
Explain confidentiality / MRS code-of-conduct, reassure on confidentiality and explain that they will remain anonymous and don’t have to give their identity, explain taping/viewing etc, no right/ wrong answers

Customer Retention and Interoperability Research
Prepared for: Ofcom 97
Technology and communications profile (25 mins)
Introduction (name, age, family status, job, hobbies)
Ask respondents to map out on a sheet of paper the device or service they have been recruited for (e.g. mobile, triple play (use the brand e.g. Sky, Virgin, BT), pay TV). Moderator to draw example first as appropriate.
— Ask to list out content and services a) stored and b) accessed on this device
— Ask to think about and map / list others devices or services they access or connect to this device even if it is only occasionally NOTE: This may be to download, share content or link to one another (e.g. Games Console, Laptop etc)
List out the content/services they then are able to access (e.g. Love Film)
Ask respondents to present back their maps
— Which content or services are most important to you?
— What do you use most often?
— Is there anything else connected with this device or purchased from the same provider as part of a bundle?
Which of these services drove your decision to use x provider for all of these. What are the benefits to having all these with the same provider?
— Which is the most important service in your bundle? How important is this particular device/service to you in your home? Why? What role does it play?
— If it was no longer there what would you miss the most about the device / service? How, if at all would you access this same content or services instead?
— How easy is it to get other devices to work with this service/device?
What, if any, problems do you experience? How easy is it to connect devices and share content?
— Are there any devices or services you would like to be able to work with your Pay TV/ that you are not able to at present or don’t bother with because it is too much of a hassle? Why is this?
Is there one key device or service that dictates the choice of some or all of your other devices or services? If necessary moderator to explain (e.g. Having Sky TV means that you also have their broadband or wanting to have the same brand of phone and laptop / tablet)
— Which is your primary device? Why is it your primary device?
Moderator to look out for mentions of services that constitute ecosystems
MODERATOR TO CONTINUE TO FOCUS THE DISCUSSION ON TRIPLE PLAY
— When did you first get your landline, broadband and Pay TV all with the same provider?
Who was that with?
— Who were you with before your current provider?
Did you have separate providers for your landline, broadband and Pay TV?
How easy was it to manage different providers? Why did you decide to bundle them together?
Customer Retention and Interoperability Research
Prepared for: Ofcom 98
— Which service of the three services do you consider to be the most important? Why? Which service drove your decision to use your current provider?
— Thinking about your pay TV - Why did you decide to get Pay TV initially?
— What prompted you to select the particular package of your provider (e.g. HDTV, Sky plus, etc)?
Did you buy the service/ device because you wanted certain content (e.g. Sky Sports / Sky Movies) or did you buy the service/ device because you wanted it – and the content came later?
— How much customisation/personalisation have you done of your current Pay TV service e.g. series record, favourites, menu preferences
How long did this take you?
How important is this to you?
— Which functions or elements of your TV package are important to you i.e. what do you watch/use the most or would you miss if they were not there?
— What other devices do you use to access your Pay TV services?
— How else do you access the type of content you can see on your TV?
Laptop, games console, mobile phones
How, if at all, does this connect up with your TV?
How does this fit with your Pay TV viewing?
— Do you subscribe to any additional services e.g. Love Film, Net Flix
How do you watch these? Through which devices e.g. games console/ipad….
Switching Providers (10 mins) — Have any of you considered switching your bundle of services (landline, broadband and Pay
TV)
— What were the initial triggers to considering switching?
Which service drove your initial decision to consider switching? Was there something additional you wanted from this/these services – or had something gone wrong? ?
LISTEN OUT FOR BUT DO NOT PROBE: Inability to access content from devices you already own?
— What research, if any, did you do about the service/device that you were considering?
What sort of a package deal were you looking for ? Were you looking to use different providers for each of these services or move them both/all to another provider as a bundle?
Did you find any information to help you make a decision? If so, what was this, What impact did this information have on you?What was the main reason you decided not to

Customer Retention and Interoperability Research
Prepared for: Ofcom 99
switch? (trying to establish whether the decision not to switch was driven by issues with a particular service, wanting a better deal)
Did you consider only switching one of these services instead? Why, why not?
— How easy was it to know when your existing contract came to an end? Did you receive any notifications?
Why did you decide not to switch?
How happy are you with your decision not to switch? Why?
— How is the switching process impacting by having multiple services with one provider?
To what extent does this make the switching process easier or more difficult?
Does the choice of your Pay TV provider determine which other landline and broadband providers you select?
— How important is it to you not to switch your Pay TV?
Barriers to switching (30 mins)
Moderator should ensure that the group focus on core service and ask them to refer to their homework exercise and ask what barriers (real or perceived) prevent people from switching their services and devices. Explain that we want them to think back to before they switched / considered switching and talk about what they imagined would be issues, rather than just talking about the reality of what were issues. Moderator to flip chart the responses and note overlap with the prompted barriers that will be introduced subsequently.
— What barriers exist / do you think exist when switching? Is there anything else that puts you off?
— Which of these barriers do you feel are the strongest? Why?
— Which are less strong barriers? Why?
Moderator to split into sub-groups and introduce barrier cards (with one line definition)
— Ask respondents to place the barriers into piles to indicate the significance of the barrier (e.g. significant / minor / non-issue)
Which barriers do you think are the strongest and prevent switching? Why?
— Barrier specific probes
Contractual barrier?
• What contract issues do you experience?
♦ Impact of long contracts/High exit charges?
♦ Difficulties getting different contracts aligned?
• With which providers have you experienced contractual barriers? Why?

Customer Retention and Interoperability Research
Prepared for: Ofcom 100
Multiple service barriers - What are the particularly issues switching when you have multiple services?
• Impact of losing the convenience of having everything in one place (e.g. one bill, one payment)
Process barriers - What process issues have you personally experienced?
• Not knowing what process need to follow/what to do
• Inconvenience of switching providers and services
• Fear of losing a service for period of time or ‘double paying’ to ensure this doesn’t happen
Time barrier - Is time a genuine problem Vs something that you just haven’t made time for? Which part of the switching/considering phase takes up most time? How much time is acceptable?
• Why it something that you just haven’t made time for?
• Impact of not having enough notice or advanced warning before deals elapse?
Transferring content barriers
• Moderator to ask respondents to write down before discussing
♦ Can you transfer content? Eg recorded programmes How do you do it?
• Do you think this content is yours to do what you want with? What is your understanding about the ownership and portability of stored content / data?
• What type of content would you lose?
• How would you feel about that?
• What, if anything, would be a barrier to you switching? i.e. what would be important to you not to lose?
• How else you would you be able to access this content if you lost it?
• How much influence did this have on your decision?
• ASK AT END OF THESE PROMPTS ONCE ISSUES HAVE BEEN UNCOVERED: Have you ever tried to back up or copy the content on your set top box? How did you find this?
Informational barrier - What information do you specifically want more about?
• Not knowing whether/how much you might need to pay to leave your provider
• Unclear about your rights on ending / terminating contracts
• Lack of understanding of the process for changing provider

Customer Retention and Interoperability Research
Prepared for: Ofcom 101
• Unable to compare providers and their different offers on a like-for-like basis
Behavioural barrier. What in particular would you be reluctant to change?
• Reluctance to move from ‘personalised’ service (i.e. where you have done lots of work to customised the service to your favourites / preferences)
• Reluctance to learn how to use a new device/service
Additional extra barriers - What are the ‘added-value’ proposition features that you are reluctant to lose?
• Are there any ‘value-add’ communication services you would be sorry to lose (e.g. access to content on multiple devices, security services, cloud storage)
• Are there any other ‘value-add’ additional services (e.g. cinema/ music tickets, ‘loyalty’ points, Nectar points, etc) you would be reluctant to lose
• Loss of network benefits when friends/ family use the same service (e.g. friends and family discounts when using the same telephone provider)
•
Brand preference – Why is it that you like your current brand?
• What drives your preference – what it says about you vs. more practical barriers?
• Preference for having devices with the same provider to make data transfer and compatibility much easier
• Liking the look, feel and functionality of a particular brand
Easier to keep things the same – What is it that makes it easier?
• What in particular is driving this/behind it being easier? Is it really a combination of some of the other barriers? In that case which ones?
• What would you be afraid of losing if you switched?
• IF SAY DON’T WANT TO LEARN NEW THINGS: What in particular would be difficult to re-learn?
Safety in numbers – With which services and devices is it particularly important to go with the ‘tried and tested’?
• What influence does friends and family having the same devices have? Help and support vs. know it must be quite good?
Insufficient savings - At what point do savings become worthwhile? When would the level of savings mean the barriers are worth addressing?

Customer Retention and Interoperability Research
Prepared for: Ofcom 102
Fear of the unknown – What are your fears / worries about choosing a new device?
Things not working together – What devices / services are you worried about not connecting together? How much of an issue is this?
• Services (phone, TV, etc)
• Devices (games consuls, tablets, DVD / Blue ray, etc)
— Taking into account everything you have identified as barriers, what ultimately stopped / prevented you from switching your service?
What was the single biggest barrier?
What was the consideration process that you went through?
What help / guidance / support did you receive from the provider?
Retention of Customers (10 mins) — What efforts did your current provider make to keep you as a customer?
How much effort did your existing provider put into trying to retain you as a customer?
Who instigated the discussions – you (i.e. to negotiate with them to get a better deal) or them?
How did you feel about their efforts/them persuading you to try and stay? (NB. TRYING TO ESTABLISH WEHTHER FELT AGGRESSIVE OR WHETHER IT WAS WELCOMED)
What new / additional things or discounts did they offer you?
— What could have been done to help / encourage you to switch providers?
— Did you need to sign a new contract in order to take up this new deal?
Interoperability issues (10 mins) How easy do you find it to transfer content and data between different devices?
— What data/content do you have on
Smartphones
Computers
Tablets
TV
— How do you typically do this? Do you use cables Vs Internet hosted services e.g. Cloud computing that allows you to share files and applications over the Internet?
— Is this something that you expect to be able to do? Is it important to you?
— Is this something that you have experienced problems doing for a while or is it a new issue?

Customer Retention and Interoperability Research
Prepared for: Ofcom 103
Is the issue lack of instructions or does it simply not work very well?
Is transferring data and content more important on some devices than others? (E.g. is it more important on ‘mobile’ devices, such as phone and tablets than ‘fixed’ items, such as Sky)
— Which devices are easy to transfer data between?
Why? What makes this easy?
— Which devices are difficult? What frustrations do you have? How could providers help?
Would frustrations on transferring content and data prompt you to leave a provider?
Conversely does it make it more difficult to leave a provider? Who? Which provider?
— Are there some services / devices where you don’t expect to be able to transfer contents (e.g. Apps / TV)?
What impact does this have on your behaviour? How do you feel about this?
Would you say that you have acquired devices in a planned manner or in a more random way?
— E.g. have you planned to get predominantly Apple / Nokia / Sky devices to make compatibility easier or have you just bought things as and when you need them
— If more planned - what has prompted your behaviour?
— If you had the chance to go back in time would you change anything about your purchases and the range of different devices that you own?
Wrap up (5 mins)
Remind them of their top 2-3barriers and ask what could be done to reenive/ reduce those
What are the biggest barriers that you perceive / have experienced when changing supplier?
What can be done to help people switch more easily?
Is there anything else you would like to add?
THANK AND CLOSE

Customer Retention and Interoperability Research
Prepared for: Ofcom 104
B. Questionnaire
OFCOM CUSTOMER RETENTION & INTEROPERABILITY RESEARCH REVISED QUESTIONNAIRE 14th November, 2012 NOTE TO SCRIPTER: Do not show question numbers on html questionnaire Do not show section headings Include back and next buttons on each page Ask all screening questions before closing those that don’t qualify Include percentage completion display ONLINE INVITATION Panel communications provider will send invitation to their panellists. Within the invitation is an indication of the subject matter – i.e. study relating to communications technology they have at home. INTRODUCTION This study is being conducting by Ofcom, the regulator for the UK communications industry. Ofcom is very interested in hearing your views on a variety of things including mobile phones, home phones, broadband and TV. The interview will last up to 25 minutes depending on your answers. INITIAL SCREENING First of all, we’d like to ask you a few questions about yourself, just to make sure we are surveying a good cross section of the population. ASK ALL QA1 For which, if any, of the following services are you solely or jointly responsible for
deciding which communications provider to use? MULTI CODE Personal mobile phone 1 Fixed home telephone line 2 Fixed home broadband 3
Pay TV service (via a cable, satellite or a broadband connection) 4 None of the above 5 CLOSE
QA2 Are you… SINGLE CODE Male 1 Female 2 QA3 What is your age? WRITE IN AND CODE EXACT AGE

Customer Retention and Interoperability Research
Prepared for: Ofcom 105
QA4 Which of the following best describes your employment status? SINGLE CODE Employed full time 1 Employed part time 2 Self-employed 3 Housewife/husband 4 Retired 5 Student (i.e. school, university etc.) 6 Apprentice/trainee 7 Unemployed 8 ASK QA5 IF CODES 1-3 AT QA4 QA5 Which of the following best describes the occupation status of your household’s chief
income earner? SINGLE CODE Higher managerial/professional/administrative
(e.g. Chief exec, senior civil servant, surgeon) 1 Intermediate managerial/professional/ administrative
(e.g. middle management, bank manager, teacher) 2 Supervisory/clerical/junior managerial/professional /administrative
(e.g. shop floor supervisor, bank clerk, sales person) 3 Skilled manual worker (e.g. electrician, carpenter) 4 Semi-skilled and unskilled manual worker (e.g. assembly line worker, refuse collector, messenger) 5 Casual labourer, pensioner, student, unemployed
(e.g. pensioner without private pensions, anyone living on basic benefits) 6 SOCIAL CLASS (FOR QUOTAS) AB - QA4=1 or 2 or 3 and QA5=1 or 2 C1 - QA4 1 or 2 or 3 and QA5=3 / QA4=6 C2 - QA4 1 or 2 or 3 and QA5=4 DE - QA4 1 or 2 or 3 and QA5= 5 or 6 / QA4 = 4 or 5 or 7 or 8 QA6 Whereabouts in the UK do you live? SINGLE CODE
North East England 1 North West England 2 Yorkshire and the Humber 3 East Midlands 4 West Midlands 5 East England 6 London 7 South East England 8 South West England 9 Wales 10 Scotland 11 Northern Ireland 12 Don’t know 13 Refused 14
SCRIPTER: CHECK QUOTAS FOR GENDER, AGE, SEG AND REGION BEFORE CONTINUING

Customer Retention and Interoperability Research
Prepared for: Ofcom 106
A7 Before we ask you about the TV, phone and broadband services you use please look at the different statements people have made about technology services such as mobile phones, landline phones, broadband or TV services. For each statement please indicate how much you agree or disagree…
Agree strongly Agree slightly Neither agree nor disagree Disagree slightly Disagree strongly
o I try to keep up with technology o My friends tend to come to me if they have questions about technology o I’m as knowledgeable about these technologies as the next person
ADDITIONAL SCREENING – SERVICES SWITCHED OR CONSIDERED SWITCHING ASK ALL QB1 Which of the following services do you/your household use? MULTICODE
A mobile phone that you personally use and pay for 1 A landline or fixed line phone service which can be used for making and receiving calls 2 A fixed broadband service through a phone line or cable service into the home (not access through a mobile phone or a ‘dongle’ you may plug into a USB) 3 A Pay TV service via cable TV, satellite TV or a broadband connection which you pay a monthly subscription to (such as from Virgin Media Sky, Talk Talk or BT Vision) 4 None of these (SINGLE CODE) 5
SCRIPTER: CLOSE IF ONLY CODE 2, ONLY CODE 3 OR ONLY CODE 5 ASK IF RESPONDENT USES A MOBILE PHONE SERVICE AT QB1 (CODE 1) – OTHERS SKIP TO QB3 QB2a Which of these best describes the mobile package you personally use most often? SINGLE CODE
Prepay/pay as you go (which requires top-ups) 1 Postpay/monthly contract 2
SCRIPTER: CLOSE IF CODE 1 AT QB2a AND DO NOT USE ANY OF THE OTHER SERVICES AT QB1 SCRIPTER: CLOSE IF THEY CODE PREPAY AND ONLY (CODE 1 AND 2 AT QB1) OR THEY CODE PREPAY AND ONLY (CODE 1 AND 3 AT QB1). QB2b When you signed up for your contract did you get a handset with the contract or did
you only get a SIM card? SINGLE CODE
Handset and contract 1 SIM card only 2 Contract only – (i.e. you kept your old handset) 3 Don’t know 4
IF MORE THAN 1 CODED AT QB1

Customer Retention and Interoperability Research
Prepared for: Ofcom 107
QB3 Do you receive any of these services [INSERT SERVICES USED] as a bundle or package from the SAME supplier?
Yes 1 No 2
SCRIPTER: CLOSE IF CODE 2 and 3 (AND NO OTHER CODES) AT QB1 AND CODE 2 AT QB3 IF YES ASK QB4 QB4 What services do you receive as a bundle or package from the SAME supplier? If you have more than one bundle or package please just tick the services that are in
the package you consider to be the main one FILTER ON QB1. MULTICODE. RESPONDENT TO CODE MINIMUM OF TWO ANSWERS
(EXCLUDING MOBILE BROADBAND INTERNET ACCESS).
Mobile phone 1 Landline or fixed line phone 2 Fixed broadband internet access 3 Pay TV service 4 Mobile broadband internet access (using a dongle or similar) 5
CODING: IF CODES 2, 3, 4 = TRIPLE PLAY, IF CODES 2,3 = DUAL PLAY ASK IF HAVE A PACKAGE QB5 Which communications provider do you use for your package or bundle of services
Please say which company you pay for this service, not the manufacturer’s name. ASK FOR ALL SERVICES NOT IN THE BUNDLE QB6 Which communications provider do you use for [SERVICES AT QB1/2]? Please say which
company you pay for this service, not the manufacturer’s name.
Mobile phone network
Fixed line phone
Fixed broadband
Pay TV service
Alpha Telecom 1 1 1 1 AOL 2 2 2 2 BT (BT Vision) 3 3 3 3 Be 4 4 4 4 Demon Internet 5 5 5 5 Eclipse Internet 6 6 6 6 Equitalk 7 7 7 7 Euphony 8 8 8 8 First Telecom 9 9 9 9 Freeview 10 10 10 10 Freesat 11 11 11 11 Go Talk 12 12 12 12 Greenbee 13 13 13 13 Homecall 14 14 14 14 Kingston Communications 15 15 15 15 Madasafish 16 16 16 16 O2 17 17 17 17 Orange 18 18 18 18

Customer Retention and Interoperability Research
Prepared for: Ofcom 108
Pipex 19 19 19 19 PlusNet 20 20 20 20 Post Office 21 21 21 21 Primus 22 22 22 22 Sky 23 23 23 23 Smallworld Media 24 24 24 24 Swiftcall 25 25 25 25 Talk Talk / Carphone Warehouse
26 26 26 26
Telecom Plus 27 27 27 27 Tesco 28 28 28 28 ‘3’ Mobile 29 29 29 29 Tiscali 30 30 30 30 T-Mobile 31 31 31 31 Top-up TV 32 32 32 32 Toucan 33 33 33 33 24 Talk 34 34 34 34 Virgin Media 35 35 35 35 Vodafone 36 36 36 36 Zen Internet 37 37 37 37 Other supplier – SPECIFY ON NEXT PAGE
38 38 38 38
QB7a Please now think about the different services you have in your home. For each service you use, which of the following best describe the extent to which you’ve CHANGED the company that provides the different services? Please note – this includes changing from one communications provider for your whole service to using two providers, or vice versa (moving from two or three different providers to one communications provider for all your services)
MULTI CODE POSSIBLE
Mobile phone network
Fixed line phone
Fixed line broadband
Pay TV**
Changed or switched communications provider in the last 12 months
1 1 1
Changed or switched communications provider in the last 13-24 months
2 2 2
Changed or switched network communications provider in the last 12 months (not the phone handset but the company you pay for the calls you make)
1
Changed or switched network communications provider in the last 13-24 months (not the phone handset but the company you pay for the calls you make)
2
Actively considered changing communications provider in the last 12 months but decided not to change
6 6 6 6

Customer Retention and Interoperability Research
Prepared for: Ofcom 109
communications provider I am currently considering switching communications provider (i.e. actively looking at alternatives)
7 7 7 7
None of the above 8 8 8 8 **Text on screen to say “Pay TV service via cable TV, satellite TV or a broadband
connection which you pay a monthly subscription to (such as from Virgin Media, Sky, Talk Talk or BT Vision)”
ASK SWITCHERS - IF MORE THAN ONE SERVICE SWITCHTED IN SAME TIME PERIOD (e.g. if 2 services switched in last 12 months then ask – but if one service switched in last 12 months and 2 in 13-24 months then don’t ask) QB7b Which service, or services, did you change most recently? Please select below – if you
most recently changed 2 or more at the same time then tick both Mobile phone 1 Landline or fixed line phone 2 Fixed broadband internet access 3 Pay TV services 4 (MOBILE PH0NE ADDED – BUT FILTERING FOR MOBILE PHONE VS OTHER SERVICES WILL BE BASED ON SAMPLE PRIORITIES RATHER THAN RECENCY)
QB7c Thinking about the services you switched, e.g. [services switched] did you previously receive any of these as part of a bundle or package from the same communications provider?
Yes 1 No 2
IF YES ASK QB7c QB7d Which of the services that you’ve switched were previously part of a bundle or
package? MULTICODE. FILTER ON Q7b
Mobile phone 1 Landline or fixed line phone 2 Fixed broadband internet access 3 Pay TV service 4 Mobile broadband internet access (using a dongle or similar)? 5
IF IN A BUNDLE ASK: QB8a Which communications provider did you use previously for this package or bundle of
services? Please say which company you paid for this service, not the manufacturer’s name.
IF NOT A BUNDLE ASK: ASK FOR ALL SERVICES NOT IN THE BUNDLE THAT WERE SWITCHED AT QB7a BUT NOT CODED AT QB7d QB8b Which communications provider did you use for [SERVICES NOT IN A BUNDLE]? REPEAT GRID FROM QB5

Customer Retention and Interoperability Research
Prepared for: Ofcom 110
USE B4 to B8 TO IDENTIFY TYPE OF SWITCH (single to dual, dual to dual, etc.) ASK IF SWICTHED OR CONSIDERED SWITCHING (CODES 1, 2, 6 AT QB7a): QB9 CONSIDERERS: You mentioned that you actively considered changing communications
provider for your [insert each relevant service] but decided not to. When you were thinking about switching which, if any, of the following did you do?
REPEAT QUESTION FOR EACH SERVICE CONSIDERED SWITCHERS: Which, if any, of the following did you do when choosing your new [insert
each relevant service] supplier? MULTICODE
REPEAT QUESTION FOR EACH SERVICE SWITCHED
Looked at individual communications provider websites
1 Phoned the communications provider to ask questions about products or services
2 Visited communications provider shops
3 Talked to family and friends 4 Read about the products available on review or price comparison sites 5 Made some calculations about the cost of the new service or the cost of changing 6 None of the above 7
MUST CODE AT LEAST 1 OF CODES 1, 2, 3, 5, 6 TO CLASSIFY AS ‘ACTIVELY CONSIDERED’

Customer Retention and Interoperability Research
Prepared for: Ofcom 111
SAMPLE DEFINITIONS: Stage 1: Initial definition to be worked out as follows:
Mobile phone switcher if: Mobile phone network coded 1 or 2 @ QB7a
Mobile phone considerer if: Mobile phone network coded 6 @ QB7a and 1, 2, 3, 5 or 6 coded for mobile phone @ QB9
Dual play switcher if: 2 and 3 coded at QB4 (dual play) and fixed line phone coded 1 or 2 and/or fixed broadband coded 1 or 2 @ QB7a
Dual play considerer if: 2 and 3 coded at QB4 (dual play) and fixed line phone code 6 and/or fixed line broadband code 6 @ QB7a and 1, 2, 3, 5 or 6 coded for fixed line phone and/or broadband @ QB9 AND fixed line phone not coded 1 or 2 @ QB7a and/or fixed line broadband not coded 1 or 2 @ QB7a
Triple play switcher if: 2 and 3 and 4 coded at QB4 (triple play) and fixed line phone coded 1 or 2; and/or fixed broadband coded 1 or 2; and /or Pay TV coded 1 or 2 @ QB7a
Triple play considerer if: 2 and 3 and 4 coded at QB4 (triple play) and fixed line phone code 6; and/or fixed broadband code 6; and /or Pay TV code 6 @ QB7a and 1, 2, 3, 5 or 6 coded for fixed line phone, Pay TV and/or Broadband @ QB9 AND fixed line phone not coded 1 or 2 @ QB7a and/or fixed line broadband not coded 1 or 2 @ QB7a and/or Pay TV not d 1 or 2 @ QB7a
Pay TV switcher if: 4 coded @ QB1, 4 not coded at QB4 (not in a bundle) and Pay TV codes 1 or 2 @ QB7a
Pay TV considerer if: 4 coded @ QB1, 4 not coded at QB4 (not in a bundle) and Pay TV code 6 @ QB7a and 1, 2, 3, 5 or 6 coded for Pay TV @ QB9
Stage 2: Making sure switchers are talking about their most recent switch.
We’ll focus on the services they’ve most recently switched, so will always prioritise the services coded 1 @ QB7a, before the services coded 2 @ QB7a
Stage 3: Sample priorities:
The priority is to then fill up cells with the lowest sample sizes in the first instance. The expected priority numbers are given below (based on likely incidence) - #1 = top priority.
Mobile contract Dual-play bundle
(fixed LL and fixed BB)
Triple-play bundle (fixed LL, fixed
BB, Pay TV)
Pay TV (Standalone urchasers)
Switched last 2 yrs
Considered but stayed
Switched last 2 yrs
Considered but stayed
Switched last 2 yrs
Considered but stayed
Switched last 2 yrs
Considered but stayed
8 5 7 1 6 2 3 4
IF DID NOT CONSIDER OR SWITCH ANY SERVICE THEN ASK QB10 AND THEN CLOSE

Customer Retention and Interoperability Research
Prepared for: Ofcom 112
SCRIPTER: ASK QB10a/b if ‘none of the above’ at QB7a OR ask QB10c if currently considering REPEAT QUESTION FOR EACH SERVICE QB10a Which, if any, of these are reasons why you have not considered switching your [insert
each ‘none of the above’ service from QB7] to another communications provider in the last 2 years?
ROTATE LIST. MULTI CODE POSSIBLE SHOW ITEMS SELECTED AT QB10a (SHOW NEW QUESTION FOR EACH ITEM) QB10b Which one of these is the main reason why you have not considered switching [insert
each ‘none of the above’ service from QB7] to another in the last 2 years?
I'm satisfied with my current supplier and services 1 Just haven’t had time/ haven’t got around to it yet 2 Not sure what steps I need to take to switch to another supplier 3 It’s difficult to compare the services available from different providers 4 It’s too time-consuming to find a better deal 5 It’s too time consuming to go through the process of switching from one
supplier to another 6 Don’t want to have to tell my supplier I want to cancel their service 7 Need to wait until the end of my contract/ until I can switch without paying a penalty 8 I would need to change, return or pay for equipment I have from my
current supplier 9 Concerned about having no service while switching to another supplier 10 Expect my current communications provider to offer me a deal to stay at some
point 11 There’s not enough difference in cost to be worth switching 12 Services are all very similar 13 Inconvenience around the installation process 14 BB specific Concerned about losing my email address/ having problems moving my
email address 15
All Phone specific Concerned about losing my phone number
Don’t want to lose friends and family or other call discounts Mobile phone only Don’t want to lose applications on my phone Don’t want to lose data on my phone (e.g. contacts, diary, texts) Worried about losing other content on my phone (e.g. photos, video, music) TV Specific Don’t want to lose the sports channels offered on my Pay TV service Don’t want to lose the movie channels offered on my Pay TV service Don’t want to lose other channels offered on my Pay TV service Don’t want to lose the programmes/films I’ve got stored on my set-top box Don’t want to learn how to use a new system Other (specify)

Customer Retention and Interoperability Research
Prepared for: Ofcom 113
Don’t know
ASK CURRENT CONSIDERERS (CODE 7 @ QB7a) QB10c What made you first consider switching your [insert relevant services from QB7]? Why
did you first decide to review your arrangements? MULTI CODE
High prices of current communications provider Found out about a better deal/price with another communications provider My contract/deal came to an end I always regularly review what I sign up to to check I have the best deal/product Moved to a new property/area Heard about other technology/services that I am interested in Better compatibility between my different devices/technologies/services Unhappy with customer service Unhappy with product/service Friend/family have alternative product/service so wanted to get friends and family discounts (e.g. mobile network inclusive minutes) Wanted the convenience of getting all services from one supplier Wanted to get access to more content than possible with current/previous service All phone specific Wanted a specific deal or tariff (e.g. all inclusive minutes) Mobile phone specific Wanted a new handset Wanted more minutes/data Broadband specific Wanted faster broadband Wanted bigger download allowance TV specific Wanted HD or 3D Wanted specific sports content Wanted specific movie content Wanted other content (e.g. Sky Atlantic) Wanted a better set-top box Other (WRITE IN)
IF CLOSING: Thank you for completing these questions. That’s everything we wanted to ask you today. We might want to ask you some further questions another time about your use of technology. Would you be willing to be re-contacted for further research on behalf of Ofcom?
Yes 1 No 2
IF YES: Please complete the information below so that we can contact you again: Name:_____________________________________________________ Email:_____________________________________________________ Telephone number:__________________________________________
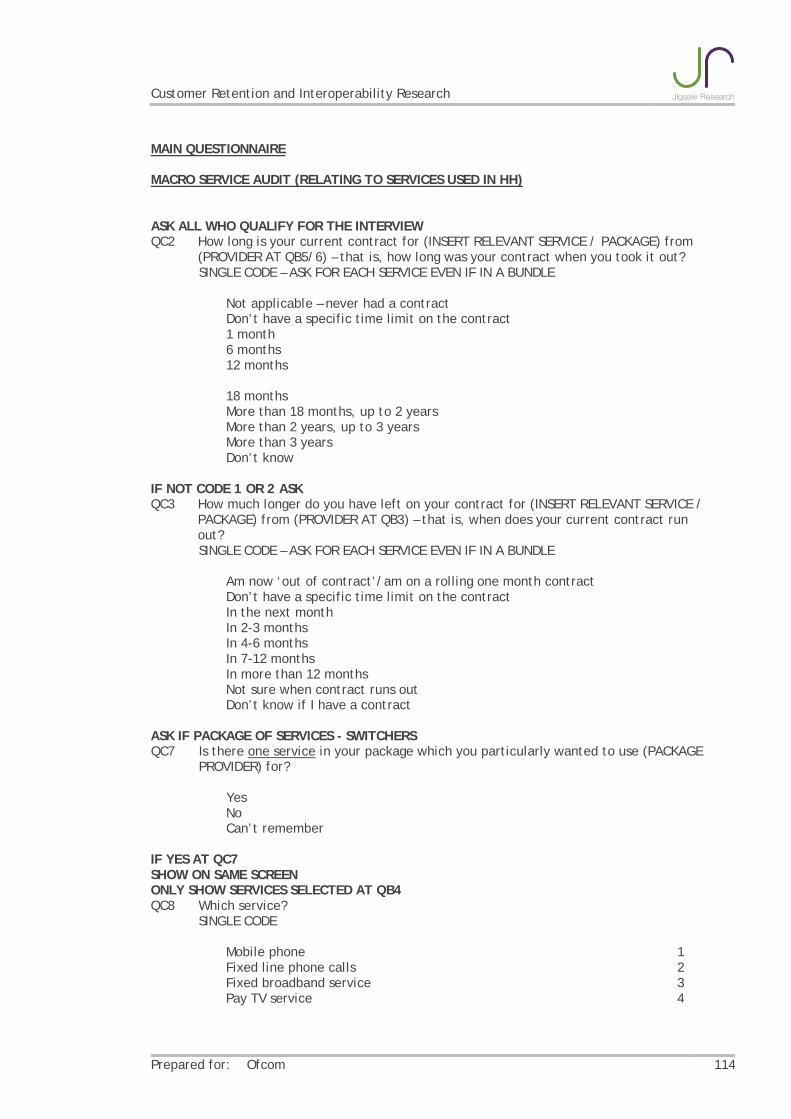
Customer Retention and Interoperability Research
Prepared for: Ofcom 114
MAIN QUESTIONNAIRE MACRO SERVICE AUDIT (RELATING TO SERVICES USED IN HH) ASK ALL WHO QUALIFY FOR THE INTERVIEW QC2 How long is your current contract for (INSERT RELEVANT SERVICE / PACKAGE) from
(PROVIDER AT QB5/6) – that is, how long was your contract when you took it out? SINGLE CODE – ASK FOR EACH SERVICE EVEN IF IN A BUNDLE
Not applicable – never had a contract Don’t have a specific time limit on the contract 1 month 6 months 12 months
18 months More than 18 months, up to 2 years More than 2 years, up to 3 years More than 3 years Don’t know
IF NOT CODE 1 OR 2 ASK QC3 How much longer do you have left on your contract for (INSERT RELEVANT SERVICE /
PACKAGE) from (PROVIDER AT QB3) – that is, when does your current contract run out?
SINGLE CODE – ASK FOR EACH SERVICE EVEN IF IN A BUNDLE
Am now ‘out of contract’/am on a rolling one month contract Don’t have a specific time limit on the contract In the next month In 2-3 months In 4-6 months In 7-12 months In more than 12 months Not sure when contract runs out Don’t know if I have a contract
ASK IF PACKAGE OF SERVICES - SWITCHERS QC7 Is there one service in your package which you particularly wanted to use (PACKAGE
PROVIDER) for?
Yes No Can’t remember
IF YES AT QC7 SHOW ON SAME SCREEN ONLY SHOW SERVICES SELECTED AT QB4 QC8 Which service? SINGLE CODE
Mobile phone 1 Fixed line phone calls 2 Fixed broadband service 3 Pay TV service 4

Customer Retention and Interoperability Research
Prepared for: Ofcom 115
DETAILED SERVICE AUDIT (RELATING TO SPECIFIC SAMPLE CELL) ASK ALL – REPEAT FOR EACH SERVICE WITHIN RELEVANT SAMPLE CELL QC9 Which of the following [Pay TV, fixed landline BB, fixed landline telephone] packages
do you have? / How much do you pay for your Mobile Phone contract per month? MOBILE PHONE (SINGLE CODE) Up to £10 1 £11-£20 2 £21-£30 3 £31-£50 4 £51-£100 5 £101-£200 6 More than £200 7 Don’t know 8 FIXED BB (MULTI CODE) Limited usage 1 Unlimited usage 2 Standard broadband line (i.e. with a maximum speed of up to 30MB) 3 Fibre optic broadband line (i.e. with a maximum speed of 30MB or more – e.g. BT Infinity or similar) 4 Don’t know 5
TELEPHONE (SINGLE CODE) Package with no inclusive minutes 1 Evening and weekend calls included in package 2 Anytime calls – calls at any time included in the package 3 Other call plans 4 Don’t know 5 TV (MULTI CODE) Standard content package 1 Sports package 2 Films package 3 HD-TV 4 Multiroom (paying extra so that you can watch different satellite/cable channels in different rooms) 5 3D 6 Don’t know 7 Other specify 8
ASK ALL – REPEAT FOR EACH SERVICE WITHIN RELEVANT SAMPLE CELL

Customer Retention and Interoperability Research
Prepared for: Ofcom 116
ASK MOBILE PHONE ONLY QC10 Thinking about your main mobile phone, would you say it was a smartphone or a not a
smartphone?
Not a Smartphone 1 A smartphone 2 (e.g. a high-end mobile phone which has functions like email, internet browsing, Apps, and so on e.g. iPhone, Samsung Galaxy/SIII, BlackBerry)
ASK ALL TRIPLE/STANDALONE PAY TV QC12 Which, if any, of the following do you regularly do or use on your main Pay TV
service? Pay TV: Pay per view programmes/films 1 TV content online (e.g. Sky Go) 2 Watch your Pay TV provider’s on-demand service (e.g. Sky Anytime) 3 Watched other ‘catch-up’ TV such as 4 OD, iPlayer, ITVPlayer etc. 4 Remote recording (i.e. being able to set programmes to record using a smartphone while away from home) 4 Automatic identification of shows you may like (e.g., TIVO) 5 Recording programmes 6 Recording more than one programme at a time 7 Watching in more than one room 8 iPlayer 9 Other specify 10 None of these 11
ASK ALL TRIPLE PLAY/STANDALONE PAY TV QC13 Thinking now about how you may have personalised your service, that is, set it up so
that it was personal to you, which, if any, of the following have you done on your Pay TV service?
TV: Set up series link Set up favourites Stored programmes that you’ve recorded Other – PLEASE SPECIFY None of these
ASK ALL DUAL/TRIPLE PLAY QC14a Which of the following services or features do you use in regard to your broadband
service?
The email address from the communications provider (e.g. [email protected] or [email protected], etc.)1 Security/anti-virus software from your broadband communications provider) 2 Cloud storage - from the broadband communications provider 3 Parental controls 4 Wi-Fi services outside of the home 5 None of these 6

Customer Retention and Interoperability Research
Prepared for: Ofcom 117
ASK ALL
QC15c Do you ever use any of the following services to watch films/TV programmes? MULTICODE
LOVEFiLM INSTANT (where you watch films streamed over the internet, rather than DVDs) 1 Netflix 2 iTunes 3 Blinkbox 4 Now TV 5 Other (specify) 6 None of the above 7
ASK DUAL PLAY WHO DO NOT HAVE PAY TV FROM ANOTHER PROVIDER QC16a Have you previously used a Pay TV service such as Sky, Virgin Media or BT Vision? If
you have, when did you stop subscribing to the Pay TV service? SINGLECODE
Never had Pay TV 1 Stopped subscribing in last 12 months 2 Stopped subscribing in last 13 months to 2 years 3 Stopped subscribing more than 2 years ago 4 Don’t know 5
ASK ALL We are now going to ask you some questions about when you recently changed the communications provider of your [insert service] service /considered changing the communications provider of your [insert service] service. QC17a What made you first think about switching your / consider switching your [insert
relevant services from QB7a]? Why did you first decide to review your arrangements? MULTI CODE
High prices of current communications provider Found out about a better deal/price with another communications provider My contract/deal came to an end I always regularly review what I sign up to to check I have the best deal/product Moved to a new property/area Heard about other technology/services that I am interested in Better compatibility between my different devices/technologies/services Unhappy with customer service Unhappy with product/service Friend/family have product/service so wanted to get network benefits (e.g. mobile network inclusive minutes) Wanted the convenience of getting all services from one supplier Wanted to get access to more content than possible with current/previous service All phone specific Wanted a specific deal or tariff (e.g. all inclusive minutes) Mobile phone specific Wanted a new handset Wanted more minutes/data Broadband specific

Customer Retention and Interoperability Research
Prepared for: Ofcom 118
Wanted faster broadband Wanted bigger download allowance TV specific Wanted HD or 3D Wanted more/better movie content Wanted more/better sports content Wanted other content or channels (E.g. Sky Atlantic) Wanted a better set-top box Other (specify)
Q17b Thinking back to when you started to think about changing providers of [insert
relevant services from QB7a], at that point how strongly did you want to change? SINGLECODE
Very strongly Fairly strongly Not very strongly Not at all – was just hoping to get a discount/deal from my current
communications provider Don’t know
IMPORTANCE OF DIFFERENT ELEMENTS IN THE PURCHASE DECISION: OPTION 1 – USING MAXIMUM DIFFERENCE SCALING ASK ALL DUAL PLAY AND TRIPLE PLAY QC18a Switchers: In the next exercise, you’ll see a list of items that others have said are
important when changing one or more of their [fixed line phone and fixed line broadband services / fixed line phone, fixed line broadband and Pay TV services] to a new communications provider.
Please take into account your previous experience of changing these services, and anything that may have changed since then in terms of how you use the services or if the services available themselves have changed
You’ll be shown [10-15 screens – SCRIPTER TO ADJUST]. On each, please select the item that you think will be the most important when next switching your communications provider for your [insert relevant services], and the item you think will be least important.
MOBILE AND STANDALONE PAY TV QC18a Switchers: In the next exercise, you’ll see a list of items that others have said are
important when changing their [mobile phone service/Pay TV service] to a new communications provider.
Please take into account your previous experience of changing this service, and anything that may have changed since then in terms of how you use the services or if the services available themselves have changed
You’ll be shown [10-15 screens – SCRIPTER TO ADJUST]. On each, please select the item that you think will be the most important when next switching your

Customer Retention and Interoperability Research
Prepared for: Ofcom 119
communications provider for your [insert relevant services], and the item you think will be least important.
DUAL PLAY AND TRIPLE PLAY
Considerers: In the next exercise, you’ll see a list of items that others have said are important when considering changing one or more of their [fixed line phone and fixed line broadband services / fixed line phone, fixed line broadband and Pay TV services] to a new communications provider.
You’ll be shown 10-15 screens. On each, please select the item that you think is the most important when considering a new communications provider for your [insert relevant services], and the item you think is least important.
MOBILE AND STANDALONE PAY TV
Considerers: In the next exercise, you’ll see a list of items that others have said are important when considering changing their [mobile phone service/Pay TV service] to a new communications provider.
You’ll be shown 10-15 screens. On each, please select the item that you think is the most important when considering a new communications provider for your [insert relevant services], and the item you think is least important.
LIST TO INCLUDE FOR LIST PLEASE NOTE: - WE WOULD LIKE TO KEEP THE LONGEST LIST DOWN TO 25 – 30 ATTRIBUTES) - WHERE POSSIBLE THE ISSUES SHOULD BE FRAMED ‘NEUTRALLY’ – STATING THE ISSUE
RATHER THAN HIGH PERFORMANCE - WE SHOULD INCLUDE ISSUES EVEN IF EVERY PROVIDER OFFERS IT
Mobile
phone network
Dual play Triple play
Pay TV service
Having the services from a brand I like
X X X X
Ease of transferring content (e.g. Apps, stored programmes, etc. ) from old service to new service
X X X
Contract length X X X X Installation costs X X X Cost of handset X Upfront costs – including installation and set-top box
X X X
On-going monthly subscription/costs
X X X X
Introductory offer for new customers
X X X X
Reliability of mobile network/ broadband service
X X X
Previous experience with communications provider
X X X X
Customer service X X X X

Customer Retention and Interoperability Research
Prepared for: Ofcom 120
Easy to integrate with existing devices/other services
X X X X
Recommendation by family or friends / they have the same service
X X X X
Recommendation by independent organisation/expert
X X X X
Latest technology/ functions e.g. newest handsets /recording facilities on set-top boxes, remote recording capabilities
X X X
Offers best viewing experience (HDTV, 3D, etc.)
X X
Cheaper having more than one service from same supplier
X X
Convenience of dealing with one supplier
X X
Availability of specific device of interest e.g. smartphone/set-top box, etc.
X X X
Availability of devices with specific operating system e.g. Android, iOS etc.
X
Additional benefits (e.g. discounted cinema tickets, concert tickets, Nectar points)
X X X X
Amount of data included in monthly subscription/ (BB only) amount of data allowed to download
X X X
Speed of connection (BB only)
X X
Amount of storage available on set-top box (to store films, programmes, series etc.)
X X
Calls packages offered (e.g. Anytime, evening and weekend, etc.)
X X X
Sports package X X Availability of exclusive channels (e.g. Sky Atlantic)
x x
Catch up TV / Anytime TV/ Virgin Media Player
x x
Ability to access TV content online (e.g. Sky Go, Netflix, YouTube, iPlayer etc.)
X X X
Automatic identification of shows you may like (e.g. TIVO)
X X
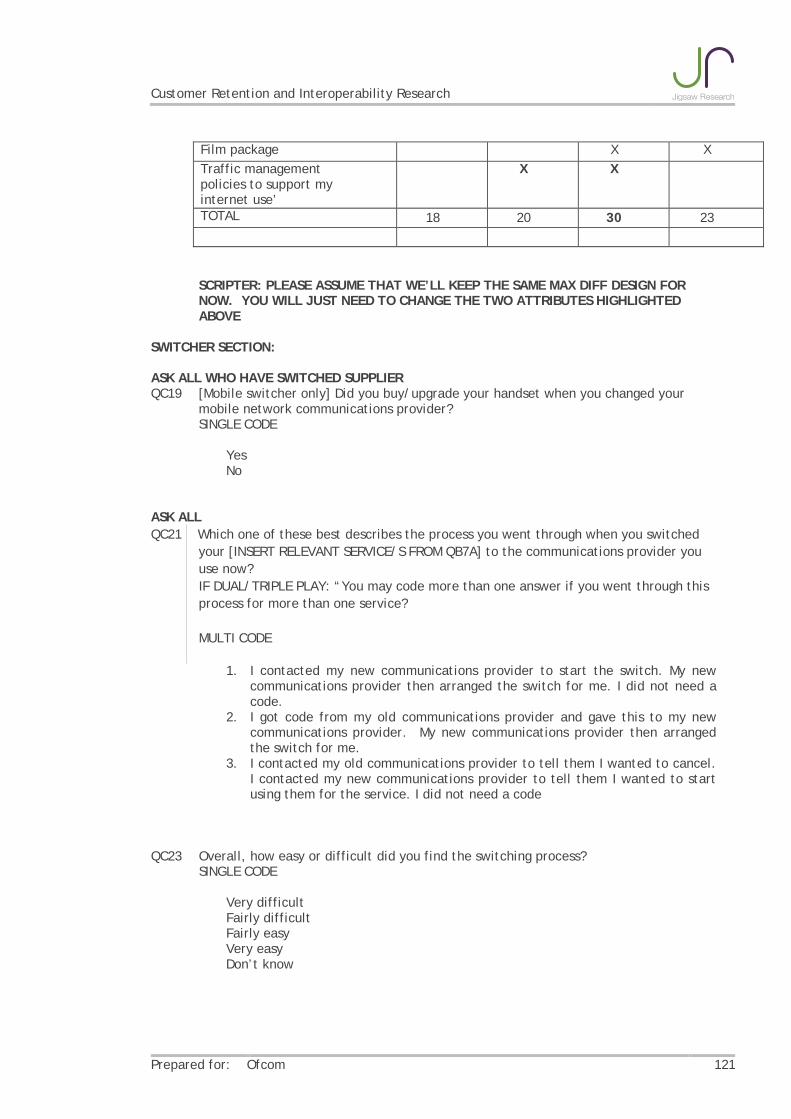
Customer Retention and Interoperability Research
Prepared for: Ofcom 121
Film package X X Traffic management policies to support my internet use’
X X
TOTAL 18 20 30 23
SCRIPTER: PLEASE ASSUME THAT WE’LL KEEP THE SAME MAX DIFF DESIGN FOR NOW. YOU WILL JUST NEED TO CHANGE THE TWO ATTRIBUTES HIGHLIGHTED ABOVE
SWITCHER SECTION: ASK ALL WHO HAVE SWITCHED SUPPLIER QC19 [Mobile switcher only] Did you buy/upgrade your handset when you changed your
mobile network communications provider? SINGLE CODE
Yes No
ASK ALL QC21 Which one of these best describes the process you went through when you switched
your [INSERT RELEVANT SERVICE/S FROM QB7A] to the communications provider you use now?
IF DUAL/TRIPLE PLAY: “You may code more than one answer if you went through this process for more than one service?
MULTI CODE
1. I contacted my new communications provider to start the switch. My new communications provider then arranged the switch for me. I did not need a code.
2. I got code from my old communications provider and gave this to my new communications provider. My new communications provider then arranged the switch for me.
3. I contacted my old communications provider to tell them I wanted to cancel. I contacted my new communications provider to tell them I wanted to start using them for the service. I did not need a code
QC23 Overall, how easy or difficult did you find the switching process? SINGLE CODE
Very difficult Fairly difficult Fairly easy Very easy Don’t know

Customer Retention and Interoperability Research
Prepared for: Ofcom 122
ASK ALL CONSIDERERS QC25 Which, if any, of these did you do when considering switching the communications provider of your [INSERT RELEVANT SERVICE/S] in the last year? Please select all that apply
MULTICODE
Actually made the switch to another communications provider, but then I cancelled the service during the cooling-off period 1 Started the switching process with your current communications provider by telling them I wanted to cancel the service 2 Started the switching process with another communications provider by telling them I wanted to start using their service 3 Contacted my communications provider about possibly cancelling their service 4 Contacted any other communications provider I could use 5 Looked into the process I would need to go through to change communications provider 6 Looked for information about other providers you could use 7 None of these 8
QC26 What, if anything, would have encouraged you to switch your [INSERT RELEVANT
SERVICE/S]?
ASK ALL: AMEND WORDING TO TAKE ACCOUNT OF SWITCHING STATUS: QE1 SWITCHERS: Thinking back to when you switched your [INSERT SERVICES CHANGED
from QB7a] from [PREVIOUS PROVIDER from QB8a or b] please can you look at the list of issues or difficulties you may have faced, and drag & drop them to the appropriate ‘bucket’ to show how much of an issue it was for you personally during the switching process; so was it a major issue, a minor issue or not an issue at all?
CONSIDERED BUT STAYED: Thinking back to when you considered switching your
[INSERT SERVICES CHANGED from QB7a] from [CURRENT PROVIDER from QB5/6] please can you look at the list of things that may have put you off switching, and drag & drop them to the appropriate ‘bucket’ to show the extent to which it affected your decision to stay with your current communications provider; so was the issue a major factor in your decision to stay, a minor factor or did it have no impact…
NOTES:
- THE QUESTION WILL BE SHOWN TO RESPONDENTS AS A DRAG AND DROP. RESPONDENTS WILL ONLY SEE THE ATTRIBUTES APPROPRIATE TO THE PRODUCT/PRODUCT BUNDLE THEY WERE CONSIDERING LEAVING.
- IT IS PRESENTED IN A GRID HERE FOR EASE OF COMPARISON - RANDOMISE RESPONSES - ASK FOLLOW UP QUESTIONS IF SEEN AS MAJOR OR MINOR ISSUES

Customer Retention and Interoperability Research
Prepared for: Ofcom 123
- GROUP BY THEME ONCE REVIEWED/SIGNED OFF (SEE QUAL STIM)
SWITCHER LIST Mobile
phone
network
Dual
play
Triple
play
Pay TV
service
only
NOTES
Comparing what different providers are offering
X x X X ASK QE11
Being clear about the steps I needed to take to switch supplier
X x X X
Finding time to research the market X x X X Being in contract with previous supplier/having to pay a cancellation charge
X x X X ASK QE14
Needing to contact more than one communications provider (old communications provider(s) or new communications provider(s)
X x X X
Having to change email address x X Having to change telephone number X x X Having to return provider’s equipment X X Learning how to use a new service X x X X Transferring programmes stored on my old set-top box to a new service
X X
Losing ‘personalised’ settings, (TV) like favourites, series link, video library, etc. (Mobile) like wallpaper, ringtones, call lists, etc.)
X X X
Losing other ‘add-on’ services, like: Sky Go, Sky Anytime outside of home Wi-Fi services (e.g. Virgin and London underground Wi-Fi, Sky Cloud, BT Openzone, etc.)
X x X X
Other devices/products I own not working with new service
X x X X ASK QE15
Previous communications provider trying to persuade me to stay
X x X X
Previous communications provider made it difficult for me to leave e.g. not providing info I needed
X x X X
Being without the service during the switch
X x X X
paying for both my new and old services at the same time
X x X X
Lack of information about moving content to new service (e.g. TV by content we mean programmes you recorded on your set-top box / Mobile by content we mean contacts, photos, Apps, etc.)
X X X
Losing cost benefits like calls to friends and family, etc.
X x X
Losing data/access services such as Cloud storage, security service, etc.
X x X
Losing ‘extra’ services such as cinema X X X X

Customer Retention and Interoperability Research
Prepared for: Ofcom 124
tickets, Nectar points, etc. Issues regarding installation of the new service
X X X ASK Q22
The costs involved e.g. having to pay the initial connection or other start-up fee, costs of handsets/set top box etc.
X X X X
Problems moving content (e.g. contacts, photos, Apps, etc.) to new communications provider
X
Arranging for the old and new services to start and stop at the right time
X X X X
TOTAL 23 21 25 22
CONSIDERER LIST Mobile
phone
network
Dual
play
Triple
play
Pay TV
service
only
NOTE
S
Difficult to compare what different providers are offering
x X X X ASK Q11
Not clear what steps I need to take to switch supplier
x X X X
Getting current/previous communications provider to provide you with the information you needed to be able to switch to another communications provider
x X X X
Too time consuming to research the market
x X X X
Too time consuming to go through the process of switching
x X X X
Worried that something will go wrong X X X X Worried that the service overall or the customer service wouldn’t be as good as current service
x X X X
Being in contract with supplier/having to pay a cancellation charge to communications provider
x X X X ASK Q14
Don’t want to change email address X X Don’t want to change telephone number x X X Not enough difference in price to make effort worthwhile
x X X X
I don’t want to learn how use a new service
x X X X
Didn’t have the handset I wanted X Would lose ‘personalised’ settings, (TV) like favourites, series link, etc. (Mobile) like wallpaper, ringtones, call lists, etc.)
x X X X
Would lose other ‘add-on’ services, like: Sky Go, Sky Anytime outside of home Wi-Fi services (e.g. Virgin and London underground Wi-Fi, Sky Cloud, BT Openzone, etc.)
X X X X
Worried that others devices/products I own won’t work with new service
x X X X ASK QE1
5

Customer Retention and Interoperability Research
Prepared for: Ofcom 125
Didn’t want to lose convenience of having services with same suppler [previous/current = dual/triple]
X X
Provider persuading me to stay/offering me a better deal
x X X X
Worried that might be without the service during the switch
x X X X
Worried that I would end up having to pay for two services at the same time
x X X X
Worried that will be difficult or impossible to move content to new service (e.g. by content we mean programmes you recorded on your set-top box)
X X
Losing cost benefits like calls to friends and family, etc.
x X X
Losing data/access services such as Cloud storage, security service, etc.
x X X
Losing ‘extra’ services such as cinema tickets, Nectar points, etc.
x X X X
Worried that the signal/speed won’t be as good in your area
X X X X
Issues regarding installation of the new service
X X X ASK QE22
The costs involved e.g. having to pay the initial connection or other start-up fee, costs of handsets/set top box etc.
X X X X
Little real difference between the product or service being offered
X X X X
Worried about moving content (e.g. contacts, photos, Apps, etc.) to new communications provider
x
It’s worth waiting in case my communications provider offers me a better deal
X X X X
TOTAL 25 28 28 24
IF MORE THAN ONE MENTIONED AS A ‘MAJOR BARRIER’ (DO NOT PULL MINOR BARRIERS INTO THIS QUESTION) QE2 SWITCHERS: Which of the problems/issues you mentioned would you say was the main
difficulty you faced when switching to a new communications provider?… SHOW LIST FROM ABOVE – ALLOW OTHER- WRITE-IN CONSIDERED BUT STAYED: Which of the problems you mentioned would you say was
the main issue you decided NOT to switch the service you were considering?… SHOW LIST FROM ABOVE – ALLOW OTHER- WRITE-IN NEXT SECTION ASKED AS FOLLOW-UPS BASED ON ANSWERS GIVEN ABOVE. QE2B SWITCHERS: Were there any other issues that you faced that we’ve not mentioned? If
so, please write in below: WRITE IN. INCLUDE A ‘NO OTHER ISSUES’ BOX SCRIPTER TO MOVE QE3-QE8 AFTER QE22 TO IMPROVE FLOW

Customer Retention and Interoperability Research
Prepared for: Ofcom 126
"We now have a few questions concerning your Pay TV set-top box" QE3ai PAY TV CONSIDERERS (QB7a CODE 6) OR THOSE WHO HAVE PAY TV BUT DID NOT
SWITCH THEIR PAY TV SERVICE (QB1 CODES 4 AND DID NOT CODE 1 OR 2 FOR PAY TV AT QB7a): Which of the following best matches your understanding of the recordings stored on your [current supplier from Q5/6] set-top box?
SINGLE CODE
It’s not possible to transfer content stored on the set-top box from my TV communications provider so that I can watch it even if I cancel my subscription It’s possible to transfer content but I don’t know how to do it It’s possible to transfer content – and I know how to do it My set-top box doesn’t have a recorder on it Not sure
QE3aii ASK ALL PAY TV SWICTHERS (CODE 1 OR 2 FOR PAY TV AT QB7a): Which of the following best matches your understanding of the recordings stored on your old [previous supplier from Q8b] set-top box?
SINGLE CODE
It was not possible to transfer content stored on the set-top box from my TV communications provider so that I can watch it even if I cancel my subscription It was possible to transfer content but I didn’t know how to do it It was possible to transfer content – and I knew how to do it My set-top box didn’t have a recorder on it Not sure
QE3 ASK ALL PAY TV SWICTHERS (CODE 1 OR 2 FOR PAY TV AT QB7a) AND HAVE
RECORDABLE BOX AT QE3a – OTHERWISE SKIP TO QE11 Which of the following did you have stored on your Pay TV’s set-top box?
Films A full TV series Individual TV programmes Other (write in) None
ASK IF STORE CONTENT AT QE3 – SKIP TO IF ‘NONE’ AT QE11 QE5 Which of the following would you have ideally liked to keep when you left your
previous pay-TV communications provider? QE6 Which of these did you actually keep/transfer to your new communications provider? MULTICODE
Films A full TV series Individual TV programmes Other (write in) None
ASK OVERALL – NOT FOR EACH QE7 How easy was it to transfer this content? SINGLE CODE

Customer Retention and Interoperability Research
Prepared for: Ofcom 127
Very difficult Fairly difficult Fairly easy Very easy Don’t know
SHOW CONTENT THAT WAS NOT TRANSFERRED BUT WHICH RESPONDENT WANTED TO – FOR EACH ASK QE8 Why did you not transfer this content? MULTICODE
Too difficult It’s not possible to transfer it Decided it wasn’t important Ran out of time to do it
ASK IF CODED: DIFFICULT TO COMPARE WHAT DIFFERENT PROVIDERS ARE OFFERING (QE1 CODE 1) QE11 You mentioned that it was difficult to compare what the providers were offering.
Please select the issues below that you found difficult to compare… MULTICODE
Overall cost of the service 1 Costs of specific elements of the service 2 Service quality in your specific area 3 DUAL /TRIPLE FILTER: Broadband speeds 4 Broadband data usage allowances 5 Broadband traffic management policies 6 Other broadband product details (e.g. security) 7 TRIPLE FILTER/TV ONLY: TV package/channels 8 DUAL /TRIPLE FILTER: Landline calls package (FILTER) 9 Installation process 10 MOBILE FILTER: Mobile – Number of minutes/texts in contract 11 Mobile – Data allowance in contract 12 Mobile network coverage 13 Contract length 14 Other issues (WRITE IN) 15 Can’t remember 16
QE13 Why was it difficult to compare…
MULTICODE
The whole area is very complicated 1 Information was presented in a complicated way 2 Lack of personal knowledge in regards to this area 4 Providers use inconsistent terminology 5 Information was not available 6 Providers deliberately try to hide things 7

Customer Retention and Interoperability Research
Prepared for: Ofcom 128
Can’t remember 8 ASK IF CODED: STILL WITHIN THE CONTRACT PERIOD (QE1 SWITCHER CODE 4/CONSIDERER CODE 8) QE14 You mentioned that you were still within the contract period. What was your concern
in this area? MULTICODE
You’re not allowed to leave within the contract period 1 It was a long contract 2 You have to pay a cancellation charge 3 Would have to pay more than one communications provider for a short time
4 Contracts ending at different times 5 Can’t remember 6
ASK IF CODED: WORRIED THAT OTHER DEVICES/PRODUCTS I OWN WON’T WORK WITH NEW SERVICE (QE1 SWITCHER CODE 13/CONSIDERER CODE 16) CONSIDERERS QE15 You mentioned that you were worried that other devices/products wouldn’t work
with the new service. Which devices/products were you worried about? MULTICODE
Games console (such as Xbox, Sony PS2, etc.) 1 Tablet computer (such as iPad, Samsung Galaxy tablet, etc.) 2 PVR/DVRs 3 Smart phones (such as Apple iPhone, Samsung Galaxy, BlackBerry, etc.) 4 Hand-held games consoles (such as Nintendo DS, Sony PSP, etc.) 5 e-readers (such as Kindle, Kobo, etc.) 6 smart TV (i.e. – a TV that is automatically linked to the internet) 7 MP3 player, iPod or similar 8 Computer/laptop 9 Docking station, speakers etc. 10 Other (WRITE IN) 11 Can’t remember 12
SWITCHERS QE16 You mentioned that it was difficult to get other devices/products to work or connect
with the new service. Which devices/products did you want to work or connect with the new service? MULTICODE
Games console (such as Xbox, Sony PS2, etc.) 1 Tablet computer (such as iPad, Samsung Galaxy tablet, etc.) 2 PVR/DVRs 3 Smart phones (such as Apple iPhone, Samsung Galaxy, BlackBerry, etc.) 4 Hand-held games consoles (such as Nintendo DS, Sony PSP, etc.) 5 e-readers (such as Kindle, Kobo, etc.) 6 smart TV (i.e. – a TV that is automatically linked to the internet) 7 MP3 player, iPod or similar 8 Computer/laptop 9 Other (WRITE IN) 10 Can’t remember 11
Customer Retention and Interoperability Research
Prepared for: Ofcom 129
ASK IF CODED: ISSUES REGARDING INSTALLATION OF THE NEW SERVICE (QE1 SWITCHER CODE 23/CONSIDERER CODE 26) QE22 You mentioned that you were worried about issues regarding installation of the new
service. What specifically were you worried about MULTICODE
Installation happening at an inconvenient time or having to take time off work1 Possible damage to inside of your home 2 Poor quality workmanship 3 Cost of the installation 4 Possibility that the installation won’t be carried out properly 5 Possible damage to outside of home 6 Other (WRITE IN) 7
OVER THE TOP SERVICES: ASK ALL DUAL, TRIPLE, STANDALONE PAY TV Intro: You mentioned earlier that you use [insert ott services watched e.g. LOVEFILM INSTANT, NETFLIX, NOW TV, ITUNES, NOW TV] we would now like to ask you some questions about how you use such services ASK QE23 FOR EACH OF LOVEFILM INSTANT, NETFLIX, NOW TV (NOT BLINKBOX OR ITUNES) - IF USED QE23 How are you currently paying for (INSERT SERVICE NAMES)? SCRIPTER TO SET THIS UP AS A GRID SINGLECODE PER BRAND
Monthly subscription 1 On a free trial – so not paying 2 Don’t know 4
ASK QE24 IF ANY OTT SERVICE IS USED (LOVEFILM INSTANT, NETFLIX, BLINK BOX, ITUNES OR NOW TV) QE24 How often do you use (INSERT SERVICE NAMES)? SCRIPTER TO SET THIS UP AS A GRID SINGLECODE PER BRAND
Every day 1 3-4 times a week 2 Once or twice a week 3 2-3 times a month 4 Once a month 5 Less often than once a month 6
QE25 What screens do you use to watch films/TV from (INSERT SERVICE NAMES USED)? SCRIPTER TO SET THIS UP AS A GRID SINGLECODE PER BRAND MULTICODE
Main household television 1 Secondary household televisions 2 Laptop or desktop PC 3 Tablet computer (e.g. iPad) 4

Customer Retention and Interoperability Research
Prepared for: Ofcom 130
Smartphone (e.g. iPhone) 5 MP3 Player 6 Other (WRITE IN) 7
ASK IF TRIPLE PLAY OR STANDALONE PAY TV QE26a What has been the impact of using [OTT service] on how you watch your Pay TV
service from (communications provider at QB5/6) SINGLECODE
Removed the movie package from my Pay TV communications provider Watch Pay TV less than I did before (but have not downgraded the package) No effect – use it to watch TV/films I can’t get on Pay TV/missed on Pay TV Other (WRITE IN)
IF DOWNGRADED PACKAGE QE26b You mentioned that you downgraded the Pay TV package – did you intend this when
you decided to use [OTT service] or did you decide later? SINGLECODE
Intended to downgrade when subscribed Decided later
DUAL PLAY ONLY – PREVIOUS PAY TV USERS (QC16a – CODES 2-4) QE27 You mentioned that you previously had Pay TV – did you specifically get [ott service]
as an alternative to Pay TV? SINGLECODE
Yes No Can’t remember
DUAL PLAY ONLY – NOT PREVIOUS PAY TV USERS (QC16a – CODE 1) QE28 Do you see your service from [ott service] as an alternative to a Pay TV service such
as Sky, Virgin Media or BT Vision? SINGLECODE
Yes No – but I don’t want a Pay TV service No – but I would take a Pay TV service if I could Don’t know
ASK TRIPLE PLAY AND STANDALONE PAY TV QE29 How important to you or your household is the content you have stored on your set
top box (i.e. your DVR/PVR)?
Very important Fairly important Not very important Not at all important Don’t know I don’t have a set top box
Customer Retention and Interoperability Research
Prepared for: Ofcom 131
WINBACK ACTIVITY SECTION ASK ALL SWITCHERS - NOTE TO SCRIPTER: OFCOM WOULD LIKE THE FOLLOWING PRIORITIES FOR DUAL/TRIPLE PLAY - IF THEY’VE SWITCHED MORE THAN ONE SERVICE…
• TRIPLE PLAY PRIORITIES: 1) PAY TV, 2) BB, 3) LL • DUAL PLAY PRIORITIES: 1) BB, 2) LL
NOTE: RESPONDENTS SHOULD ONLY ANSWER SECTION D ONCE, ABOUT ONE SERVICE QD1 Once you had decided to switch your [insert relevant service from B7a], did you
contact… SINGLE CODE
Both your previous / and your new supplier Only your previous communications provider
Only your new communications provider
Can’t remember
ASK ALL CONSIDERERS QD1b Did you contact your current communications provider or any new providers while you
were considering switching? SINGLE CODE
Yes current communications provider only Yes potential new providers Yes both current and new providers Can’t remember No, neither
IF CONTACTED BOTH – SWITCHERS AND CONSIDERERS QD2 Who did you contact first… SINGLE CODE
Your [previous] / [current] communications provider [Your new communications provider] / [the communications provider you were
planning to change to]
ASK TO SWITCHERS AND CONSIDERERS WHO SPOKE TO NEW PROVIDER / THE PROVIDER YOU WERE PLANNING TO CHANGE TO FIRST (CODE 2 AT QD2) QD2a Did you contact your [previous communications provider / current communications provider]...?
After you had placed an order/signed up with my new communications provider After you had agreed to switch, but had not actually placed an order Before you had made any decision on whether to switch communications provider Can’t remember
ASK IF CONTACTED PREVIOUS (CODES 1 OR 2 AT QD1)/CURRENT SUPPLIER (CODES 1 OR 3 AT QD1B) QD3 Why did you contact your [previous] / [current] communications provider?
To get a switching code/MAC code/PAC code To find out about any charges/cancellation fees

Customer Retention and Interoperability Research
Prepared for: Ofcom 132
To ask them for a better deal To let them know I was leaving their service/cancel my service To find out about what I needed to do in order to switch For something else (write in)
SWITCHERS: IF DID NOT CONTACT PREVIOUS (QD1 – CODE 3 or 4) CONSIDERERS: IF DID NOT CONTACT CURRENT BUT CONTACTED NEW (QD1B CODE 2) QD4 Did your [previous] / [current] communications provider contact you about your
decision to change communications provider? SINGLE CODE
Yes No
IF SPOKE TO SUPPLIER (SWITCHERS – PREVIOUS SUPPLIER CODE 1 OR 2 AT QD1a) / (CONSIDERERS CODES 1 OR 3 AT QD1b) / CODE 1 AT QD4 QD6 Which one of these statements best describes what happened when you spoke to your
[previous] / [current] communications provider? SINGLE CODE
They did not try to persuade me to stay with them They tried to persuade me to stay, but did not put me under any pressure to stay They put me under pressure to stay with them Can’t remember
ASK IF CODES 2 OR 3 – OTHER SKIP TO QD13 QD7 How did they try to persuade you? MULTICODE
Offered a deal on a new product Offered a discount for a period of time (e.g. 3 months or 6 months) Offered a permanent reduced price Offered money off a previous bill Talked about their own products’ benefits Compared their customer service to the other providers Talked about new/forthcoming developments Talked about ‘cancellation’ costs Other (write in) None of the above
QD8 How happy or unhappy were you with their efforts to persuade you to stay with them?
SINGLE CODE
Very happy Fairly happy Fairly unhappy Very unhappy Don’t know
QD9 Which of the following words would you choose to describe their approach when trying
to persuade you to stay? MULTI CODE
Helpful Aggressive

Customer Retention and Interoperability Research
Prepared for: Ofcom 133
Professional Polite Persistent Interesting Intimidating Friendly Pushy Annoying None of the above
CONSIDERERS QD10 Did you accept their offer?
Yes No
IF ACCEPTED: QD11 Which of the following best describes what you did when your [previous] / [current]
communications provider offered you a deal/discount to stay??
I accepted during the phone call in which they made the offer I accepted at a later date - after thinking about it for a while I accepted at a later date - after comparing their offer with other communications provider/s None of the above Can’t remember
ASK ALL CONSIDERERS CODING 1-3 AT REVIEW QD11 QD12 What impact did this offer have on your decision to stay with your current communications provider
SINGLE CODE Major impact– it was the main reason I stayed Some impact – it was one of the more important reasons I stayed A little impact – it helped tip the balance No impact – I stayed for other reasons
ASK ALL QD13 How happy or unhappy are you with your decision to [switch communications
provider] / [stay with your current communications provider]? SINGLE CODE
Very happy Fairly happy Fairly unhappy Very unhappy Don’t know

Customer Retention and Interoperability Research
Prepared for: Ofcom 134
SECTION 4: AUDIT OF ‘CONNECTED’ DEVICES AND SWITCHING AND RETENTION ISSUES RELATED TO DEVICES AUDIT SECTION: MAY NEED TO FILTER ON PREVIOUS ANSWERS/ACCORDING TO THE RESPONDENT’S SAMPLE CELL Introduction: Up to now we’ve mainly been looking at services such as Pay TV, broadband, landline
phone and mobile phone services. Now we’re going to look at some of the devices in more detail, including smartphones again, as well as tablet computers and so on.
QF1a Which of the following do you use? MULTI CODE
Games console connected to TV(such as Xbox, Sony PS2, etc.) 1 Tablet computer (such as iPad, Samsung Galaxy tablet, etc.) 2 PVR/DVRs (TBC) (by PVR/DVR we mean a set-top box that you can record and store TV content on) 3 Smart phones (such as Apple iPhone, Samsung Galaxy, BlackBerry, Nokia (MS) etc.) 4 Hand-held games consoles (such as Nintendo DS, Sony PSP, etc.) 5 e-readers (such as Kindle, Kobo, etc.) 6 Smart TV (i.e. – a TV that is automatically linked to the internet) 7 MP3 player, iPod or similar 8 Laptop or desktop computer 9 Can’t remember 10 None of these (SINGLE CODE) 11
IF USE GAMES CONSOLES ASK: QF2 Which brand of games console do you mainly use? SINGLE CODE
Xbox 360 1 Other Xbox 2 Sony PlayStation 3 3 Other Sony PlayStation 4 Nintendo Wii 5 Other Nintendo 6 Other (WRITE IN) 7
IF USE A HAND HELD GAMES CONSOLE ASK: QF3 Which brand of hand held games console do you mainly use? SINGLE CODE
Nintendo DS 1 Nintendo 3DS 2 Other Nintendo 3 Sony PSP 4 Other Sony devices 5 Other (WRITE IN) 6
IF USING AN E-READER ASK: QF4 Which brand of eReader do you mainly use? SINGLE CODE
Kindle 1 Kobo 2 Sony Reader 3 iRiver Reader 4 Other (WRITE IN) 5

Customer Retention and Interoperability Research
Prepared for: Ofcom 135
IF USE SMART TV ASK… QF5 What is the brand name of the main Smart TV you use in your household? SINGLE
CODE
Philips 1 Samsung 2 Sony 3 LG 4 Panasonic 5 Toshiba 6 Apple 7 Other (WRITE IN) 8
IF USE MP3 PLAYERS, IPODS OR SIMILAR ASK: QF6 Which brand of MP3 player do you mainly use? SINGLE CODE
Apple iPod (any) 1 Sony 2 Creative 3 Zune 4 Other (write in) 5
IF USE COMPUTER ASK: QF7 Which brand of laptop or desktop computer do you mainly use at home? SINGLE CODE
Apple 1 HP 2 Asus 3 Toshiba 4 Sony 5 Dell 6 Other (write in) 7
IF USE TABLET COMPUTER ASK: QF8 Which brand of tablet computer do you use? If you have more than one, please think
about the one you mainly use? SINGLE CODE
Apple iPad 1 Samsung Galaxy Note 2 Asus 3 Toshiba 4 Archos 5 Kindle Fire 6 Google Nexus 7 Other (write in) 8
QF9 What operating system does your tablet use? SINGLE CODE
Apple’s operating system (iOS) Android Windows Don’t know Other (WRITE IN)

Customer Retention and Interoperability Research
Prepared for: Ofcom 136
QF10 Which, if any, of the following do you use your main tablet for? MULTICODE
Downloading Apps VoIP (such as Skype) Sending/receiving video clips Recording video clips Downloading any other content, ringtones etc. Video streaming Video calling TV streaming Camera Games Listening to music Using services such as Facebook, Twitter, LinkedIn, etc. Accessing internet services via Apps Browsing the internet using a browser (e.g. Safari, Internet Explorer, Chrome) Watching video clips or TV Storing photos, music, video etc. Reading books/magazines Watching services like Lovefilm, Netflix, iTunes, etc. Other (WRITE IN)
QF11 Which of the following of the following do you have on your main tablet? For each
that you’ve got please indicate whether these were free, paid for, or if you don’t have these are all…
Free Paid for Don’t have Photographs Games Self-taken videos Music TV programmes / films/ third-party created video/video clips
Books/publications Apps Other content (write in)
QF12 Thinking about the content stored on this device, would you say they were temporary
(things that you may need for a short while – then delete) or permanent (things that you would like to keep for a very long time)…
Almost all temporary 1
Mainly temporary 2 About half temporary and half permanent 3 Mainly permanent 4 Almost all permanent 5 Don’t know 6

Customer Retention and Interoperability Research
Prepared for: Ofcom 137
QF13 How, if at all, do you back-up the data on your main tablet?
USB cable to an external hard drive or computer Wi-Fi to an external hard drive or other storage device To a manufacturer’s cloud service (such as Apple iCloud or Amazon Cloud) Other cloud services (not specific to any manufacturer) Don’t back up the data on the tablet Other (WRITE IN)
IF DON’T BACK UP ASK QF14 Why don’t you back-up your tablet? MULTI CODE
The content on the tablet is not very important 1 Don’t get round to it/keep forgetting 2 It’s not possible to back-up 3 It’s difficult to carry out 4 I don’t know how to do this (SINGLE CODE) 5
QF15 How easy or difficult do you find the process of backing up your tablet? SINGLE CODE Very easy Fairly easy Fairly difficult Very difficult Don’t know QF17 When did you buy your main tablet? SINGLE CODE
Within the last 6 months 1 7-12 months ago 2 13 months to 2 years ago 3 2-3 years ago 4 4-5 years ago 5 More than 5 years ago 6 Don’t know/can’t remember 7
QF18 What was the brand of your previous main tablet or was this your first? SINGLE CODE
Apple iPad 1 Samsung Galaxy Note 2 Asus 3 Toshiba 4 Archos 5 Kindle Fire 6 Google Nexus 7 Other (write in) 8 This is the first one you’ve bought 9

Customer Retention and Interoperability Research
Prepared for: Ofcom 138
ASK IF SELECTED ABOTHER BRAND AT QF18: QF19 And what operating system did your previous tablet use? SINGLE CODE
Apple’s operating system (iOS) 1 Android 2 Windows 3 Don’t know 4 Other (WRITE IN) 5
IDENTIFY IF: - New user: code 9 above at QF18 - Switcher: different OS at F19 (previous) vs. F9 (current) - REPEAT PURCHASERS: same OS F19 (previous) vs. F9 (current) (ASK QF20)
IF REPEAT PURCHASERS: QF20 Which of the following best matches what happened when you bought/upgraded your
tablet? SINGLE CODE
I had decided to remain with the same brand at the beginning of the process1 I was open minded about getting another brand 2 I was considering getting an alternative brand but decided to stick with
my current brand 3 IF USE SMART PHONE ASK: QF21 Which operating system are you currently using on your main smartphone? SINGLE CODE
Android 1 iOS 2 BlackBerry 3 Windows Phone 7 4 Symbian/Nokia 5 Other 6 Can’t remember/Don’t know 7
ASK ALL QF22 And what is the brand of your main smartphone? SINGLE CODE
iPhone 1 BlackBerry 2 Samsung 3 Nokia 4 Sony Ericsson 5 HTC 6 Motorola 7 LG 8 Other 9
NB – USE ABOVE TO IDENTIFY IF USER HAS AN ‘ECOSYSTEM’

Customer Retention and Interoperability Research
Prepared for: Ofcom 139
QF23 Which, if any, of the following do you use your main smartphone for? MULTICODE
Downloading video/music VoIP (such as Skype) Sending/receiving video clips Recording video clips Downloading any Apps Watching ‘live’ TV Camera Downloading ringtones, wallpaper, etc. Playing games Listening to music Using services such as Facebook, Twitter, LinkedIn, etc. Accessing internet services via Apps Browsing the internet using a browser (e.g. Safari, Internet Explorer, Chrome) Watching video clips or TV Storing photos, music, video etc. Reading books Other (WRITE IN)
QF24 Which of the following do you have on your smartphone? For each that you’ve got
please indicate whether these were free, paid for, or if you don’t have these are all…
Free Paid for Don’t have Photographs Games Self-taken videos Music TV programmes / films/ third-party created video/video clips
Books/publications Apps Ringtones Other content (write in)
QF25 Thinking about the content stored on this device, would you say they were temporary
(things that you may need for a short while – then delete) or permanent (things that you would like to keep for a very long time)?
Almost all temporary 1
Mainly temporary 2 About half temporary and half permanent 3 Mainly permanent 4 Almost all permanent 5 Don’t know 6

Customer Retention and Interoperability Research
Prepared for: Ofcom 140
QF26 How, if at all, do you back-up the data on your main Smartphone?
USB cable to an external hard drive or computer 1 Wi-Fi to an external hard drive or other storage device 2 To a manufacturer’s cloud service (such as Apple iCloud or Amazon Cloud) 3
Other cloud services (not specific to any manufacturer) 4 Don’t back-up the data on the smartphone 5 Other (WRITE IN) 6
IF – DON’T BACK UP ASK QF27 Why don’t you back-up your smartphone? MULTI CODE
The content on the phone is not very important 1 Don’t get round to it/keep forgetting 2 It’s not possible to back-up this phone 3 It’s difficult to back-up 4 I don’t know how to do this (SINGLE CODE) 5
ASK ALL WHO BACK-UP QF28 How easy or difficult do you find the process of backing up your smartphone? Very easy Fairly easy Fairly difficult Very difficult Don’t know ASK ALL CODING SMARTPHONE AT QF1A QF29 When did you buy your current main smartphone? SINGLE CODE
Within the last 6 months 1 7-12 months ago 2 13 months to 2 years ago 3 2-3 years ago 4 4-5 years ago 5 More than 5 years ago 6 Don’t know/can’t remember 8
IF CODE 1-8 ABOVE ASK: QF30 What was the operating system of your previous main smartphone or was this your first smartphone?
Android 1 iOS 2 BlackBerry 3 Windows Phone 7 4 Symbian/Nokia 5 Other 6 Can’t remember/Not sure 7 This is the first one you’ve bought 8

Customer Retention and Interoperability Research
Prepared for: Ofcom 141
ASK IF SELECTED ANOTHER BRAND AT QF30: QF31 And what was the brand of your old main smartphone? SINGLE CODE
iPhone 1 BlackBerry 2 Samsung 3 Nokia 4 Sony Ericsson 5 HTC 6 Motorola 7 LG 8 Other 9
IDENTIFY IF:
- New user: code 8 above at QF30 - Switcher: different OS at F30 (previous) vs. F21 (current) - REPEAT PURCHASERS: same OS at F30 (previous) vs. F21 (current) - ASK QF32
IF POSSIBLE REPEAT PURCHASERS QF32 Which of the following best matches what happened when you got your current
smartphone? SINGLE CODE
I had decided to remain with the same brand at the beginning of the process1 I was open minded about getting another brand 2 I was considering getting an alternative brand but decided to stick with my current brand 3

Customer Retention and Interoperability Research
Prepared for: Ofcom 142
ASK ALL INTEROPERABILITY QUESTIONS SHOW LISTOF ALL DEVICES USED ACROSS THE PAGE AND ALONG ONE SIDE SKIP IF CODE 10 OR 11 AT QF1A / SKIP IF ONLY 1 DEVICE CODED AT QF1A QF33 Do you ever share or transfer content between these devices? By sharing content we
mean – moving content between devices or ‘mirroring’ what’s on one device on another (e.g. having the same email account or music on two or more devices)
Yes 1 No 2 Don’t know/not sure 3
IF YES ASK QF34 Which devices do you share content between? CODE MINIMUM OF TWO DEVICES
Games console connected to TV(such as Xbox, Sony PS2, etc.) 1 Tablet computer (such as iPad, Samsung Galaxy tablet, etc.) 2 PVR/DVRs (TBC) (by PVR/DVR we mean a set-top box that you can record and store TV content on) 3 Smart phones (such as Apple iPhone, Samsung Galaxy, BlackBerry, etc.) 4 Hand-held games consoles (such as Nintendo DS, Sony PSP, etc.) 5 e-readers (such as Kindle, Kobo, etc.) 6 Smart TV (i.e. – a TV that is automatically linked to the internet) 7 MP3 player, iPod or similar 8 Laptop or desktop computer 9
FILTER ON DEVICES SELECTED AT QF34. SHOW AS A GRID WITH DEVICES ALONG TOP OF PAGE AND CONTENT DOWN SIDE ADD EXTRA COLUMNS FOR ‘I DON’T SHARE THIS TYPE OF CONTENT BETWEEN MY DEVICES’ AND ‘I DON’T HAVE THIS TYPE OF CONTENT ON ANY OF MY DEVICES’ (BOTH OF THESE SHOULD BE SINGLE CODE OPTIONS) QF35 Please select the content that you view, transfer or share between these devices? Please select all the devices that apply for each type of content. For example, if you have downloa
‘the trainline’ app onto your iPhone and then you shared this with your iPad, you will need to click Apps in the ‘smartphone’ and ‘tablet computer’ columns. Please tick ‘I don’t share this type of content between any of my devices’ or ‘I don’t have this type of content on any of my devices’ if it is relevant to do so
Apps Programmes from my Pay TV service Books/publications Music Programmes/films from an internet service such as Netflix or Lovefilm Photos

Customer Retention and Interoperability Research
Prepared for: Ofcom 143
QF36 Thinking about all the content your share between your various devices. Which of the following methods do you use to transfer this content?
MULTICODE
USB cable to link 2 devices together 1 Wi-Fi 2 Bluetooth 3 Over the internet 4 Through a cloud based service over the internet 5 IF CLOUD MENTIONED AT CODE 5 QF37 Is the Cloud service you use? MULTICODE
Provided by the manufacturer of one of your device, such as Apple iCloud or similar? 1
Another cloud based service (such as Digital Vault) 2 Don’t know 3 ASK ALL USING 2 OR MORE DEVICES AT QF1A QF38 On a scale of 1 to 10, where 1 is ‘impossible’ and 10 is ‘extremely easy’ how easy is it
to transfer content between the following types of device? ALLOW DK
Devices made by the same manufacturer ____ Devices made by different manufacturers ____ Devices which use different operating systems (e.g. Android vs. iOS/Apple) ____ DEFINITIONS FOR SECTION H RESPONDENT IS ELIGIBLE FOR THIS SECTION IF THEY’RE A ‘SWITCHER’, ’NEW PURCHASER’, OR A REPEAT PURCHASER FOR TABLET COMPUTERS OR SMARTPHONES (I.E. ALL WITH A DEVICE) TABLET SWITCHER - DIFFERENT OS AT F19 (PREVIOUS) VS. F9 (CURRENT) TABLET NEW PURCHASER - CODE 9 AT QF18 TABLET REPEAT PURCHASER - SAME OS AT F19 (PREVIOUS) VS. F9 (CURRENT) TABLET REPEAT PURCHASER, BUT WHO CONSIDERED SWITCHING - SAME OS AT F19 (PREVIOUS) VS. F9 (CURRENT) AND CODE 3 AT F20 SMARTPHONE SWITCHER - DIFFERENT OS AT F30 (PREVIOUS) VS. F21 (CURRENT) SMARTPHONE NEW PURCHASER - NEW USER: CODE 8 ABOVE AT QF30 SMARTPHONE REPEAT PURCHASER - SAME OS AT F30 (PREVIOUS) VS. F21 (CURRENT) SMARTPHONE REPEAT PURCHASER, BUT WHO CONSIDERED SWITCHING - SAME OS AT F30 (PREVIOUS) VS. F21 (CURRENT) AND CODE 3 AT F32 ASSIGNING RESPONDENTS TO ANSWER: IF QUALIFY FOR BOTH TABLET AND SMARTPHONE THEN ASSIGN TO TABLET LIST – UNTIL HAVE AT LEAST 100, THEN ALTERNATE

Customer Retention and Interoperability Research
Prepared for: Ofcom 144
ASK ALL QH1 Overall, how easy or difficult did you find the process of changing to (if
switched)/buying a new (if new purchaser) [smartphone]/ [tablet]? SINGLE CODE
Very difficult Fairly difficult Fairly easy Very easy Don’t know
IMPORTANCE OF DIFFERENT ELEMENTS IN THE PURCHASE DECISION WHEN CHOOSING NEW DEVICES OPTION 1 – USING MAXIMUM DIFFERENCE SCALING (NB WE HAVE COSTED FOR A TOTAL OF 4 MAX DIFF MODELS) ASK ALL QH1a In the next exercise, you’ll see a list of items that others have said are important when
choosing new [insert relevant DEVICE]. For this section please do not think about the mobile network or broadband communications provider – please just focus on the choice of device, and specifically the operating system for that device.
Please take into account your previous experience of choosing a [device], and anything that may have changed since then in terms of how you use it or if different brands or types of [device] are now available…
You’ll be shown 10-15 screens. On each, please select the item that you think is the most important when choosing a new [insert relevant DEVICE], and the element you think is least important.
LIST TO INCLUDE (NB: WE WOULD LIKE TO KEEP THE LONGEST LIST DOWN TO 25 – 30 ATTRIBUTES)
Smartphone Tablet
computer The brand of handset/tablet X X Initial costs X X On-going costs X X Reliability of the device X X Previous experience with devices from same brand X X Customer service from device manufacturer X X Easy to integrate with existing devices/other services
X X
The most up to date/cutting edge technology X X Recommended by family/friends X X Recommended by independent expert X X Available on the network I prefer x X Amount of storage x X Range of Apps/games available X X Same brand as other devices I own X X Easy to transfer content between devices I own X X
Customer Retention and Interoperability Research
Prepared for: Ofcom 145
Ease of use X X Compatible with other devices I own X X Easy to back-up data X X Same operating system as other devices I own X X Has the operating system I want X X Works (inter-operable) with devices from other manufacturers
X X
Has same operating system as previous smartphone/tablet
X X
Good battery life X X Looks good/stylish X X TOTAL 24 24
AMEND WORDING TO TAKE ACCOUNT OF SWITCHING STATUS: BARRIER LISTS ASK BARRIER LISTS IF SMARTPHONES AND: SWITCHERS REPEAT PURCHASERS, BUT WHO CONSIDERED SWITCHING NEW = DON’T ASK BARRIER LIST (any issues to be included in importance list) TABLETS = DON’T ASK BARRIER LIST (any issues to be included in importance list) QH2a SWITCHERS: Thinking back to when you switched your smartphone from [PREVIOUS
BRAND AND OS] to [CURRENT BRAND AND OS]. Please can you look at the list of issues or difficulties you may have faced when moving from one hand-set brand and/or operating system to another (and not any issues moving from one mobile network to another).
Please and drag & drop the issues or difficulties to the appropriate ‘bucket’ to show
how much of an issue it was for you personally when changing your handset and/or operating system; so was it a major issue, a minor issue or not an issue at all?
QH2b REPEAT PURCHASERS, BUT WHO CONSIDERED SWITCHING: Thinking back to when
you considered switching your smartphone from [PREVIOUS BRAND/OS] please can you look at the list of problems or barriers you may have faced, and drag & drop them to the appropriate ‘bucket’ to show how ‘off-putting’ it was to you when considering changing providers; so was the issue very off-putting, fairly off-putting or not an issue…
NOTES:
- THE QUESTION WILL BE SHOWN TO RESPONDENTS AS A DRAG AND DROP. RESPONDENTS WILL ONLY SEE THE ATTRIBUTES APPROPRIATE TO THE PRODUCT/PRODUCT BUNDLE THEY WERE CONSIDERING LEAVING.
- IT IS PRESENTED IN A GRID HERE FOR EASE OF COMPARISON - RANDOMISE RESPONSES - ASK FOLLOW UP QUESTIONS IF PUT IN MAJOR OR MINOR PROBLEM BUCKETS - GROUP BY THEME ONCE REVIEWED/SIGNED OFF (SEE QUAL STIM)

Customer Retention and Interoperability Research
Prepared for: Ofcom 146
SWITCHER Smartphone NOTES
Cost of new handset/contract x
Difficulties comparing the functionality of different devices
X
Too time consuming to research the market X
Time taken to set up a new device x
Difficulties learning how use a new device X
Being unable to transfer personal content (such as contacts, calendar and so on) from my old device to new device
X
Being unable to transfer paid content (such as Apps, music) from my old device to new device
X
Losing ‘personalised’ settings, like wallpaper, ringtones, call lists, etc.
X
Losing other ‘add-on’ services, like: Sky Go, Sky Anytime, outside of home Wi-Fi services (e.g. Virgin and London underground Wi-Fi, Sky Cloud, BT Openzone, etc.)
X
Problems getting other devices/products I own to work with new device
X ASK QH10
Lack of information about moving content to new device (e.g. by content we mean contacts, email, Apps, etc.)
X
Learning how to use a new operating system X
Time taken to go through the process of transferring content to new device
X
Problems getting it to work with speakers, docking stations, etc.
X
Difficulties understanding if the new device is compatible with other devices I own
X
Difficulties transferring personal content (such as contacts, calendar and so on) from my old device to new service
X
Difficulties transferring paid content (such as Apps, music) from my old device to new service
X
Difficulties comparing the benefits of different operating systems
X
Cost of replacing Apps and other content X
Cost of replacing docking stations, etc. x
Concern about being tied into a long contract for the smartphone I wanted
18

Customer Retention and Interoperability Research
Prepared for: Ofcom 147
REPEAT PURCHASER, BUT WHO CONSIDERED SWITCHING
Smartphone NOTES
Cost of new handset/contract
Difficult to compare what different devices are offering
X
My current device meets my needs X
Too time consuming to research the market X
Time taken to go set up a new device X
Worried that the new handset/operating system being considered wouldn’t be as good as current
X
Worried about being tied into a long contract for smartphone I wanted
X
I don’t want to learn how to use a new device X
Worried about losing personal content (such as contacts, calendar and so on) from my old device to new service
X
Worried about losing paid content (such as Apps, music) from my old device to new service
X
Worried that would lose ‘personalised’ settings, like wallpaper, ringtones, call lists, etc.
X
Worried that others devices/products I own won’t work with new device
X ASK QH9
Lack of information about moving content to new device (e.g. by content we mean contacts, photos, apps)
X
Too time consuming to go through the process of transferring content to new device
X
Worried that it won’t work with speakers, docking stations, etc.
X
Worried that I might get ‘locked-in’ to a certain brand’s operating system (e.g. that I might have to buy all my devices from one brand)
X
Worried about moving to a different operating system
X ASK QH13
Cost of replacing Apps and other content X
Cost of replacing docking stations, etc. X
TOTAL 18
IF MORE THAN ONE MENTIONED AS A MAJOR BARRIER (DO NOT PULL MINOR BARRIERS INTO THIS QUESTION) NB – NOTES ON WORDING AS PER ABOVE QH3 SWITCHERS: Which of the problems/barriers you mentioned would you say was the
main issue you faced when switching to a new brand/operating system?…
SHOW LIST FROM ABOVE – ALLOW OTHER- WRITE-IN REPEAT PURCHASERS, BUT WHO CONSIDERED SWITCHING: Which of the
problems/barriers you mentioned would you say was the main issue you decided not to switch the brand/operating system you were considering?…
SHOW LIST FROM ABOVE – ALLOW OTHER- WRITE-IN

Customer Retention and Interoperability Research
Prepared for: Ofcom 148
SCRIPTER TO MOVE QH4-QH5 AFTER QH13 (TO IMPROVE FLOW) ASK ALL WHO HAVE SWITCHED MOBILE HANDSET (WHO PREVIOUSLY HAD A SMARTPHONE) QH4a Which of the following did you store on your previous handset? MULTICODE
Free Paid for Don’t have Photographs Games Self-taken videos Music TV programmes / films/ third-party created video/video clips
Books/publications Apps Ringtones Other content (write in)
QH4b Which of the following did you want to transfer to your new handset? IF NONE OF THESE SKIP TO QH9 QH4c Which of these did you actually transfer to your new handset? MULTICODE
LIST AS ABOVE None of these
SHOW CONTENT THAT WAS TRANSFERRED – USE GRID STRUCTURE QH4d How easy was it to transfer this content? MULTICODE
Very difficult Fairly difficult Fairly easy Very easy Don’t know
SHOW CONTENT THAT WAS NOT TRANSFERRED BUT WHICH RESPONDENT WANTED TO – FOR EACH ASK QH5 Why did you not transfer this content? MULTICODE
Too difficult It’s not possible to transfer it Changed my mind Ran out of time to do it

Customer Retention and Interoperability Research
Prepared for: Ofcom 149
ASK IF CODED ‘WORRIED THAT OTHERS DEVICES/PRODUCTS I OWN WON’T WORK WITH NEW DEVICE’ CONSIDERERS QH9 You mentioned that you were worried that other devices/products wouldn’t work
with the new service. Which devices/products were you worried about? MULTICODE
Games console (such as Xbox, Sony PS2, etc.) 1 Tablet computer (such as iPad, Samsung Galaxy tablet, etc.) 2 PVR/DVRs 3 Smart phones (such as Apple iPhone, Samsung Galaxy, BlackBerry, etc.) 4 Hand-held games consoles (such as Nintendo DS, Sony PSP, etc.) 5 e-readers (such as Kindle, Kobo, etc.) 6 smart TV (i.e. – a TV that is automatically linked to the internet) 7 MP3 player, iPod or similar 8 Computer/laptop 9 Speakers, docking stations and other peripherals 10 Other (WRITE IN) 11 Can’t remember X
SWITCHER QH10 You mentioned that it was difficult to get other devices/products to work or connect
with the new service. Which devices/products did you want to work or connect with the new service? MULTICODE
Games console (such as Xbox, Sony PS2, etc.) 1 Tablet computer (such as iPad, Samsung Galaxy tablet, etc.) 2 PVR/DVRs 3 Smart phones (such as Apple iPhone, Samsung Galaxy, BlackBerry, etc.) 4 Hand-held games consoles (such as Nintendo DS, Sony PSP, etc.) 5 e-readers (such as Kindle, Kobo, etc.) 6 smart TV (i.e. – a TV that is automatically linked to the internet) 7 MP3 player, iPod or similar 8 Computer/laptop 9 Speakers, docking stations and other peripherals 10 Other (WRITE IN) 11 Can’t remember X
ASK IF CODED: WORRIED ABOUT MOVING TO A DIFFERENT OPERATING SYSTEM QH13 You mentioned that you were worried about moving to a different operating system.
Which of the following were you worried about? MULTICODE
Losing apps downloaded on a handset with a different operating system Moving photos from a handset with a one operating system to another Moving music from a handset with a one operating system to another Learning how to use a new operating system Concerned that new operating system would not work (not be inter-operable) with other devices I own Concerned that the new operating system may not have the same range of apps / services as the old one Other (specify)
Customer Retention and Interoperability Research
Prepared for: Ofcom 150
ASK ALL ATTITUDE BATTERY ABOUT DEVICE TECHNOLOGY/SWITCHING – QH14 Please look at the different statements people have made about devices such as
Smartphones, tablet computers, games consoles and so on. For each statement please indicate how much you agree or disagree…
Agree strongly Agree slightly Neither agree nor disagree Disagree slightly Disagree strongly
• Taking more than one device from the same supplier reduces your hassle • Taking more than one device from the same supplier locks you in, making it
difficult to buy from more than one supplier • Taking more than one device from the same supplier means you get one good
device but a couple of average ones • I think about the device itself first, before thinking about what Apps or games
I can get on it

Customer Retention and Interoperability Research
Prepared for: Ofcom 151
DEMOGRAPHICS – COLLECT FOR ALL INCLUDING THOSE WHO CLOSE AFTER SCREENING You will now be asked to answer some questions about yourself and your household. QI1 ASK ALL How many people are there in your household in total (including yourself)? WRITE IN BELOW – USE LEADING ZEROS
QI2 ASK IF MORE THAN 01 PERSON AT QE1 – OTHERS SKIP TO QE3 Do you have any children aged under 16 who live at home with you – where you are
their parent or guardian? IF YES – How many of your children aged under 16 live at home with you? WRITE IN BELOW – USE LEADING ZEROS
QI4 ASK ALL At what age did you finish your education/expect to finish your education?
Aged 16 or under Aged 17-18 Aged 19-20 Aged 21 or over Don’t know Refused
QI5 ASK ALL Which of these, if any, limit your daily activities or the work you can do? MULTICODE OK FOR CODES 1-10
Breathlessness or chest pains Poor vision, partial sight or blindness Difficulty in speaking or communicating Poor hearing, partial hearing or deafness Cannot walk at all/ use a wheelchair Cannot walk very far or manage stairs or can only do so with difficulty Limited ability to reach Mental health problems or difficulties Dyslexia Other illnesses/health problems which limit your daily activities (WRITE IN) None (SINGLE CODE)

Customer Retention and Interoperability Research
Prepared for: Ofcom 152
QI6 ASK ALL Which option applies to your household for the total annual household income from
all sources before tax and deductions? SINGLE CODE
Per month (approx.)
Per Year
A Up to £950 Under £11,500
1
B £950 - £1,450
£11,500 - £17,499
2
C £1,450- £2,500
£17,500 - £29,999
3
D £2,500 - £4,200
£30,000 - £49,999
4
E £4,200 or over
£50,000 or over
5
Don’t know 6 Refused 7
QI7 ASK ALL Which of these groups best describes you? Please just read out the letter that applies
to you. SINGLE CODE
WHITE British English Scottish Welsh Irish Any other white background (WRITE IN) MIXED White and Black Caribbean White and Black African White and Asian Any other mixed background (WRITE IN) ASIAN AND BRITISH ASIAN Indian Pakistani Bangladeshi Any other Asian background (WRITE IN) BLACK AND BLACK BRITISH Caribbean African Any other black background (WRITE IN) MIDDLE EAST AND ARABIC ORIGIN Middle Eastern, including Arabic origin Iranian

Customer Retention and Interoperability Research
Prepared for: Ofcom 153
CHINESE OR OTHER ETHNIC GROUP Chinese Any other background (WRITE IN) Refused
QI8 ASK ALL And which of these options applies to your home? SINGLE CODE
Being bought on mortgage Owned outright by the household Rented from Local Authority/ Housing Association/ Trust Rented from Private Landlord Other (WRITE IN AND CODE 5) Don’t know
QI9 ASK ALL We may wish to contact you in the future for research purposes around your use of
technology on behalf of Ofcom. Would you be willing to be re-contacted?
Yes No
THANK AND CLOSE

Customer Retention and Interoperability Research
Prepared for: Ofcom 154
Appendices
C. Methodology
Research design: initial qualitative stage
A small scale piece of qualitative research was conducted initially, in order to inform the design of the quantitative stage, in terms of both the sample structure and the content of the questionnaire. This stage of the research comprised a series of 10 focus groups with actual/attempted ‘switchers’ and 10 in-home depth interviews with social networkers, with the following profiles respectively:
Group Number
Group Profile
Whether Switched
Region
1 Pay TV owners (i.e. have BT Vision, Sky, Virgin)
Yes London
2 Pay TV owners (i.e. have BT Vision, Sky, Virgin)
No Scotland
3 Dual play bundle (i.e. telephone & broadband with same supplier)
Yes Northern Ireland
4 Dual play bundle (i.e. telephone & broadband with same supplier)
No Wales
5 Triple play bundle (i.e. telephone, broadband and pay TV with same supplier)
Yes Scotland
6 Triple play bundle (i.e. telephone, broadband and pay TV with same supplier)
No Wales
7 Mobile pay-monthly customers (i.e. have contracts with range of network providers and use operating devices – e.g. iPhone, Android, Blackberry, Microsoft)
Yes England (non- London)
8 Mobile pay-monthly customers (i.e. have contracts with range of network providers and use operating devices – e.g. iPhone, Android, Blackberry, Microsoft)
No Northern Ireland
9 Techies (i.e. early adopters of technology who have electronic devices such as iPhone, tablets, E-readers, games consoles)
Yes London
10 Techies (i.e. early adopters of technology who have electronic devices such as iPhone, tablets, E-readers, games consoles)
No England (non- London)

Customer Retention and Interoperability Research
Prepared for: Ofcom 155
Depth Number
Depth Profile
1-5 Facebook loyalists
Use Facebook every day and only use other social network sites occasionally
6-10 Facebook promiscuous
Usage of Facebook has diminished in the last 12 months and use other social network sites regularly (e.g. LinkedIn, Twitter, Flickr and Pinterest)
Research design: main quantitative stage
The main quantitative stage of the research programme comprised an online survey conducted via a consumer panel.
The initial screening survey to identify qualifying respondents was conducted with a representative sample of 7,497 residential consumers in the UK, across key social demographic variables (age, gender and socio-economic grade) and GORs.
The research utilised a stratified random sampling approach to ensure that a representative sample was drawn from the consumer panel database. Hard quotas were set on all of the above variables to ensure that the profile of the achieved sample was in line with that of the UK population overall.
The research targeted the person responsible for making decisions on communications services within the household.
Eligibility for the main survey was determined on the basis of ‘active participation’ in relation to a particular telecoms service. Specifically, in order to qualify for interview, respondents had to have switched communications provider in the last 2 years, or actively considered switching communications provider in the last 12 months but decided against it, in relation to one of the following four services:
A pay-monthly mobile phone service
One or more services within a Dual Play bundle (landline/fixed line phone and fixed broadband)
One or more services within a Triple Play bundle (landline/fixed line phone, fixed broadband and Pay TV)
A current Standalone Pay TV service (where this service has been purchased as a standalone service, not in a bundle with any other service(s)).
A total of 2612 residential consumers qualified for the main survey on this basis. This sample size was chosen to be robust at the total sample level, while also delivering readable bases on key variables for a robust subgroup analysis to be undertaken.
For quota purposes, respondents were allocated to one of these four service areas only, either as a Switcher or as a Considerer. As such, even if they qualified for more than one group (for
Customer Retention and Interoperability Research
Prepared for: Ofcom 156
example, they could have qualified as a dual play switcher and a Standalone Pay TV considerer), they were allocated to only one quota group and answered questions on only that service.
A separate ‘boost’ survey was conducted with an additional 1,010 telecoms decision makers who had ‘actively considered switching’ one or more of the services noted above. This ensured a minimum of 200 customers of each of nine key providers (BT, O2, Orange, Sky, Talk Talk/CPW, '3', T-Mobile, Virgin, Vodafone) within the total combined sample, and allowed detailed analysis of efforts to win back defecting customers on a communications provider by communications provider basis.
Questionnaire
The initial screening questionnaire was 6-8 minutes in length and consisted entirely of closed-end (yes/no, rating scale) questions. The main questionnaire was 20-25 minutes in length and consisted mainly of closed-ended questions, with a limited number of open-ended questions also included. The boost questionnaire was 10-12 minutes in length and consisted entirely of closed-end questions, covering the screening and save questions only. The full questionnaire used in this survey can be found in Appendix B.
Fieldwork for the main sample took place between 13th and 25th November, 2012.
Fieldwork for the boost sample took place between 21st December 2012 and 7th January 2013.
Weighting and analysis
The screening data were weighted by age, gender, social class and region to ensure that the overall sample of 7497 interviews was representative of the profile of UK residential consumers – thereby ensuring the representativeness of the main, qualifying sample of 2612 switchers and considerers in each of the pay-monthly Mobile, Pay TV, Dual-Play and Triple-Play markets. Weighting targets were identified based on the 2001 census.
Sub-group analysis has been conducted for this report, with a particular focus on Switchers and Considerers in each of the pay-monthly Mobile, Dual-Play, Triple-Play and Standalone Pay TV markets, based on the following definitions:
Service Areas
Pay-monthly Mobile: on a pay-monthly contract (post-pay) that is personally used and paid for
Dual Play: have fixed line phone AND fixed broadband internet access in a bundle or package from the SAME supplier
Triple Play: have fixed line phone AND fixed broadband internet access AND pay TV service in a bundle or package from the SAME supplier
Standalone Pay TV: have Pay TV but not bundled with other services (respondent may have other services but with different suppliers)
Market participation
Switchers: changed communications provider for one of the following four services in the last 2 years (the last 12 months and last 13-24 months are split out where base sizes allow)
Considerers: actively considered changing communications provider for one of the following four services in the last 12 months but decided against
– A current pay-monthly mobile phone service
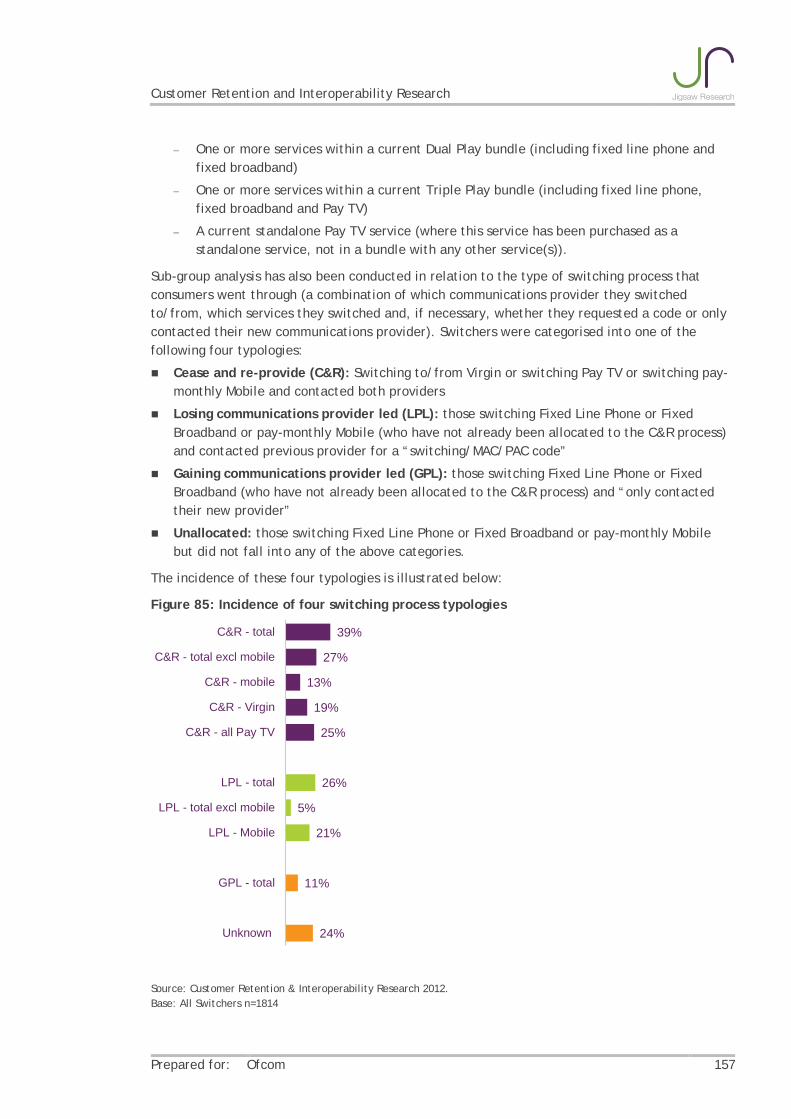
Customer Retention and Interoperability Research
Prepared for: Ofcom 157
– One or more services within a current Dual Play bundle (including fixed line phone and fixed broadband)
– One or more services within a current Triple Play bundle (including fixed line phone, fixed broadband and Pay TV)
– A current standalone Pay TV service (where this service has been purchased as a standalone service, not in a bundle with any other service(s)).
Sub-group analysis has also been conducted in relation to the type of switching process that consumers went through (a combination of which communications provider they switched to/from, which services they switched and, if necessary, whether they requested a code or only contacted their new communications provider). Switchers were categorised into one of the following four typologies:
Cease and re-provide (C&R): Switching to/from Virgin or switching Pay TV or switching pay-monthly Mobile and contacted both providers
Losing communications provider led (LPL): those switching Fixed Line Phone or Fixed Broadband or pay-monthly Mobile (who have not already been allocated to the C&R process) and contacted previous provider for a “switching/MAC/PAC code”
Gaining communications provider led (GPL): those switching Fixed Line Phone or Fixed Broadband (who have not already been allocated to the C&R process) and “only contacted their new provider”
Unallocated: those switching Fixed Line Phone or Fixed Broadband or pay-monthly Mobile but did not fall into any of the above categories.
The incidence of these four typologies is illustrated below:
Figure 85: Incidence of four switching process typologies
Source: Customer Retention & Interoperability Research 2012. Base: All Switchers n=1814
39%
27%
13%
19%
25%
26%
5%
21%
11%
24%
C&R - total
C&R - total excl mobile
C&R - mobile
C&R - Virgin
C&R - all Pay TV
LPL - total
LPL - total excl mobile
LPL - Mobile
GPL - total
Unknown

Customer Retention and Interoperability Research
Prepared for: Ofcom 158
NOTE: The profiles of the Fixed Line Phone and Fixed Broadband ‘LPL’ and ‘GPL’ categories show some differences in terms of the services that were switched. LPL Switchers are more likely to have changed their Fixed Broadband provider, whereas GPL Switchers are more likely to have changed their Fixed Line Phone provider:
Losing communications provider led (LPL LL/BB)*: 21% switched Fixed Broadband only, 6% switched Fixed Line Phone only and 71% switched both Fixed Line Phone and Fixed Broadband
Gaining communications provider led (GPL): 10% switched Fixed Broadband only, 31% switched Fixed Line Phone only and 59% switched both Fixed Broadband and Fixed Line Phone
– *The C&R and LPL categories include some Mobile switchers at an overall level, however the Mobile and Fixed Line Phone/Broadband data has been split out within our detailed subgroup analysis.
Where sub-group differences are reported they are statistically significant to a 95% confidence level based on the effective sample (equivalent to 99% confidence level). Effective sample size gives the number of respondents in the sample that would have fallen into each subgroup if a totally fair sampling method (known as simple random sampling) had been used. The effective sample size for each subgroup is usually smaller than the total number of respondents actually sampled, as it is in this case.
To determine the relative importance of the various elements that drive purchase decisions in these markets, a simple trade-off approach was adopted (Maximum Difference Scaling - or MaxDiff). Rather than measuring importance directly, by presenting all elements in one question and asking respondents to assign each one a rating to indicate their importance, Max Diff techniques, otherwise known as best/worst scaling, provide an indirect measure of importance, by asking respondents to evaluate different elements in different combinations. For each combination, respondents are asked indicate which of the elements in the combination is the most important and which is the least important, as the follow example illustrates. The resulting scores are reported on a 0 to 100 scale.
Research partners
The research was designed, managed and reported by the market research consultancy Jigsaw Research, on behalf of Ofcom.
The online survey was hosted by Jigsaw’s partner for panel research, Research Now.

Customer Retention and Interoperability Research
Prepared for: Ofcom 159
Both Jigsaw Research and Research Now are members of the UK Market Research Society (MRS), All work was carried out under the Code of Conduct of the MRS, ensuring that all responses were treated in the strictest confidence, and anonymity guaranteed for the companies taking part.
This report focuses on the main findings from the quantitative research. The key findings from the qualitative stage are also included in this report to help interpret the quantitative findings.