Customer Relationship Management Scale for the ... - · PDF file1 Customer Relationship...
15
1 Customer Relationship Management Scale for the Business-to-Consumer Market: Validation in the United States and comparison to Brazilian Models Autoria: Gisela Demo, Késia Rozzett ABSTRACT Given the strategic relevance of Customer Relationship Management (CRM) for organizations nowadays and the lack of instruments customized for the business-to- consumer (B2C) market in general, the main objective of this study is to develop and validate a reliable and valid CRM scale for the B2C market. Besides, we compared Brazilian and American models for the proposed scale. Three studies have been conducted with different samples for the development and validation of the Customer Relationship Management Scale (CRMS). This research is a starting point to provide a comprehensive measure of CRM based on customers’ perspectives to help managers establish profitable relationships.
Transcript of Customer Relationship Management Scale for the ... - · PDF file1 Customer Relationship...
1
Customer Relationship Management Scale for the Business-to-Consumer Market: Validation in the United States and comparison to Brazilian Models
Autoria: Gisela Demo, Késia Rozzett
ABSTRACT Given the strategic relevance of Customer Relationship Management (CRM) for organizations nowadays and the lack of instruments customized for the business-to-consumer (B2C) market in general, the main objective of this study is to develop and validate a reliable and valid CRM scale for the B2C market. Besides, we compared Brazilian and American models for the proposed scale. Three studies have been conducted with different samples for the development and validation of the Customer Relationship Management Scale (CRMS). This research is a starting point to provide a comprehensive measure of CRM based on customers’ perspectives to help managers establish profitable relationships.
2
1. INTRODUCTION The main authors of Customer Relationship Management (CRM) (McKenna, 1999;
Ngai, 2005; Payne, 2006; Vavra, 1993; Wilson & Vlosky, 1997) agree on the relevance of managing the relationship between organizations and its customers. Thus the adaptation of the organizational capacity to detect opportunities in the market and the constant effort of companies on establishing long term relationships with its business partners, especially with its customers, has been established as a priority on enterprises (Demo & Ponte, 2008).
Considering both the strategic relevance of CRM for organizations nowadays, and the lack of measuring scales customized for the B2C market as well as the importance of validating a scale in different countries for improved generalizability, the main objective of this study is to validate the Customer Relationship Management Scale (CRMS) in the United States (US), based on the previous CRM scales that Rozzett and Demo (2010, 2011) developed and validated in Brazil. Some CRM scales were found in the literature (e.g., Wilson & Vlosky, 1997; Sin, Tse & Yim, 2005; Öztaysi¸ Sezgin and Özok, 2011) but none focused on the customer’s relationship marketing perception in the B2C market in general.
Furthermore, if the CRMS shows theoretical consistency and also good psychometric indexes when validated in a different country (US), it will be a psychometrically and operationally valid measure to be used in relational studies from both Marketing and Consumer Behavior fields. Additionally, it could be used as a diagnostic tool to identity CRM aspects where specific improvements are needed, as well as an instrument of evaluation to help managers better understand how to meet client’s needs and deliver high-value products and services.
2. THEORETICAL BACKGROUND Grönroos (1994), Sheth and Parvatiyar (2002), and Payne (2006) agreed that
relationship marketing represents a paradigm shift on marketing concepts, a change on marketing orientation from just attracting customers to having customer’s retention and loyalty. For Payne (2006), CRM provides opportunities to use information, know clients better, offer value by customized sales and develop long-term relationships. The company should have know-how on processes, operations and integration in order to allow that the core of marketing become the philosophy that guides the business. This vision confirms the holistic idea of relationship marketing, where there is interaction among all parts of the organization.
Vavra (1993) also considers the attraction of customers as the beginning of the relationship. The constant after marketing interaction represents an extremely important stage that allows the relationship to be settled, being as important as the sale itself. He defends that customer retention is far more important than customer attraction and that there may be a shift from just selling to beginning a relationship. These shifts reflect the transition from the transactional marketing to the relationship one.
On the same line, McKenna (1999) presents a strategic relationship marketing approach placing the customer in first and changing the marketing role of manipulating customers to making a real commitment with them. The author emphasizes the retention of profitable customers, multiple markets and an approach regarding multifunctional marketing, in which the responsibility for marketing strategies development and relationship with the customer is not limited to the marketing department only. According to Reichheld and Sasser (1990, pp.105), as the relationship between the organization and the customer extends the profits grow. Due to the large increase in competition and the constant technological improvement, customers have a much larger range of choices in comparison to what they previously had.

3
For Payne (2006), CRM is a strategic holistic approach to manage the relationship with customers in order to create value to the stockholder. He states that although CRM provides more opportunities to understanding the customer through data and info utilization and to implementing the relationship marketing strategies in a better way, it is not limited to an information system or a technologic tool. The author stresses that the importance of defining CRM correctly is not a semantic preciousness. Such definition significantly impacts the way CRM is understood, implemented and practiced in organizations.
Payne (2006) highlights that CRM needs to be infused with strategic vision to create value to the stockholder through the development of relationships with strategic customers, bringing together the potential of information technology (IT) to the relationship marketing strategies that will result in the establishment of profitable long-term relationships.
Huang and Xiong (2010) notice that CRM has reached a strategic maturity and it influences the entire cycle of life of a product and not only the before or after-sales stages. Still on the enlargement of CRM influence, Ernst, Hoyer, Krafft and Krieger (2011) sustain that its potential has been only investigated on already existent products cases, but it should be considered on the development of new products as well, once their studies showed that CRM has a positive correlation with performance and success of new products.
Also considering that corporative culture has not been sufficiently studied on relationship marketing, Iglesias, Sauquet and Montaña (2011) presented a model of corporative culture from a CRM-oriented organization. The results showed two primary factors needed for its effectiveness: “client orientation” and “high level of care for employees”. Moreover, other six shared values (confidence, involvement, teamwork, innovation, flexibility and results orientation) also would facilitate the orientation development towards relationship marketing.
As for literature reviews regarding CRM, Ngai’s (2005) first article was considered a milestone regarding the academic literature about customer relationship marketing. It analyzed 205 articles in different databases published in over 85 different academic reviews from 1992 to 2002. Ngai’s (2005) study concluded for the force of CRM research, questioning about the low percentage of theoretical reviews related to CRM privacy, and predicting that the field would continue to present significant growth during the next years.
The most recent reviews were from Ngai, Xiu and Chayu (2009) and Wahlberg et al. (2009). Ngai, Xiu and Chayu (2009) wrote the first academic review on the application of data mining techniques for CRM. The article provides an academic database of the literature from 2000 to 2006 that comprehends 24 scientific journals and proposes a classificatory scheme that comprises 900 articles, which were identified and analyzed regarding the direct relevance for the application of data mining techniques for CRM.
The categorization done by Ngai, Xiu and Chayu (2009) took into account 4 CRM dimensions (customer identification, customer attraction, customer retention and customer development) as well as 7 data mining functions (association, classification, cluster, prediction, regression, discovery of sequential patterns and visualization). The results showed that customer retention is the most researched area of all and the one-to-one marketing and loyalty programs are the most investigated themes. On the other hand, models of classification and association are the most commonly used in data mining regarding CRM.
4
Wahlberg et al. (2009) contributed to the CRM research knowledge by questioning the evolution of CRM research through time and identifying trends and research topics from 4 investigation areas: strategic CRM, analytical CRM, operational CRM and collaborative CRM. 468 articles were selected and the results showed that the number of articles about CRM as a specific topic was relatively low until the end of the nineties, exactly as pointed by Ngai (2005), which confirms the aspect of novelty CRM holds on marketing research.
According to, Wahlberg et al. (2009), the results showed maturity in the CRM scientific research field, dominated by CRM subfields of strategic and analytic CRM, including a change from analytic to strategic CRM, which was the most popular by the end of the studied period of time. Another conclusion withdrawn from the study was the predominance of the research on big companies at the expense of medium and small businesses whose characteristic must be taken into account.
Concerning CRM measures, we found some studies with scale validation that were mostly based in 4 measurement scales. First, Wilson and Vlosky (1997) developed a CRM scale for the business-to-business (B2B) market. Sin, Tse and Yim (2005) validated a scale to measure the CRM dimensions practiced by the companies in the financial service sector of Hong Kong. Harmeen and Sandhu (2008) developed a scale for CRM applied to manufacturing industries in India. More recently, Öztaysi¸ Sezgin and Özok (2011) proposed an instrument for the measurement of CRM processes in Turkey that addresses seven different processes.
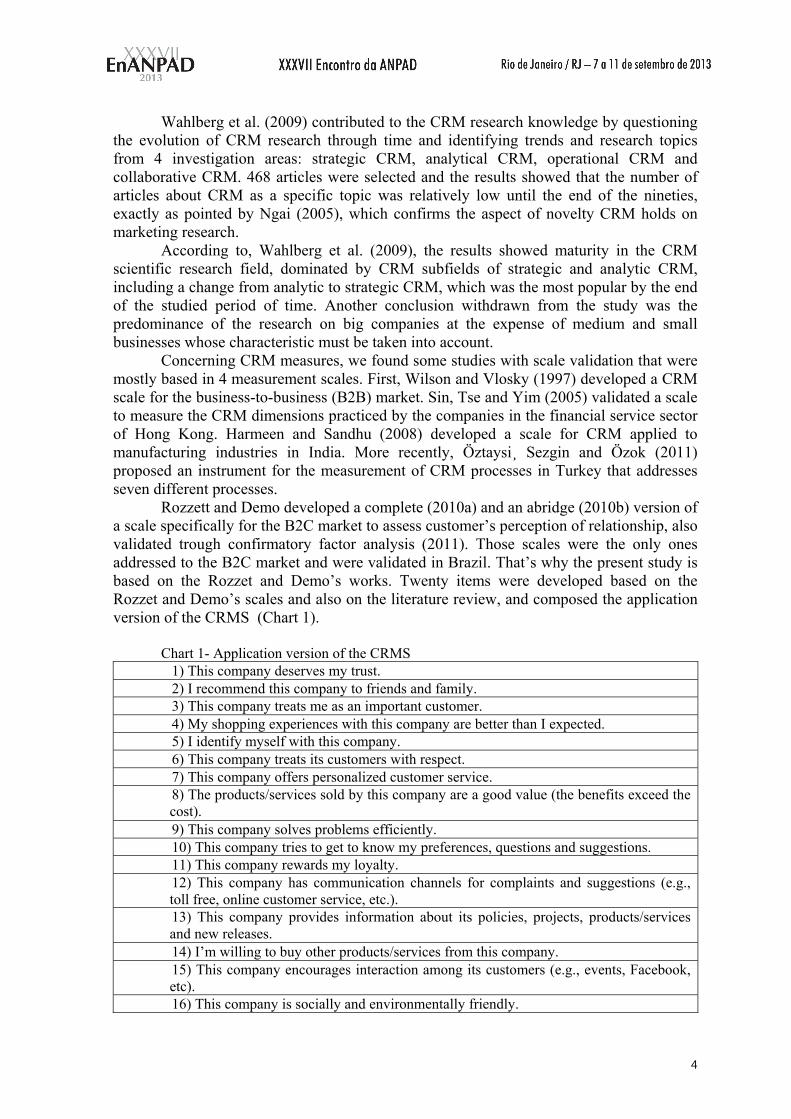
Rozzett and Demo developed a complete (2010a) and an abridge (2010b) version of a scale specifically for the B2C market to assess customer’s perception of relationship, also validated trough confirmatory factor analysis (2011). Those scales were the only ones addressed to the B2C market and were validated in Brazil. That’s why the present study is based on the Rozzet and Demo’s works. Twenty items were developed based on the Rozzet and Demo’s scales and also on the literature review, and composed the application version of the CRMS (Chart 1).
Chart 1- Application version of the CRMS 1) This company deserves my trust. 2) I recommend this company to friends and family. 3) This company treats me as an important customer. 4) My shopping experiences with this company are better than I expected. 5) I identify myself with this company. 6) This company treats its customers with respect. 7) This company offers personalized customer service. 8) The products/services sold by this company are a good value (the benefits exceed the cost). 9) This company solves problems efficiently. 10) This company tries to get to know my preferences, questions and suggestions. 11) This company rewards my loyalty. 12) This company has communication channels for complaints and suggestions (e.g., toll free, online customer service, etc.). 13) This company provides information about its policies, projects, products/services and new releases. 14) I’m willing to buy other products/services from this company. 15) This company encourages interaction among its customers (e.g., events, Facebook, etc). 16) This company is socially and environmentally friendly.
5
17) This company has good facilities (either physical, in case of stores, or virtual, in case of websites). 18) There are a few competitors to this company that have the same importance to me.
19) This company offers convenience to its customers (e.g., online services, home delivery, 24-7 customer service). 20) The products/services sold by this company are high quality.
3. METHODS This section will detail the three studies conducted for the development and
validation of the Customer Relationship Management Scale in the United States (US). For such purpose, three different American samples were collected online using MTurk in order to ensure the presence of a broad variety of American customers. This diversification indicates sampling variability and representativeness.
Data from study 1 (N=210) were used to select items based on EFA. Then, CFA was used on data obtained in study 2 (N=425) to examine factor structure, as well as to provide construct validity through convergent validity. Scale reliability was assessed by Cronbach’s alpha on EFA and Jöreskog’s rho on CFA. Data from study 3 (N=415) were used to test the scale generalizability.
3.1 EXPLORATORY FACTOR ANALYSIS Data were collected from 210 employees of various organizations. Of the
employees, 65% were male, 63% were White or Caucasian, 55% were under the age of 26, 49.5% had a Bachelor degree, 43.5% had been customers of the companies chosen between 1 and 5 years, and 67% purchase from the companies chosen on a weekly (33%) or monthly (34%) base.
The data were examined (searched for incorrect values, missing data and outliers) and the assumptions for multivariate analysis were checked, following the procedures recommended by Tabachnick and Fidell (2007) and Hair et al. (2009). The final sample counted then with 200 subjects. Hair et al. (2009) say that for an adequate sample size, it is necessary to have between 5 and 10 individuals for each item of the instrument. Nonetheless, the authors state that any factor analysis with less than 200 individuals can hardly be considered suitable. The sample size with 200 subjects attended, therefore, both criteria.
In order to perform the EFA, the correlation matrix, the matrix determinant and the results of the Kaiser-Meyer-Olkin (KMO) sampling adequacy test were analyzed regarding factorability. For factor extraction, Principal Components Analysis (PCA) was used. Once the matrix was considered factorable, the eigenvalues, percentage of explained variance of each factor, scree plot graphic and parallel analysis were then examined in order to determine the quantity of factors to be extracted.
After defining the quantity of factors, a Principal Axis Factoring (PAF) analysis was run using Promax rotation - since correlation among factors was expected, which is common in behavioral phenomena. Cronbach’s alpha was used to check the reliability of each factor.
3.2 CONFIRMATORY FACTOR ANALYSIS Data were collected from 425 employees of several companies. Of the employees,
64% were male, 55% were White or Caucasian, 45.5% were between 26 and 40 years-old, 48% had a Bachelor degree, 42% had been customers of the companies chosen between 1 and 5 years, and 49% purchase from the companies chosen on a monthly base.
The data were examined and the assumptions for multivariate analysis were
6
checked, following the procedures recommended by Myers (1990), Menard (2002), Tabachnick and Fidell (2007) and Hair et al. (2009). The final sample counted then with 403 subjects. Byrne (2009) and Kline (2011) state that for a CFA, an adequate sample size would be 20 subjects for variable. On the other hand, Hair et al (2009) state that a minimum of 200 individuals is always required whereas samples much larger than 400 could make the method very sensitive.
Then, sample sizes between 200 and 400 are recommended. The sample size with 403 subjects attended, therefore, all the criteria cited.
To determine which structure adjusts better to CRMS, its fit was evaluated by using AMOS through the following indexes: NC (normatized chi-square or chi-square value divided by the model’s degrees of freedom = CMIN/DF), CFI (Comparative Fit Index) and RMSEA (Root Mean Square Error of Approximation), as recommended by Kline (2011).
3.3 RELIABILITY ASSESSMENT AND CONSTRUCT VALIDITY Reliability in the confirmatory analysis was measured through composite
reliability, also known as Dillon-Goldstein’s rho or Jöreskog’s rho, as proposed by Chin (1998). Dillon-Goldstein’s rho is a better reliability measure than Cronbach’s alpha in Structural Equation Modeling, since it is based on the loadings rather than the correlations observed between the observed variables. Finally, construct validity was examined in this study through convergent validity (Hair et al., 2009).
3.4 SCALE GENERALIZABILITY Data were collected from 415 people of many companies. Of the employees, 61%
were male, 70% were White or Caucasian, 48% were under the age of 26, 50% had a Bachelor degree, 41.4% had been customers of the companies chosen between 1 and 5 years, and 41% affirmed they purchase from the companies chosen on a monthly basis.
The data were examined and the assumptions for multivariate analysis were checked, following the procedures recommended by Myers (1990), Menard (2002), Tabachnick and Fidell (2007) and Hair et al. (2009). The final sample counted with 404 subjects. Byrne (2009) and Kline (2011) state that for a CFA, an adequate sample size would be 20 subjects for variable. On the other hand, Hair et al. (2009) state that a minimum of 200 individuals is always required whereas samples much larger than 400 could make the method very sensitive. So, sample sizes between 200 and 400 are recommended. The sample size with 403 subjects attended both criteria. Data from this study were used to test the scale generalizability by conducting a replicative analysis on the measurement model used in study 2.
4 RESULTS This section presents the results of exploratory factor analysis, confirmatory factor
analysis, construct validity and scale generalizability. 4.1 EXPLORATORY FACTOR ANALYSIS The analyses’ results confirmed the matrix high factorability to perform the
exploratory factor analysis. KMO was 0.931, classified by Kaiser (1974) as marvelous. The determinant of the matrix was extremely close to zero indicating that the number of factors is lower than the number of items. Through Principal Components Analysis, it was possible to decide how many factors would be extracted. The analysis of the criteria adopted (eigenvalues higher than 1.0, explained variance percentage of each factor above 3%, scree plot graphic visual analysis and parallel analysis) brought us to a one-factor solution, with a possibility of a two factors solution, according to the eigenvalues and
7
explained variance percentage criteria. By running the Principal Axes Factoring (PAF) analysis for two factors, a high-
significant correlation between them (r = 0.744) was found, indicating the presence of a second order factor. Hence, the one-factor solution was chosen. After 4 iterations, only 14 items remained from the 20 original items. Thus, the CRMS resulted in a one-factor instrument with 14 items. All the items were measured with a five-point Likert-type scale ranging from 1 = “strongly disagree” to 5 = “strongly agree”.
The items are compatible with the theoretical review done, explaining 50% of the construct’s total variance, which can be considered worthy, especially for one-factor structures. The validity or quality of the items that composed each factor was also analyzed. Considering that a valid item is the one that well represents the factor, that is, an item with a good factor loading, the minimum acceptable load was .50 (Hair et al, 2009).
Comrey and Lee (1992) classified items with loadings higher or equal .71 as excellent; higher or equal .63 as very good; higher or equal .55 as good; higher or equal .45 as reasonable; and higher or equal .32 as poor. Thus, as to the items’ quality, 100% of them were classified as excellent, very good and good.
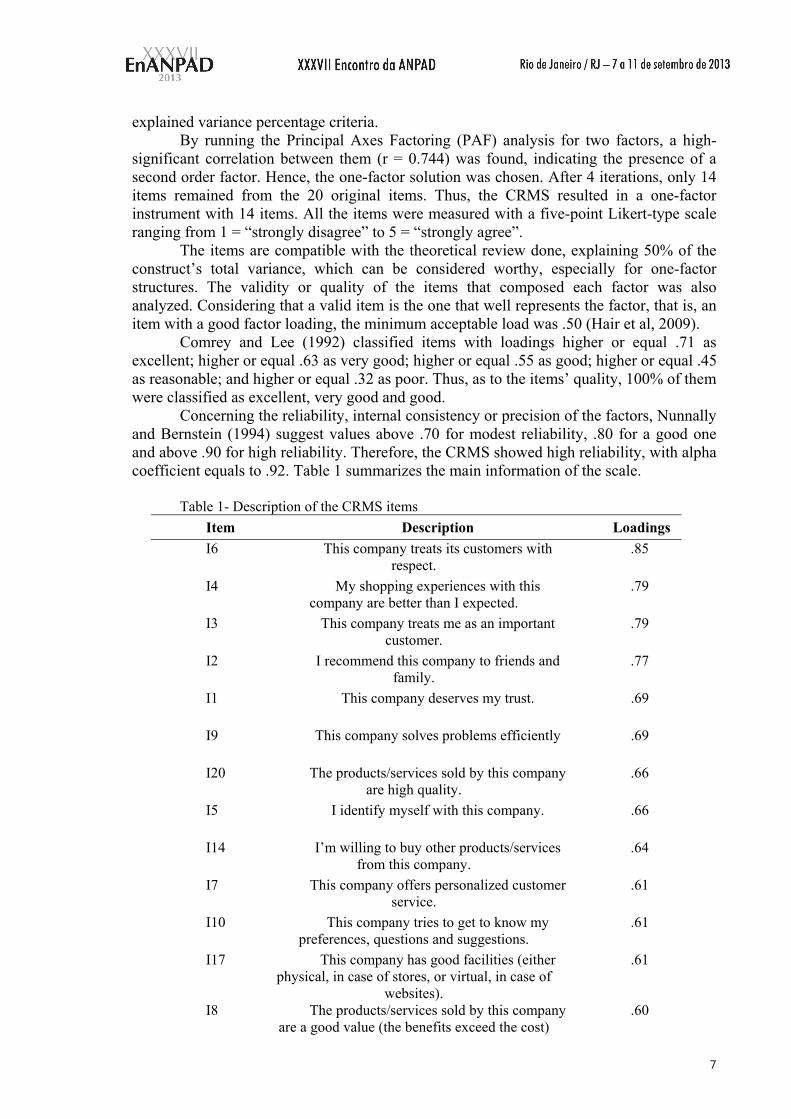
Concerning the reliability, internal consistency or precision of the factors, Nunnally and Bernstein (1994) suggest values above .70 for modest reliability, .80 for a good one and above .90 for high reliability. Therefore, the CRMS showed high reliability, with alpha coefficient equals to .92. Table 1 summarizes the main information of the scale.
Table 1- Description of the CRMS items
Item Description Loadings I6 This company treats its customers with
respect. .85
I4 My shopping experiences with this company are better than I expected.
.79
I3 This company treats me as an important customer.
.79
I2 I recommend this company to friends and family.
.77
I1 This company deserves my trust. .69
I9 This company solves problems efficiently .69
I20 The products/services sold by this company are high quality.
.66
I5 I identify myself with this company. .66
I14 I’m willing to buy other products/services from this company.
.64
I7 This company offers personalized customer service.
.61
I10 This company tries to get to know my preferences, questions and suggestions.
.61
I17 This company has good facilities (either physical, in case of stores, or virtual, in case of
websites).
.61
I8 The products/services sold by this company are a good value (the benefits exceed the cost)
.60

8
I11 This company rewards my loyalty. .55
Note: total variance explained = 50%; total of items = 14 items. By comparing the CRM scales (both complete and abridged versions) validated in
Brazil and the CRMS validated in US, regarding reliability, number of items and validity, it’s possible to see similar parameters, as shown on Table 2, driving us to the conclusion that the one-factor structure validated in two different versions in Brazil remained stable when validated in a different country, being suitable for application in US organizations.
Table 2 - Comparison among Brazilian and American CRM Scales
Scales/Parameters CRMS BRAZILcomplete version
CRMS BRAZIL abridged version CRMS US
Reliability α=.93 α=.92 α=.92 Number of items 20 8 14 Quality of items 70% classified as
excellent, very good and good
100% classified as excellent and very good
100% classified as excellent, very good and good
Total variance explained 40% 64% 50%
4.2 CONFIRMATORY FACTOR ANALYSIS According to Kline (2011), values that indicate satisfactory adjust for a model are:
for NC (CMIN/DF), values 2.0 or 3.0 or, at most, up to 5.0; for CFI, values higher than .90 and for RMSEA, values lower than .05 or up to .08. The one-factor structure model showed 43 parameters, with χ2(77) = 256.02, p<0.001 or NC=3.32; CFI =.95; RMSEA=.07 (confidence interval from .06 to .08). Hence, the model has provided a satisfactory fit, confirming the structure obtained trough the exploratory factor analysis. The factor loadings of the items in this confirmatory validation were between .58 and .84, showing high-quality items, according to Comrey and Lee (1992).
The result of this analysis suggested that CRM for the American customers is a unidimensional construct. It is important to emphasize that, in the confirmatory analysis, the same one-factor structure of 14 items were kept, in agreement with the reviewed literature and with the exploratory validation, such that the interpretation of the items is the same displayed in Table 1. At last, the originated results confirmed the CRMS’ validation by showing the conceptual suitability of the structure obtained in the exploratory analysis and satisfactory fit (Figure 1).

9
Figure 1: CRM Latent Variable By comparing the fits provided in the Brazilian models (complete and abridged
versions of the CRM scale) to the fit obtained in the American sample, we observe, in general, better fit and indexes in the American model with 14 items. In addition, chi-square difference was significant, indicating that the American model outperformed indeed the Brazilian ones. Table 3 shows this comparison.
Table 3 - Comparison of the Brazilian and American models for CRM
MODELS/ PARAMETERS
BRAZILIAN COMPLETE
MODEL (20 items)
BRAZILIAN ABRIDGED
MODEL (8 items)
AMERICAN MODEL (14 items)
CMIN or χ2 (p) 757.84 (p<0.001)
138.43 (p<0.001) 256.02 (p<0.001)
Df 170 20 77
NC (χ2/df) 4.46 6.92 3.32
RMSEA .08 0.10 .07
CFI .90 0.96 .95
Δχ2 Δχ2(93)
= 501.82, p<0.001 Δχ2(57)
= 117,59, p<0.001 4.3 RELIABILITY ASSESSMENT AND CONSTRUCT VALIDITY To assess the reliability of the CRM scale, Jöreskog’s rho was computed. Chin
(1998) recommends that acceptable scores for the Jöreskog’s rho should be higher than 0.7. The result was very satisfactory, presenting a � = .94. Construct validity is the degree to which a set of measured items actually reflects the theoretical latent construct that those items are supposed to measure (Hair et al, 2009).
In this study, the construct validity of the CRMS was examined by assessing convergent validity. Convergent validity refers to the degree of agreement in two or more measures of the same construct. According to Hair et al. (2009), there are several indicators of convergent validity, for example, examining factor loadings, the reliability of

10
the factors and the variance extracted. As previous results have shown, the reliability of the one factor was above �=.70, specifically �=.94, indicating appropriate convergence (Hair et al., 2009).
In addition, all items of the CRM measure loaded significantly positive on their specified factor (see Figure 1). Moreover, all 14 items had loadings over .5 (Hair et al., 2009), which is indeed a test of convergent validity of the scale. Finally, according to Hair et al. (2009), variances extracted over .5 (or 50%) are a good rule suggesting appropriate convergence. The extracted variance for the CRMS was .53 (or 53%), attesting convergent validity.
4.4 SCALE GENERALIZABILITY Even though our proposed factorial structure has a good fit with the data (Figure 1)
and we have used a broad sample from various American costumers, we recognize that the results could be specific to this particular sample. Although it can be said that the sample represents a cross-section of a large number of customers, the generalizability of the CRMS could be still questionable. To provide evidence on generalizability of CRMS, a replicative study on a wide and different sample is essential. Then, we use the measurement model shown on Figure 1 with the study 3’s sample to test the scale generalizability.
As far as the measurement model is concerned, the data in this study exhibit a satisfactory level of fit with 43 parameters (χ2(77)=275.31, p<0.001; NC=3.57; CFI =.94; RMSEA =.08) and is shown in Figure 2. Moreover, all 14 items were significant and loaded as predicted on their factor. These results provide further evidence to suggest that the proposed scale validated in this study is a reliable operational measure for CRM in the American culture.
Figure 2: Scale Generalizability To sum up, the results are encouraging in terms of scale generalizability. The 14-
item CRM scale proposed in this study was found to have a high degree of reliability and validity and so it can be used to properly understand what aspects American customers consider relevant in their relationship with companies in general and that might influence their shopping experiences, satisfaction and loyalty as well. These results will help both consumer behavior scientists and companies managers better understand how to meet customer’s needs in order to deliver high-value products and services and get their loyalty through a long-term and profitable relationship.
11
5 DISCUSSION This section discusses the theoretical consistency of the scale validated in the study,
academic and managerial implications of the results obtained and also points out limitations and directions for further research.
5.1 THEORETICAL CONSISTENCY OF THE CRMS This paper reports three studies conducted on the development and validation of a
measure of CRM from an American costumers’ perspective. The CRMS was found to have a high degree of reliability and construct validity. Although the numbers resulted from the previous analyses performed were very satisfactory, it is also necessary to analyze CRMS’s theoretical consistency or validity from the revised literature, verifying if the scale’s items are coherent with the theoretical concepts used to support it.
Kerlinger and Lee (2008) have said that it is not appropriate to hold an item that has only mathematic meaning, for the factor must be relevant in the scientific theoretical context. Furthermore, validity of expression must be established before any theory test when using CFA, because without an understanding of the content or meaning of each item, it is impossible to express and correctly specify a theory of measurement (Hair et al., 2009).
All items of the CRMS have theoretical support indeed, and are relevant to the customer relationship assessment. The item with the highest factor loading, regarding respectful treatment to the client, is sustained by Demo et al. (2011) who also argue that buying experiences must go beyond the mere satisfaction of customer needs. In fact, in order to exceed customer’s expectations, a company must provide experiences that positively surprise them on a recurring basis so that a long-term relationship can be established. The authors also highlight that companies should be concerned about making their customers feel important and unique and the offer of a personalized service is, in this matter, a relevant indicator. Furthermore, customers’ identification with the company can be a useful indicative of their appreciation and loyalty to it (Demo, & Ponte, 2008).
The item regarding repurchase intention was ratified as an indicator of relationship, confirming what Ravald and Grönroos (1996) and Reichheld and Sasser (1990) affirmed about repurchase intention as a loyalty index. The item related to trust endorse the ideas of authors as Brei and Rossi (2005), Sirdeshmukh, Singh and Sabol (2002), and Morgan and Hunt (1994) who discuss trust as a key point in relational exchanges and as having an important role in reducing the asymmetry in the company-customer relationship to make it long lasting. Additionally, Demo et al. (2011) argue that a company only earns customers’ confidence when their problems and demands are efficiently solved.
The item concerning recommendation of a company to friends and family, in turn, reinforces Payne’s (2006) statement that loyal customers not only buy repeatedly, but also go a step further recommending the company to new customers. Theses recommendations reduce future customers’ acquisition costs (Ravald, & Grönroos, 1996).
Moreover, Payne (2006) attests that relationships are developed to the extent that the parties know each other. Hence the importance of companies’ efforts to get to know their customers preferences, questions and suggestions. Additionally, authors such as Grönroos (1994), Sheth and Parvatiyar (2002), and Payne (2006) point out that loyalty should be rewarded – which is translated into one of the items of the scale.
Finally, items that address important aspects of the business-to-consumer relationship, as product quality, cost-effective and facilities (either physical or virtual) must be constantly evaluated as suggested by Vavra (1993) and McKenna (1999).
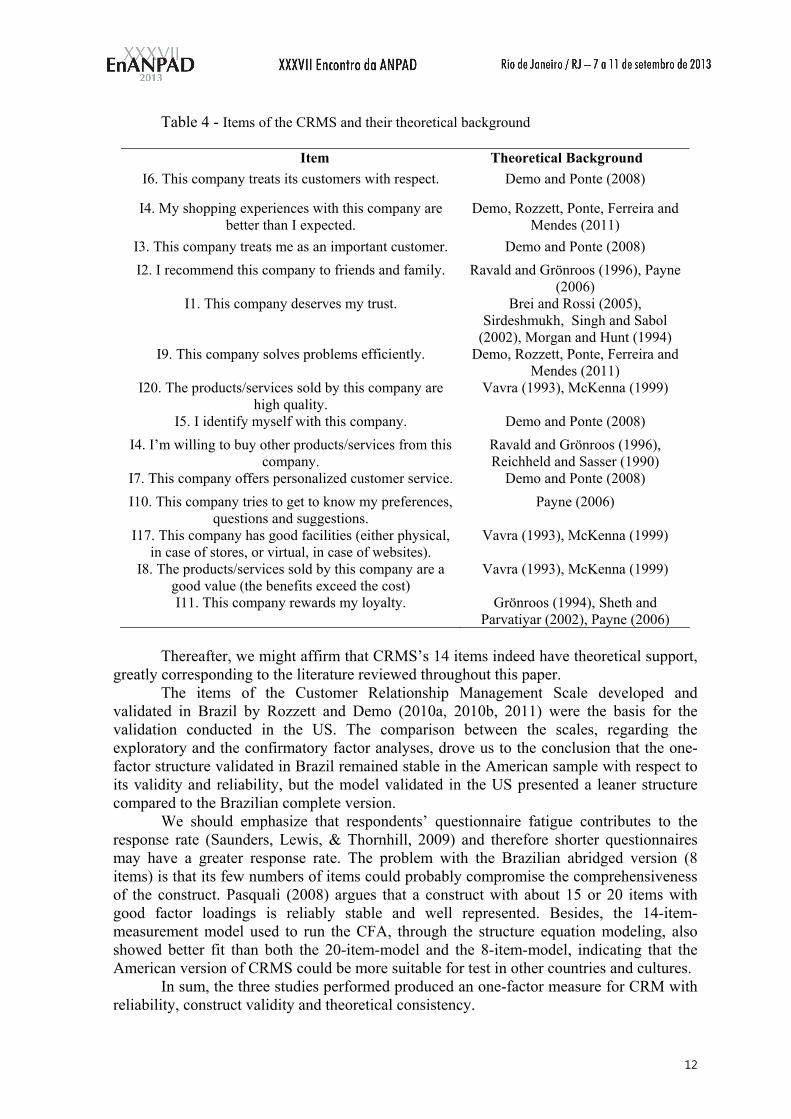
Table 4 summarizes the 14 items of the CRMS and their theoretical background.
12
Table 4 - Items of the CRMS and their theoretical background
Item Theoretical Background I6. This company treats its customers with respect. Demo and Ponte (2008)
I4. My shopping experiences with this company are better than I expected.
Demo, Rozzett, Ponte, Ferreira and Mendes (2011)
I3. This company treats me as an important customer. Demo and Ponte (2008) I2. I recommend this company to friends and family. Ravald and Grönroos (1996), Payne
(2006) I1. This company deserves my trust. Brei and Rossi (2005),
Sirdeshmukh, Singh and Sabol (2002), Morgan and Hunt (1994)
I9. This company solves problems efficiently. Demo, Rozzett, Ponte, Ferreira and Mendes (2011)
I20. The products/services sold by this company are high quality.
Vavra (1993), McKenna (1999)
I5. I identify myself with this company. Demo and Ponte (2008) I4. I’m willing to buy other products/services from this
company. Ravald and Grönroos (1996), Reichheld and Sasser (1990)
I7. This company offers personalized customer service. Demo and Ponte (2008) I10. This company tries to get to know my preferences,
questions and suggestions. Payne (2006)
I17. This company has good facilities (either physical, in case of stores, or virtual, in case of websites).
Vavra (1993), McKenna (1999)
I8. The products/services sold by this company are a good value (the benefits exceed the cost)
Vavra (1993), McKenna (1999)
I11. This company rewards my loyalty. Grönroos (1994), Sheth and Parvatiyar (2002), Payne (2006)
Thereafter, we might affirm that CRMS’s 14 items indeed have theoretical support,
greatly corresponding to the literature reviewed throughout this paper. The items of the Customer Relationship Management Scale developed and
validated in Brazil by Rozzett and Demo (2010a, 2010b, 2011) were the basis for the validation conducted in the US. The comparison between the scales, regarding the exploratory and the confirmatory factor analyses, drove us to the conclusion that the one-factor structure validated in Brazil remained stable in the American sample with respect to its validity and reliability, but the model validated in the US presented a leaner structure compared to the Brazilian complete version.
We should emphasize that respondents’ questionnaire fatigue contributes to the response rate (Saunders, Lewis, & Thornhill, 2009) and therefore shorter questionnaires may have a greater response rate. The problem with the Brazilian abridged version (8 items) is that its few numbers of items could probably compromise the comprehensiveness of the construct. Pasquali (2008) argues that a construct with about 15 or 20 items with good factor loadings is reliably stable and well represented. Besides, the 14-item-measurement model used to run the CFA, through the structure equation modeling, also showed better fit than both the 20-item-model and the 8-item-model, indicating that the American version of CRMS could be more suitable for test in other countries and cultures.
In sum, the three studies performed produced an one-factor measure for CRM with reliability, construct validity and theoretical consistency.
13
5.2 ACADEMIC AND MANAGERIAL IMPLICATIONS The present study makes both academic and managerial contributions. First, it is an
attempt to develop a model of CRM specifically designed for the B2C market in general, unattended so far. Second, empirical evidence that the CRM scale validated in the US is both reliable and valid constituting a measure that can be used in relational studies from the Marketing field was provided.
As to managerial implications, CRMS might be used as an instrument of evaluation to help managers better understand how to meet client’s needs in order to deliver high-value products and services and get their loyalty trough a long-term and profitable relationship.
Beyond, there is theoretical and empirical evidence that CRM is a critical success factor for business performance (e.g., Ryals, & Payne, 2001; Sheth, & Sisodia, 2002; Sin, Tse and Yim, 2005; Huang and Xiong’s, 2010, Ernst et al, 2011).
Consequently, the CRMS may support managers’ decision making and problem solving regarding identification of CRM areas where specific improvements are needed in order to achieve better organizational outcomes.
5.3 LIMITATIONS AND FUTURE RESEARCH DIRECTIONS The proposal of this chapter represents a first attempt to develop and test a CRM
scale designed specifically for the B2C market in general. In spite of the scale’s validation in Brazil, it would be useful to further assess the generalizability of the HRMPPS to other business environments such as European and Asian countries. Moreover, with more replicative and creative research, a more comprehensive conceptual framework related to CRM can be developed in the future.
Also, the development of a time-series database and testing of the CRM structure validated here in a longitudinal framework would provide a refinement of the scale. Continued validations of the CRMS is recommended based on further research about new CRM trends, perspectives and also contemplating changes in business environments, so that a reliable measure of CRM aspects related to the business-to-consumer market can be developed on a continual basis. In this meaning, there could be a need of alteration or even deletion of original items.
Additionally, items representing aspects of CRM very disclosed and mentioned as important in the literature could be included in further validations, such as: the existence of communication channels for customers’ complaints and suggestions (e.g., toll free, online customer service, etc), the encouragement of interaction among its customers (e.g., events, Facebook, etc), the offering of convenience to the customers (e.g., online services, home delivery, 24-7 customer service), the importance of the company be socially and environmentally friendly, if there are competitors to the company that have the same importance to its clients, the disclosure of information about the companies’ policies, projects, products/services and new releases, and so forth.
6 CONCLUSION We may conclude, in spite of the limitations pointed, that the main objective of this
study was reached and an instrument to assess what aspects American customers rank as relevant regarding CRM was produced showing theoretical consistency, reliability, construct validity. Considering the increasing research attention to the new strategic role of CRM in organizations, this study provides an operational measure of it.
The findings found here are not intended to be conclusive or limiting but offer a useful starting point from which further theoretical and empirical research of customer relationship management in the B2C market can be built.
14
REFERENCES Byrne, B. M. (2009). Structural equation modeling with AMOS: basic concepts, applications, and programming (2nd ed). New York, NY: Routledge.
Comrey, A. L., & Lee, H. B. (1992). A first course in factor analysis (2nd ed). Hillsdale, NJ: Lawrence Erlbaum Associates.
Demo, G., & Ponte, V. 2008. Marketing de relacionamento (CRM): Estado da arte e estudos de casos. Brasília, Brazil: Atlas.
Chin, W. W. (1998). The partial least squares approach for structural equation modeling. In G. A. Marcoulides (Ed.), Modern methods for business research (pp.295–236). London, England: Lawrence Erlbaum Associates.
Ernst, H., Hoyer, W., Krafft, M., & Krieger, K. (2011). Customer relationship management and company performance: the mediating role of new product performance. Journal of the Academy of Marketing Science, 39(2), 290-306.
Grönroos, C. (1994). From marketing mix to relationship marketing. Management Decision, 32(2), 4-20.
Hair, J. F., Black, W. C., Babi, B. J., Anderson, R. E., & Tatham, R. L. (2009). Análise multivariada de dados (6th ed), Porto Alegre, Brazil: Bookman.
Harmeen, S., & Sandhu, H. S. (2008). Does Customer Relationship Management affect firm performance? Global Business Review, 9(2), 189-206.
Huang, J., & Xiong, W. (2010). The effect of win-back investment on lost consumers’ intention of reinitiating relationship. Frontiers of Business Research in China, 4(3), 485-497.
Iglesias, O., Sauquet, A., & Montaña, J. (2011). The role of corporate culture in relationship marketing, European Journal of Marketing, 45(4), 631-650.
Kaiser, H. F. (1974). An index of factorial simplicity. Psychometrika, 39(1), 31–36.
Kline, R. B. (2011). Principles and practice of structural equation modeling (3rd ed). New York: The Guilford Press.
Mckenna, R. (1999). Marketing de relacionamento. Rio de Janeiro, Brazil: Campus.
Menard, S. (2002). Applied logistic regression analysis. Thousand Oaks, CA: Sage.
Myers, R. (1990). Classical and modern regression with applications (2nd ed). Boston, MA: Duxbury.
Ngai, E. W. T. (2005). Customer relationship management research (1992-2002): an academic literature review and classification. Marketing Intelligence & Planning, 23(6-7), 582-605.
Ngai, E. W. T., Xiu, L., & Chau, D. C. K. (2009). Application of data mining techniques in customer relationship management: A literature review and classification. Expert Systems with Applications, 36, 2592-2602.
Nunnally, J. C., & Bernstein, I. H. (1994). Psychometric theory (3rd ed). New York, NY: McGraw-Hill.
15
Öztaysi, B., Sezgin, S., & Özok, A. F. (2011). A measurement tool for customer relationship management processes. Industrial Management & Data Systems, 111(6), 943 – 960.
Payne, A. (2006). Handbook of CRM: Achieving excellence in customer management. Oxford: Elsevier, 2006.
Reichheld, F. F., & Sasser Jr. W. E. (1990). Zero defections – quality comes to services. Harvard Business Review, (September-October), 107-111.
Rozzett, K. & Demo, G. (2010a, October). Desenvolvimento e validação da Escala de Relacionamento com Clientes (ERC). Paper presented at the meeting of the Associação Nacional de Engenharia de Produção. São Carlos, SP, Brazil.
Rozzett, K., & Demo, G. (2010b). Desenvolvimento e validação da Escala de Relacionamento com Clientes (ERC). Revista Administração de Empresas, São Paulo, Brazil, 50(4), 383-395.
Rozzett, K., & Demo, G. (2011, April). Escala de Relacionamento com Clientes (ERC): validação fatorial confirmatória por meio da modelagem por equações estruturais. Paper presented at Congresso Iberoamericano de Psicologia das Organizações e do Trabalho. Florianopolis, SC, Brazil.
Ryals, L., & Payne, A. (2001). Customer relationship management in financial services: towards information-enabled relationship marketing. Journal of Strategic Marketing, 9(1), 3-27.
Saunders, M.; Lewis, P., & Thornhill, A. (2009). Research methods for business students (5th ed). London: FT/Prentice Hall.
Sheth, J. N; Parvatiyar, A. (2002). Evolving relationship marketing into a discipline. Journal of Relationship Marketing, 1(1), 3-16.
Sheth, J. N., & Sisodia, R. S. (2002). Marketing productivity: issues and analysis. Journal of Business Research, 55(5), 349-362.
Sin, L. Y. M., Tse, A. C. B., & Yim, F. H. K. (2005). CRM: conceptualization and scale development. European Journal of Marketing, 39 (11/12), 1264-1290.
Tabachnick, B., & Fidell, L. S. (2007). Using multivariate statistics (5th ed). San Francisco, CA: Allyn and Bacon.
Vavra, T. (1993). Marketing de relacionamento: Como manter a fidelidade de clientes através do marketing de relacionamento. São Paulo, Brazil: Atlas.
Wahlberg, O; Strandberg, C; Sundberg, H; Sundberg, K. W. (2009). Trends, topics and under-researched areas in CRM research: a literature review. International Journal of Public Information Systems, 3, 191-208.
Wilson, E. J., & Vlosky, R. P. (1997). Partnering relationship activities: building theory from case study research. Journal of Business Research, 39(1), 59-70.