Cusp Ion Composition as an Indicator of Non-Steady...
21
1 Cusp Ion Composition as an Indicator of Non-Steady Reconnection S. A. Fuselier and K. J. Trattner Lockheed Martin Advanced Technology Center In situ cusp observations provide a snapshot of magnetopause conditions. For southward IMF, these observations often indicate that reconnection at the magne- topause is occurring in a non-steady manner. The signature for this variability is nearly discontinuous changes in the low energy cutoff of the magnetosheath ions in the cusp. Often this low energy cutoff is difficult to observe. Recently, another indicator for this non-steady reconnection has been identified. Using composition measurements from the POLAR spacecraft, it has been shown that the differences in the magnetosheath velocity distributions leads to a distinctive, relatively slow variation in the solar wind ion composition through the cusp. More rapid changes in this cusp composition indicate changes in reconnection at the magnetopause. All southward IMF cusp intervals sampled here showed these rapid changes in the cusp ion composition. The average period of these oscillations was approximately 2 minutes. These oscillations are consistent with ~20% variations in the reconnec- tion rate and/or the deHoffmann-Teller velocity at the magnetopause. 1. INTRODUCTION The understanding of the transfer of mass, momentum, and energy from the solar wind into the magnetosphere is an important problem in magnetospheric physics. Spacecraft observations at the Earth’s magnetopause [e.g., Sonnerup et al., 1981] have confirmed the predic- tion by Dungey [1961] that this transfer can occur through magnetic reconnection of magnetosheath and magnetospheric field lines. Quantifying the transfer through this process is a more difficult problem. It re- quires knowledge of the reconnection rate and the spa- tial extent over which this reconnection is occurring, two quantities that are not easily obtained at the magne- topause. Most in situ observations can be readily re- lated to reconnection as a mechanism for plasma trans- fer across the magnetopause but few observations relate to its rate. One exception is the magnitude of the nor- mal component of the magnetic field at the magne- topause. However, this component is not easily ob- served [e.g., Sonnerup and Ledley, 1979]. Determining the spatial extent over which reconnection is occurring is very difficult because it requires determining the rate over the entire magnetopause. Quantifying the transfer of mass, momentum, and en- ergy across the magnetopause through reconnection is further complicated by the fact that reconnection is not steady. Changing conditions in the magnetosheath cause the reconnection x-line (or lines) to move, the field line convection to change, and the reconnection
Transcript of Cusp Ion Composition as an Indicator of Non-Steady...

1
Cusp Ion Composition as an Indicator of Non-Steady Reconnection
S. A. Fuselier and K. J. Trattner
Lockheed Martin Advanced Technology Center
In situ cusp observations provide a snapshot of magnetopause conditions. Forsouthward IMF, these observations often indicate that reconnection at the magne-topause is occurring in a non-steady manner. The signature for this variability isnearly discontinuous changes in the low energy cutoff of the magnetosheath ionsin the cusp. Often this low energy cutoff is difficult to observe. Recently, anotherindicator for this non-steady reconnection has been identified. Using compositionmeasurements from the POLAR spacecraft, it has been shown that the differencesin the magnetosheath velocity distributions leads to a distinctive, relatively slowvariation in the solar wind ion composition through the cusp. More rapid changesin this cusp composition indicate changes in reconnection at the magnetopause.All southward IMF cusp intervals sampled here showed these rapid changes in thecusp ion composition. The average period of these oscillations was approximately2 minutes. These oscillations are consistent with ~20% variations in the reconnec-tion rate and/or the deHoffmann-Teller velocity at the magnetopause.
1. INTRODUCTION
The understanding of the transfer of mass, momentum,and energy from the solar wind into the magnetosphereis an important problem in magnetospheric physics.Spacecraft observations at the Earth’s magnetopause[e.g., Sonnerup et al., 1981] have confirmed the predic-tion by Dungey [1961] that this transfer can occurthrough magnetic reconnection of magnetosheath andmagnetospheric field lines. Quantifying the transferthrough this process is a more difficult problem. It re-quires knowledge of the reconnection rate and the spa-tial extent over which this reconnection is occurring,two quantities that are not easily obtained at the magne-topause. Most in situ observations can be readily re-lated to reconnection as a mechanism for plasma trans-fer across the magnetopause but few observations relateto its rate. One exception is the magnitude of the nor-mal component of the magnetic field at the magne-topause. However, this component is not easily ob-served [e.g., Sonnerup and Ledley, 1979]. Determiningthe spatial extent over which reconnection is occurringis very difficult because it requires determining the rateover the entire magnetopause.
Quantifying the transfer of mass, momentum, and en-ergy across the magnetopause through reconnection isfurther complicated by the fact that reconnection is notsteady. Changing conditions in the magnetosheathcause the reconnection x-line (or lines) to move, thefield line convection to change, and the reconnection

2
rate to vary. Long term variations in the location of re-connection (and to a lesser extent in the rate of recon-nection) have been investigated using statistical meth-ods [e.g., Phan et al., 1996]. Shorter term variations inreconnection (i.e., of the order of minutes) are not easilyaddressed with in situ observations at the magnetopause.
Magnetospheric field lines at the magnetopause con-verge in the Earth’s cusps. For some time, it has beenrecognized that the cusp is an excellent place to moni-tor changes at the magnetopause in general and changesin reconnection in particular [e.g., Lockwood and Smith,1992]. This is especially true for southward IMF, wheresubsolar reconnection produces a relatively simple cuspgeometry [e.g., Rosenbauer et al., 1975; Reiff et al.,1977]. In this geometry, the low latitude boundarylayer, cusp proper, and mantle [e.g., Newell and Meng,1992] are considered a single region, called the cusp.Poleward convection of reconnected magnetic fieldlines produces a velocity filter effect of the precipitatingmagnetosheath plasma. For low altitude spacecraftsuch DMSP, the spacecraft velocity is rapid comparedto this field line convection velocity and a traversal ofthe cusp yields a snapshot of nearly the entire daysidemagnetopause at an “instant” in time. For high altitudespacecraft such as POLAR, the spacecraft velocity canbe smaller than the field line convection velocity andthe spacecraft can “monitor” a region of the magne-topause at a given location within the cusp for sometime.
Relatively simple models of this ion precipitation un-der southward IMF conditions have been developed andtested. These models have been very successful in re-producing important features of the cusp [e.g., Lockwoodand Smith, 1992; Onsager et al., 1993].
Specifically, there are observations of energy-latitudedispersion in the cusp whereby the highest energy ionsare observed at the equatorial edge of the cusp and suc-cessively lower energy ions with a low energy cutoff areobserved at higher latitudes. The models have beenused to demonstrate that this dispersion is consistentwith the velocity filter effect and the finite extent of thereconnection region at the dayside magnetopause.
These models produce a smooth energy-latitude dis-persion signature because they have relatively simple,static input conditions. Almost all in situ cusp observa-tions show deviations from the overall smooth energy-latitude dispersion. In particular, fluctuations of the lowenergy cutoff of the precipitating ions have been inter-preted as the result of changes in reconnection at themagnetopause [e.g., Lockwood and Smith, 1992]. Unfor-tunately, using these fluctuations as a monitor ofchanges in reconnection is complicated by the fact thatthe low energy cutoff is often difficult to observe.

3
The purpose of this paper is to present another methodfor quantifying the changes in reconnection at the mag-netopause. Changes in the solar wind ion compositionin the cusp are used as a proxy for changes in the pre-cipitation velocity of the ions. Using this method, asurvey is conducted of some cusp crossings of the Polarspacecraft under southward IMF conditions. The resultsfrom this survey are then related to changes in recon-nection at the magnetopause.
2. SAMPLE CUSP ENCOUNTER
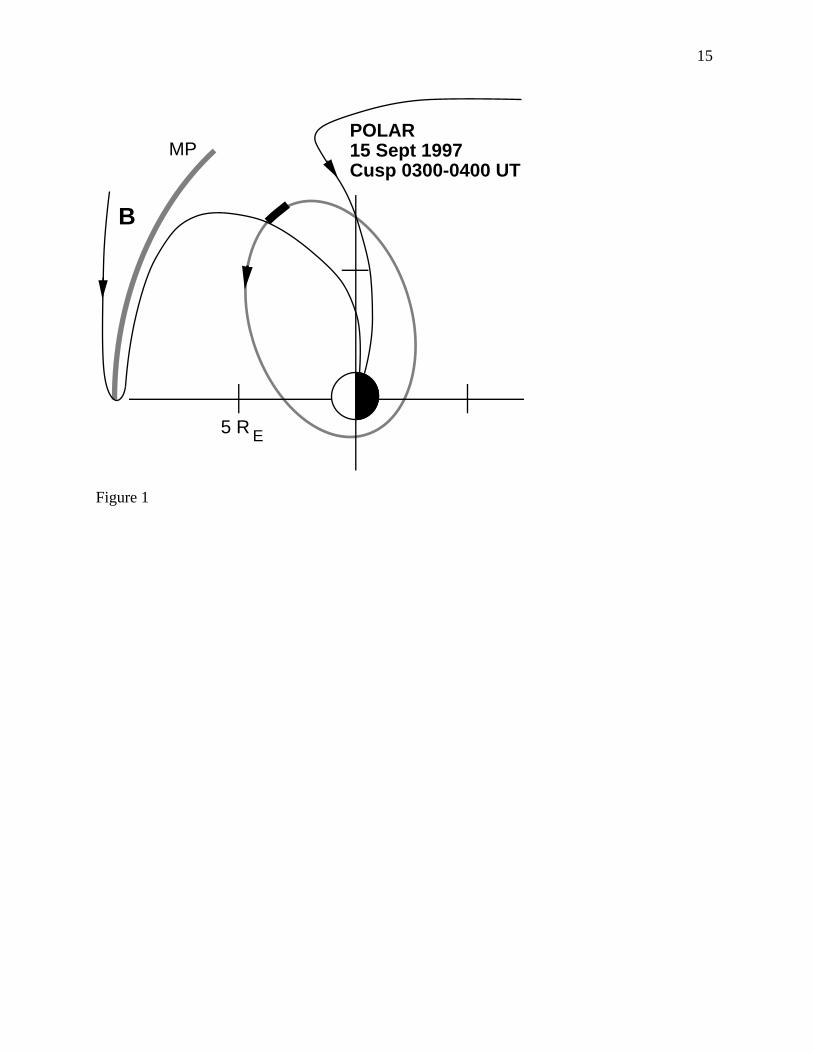
Figure 1 shows the Polar orbit for 15 Sept 1997. Thespacecraft orbit was nearly in the noon-midnight merid-ian and Polar encountered the cusp at 6-7 RE geocentricdistance. Over the period of about an hour, the space-craft moved relatively slowly from the polar cap to theequatorial edge of the cusp. The solar wind conditionswere nominal during this interval. The Wind spacecraftobserved a solar wind density of ~4 cm-3, a bulk flowvelocity of ~425 km/s and a proton thermal speed of 35km/s. The IMF was southward and had a relativelylarge +By component during the interval. (These datawere corrected for the plasma convection time fromWind to Polar.)
The top two panels of Plate 1 show energy time spec-trograms of the omni-directional flux of H+ and He2+
observed by the Toroidal Imaging Mass Angle Spectro-graph (TIMAS) [Shelley et al., 1995] in the cusp. Onlythe last 25 minutes of the cusp traversal are shown toemphasize the composition changes discussed below(after 0400 UT, Polar was in the magnetosphere). Thetime resolution in Plate 1 is 4 spins (24 s) although theTIMAS instrument returns a full energy spectrum for H+
and He2+ every spin (6 s). For H+, the highest energiesare observed near the equatorial edge of the cusp (at~0400 UT) and lower energies are observed at higherlatitudes. H+ flux below 100 eV/e, especially after0350 UT, is from the ionosphere. This energy-latitudedispersion of precipitating magnetosheath ions is consis-tent with magnetic reconnection at the dayside magne-topause. The dispersion is better seen in the He2+ spec-trogram in the second panel because there is no majorsource of ionospheric He2+. The peak fluxes for He2+
occur at higher energies than the peak fluxes for H+ be-cause the two distributions precipitate with the same ve-locity. The third panel shows the He2+/H+ density ratio.This ratio is initially similar to the average solar windratio, it then increases to values well above the solarwind ratio, and finally it decreases again near the equa-torial edge of the cusp to values below the average solarwind ratio.
The change in the He2+/H+ density ratio in the cuspwas first noted by Shelley et al. [1976]. They interpreted

4
this change as the result of different velocity space dis-tributions for the source H+ and He2+ populations in themagnetosheath. Their interpretation of the magne-tosheath source distributions was later confirmed by H+
and He2+ observations in the magnetosheath [e.g., Pe-terson et al., 1979; Fuselier et al., 1988].
Recently, a direct comparison of cusp observationsand models of the magnetosheath H+ and He2+ distribu-tions has been made [Fuselier et al., 1998]. (No com-parison of observations has been possible to date be-cause there have been no reported simultaneous compo-sition measurements in the magnetosheath and in thecusp). Figure 2 is an example of this comparison of themodel and observations. For the observations in Figure2, the maximum flux for H+ and He2+ in Plate 1 wasconverted to phase space density. These H+ (opensquares) and He2+ (filled circles) phase space densitiesare plotted in Figure 2 versus the velocity at which theirrespective maximum fluxes were measured. Under cer-tain assumptions, this representation of cusp observa-tions is directly comparable to the source distributionsin the magnetosheath [Fuselier et al., 1998].
The model distributions that were fit to these observa-tions (solid lines in Figure 2) are described in detailelsewhere [Fuselier et al., 1998]. Briefly, the H+ distri-bution in the magnetosheath is modeled by two maxwel-lians representing the core component between 0 and400 km/s and shoulder component above 400 km/s [seee.g., Sckopke et al., 1983]. The He2+ distribution ismodeled by 3 maxwellians. The first 2 represent theshell component between 0 and 500 km/s in Figure 2.Two maxwellians are used to produce the shell by sub-tracting a lower temperature maxwellian from a highertemperature one to produce a hole in the velocity spacedistribution. The third maxwellian represents the shoul-der above 600 km/s [see e.g., Fuselier and Schmidt,1997]. Parameters which characterize the maxwelliancomponents are obtained from the upstream solar windconditions measured by the Wind spacecraft. The onlyfree parameter in the fit is the change in the thermalspeed for the core H+ component across the bow shock.This parameter fixes the core H+ temperature below 400km/s in Figure 2.
As seen in Figure 2, the model fits and observationscompare reasonably well. For He2+, the model and ob-servations deviate from one another below about 200km/s. This deviation is partly due to a saturation effectin the TIMAS instrument, which results in anomalouslyhigh He2+ count rates for high H+ fluxes. This satura-tion effect produces He2+/H+ density ratios above~15% in Plate 1.
Because the two velocity space distributions are dif-ferent, the He2+/H+ phase space density (and hence thedensity ratio in the cusp) is a function of the velocity of

5
the precipitating ions. Thus, as the velocity of the pre-cipitating ions increases in Plate 1, the He2+/H+ den-sity ratio changes. The third solid line in Figure 2shows the change in the He2+/H+ phase space densityratio with velocity and the scale for this ratio is on theright hand side of the figure. When the velocity of theprecipitating ions is near zero, the He2+ and H+ phasespace densities in Figure 2 are relatively far apart, thephase space density ratio is less than 1%, and the den-sity ratio in the cusp (for example at 0340 UT in Plate1) is low. As the velocity of the precipitating ions in-creases to near 350 km/s, the He2+ and H+ phase spacedensities approach one another in Figure 2, the phasespace density ratio is over 10%, and the density ratio inthe cusp (for example at 0349 UT in Plate 1) is high.Finally, as the velocity of the precipitating ions in-creases above 400 km/s, the He2+ and H+ phase spacedensities become relatively far apart again, the phasespace density ratio decreases, and the density ratio inthe cusp (for example at 0355 UT) is low again.
Unlike the variation in the phase space density ratiofrom the model in Figure 2, the variation in the densityratio in the cusp is not smooth. Plate 1 shows severalspikes in the density ratio, for example just before andafter 0350 UT. Figure 3 shows how these spikes are re-lated to changes in the He2+ flux and ultimatelychanges in the velocity of the precipitating ions. Thetop panel shows 3 contours of constant He2+ flux as afunction of time centered on 0350 UT. The bottompanel shows the He2+/H+ density ratio. The density ra-tio decreases from a maximum at about 0349:10 UT to arelative minimum at 0350:20 UT and then back to arelative maximum at 0351 UT. The contours of constantflux in the upper panel of Figure 3 decrease in velocityand then increase again in concert with the changes inthe density ratio.
Variations in the low energy cutoff of the precipitatingions (represented by the 5 x 10⁴ flux contour in Figure3) have been directly related to changes in reconnectionat the magnetopause [e.g., Lockwood and Smith, 1992].Thus, Figures 2 and 3 establish a direct link betweenchanges in reconnection at the magnetopause andchanges in the He2+/H+ density ratio in the cusp. Withthis link, the He2+/H+ density ratio becomes a proxy forthe changes in the energy of the precipitating ions andultimately the changes in reconnection at the magne-topause.
Detailed consideration of Figures 2 and 3 illustrateshow this link results in quantitative determination of thechanges in the velocity of the precipitating ions. Theratio of the He2+/H+ phase space densities from themodel distributions in Figure 2 is used to estimate thechange in the precipitating ion velocity due to thechange in the density ratio observed in Figure 3. In the

6
lower panel of Figure 3 from 0349:10 to 0350:54 UT, thedensity ratio changes from over 30% to approximately6% and then back to about 13%. The 30% density ratiois due in part to saturation of the He2+ signal. Thevalue of the density ratio at this time corrected for thissaturation is approximately 15%. As the density ratiochanges from a maximum to a relative minimum andback to a maximum, the precipitation velocity of theions with the maximum flux changes from about 350km/s to about 220 km/s and then back to about 350km/s. Thus, in about 2 minutes, the precipitating ionvelocity changes a total of about 130 km/s in one direc-tion and then back by the same amount.
Comparing this total change with the top panel ofFigure 3, it is apparent that the estimated change in theprecipitating ion velocity is consistent with the changein velocity of the low energy cutoff of the He2+ flux rep-resented by the 5 x 10⁴ flux contour. In the 2 minutetime period, the low energy cutoff changes from be-tween 160 and 200 km/s to about 90 km/s and then backto 200 km/s. The total change is between 180 and 220km/s, compared to 260 km/s change in the velocity es-timated using the model distributions in Figure 2. Theuncertainties in both these estimates are approximately±30 km/s due to the discreet energy steps in the instru-ment and, given the fidelity of the comparison, the twonumbers compare reasonably well.
The event in Plate 1 was chosen because it had arelatively large change in the precipitating velocity thatclearly demonstrated the direct link between changes inthe low energy cutoff of He2+ and changes in the den-sity ratio. However, the determination of the low energycutoff is not always easy. Plate 2 shows a cusp eventwhere the changes in the low energy cutoff are less evi-dent. The top 2 panels in the plate are the H+ and He2+
energy-time spectrograms similar to those in Plate 1.As in Plate 1, the H+ and He2+ fluxes in Plate 2 show arelatively smooth energy-latitude (time) dispersion con-sistent with reconnection at the dayside magnetopause.The energy dispersion is reversed from Plate 1 becausethe spacecraft was moving toward higher latitudes inPlate 2. Although the energy-latitude dispersion issmooth, the He2+/H+ density ratio in the third panelshows considerable fluctuations. These fluctuations arecorrelated with changes in the He2+ flux, as seen in thebottom panel of Plate 2. Changes in the H+ flux and inparticular in the low energy cutoff of the flux are muchless evident in the top panel.
3. SURVEY OF SELECTED SOUTHWARD IMFEVENTS
Nine cusp events including those in Plates 1 and 2were chosen to survey the changes in the density ratio

7
and their relation to changes in the velocity of the pre-cipitating ions and changes in reconnection at the mag-netopause. All 9 events exhibited good energy-latitudedispersion as in Plates 1 and 2. All events occurredwhen the IMF was southward as observed by the Windspacecraft. Most significantly, all events exhibited fluc-tuations in the density ratio similar to the fluctuations inPlates 1 and 2.
For each event, the solar wind conditions from theWind spacecraft were used to model the magnetosheathdistributions as in Figure 2. From these model distribu-tions, the change in the He2+/H+ density ratio was di-rectly related to the change in the velocity of the pre-cipitating ions as in the discussion of Figures 2 and 3 inthe previous section. For all events, the period betweenmaxima in the density ratio was measured. For exam-ple, in the third panel of Figure 2, there are 4 peaks inthe He2+/H+ density ratio at about 0345, 0347, 0349,and 0351 UT. For each of these oscillations in the den-sity ratio, the total velocity change was computed usingthe model distributions. For example, the oscillationisolated in Figure 3 had a total velocity change of theprecipitating ions of 260 km/s (as discussed in the pre-vious section). This total change consisted of a 130km/s excursion to lower velocities followed by a 130km/s excursion back to higher velocities within a periodof about 2 minutes.
Figure 4 shows the total velocity change of the pre-cipitating ions as a function of the period between peaksin the density ratio. There is considerable scatter in thepoints and no correlation is evident. The average periodwas about 2 minutes and the total velocity change was130 km/s. It is significant that the change in the veloc-ity of the precipitating ions in Figure 3 was considerablylarger than this average. This made it a good choice forillustrating how the density ratio change and the veloc-ity of the precipitating ions are related.
Figure 5 shows the maximum velocity of the precipi-tating ions (defined as the velocity where the density ra-tio was maximum) as a function of the period betweenmaxima in the density ratio. This plot shows that thelonger period oscillations in the density ratio occurwhen the maximum flux is at lower velocities. An ex-ample of this trend is seen in Plate 2. The last two os-cillations in the density ratio (from 1657 to 1702 UT)occur 5 minutes apart when the precipitating ion flux isat lower energies. Nearer to the equatorial edge of thecusp, where the energies are higher, the periods are ofthe order of 2 minutes. This may indicate that the causefor precipitating ion velocity changes and reconnectionchanges are different for plasma in the traditional“cusp” than for plasma in the traditional “mantle”. Thisis a subject for future study.

8
4. INTERPRETATION
As stated in the introduction, the goal of this study isto relate the changes in the cusp to changes in recon-nection at the magnetopause. In the previous section,changes in low energy cutoff of the precipitating ionswere related to changes in the density ratio. In Figure4, the average period between oscillations in the pre-cipitating ion flux was about 2 minutes and the averagetotal change in the velocity of the precipitating ions was130 km/s. Thus, the low energy cutoff velocity of theprecipitating ions changes by about 65 km/s in about 1minute. In this section, these average changes are re-lated to possible changes in magnetopause reconnec-tion.
In the simple interpretation of the cusp as a velocityfilter, a change in the velocity of the precipitating ionsoccurs because the time-of-flight of the ions that reachthe spacecraft has changed. This change can occur bymoving the reconnection line, changing the convectionvelocity of the field line, or changing the rate of recon-nection at the magnetopause. Any combination of thesechanges could also occur, but it is important to estimatethe magnitude of the required changes for each processindividually.
The basic equation for the time of flight of an ionfrom the reconnection site to the spacecraft is:
V||i = Li /t (1)
where L is the length of the magnetic field line (~10RE) and V|| is the velocity of the ion parallel to themagnetic field.
Moving the Reconnection Line
By moving the reconnection line along the magne-topause, L in (1) is changed. If the time is constant,then the parallel velocity of the precipitating ions mustchange. For L1 ~10 RE (a typical distance from thesubsolar point to the Polar spacecraft in the cusp), V|| ~300 km/s (from Figure 5), and the change in V|| ~65km/s (from half of the average in Figure 4), L2 ~ 12 RE.Thus, to account for the average changes in the velocityof the precipitating ions in the cusp, the reconnectionline must move 2 RE (poleward or equatorward alongthe magnetopause) and then return 2 RE to near itsoriginal position. These are large changes in the posi-tion of the X-line that require accelerations of the X-lineof the order of 10 km/s2. The consequences of such ac-celerations would be very obvious in the in situ observa-tions at the magnetopause. The fact that changes in thelocation of the reconnection site during multiple magne-topause crossings are not typically observed suggests

9
that this is not the dominant means whereby reconnec-tion conditions are changed on 1 minute time scales.
Changing the Field Line Convection Velocity
A reconnected field line convects with the deHof-mann-Teller velocity at the magnetopause. If this ve-locity is increased or decreased, then the parallel veloc-ity of the precipitating ions must increase or decreaseby the same amount to keep the time of flight of theions from the reconnection site to the spacecraft con-stant. A 65 km/s increase in the parallel velocity from300 to 365 km/s (from one half the average total changein V|| in Figure 4 and the average velocity of the pre-cipitating ions in Figure 5) represents about a 20%change in the parallel velocity of the precipitating ions.Thus, in about 1 minute, the deHoffmann-Teller velocitychanges by about 65 km/s. The deHoffmann-Teller ve-locity has been measured for selected in situ observa-tions of magnetopause crossings [e.g., Sonnerup et al.,1990]. The existence of this velocity is a necessarycondition for reconnection at the magnetopause. Undercertain assumptions, the bulk flow of the plasma on ei-ther side of the open magnetopause is at the localAlfven velocity in the frame of reference moving withthe deHoffmann-Teller velocity. In a few special cases,it was found that there was better agreement betweenthe observed velocities and the local Alfven speed if thedeHoffmann-Teller velocity was not constant. In par-ticular, accelerations of the order of 1 km/s2 tangentialto the magnetopause were needed to achieve betteragreement between theory and observation [Sonnerup etal., 1990]. Typical spacecraft crossings of the magne-topause take about 1 minute and deHoffmann-Teller ve-locities are typically of the order of 300 km/s. Thus, the~1 km/s2 acceleration of the deHoffmann-Teller framerepresents about a 20% change in the deHoffmann-Teller velocity during a magnetopause crossing. Al-though very few magnetopause crossings have been in-vestigated in such detail, the inferred order of magni-tude of the acceleration is consistent with the changesin the cusp ion precipitation in Figure 4.
Changing the Reconnection Rate
If the inflow of magnetic field lines into the reconnec-tion region increases, then the magnetopause moves in-ward (erosion) and equatorial edge of the cusp movesequatorward. For a near stationary spacecraft such asPolar in the high latitude cusp, this would cause the en-ergy of the precipitating ions that arrive at the space-craft to decrease. If the tangential electric field and thenormal component of the magnetic field at the magne-topause change by equal amounts, then the deHoff-mann-Teller velocity remains constant while the recon-

10
nection rate changes. Also, the position of the X-line onthe magnetopause does not change. Thus, while thefield line convection velocity and the X-line position donot change, the movement of the equatorial edge of thecusp to lower latitudes through magnetopause erosioneffectively changes the position of the spacecraft in thecusp. This process of changing the reconnection ratewithout changing the field line convection velocity hasbeen suggested previously [e.g., Lockwood and Smith,1992].
Since this change in the reconnection rate is linearlyrelated to the change in the parallel convection velocityrequired to reach the spacecraft, the ~20% change inthe parallel convection velocity represents a 20%change in the reconnection rate. As stated in the intro-duction, the reconnection rate is very difficult to meas-ure with in situ observations at the magnetopause.Thus, it is difficult to determine from independentmeasurements at the magnetopause if the rate variescontinuously by about ±20% or more. The only directsignature of this variation is the movement of the mag-netopause and the simultaneous shifting of the cusp tohigher or lower latitudes. Recent simultaneous observa-tions from the ground and at the magnetopause indicatethat this certainly occurs [Mende et al., 1998]. Onceagain, there are few simultaneous observations of themagnetopause and cusp positions so there is onlyenough information to conclude that erosion may be amechanism for producing the changes in the precipita-tion velocity in Figure 4.
5. CONCLUSIONS
In this paper, an additional method for quantitativeinvestigation of short term (~minute) variations in re-connection at the magnetopause was presented. Previ-ously, these changes were investigated by directly ob-serving changes in the low energy cutoff velocity of theprecipitating ions in the cusp. Here, the change in theHe2+/H+ density ratio was introduced as a proxy for thischange in the cutoff velocity.
Oscillations in the He2+/H+ density ratio were ob-served in all events surveyed here. The average changein the precipitating ion velocities deduced from theseoscillations was about 130 km/s (65 km/s in one direc-tion and then 65 km/s in the other) over an average pe-riod of 2 minutes. Such changes maybe due to move-ment of the reconnection line along (tangential to) themagnetopause, changes in the deHoffmann-Teller veloc-ity at the magnetopause, and/or changes in the recon-nection rate. The amplitude of the changes in the ve-locity of the precipitating ions in the cusp is largeenough to rule out movement of the reconnection linealong the magnetopause as the prime reason for the

11
changes. This amplitude is consistent with ~20%changes in either the deHoffmann-Teller velocity or thereconnection rate or some combination of both possibili-ties. Changes in the deHoffmann-Teller velocity of thatmagnitude have been observed at the magnetopause forsome magnetopause crossings. The signature of a 20%change in the reconnection rate would be a simultane-ous inward (outward) motion of the magnetopause andequatorward (poleward) motion of the cusp. Such si-multaneous motion has been observed. Distinguishingbetween these two possibilities requires simultaneousobservations at the magnetopause and in the cusp.
Acknowledgments: The TIMAS investigation is the resultof more than a decade of work by many dedicated engineersand scientists at several institutions. Until his retirement in1998, E. G. Shelley was the PI of the TIMAS instrument. ThePI is now W. K. Peterson. Solar wind data were obtained fromthe Wind Magnetometer Experiment (R. Lepping, PI) and theWind Solar Wind Experiment (K. Ogilvie, PI).
REFERENCES
Dungey, J. W., Interplanetary field and the auroral zones,Phys. Rev. Lett., 6, 47, 1961.
Fuselier, S. A., E. G. Shelley, and D. M. Klumpar,AMPTE/CCE observations of shell-like He2+ and O6+ dis-tributions in the magnetosheath, Geophys. Res. Lett., 15 ,1333, 1988.
Fuselier, S. A., and W. K. H. Schmidt, Solar wind He2+ ringbeam distributions downstream from the Earth's bow shock,J. Geophys. Res., 102, 11,273, 1997.
Fuselier, S. A., E. G. Shelley, W. K. Peterson, and O. W. Len-nartsson, Solar wind He2+ and H+ distributions in the cuspfor southward IMF, in Polar Cap Boundary Phenomena, ed.J. Moen et al., p. 63, Kluwer Academic, Netherlands, 1998.
Lockwood, M. and M. F. Smith, The variation of reconnectionrate at the dayside magnetopause and cups ion precipita-tion, J. Geophys. Res., 97 , 14,841, 1992.
Mende, S. B., D. M. Klumpar, S. A. Fuselier, and B. J. Ander-son, Dayside auroral dynamics: South Pole - AMPTE/CCEobservations, J. Geophys. Res., 103, 6891, 1998.
Newell, P., and C.-I. Meng, Mapping the dayside ionosphereto the magnetosphere according to particle precipitationcharacteristics, Geophys. Res., Lett., 19 , 609, 1992.
Onsager, T. G., C. A. Kletzing, J. B. Austin, and H. MacKier-nan, Model of magnetosheath plasma in the magneto-sphere: Cusp and mantle partic les at low altitudes, Geo-phys. Res. Lett., 20 , 479, 1993.
Peterson, W. K., E. G. Shelley, R. D. Sharp, R. G. Johnson J.Geiss, and H. Rosenbauer, H+ and He++ in the dawnsidemagnetosheath, Geophys. Res. Lett., 6, 667, 1979.
Phan, T.-D., G. Paschmann, B. U. Ö. Sonnerup, Low latitudedayside magnetopause and boundary layer for high mag-netic shear 2. Occurrence of magnetic reconnection, J.Geophys. Res., 101, 7817, 1996.

12
Reiff, P., T. H. Hill, and J. L. Burch, Solar wind injection atthe dayside magnetospheric cusp, J. Geophys. Res., 82 , 479,1977.
Rosenbauer, H., H. Grünwaldt, M. D. Montgomery, G. Pasch-mann, and N. Sckopke, HEOS 2 plasma observations in thedistant polar magnetosphere: The plasma mantle, J. Geo-phys. Res., 80 , 2723, 1975.
Sckopke, N., G. Paschmann, S. J. Bame, J. T. Gosling, and C.T. Russell, Evolution of ion distributions across a nearlyperpendicular bow shock: Specularly and non-specularlyreflected-gyrating ions, J. Geophys. Res., 88 , 6,121, 1983.
Shelley, E. G., R. D. Sharp, and R. G. Johnson, He++ and H+
flux measurements in the dayside cusp: Estimates of con-vection electric field, J. Geophys. Res., 81 , 2363, 1976.
Shelley, E. G., et al., The toroidal imaging mass-angle spec-trograph (TIMAS) for the Polar mission, in The GlobalGeospace Mission , ed. C. T. Russell, p 497 Kluwer Aca-demic, Netherlands, 1995.
Sonnerup, B. U. Ö., and B. G. Ledley, Electromagnetic struc-ture of the magnetopause and boundary layer, in Magneto-spheric Boundary Layers, B. Battrick, ed., p. 401, ESA SP148, European Space Agency, Paris, 1979.
Sonnerup, B. U. Ö., G. Paschmann, I. Papamastorakis, N.Sckopke, G. Haerendel, S. J. Bame, J. R. Asbridge, J. T.Gosling, and C. T. Russell, Evidence for magnetic field re-connection at the Earth’s magnetopause, J. Geophys. Res.,86 , 10,049, 1981.
Sonnerup, B. U. Ö., I. Papamastorakis, G. Paschmann, and H.Lühr, The magnetopause for large magnetic shear: Analy-sis of convection electric fields from AMPTE/IRM, J. Geo-phys. Res., 95 , 10 ,541, 1990.
Stephen A. Fuselier and Karlheinz J. Trattner, Dept H1-11Bldg 255, Lockheed Martin Advanced Technology Center,3251 Hanover St., Palo Alto, CA 94304, USA.

13
Figure 1. Polar orbit for 15 September 1997. The spacecraftspent almost an hour in the cusp, moving from the polewardedge to the equatorward edge.
Plate 1. Omni-directional flux of H+ and He2+ and theHe2+/H+ density ratio for a representative traversal of thecusp. H+ (above ~100 eV/e) and He2+ show a characteristicenergy-latitude dispersion from high to low energies as thespacecraft moves from high to low latitudes. The He2+/H+
density ratio changes from below the nominal solar wind ratioto well above it and then back to below it as the spacecrafttraverses the cusp.
Figure 2. Maximum H+ and He2+ flux from 0342-0359 UT inPlate 1 versus the velocity of the maximum flux. Under cer-tain assumptions, this is directly comparable to the source dis-tributions in the magnetosheath (represented by the modelfits). The ratio of the phase space densities has the same pro-file with velocity as the density ratio in Plate 1.
Figure 3. Contours of constant flux and the He2+/H+ densityversus time for part of the event in Plate 1. Changes in thelow velocity cutoff of the flux (represented by the 5 x 10 4flux contour) are directly related to changes in the density ra-tio.
Plate 2. Omni-directional flux of H+ and He2+, He2+/H+
density ratio, and the maximum flux for H+ and He2+ for an-other cusp traversa l. The energy-latitude dispersion is similarto Plate 1 but reversed in time because the spacecraft is mov-ing from equatorward to poleward. Oscillations in theHe2+/H+ density ratio are clearly evident but correlation withchanges in the lower energy cutoff in H+ are not evident atall.
Figure 4. Total velocity change of the precipitating ions ver-sus the period between these changes (determined by the pe-riod between successive peaks in the He 2+/H+ density ratio).The average period between these velocity changes from allevents was 2 minutes and the average total velocity changewas 130 km/s.
Figure 5. Maximum velocity (defined as the velocity atwhich the He2+/H+ density ratio is maximum) versus the pe-riod. Longer period oscillations in the precipitating ion veloc-ity occur when the maximum velocity is low. This may be anindication that there are longer period changes in reconnectionfor field lines connected to the mantle.

14
Figure 1. Polar orbit for 15 September 1997. The spacecraft spent almost an hour in the cusp, moving from thepoleward edge to the equatorward edge.
Plate 1. Omni-directional flux of H+ and He2+ and the He2+/H+ density ratio for a representative traversal ofthe cusp. H+ (above ~100 eV/e) and He2+ show a characteristic energy-latitude dispersion from high to low en-ergies as the spacecraft moves from high to low latitudes. The He2+/H+ density ratio changes from below thenominal solar wind ratio to well above it and then back to below it as the spacecraft traverses the cusp.
Figure 2. Maximum H+ and He2+ flux from 0342-0359 UT in Plate 1 versus the velocity of the maximum flux.Under certain assumptions, this is directly comparable to the source distributions in the magnetosheath(represented by the model fits). The ratio of the phase space densities has the same profile with velocity as thedensity ratio in Plate 1.
Figure 3. Contours of constant flux and the He2+/H+ density versus time for part of the event in Plate 1.Changes in the low velocity cutoff of the flux (represented by the 5 x 10 4 flux contour) are directly related tochanges in the density ratio.
Plate 2. Omni-directional flux of H+ and He2+, He2+/H+ density ratio, and the maximum flux for H+ and He2+
for another cusp traversal. The energy-latitude dispersion is similar to Plate 1 but reversed in time because thespacecraft is moving from equatorward to poleward. Oscillations in the He 2+/H+ density ratio are clearly evidentbut correlation with changes in the lower energy cutoff in H+ are not evident at all.
Figure 4. Total velocity change of the precipitating ions versus the period between these changes (determinedby the period between successive peaks in the He2+/H+ density ratio). The average period between these veloc-ity changes from all events was 2 minutes and the average total velocity change was 130 km/s.
Figure 5. Maximum velocity (defined as the velocity at which the He2+/H+ density ratio is maximum) versusthe period. Longer period oscillations in the precipitating ion velocity occur when the maximum velocity is low.This may be an indication that there are longer period changes in reconnection for field lines connected to themantle.
FUSELIER AND TRATTNER: CUSP ION COMPOSITION AND NON-STEADY RECONNECTION
15
5 R E
POLAR15 Sept 1997Cusp 0300-0400 UT
MP
B
Figure 1

16
10008006004002000
10 2
10 3
10 4
10 5
10 6
10 7
10 8
10 9
Velocity (km/s)
POLAR/TIMAS15 Sept 19970342-0359 UT
H+
He2+
ModelFits
10 -3
10 -2
10 -1
He2+
H +
Max
imu
m f
(v)
(km
s
)
-63
He
/H
+2+
Figure 2

17
0.00
0.10
0.20
0.30
UT
He
/H
d
ensi
ty r
atio
POLAR/TIMAS 15 Sept 1997
0348 03520350
5 x 10⁵
5 x 10⁴
1 x 10⁵
He2+flux (cm s sr keV/e)2 -1
80
120
160
200
Vel
oci
ty (
km/s
)2+
+
Figure 3

18
86420
0
100
200
300
400
Period (minutes)
To
tal V
elo
city
Ch
ang
e (k
m/s
)<Period> = 2 ± 1.7 minutes<Total Vel. Change> = 130 ± 80 km/s
Figure 4

19
86420
0
100
200
300
400
500
600
Period (minutes)
M
axim
um
Vel
oci
ty
of
Pre
cip
itat
ing
Ion
s (k
m/s
)<Period> = 2 ± 1.7 minutes
<Maximum Vel.> = 300 ± 90 km/s
Figure 5

20
UT 0335 0400 R 6.8 6.4MLT 1247 1301MLat 53.5 48.6
POLAR/TIMAS 15 Sept 1997
H
(keV
/e)
+H
e
(keV
/e)
2+H
e
/H d
ensi
ty+
2+
0.1
1.0
10.0
0.1
1.0
10.0
POLAR/TIMAS
NominalSolar Wind
0.00
0.10
0.20
0.30
Flu
x (1
./cm
2 s
r s
keV
/e) 10 3
10 4
10 5
10 6
10 7
10 8
Plate 1

21
UT 1645 1710 R 4.6 5.2MLT 1158 1159MLat 59.9 66.9
POLAR/TIMAS 24 April 1996
Max
imum
Flu
x
(x
10
)H
(k
eV/e
)+
He
(k
eV/e
)2+
He
/H
den
sity
+2+
0.12
0.08
0.04
0.00
POLAR/TIMAS
WIND/SWE
H+
He x102+
0.1
1.0
10.0
0.1
1.0
10.0
7
6
4
2
0
Flu
x (1
./cm
2 s
r s
KeV
/e)
10 3
10 4
10 5
10 6
10 7
10 8
Plate 210008006004002000
Velocity (km/s)
Max
imu
m f
(v)
(km
s
)
-63
He
/H
+2+