
CURRENT TRENDS IN COMPUTER AIDED PROCESS PLANNING
73
1 CURRENT TRENDS IN COMPUTER AIDED PROCESS PLANNING Momin Zia 1 , Prof.Ashok Patole 2 1. SEM II, M.E (CAD/CAM and Robotics),PIIT,New Panvel. 2. Assistant Professor,Department of Mechanical Engineeering, PIIT,New Panvel. Email- 1: [email protected] 2. [email protected] ABSTRACT: During the recent years, Computer Aided Process Planning (CAPP) evolved as one of the most important engineering tools in industries. The current trends in CAPP tend to eliminate human involvement between design and process planning. The paper discusses the basics of CAPP and presents a comprehensive overview of the current trends in CAPP, classifying them into several categories according to their focus. It also discusses the flow chart of process planning in traditional CAD environment and workflow in simulation based process planning, taking die design as an example. Keywords: CAPP, CAD, MIPLAN, MICLASS. 1. INTRODUCTION Process Planning is concerned with determining the sequence of individual machining operations needed to produce a given part or product [1].This has traditionally been carried out as tasks with a very high manual and clerical content. It is the task of industrial engineers to write these process plans for new part design to be produced by the shop. The process planning is very much dependent on the experience and judgment of the planner. Accordingly, there are differences among operation sequences developed by various planners. In one case, a total of 42 routings were developed for various sizes of a relatively simple part [1].There are various other difficulties in traditional process planning procedure. New machine tools in the factory render old routings less than optimal. These difficulties have been overcome by employing Computer Aided Process Planning which is a result of attempts made to capture the logic, judgment, and experiences required for this important function and incorporate them into a computer program. Investigation shows that an efficient CAPP system can result in a total reduction of the manufacturing cost by 30% and manufacturing cycle time by 50% [2]. 2. BASIC CAPP SYSTEMS Two alternative approaches to CAPP have been developed [1]. These are 1. Variant Systems (Retrieval-Type Process Planning Systems) 2. Generative Process Planning systems
Transcript of CURRENT TRENDS IN COMPUTER AIDED PROCESS PLANNING
1
CURRENT TRENDS IN COMPUTER AIDED PROCESS PLANNING
Momin Zia1, Prof.Ashok Patole
2
1. SEM II, M.E (CAD/CAM and Robotics),PIIT,New Panvel.
2. Assistant Professor,Department of Mechanical Engineeering, PIIT,New Panvel.
Email- 1: [email protected]
ABSTRACT:
During the recent years, Computer Aided Process Planning (CAPP) evolved as one of
the most important engineering tools in industries. The current trends in CAPP tend to
eliminate human involvement between design and process planning. The paper
discusses the basics of CAPP and presents a comprehensive overview of the current
trends in CAPP, classifying them into several categories according to their focus. It also
discusses the flow chart of process planning in traditional CAD environment and
workflow in simulation based process planning, taking die design as an example.
Keywords: CAPP, CAD, MIPLAN, MICLASS.
1. INTRODUCTION
Process Planning is concerned with determining the sequence of individual machining
operations needed to produce a given part or product [1].This has traditionally been carried
out as tasks with a very high manual and clerical content. It is the task of industrial engineers
to write these process plans for new part design to be produced by the shop. The process
planning is very much dependent on the experience and judgment of the planner.
Accordingly, there are differences among operation sequences developed by various
planners. In one case, a total of 42 routings were developed for various sizes of a relatively
simple part [1].There are various other difficulties in traditional process planning procedure.
New machine tools in the factory render old routings less than optimal. These difficulties
have been overcome by employing Computer Aided Process Planning which is a result of
attempts made to capture the logic, judgment, and experiences required for this important
function and incorporate them into a computer program. Investigation shows that an efficient
CAPP system can result in a total reduction of the manufacturing cost by 30% and
manufacturing cycle time by 50% [2].
2. BASIC CAPP SYSTEMS
Two alternative approaches to CAPP have been developed [1]. These are
1. Variant Systems (Retrieval-Type Process Planning Systems)
2. Generative Process Planning systems

2
Figure1. Information Flow in Variant Process Planning System
2.1. Variant Systems (Retrieval-Type Process Planning Systems)
It follows the principle that similar parts require similar plans. Therefore, the process requires
a human operator to classify a part, input part information, retrieve a similar process plan
from a database (which contains the previous process plans), and edit the plan to produce a
new variation of the pre-existing process plan. Planning for a new part involves retrieving of
an existing plan and modification. In some variant systems parts are grouped into a number of
part families, characterized by similarities in manufacturing methods and thus related to
group technology. In comparison to manual process planning, the variant approach is highly
advantageous in increasing the information management capabilities. Consequently,
complicated activities and decisions require less time and labor. Also procedures can be
standardized by incorporating a planner’s manufacturing knowledge and structuring it to a
company’s specific needs. Therefore, variant systems can organize and store completed plans
and manufacturing knowledge from which process plans can be quickly evaluated. However,
there are difficulties in maintaining consistency in editing practices and adequately inability
to accommodate various combinations of geometry, size, precision, material, quality and
shop loading. The biggest disadvantage is that the quality of process plan still depends on the
knowledge background of a process planner. MIPLAN is one of Variant Process Planning
System used to generate Rout Sheet.
2.2 Generative Process Planning (GPP)
Generates process plans utilizing decision logic, formulae, manufacturing rules, geometry
based data to determine the processes required to convert the raw materials into finished
parts. It develops new plan for each part based on input about the part’s features and
3
attributes. Due to the complexity of this approach a generative CAPP system is more difficult
to design and implement than a system based on the variant approach. But a generative CAPP
system does not require the aid of a human planner, and can produce plans not belonging to
an existing part family. It stores the rules of manufacturing and the equipment capabilities in
a computer system. The generative approach is complex and a generative system is difficult
to develop. In comparison, the variant systems are better developed and mature than
generative systems; they are suitable for planning processes in mass or large production
volumes. For planning discrete processes of manufacturing products of great diversity,
generative systems are much more suitable than variant systems. However true generative
systems are still to come although the earlier optimistic speculation made by researchers.
Most CAPP systems in use now are either variant systems or semi-generative systems (with
some planning functions developed with variant approach, others with generative approach).
Proper combination of the two approaches can make an efficient CAPP system. First the
system will check whether the process planning is possible for a new part by variant
approach. If variant system is unable to identify the part to be of a previous group or family it
will use generative technique for process planning. So both the variant and generative process
planning approaches need further development. GENPLAN is one of the Generative Process
Planning System used to generate Rout Sheet.
3. SOME NEW APPROACHES
In the last two decades huge research work is performed in different research areas in CAPP.
These works can be categorized by the types of part involved in these works, like prismatic
part, cylindrical parts, and sheet metal, foundry and assembly systems. Besides this broad
classification, research works can also be categorized on the basis of geometric modeling
techniques. Some new ideas are presented here briefly.
Feature-based and Solid Model based Process Planning
Solid Model-based process planning uses solid modeling package to design a 3D part. In
feature-based process planning systems a part is designed with design oriented manufacturing
feature or a feature extraction/feature recognition system is used to identify part feature and
their attributes from the CAD file.
Nasser, El-Gayar and others [2] presented a prototype solid model based automated process
planning system for integrating CAD and CAM system. In this system a three dimensional
(3D) finished part is built by using a solid modeling package. The primitive (Cylinder, cone,
block, wedge, sphere and torus) is used to define the removal volume. This system consists of
three major sections: CAD interface, production knowledge, and process planning. The CAD
interface includes the finished part drawing. The finished part is built by using the AutoCAD
Advanced Modeling Extension (AME) module in a PC. With the AME module, the user can
create complex 3D parts and assemblies by using Boolean operations to combine simple
shapes. The production knowledge is placed before the process planning procedure, where it
accommodates the essential knowledge. It contains information about the machine tools,
tools, materials in stock, cutting parameters, and so forth. The process plan is then generated
based on recognized solid primitives and production rules.
In the prototype Feature Based Automated Process Planning (FBAPP) system features are
recognized from the removable volume point of view rather than from the design part point
of view. The entire process in FBAPP is naturally closer to the thinking of a human process
planner. A feature based approach for cylindrical surface machining process is developed by
Yong et. al [2]. The process involves the following steps: (1) Recognizing form features from
the part geometry, (2) converting the form feature into machining volumes (negative features)
4
suitable for turning and milling machining (3) combine them into alternative machining
volumes (4) associating machining process classes to each machining volume, and (5)
generate precedence relations between these volumes. Then the output is used by a process
planning system where process sequences are determined and the assignment to multiple
spindles and turrets is made.
For machining various types of pockets efficiently, it is necessary to decompose bulky
features of sculpture pockets into thin features. Joo, Cho, and Yun[2] designed a feature
based process planning for sculptured pocket machining. First the bulky feature of sculptured
shape of pocket is segmented into several thin layers and the temporal precedence of the
segmented features is constructed; then variable cutting condition is applied to each smaller
feature. They found that, if the sculpture shape of pocket is segmented horizontally and
vertically and apply variable cutting condition to each feature machining becomes easier.
Interactive and feature blackboard based CAPP is a new approach that complies with the
traditional process planning [2]. Human process planner gets familiar with the system very
quickly. Plans can be manually edited or completed by knowledge base systems. The
architecture of Black board system can be seen as a number of people sitting in front of a
blackboard. These people are independent specialists, working together to solve a problem,
using the blackboard for developing the solution. Problem solving begins when the problem
and initial data are written on the blackboard, looking for an opportunity to apply their
expertise to develop the solution. When a specialist finds sufficient information to make a
contribution, he records the information on the blackboard, solves a part of the problem and
makes new information available for other experts. This process continues until the problem
has been solved.
Currently many researches are conducted for the application of object-oriented approach to
different research problems [2]. Object oriented process planning is a logical means for
representing the real world components within a manufacturing system. The developer
identifies a set of system objects from the problem domain and expresses the operation of the
system as an interaction between these objects. The behavior of an object is defined by what
an object is capable of doing. The use of Object Oriented Design or Object Oriented
Programming for developing of a process planning system provides the tool for addressing
the complexity of process planning and the capability to incrementally and functionality as
the system matures, thereby permitting the developer creating a complete manufacturing
planning system. Object oriented systems are more flexible in terms of making changes and
handling the evolution of the system over time. This technique is an efficient means for the
representation of the planning knowledge and a means of organizing and encapsulating the
functionality of the system with the data it manipulates. This modularity results in a design
that can be extended to include additional functionality and address other processes. The
design also expands on traditional piece part planning by extending the part model to support
planning for end products composed of multiple parts and subassemblies.
4. LINKS BETWEEN CAD AND CAPP
Creating link between CAD and CAPP is one of the most difficult tasks in concurrent design
and manufacturing. Without proper interface between CAD and CAPP it is impossible to
generate a process plan, which will need least amount of time and cost. Feature recognition or
feature extraction is the key to achieve this objective. In mechanical assembly or machining
processes a feature is, usually, defined as a set of constituent faces. The geometric
information related to a feature is obviously subset of object. In addition to the geometric
information, some non-geometric information associated with a feature is also essential for
process planning. Feature extraction is categorized into three classes.
5
a) Graph/pattern matching,
b) Knowledge based system and
c) Geometric decomposition.
In graph/pattern matching search technique is used to find the primitives like faces and edges
in a part design. From these primitives the graph of the geometric shapes is created. Then the
graph is used to identify the features of the part. In the knowledge based feature extraction
technique expert system rules and techniques are used to extract features from the 3D solid
model using the internal boundary representation of the designed part.
Geometric decomposition includes cell decomposition, convex hull and constructive solid
geometry tree rearrangement. Yong [2] shows how decomposition technique can be used for
feature recognition. In his work central Form Feature Decomposition (FFD) is obtained from
its boundary geometry by applying convex decomposition, called Alternate Sum of Volumes
with Partitioning (ASVP) which uses convex hull and set difference operations. This feature
recognition method has important advantages to support automated process planning. Fore
mostly, interacting features are properly recognized. In addition, outside-in hierarchical
relations, face dependency, and accessibility information of features are obtained. The
extreme ability-based, outside-in, geometric hierarchy of the boundary faces of a part is
intrinsically important for both material removal oriented part manufacturing process and
additive processes such as deposition and assembly operations.
Kakino [2] was the first to develop a part description method on the basis of fundamental
concept of converting the drawing information into computer-oriented information for the
data structure. The part shape was described by using algebraic construction rules and
operation rules in set theory performed on the volumetric element formed by the revolving or
parallel movement of the reference surface. Based on Kakino’s work Jakubowski used a
syntactic manner to describe 2D profile information on 2D machined parts. He applied
extended context-free grammars to describe machined parts families and gave a detailed
explanation of techniques for parts construction. Chof [2] also outlined the use of syntactic
pattern recognition in identifying elementary machine surfaces for process planning in
machining centers.
5. PROCESS PLANING AND DIE DESIGN IN CONVENTIONAL CAD
ENIRONMENT
Stamping industry applies CAD techniques both in the process planning and die design
already for many years [3]. However, in a ‘traditional” CAD environment, these are
practically stand-alone solutions, i.e. for example a knowledge based process planning
solution is applied for the determination of the necessary types of forming processes, even in
some cases, the forming sequences can be determined in this way together with the
appropriate process parameters, too. After determining the process sequences and process
parameters, the forming dies are designed using sophisticated CAD systems, however, still
we do not have any evidence whether the designed tools will provide the components with
the prescribed properties. Therefore, before it goes to the production line, usually a time- and
cost consuming try-out phase follows, as it is shown in Figure2.
If the try-out is successful, i.e. the die produces parts with no stamping defects, it will be sent
to the stamping plant for production. On the other hand, if splitting or wrinkling occur during
the tryout, the die set needs to be reworked. It means that we have to return first to rework the
die construction by changing the critical die parameters (e.g. die radii, drawing gap, etc.). If it

6
does not solve the problem, a new die design, or a new process planning is required. Some
cases, we have to go back even to the product design stage to modify the product parameters.
The more we go back the higher the development and design costs are. Occasionally, the die
set is scraped and a perfectly new product-, process- and die design is needed. As a result, die
manufacturing time is increased as well as the cost of die making.
Figure2.Flow chart of process planning and die design in traditional CAD Environment.
6. SIMULATION BASED PROCESS PLANNING AND DIE DESIGN
Due to the global competition – and this is particularly valid for the automotive industry –
there is an overall demand to improve the efficiency in both the process planning and in the
die design phase, as well as to reduce the time and product development costs and to shorten
the lead times. It requires the efficient use of simulation techniques from the earliest stage of
product development, to give feedback from each step to make the necessary corrections and
improvement when it takes the least cost [3]. This principle is illustrated in the schematic
flow chart of simulation based process planning and die design as shown in Figure3.
With this approach, stamping defects may be minimized and even eliminated before the real
die construction stage. If any correction or redesign is needed, it can be done immediately,
with a very short feedback time, thus it leads to a much smoother die try-out, if necessary at
all and to significantly shorter lead times with less development costs. However, even with
this approach, there are some further shortfalls in the die design process, since most of the
simulation programs do not provide die construction in sufficient details, which can be easily
used in most of the CAD systems to complete the die design task. This shortage may be
overcome by integrating the CAD and FEM systems through a special interface model which
can provide a smooth, continuous and reliable data exchange between the two important parts
of design process.
Figure 3.Flow Chart of Process Planning and Die Design in Simulation Based System
6. CONCLUSION
Many CAPP systems have so far been developed and commercialized. New systems adopt
many advanced techniques and approaches such as feature-based modeling, object oriented
7
programming, effective graphical user interfaces and technological databases. But the
implementation of CAPP systems in industry lags behind the rate of development of new
systems and introduction of new ideas in the field [2].
Though tremendous effort has been made in developing CAPP systems, the effectiveness of
these systems is not fully satisfactory. CAPP as the main element in the integration of design
and production has not kept pace with the development of CAD and CAM. This situation has
made process planning a bottleneck in the manufacturing process. In spite of the benefit
promised by the various developed CAPP systems, their adaptation by industry is painfully
slow. Design of a part is generally done in the CAD environment. So it is necessary to create
link between CAD and CAPP where a two-way interaction will exist between design and
process planning. It is no longer sufficient to ensure an effective flow of information from
design to process planning to provide the data and knowledge necessary for creating an
effective process plan. It is also becoming increasingly essential to feedback information
from process planning to assist the designer at an early stage in assigning various design
features not only from functional point of view but also regarding manufacturability because
a large percentage of product cost is committed once its features, materials, tolerance and
surface quality parameters have been selected at the design stage. Dynamic process planning
which is one of the key areas for research and development, will integrate design and
manufacturing and reduce the total product development time by facilitating two-way
interaction between design and process planning.
7. REFERENCES
1. Mikell P.Groover,Emory W.Zimmers,Jr. “CAD/CAM”,1984.
2. Nafis Ahmad,Dr.A.F.M.Anwarul Haque,Dr.A.A.Hasin. “Current Trend in Computer
Aided Process Planning”, Proceedings of the 7th Annual Paper Meet, Paper No:10, Pages 81-
92, 2001.
3. M.Tisza. “Recent Achievements in Computer Aided Process Planning and Numerical
Modelling of Sheet Metal Forming Processes”,AMME,Volume24, Issue 1, 2007.
4. Chris McMohan, Jimmie Browne, “CAD/CAM”,Second Edition,Pearson Education
Ltd.,2006.
5. Ibrahim Zeid, “CAD/CAM, Theory and Practice”, Tata McGraw Hill Publishing Company
Ltd, 1998.
8
A GENERIC FRAMEWORK AND WORKCELL OF AGILE
MANUFACTURING
A.L.Godase a, A.S.Patole
b
a II sem (ME-CAD CAM and Robotics -PIIT New Panvel) bAssistant Professor (Department of Mechanical Engineering) PIIT New Panvel
a b Mumbai University
E- mail Address a [email protected] , b [email protected]
ABSTRACT: This review paper outlines
the concept of Agile Manufacturing. A
definition is provided along with detailed
description of basic concepts. A number of
key issues and key elements in this new
area are also explained with the help of
Case Study of an aerospace Industry.
Design of Work cell for agile
manufacturing is discussed.
Keywords- Agile Manufacturing,
Flexibility, Latest trends in Manufacturing
Industries, Productivity Lean, Customer
satisfaction
INTRODUCTION
Agility is defined in dictionaries as quick
moving, nimble and active. This is clearly
not the same as flexibility which implies
adaptability and versatility. Agility and
flexibility are therefore different things.
Leanness (as in lean manufacturing) is also a
different concept to agility. Sometimes the
terms lean and agile are used
interchangeably, but this is not appropriate.
The term lean is used because lean
manufacturing is concerned with doing
everything with less. In other words, the
excess of wasteful activities, unnecessary
inventory, long lead times, etc are cut away
through the application of just-in-time
manufacturing, concurrent engineering,
overhead cost reduction, improved supplier
and customer relationships, total quality
management, etc.
Thus agility is not the same as
flexibility, leanness or CIM. Understanding
this point is very important. But if agility is
none of these things, then what is it? This is a
good question, and not one easily answered.
Yet most of us would recognize agility if we
saw it.
For example, we would not say that a
Sumo wrestler was agile. Nor would we
think that 50 Sumo wrestlers, tied together by
a complex web of chains and ropes, all
pulling in different directions, as agile. It’s
quite the contrary. We would see them as
lumbering, slow and unresponsive. However,
we would all recognize a ballet dancer as
agile. We would also think of a stage full of
ballet dancers as agile, because what binds
them together is something quite different.
This analogy between Sumo wrestlers and
ballet dancers is very relevant to
understanding the property of agility. Many
of our corporations, to varying degrees,
resemble Sumo wrestlers, tied together, but
all pulling in different directions. If we want
to develop agile properties, we need to
understand what causes agility and what
hinders agility. Only when we have
developed this understanding can we begin to
think about designing an agile enterprise.
For, when we have such an understanding of
the causes of agility, we can start to audit our
current situation, and identify what needs to
be changed.
1.0 WHAT IS AGILE MANUFACTURING?
It is the capability of surviving and
prospering in a competitive environment of
continuous and unpredictable change by

9
reacting quickly and effectively to changing
markets, driven by customer-defined
products and services.
Agile manufacturing is a method for
manufacturing which combine our
organization, people and technology into an
integrated and coordinated whole.
1.1 WHY DO WE NEED TO BE AGILE?
Global Competition is intensifying.
Mass markets are fragmenting into niche
markets. Cooperation among companies
is becoming necessary, including
companies who are in direct competition
with each other. Customers are
expecting: Low volume products, High
quality products, Custom products, Very
short product life-cycles, development
time, and production lead times are
required. Customers want to be treated as
individuals
Real world example:
The Industry: Japanese car makers
The goal: To produce the three day car,
(three days from customer order for a
customized car to dealer delivery)
1.2 SCOPE OF AGILE
MANUFACTURING
Manufacturing industry is on the
verge of a major paradigm shift. This
shift is likely to take us away from mass
production, way beyond lean
manufacturing, into a world of Agile
Manufacturing.
Agile Manufacturing, however, is a
relatively new term, one which was first
introduced with the publication of the
Iacocca Institute report 21st Century.
Manufacturing Enterprise Strategy, 1991.
Furthermore, at this point in time,
Agile Manufacturing is not well
understood and the conceptual aspects are
still being defined. However, there is a
tendency to view Agile Manufacturing as
another program of the month, and to use
the term Agile Manufacturing as just
another way of describing lean
production or CIM.Agile Manufacturing
is something that many of our
corporations have yet to fully
comprehend, never mind implement.
Agile Manufacturing is likely to be the
way business will be conducted in the
next century. It is not yet a reality. Our
challenge is to make it a reality, first by
more fully defining the conceptual
aspects, and secondly by venturing into
the frontier of implementation
2.0 SOME KEY ISSUES IN AGILE
MANUFACTURING
1) The "I am a Horse" Syndrome
There is an old saying that hanging a
sign on a cow that says "I am a horse"
does not make it a horse. There is a real
danger that Agile Manufacturing will fall
prey to the unfortunate tendency in
manufacturing circles to follow fashion
and to re-label everything with a new
fashionable label.
The dangers in this are twofold.
First, it will give Agile Manufacturing a
bad reputation. Second, instead of getting
to grips with the profound implications
and issues raised by Agile
Manufacturing, management will only
acquire a superficial understanding,
which leaves them vulnerable to those
competitors that take Agile
Manufacturing seriously. Of course this
is good news for the competitors!
2) The Existing Culture of
Manufacturing
One of the important things that is
likely to hold us back from making a
quantum leap forward and exploring this
new frontier of Agile Manufacturing, is
the baggage of our traditions,
conventions and our accepted values and
beliefs. A key success factor is, without
any doubt, the ability to master both the
soft and hard issues in change
management.
However, if we are to achieve agility
in our manufacturing enterprises, we
should first try to fully understand the
nature of our existing cultures, values,
10
and traditions. We need to achieve this
understanding, because we need to begin
to recognize and come to terms with the
fact that much of what we have taken for
granted, probably no longer applies in the
world of Agile Manufacturing.
Achieving this understanding is the
first step in facing up to the pain of
consigning our existing culture to the
garbage can of historically redundant
ideas.
3) Understanding Agility
Agility is defined in dictionaries as
quick moving, nimble and active. This is
clearly not the same as flexibility which
implies adaptability and versatility.
Agility and flexibility are therefore
different things.
Leanness (as in lean manufacturing)
is also a different concept to agility.
Sometimes the terms lean and agile are
used interchangeably, but this is not
appropriate. The term lean is used
because lean manufacturing is concerned
with doing everything with less. In other
words, the excess of wasteful activities,
unnecessary inventory, long lead times,
etc are cut away through the application
of just-in-time manufacturing, concurrent
engineering, overhead cost reduction,
improved supplier and customer
relationships, total quality management,
etc.
We can also consider CIM in the
same light. When we link computers
across applications, across functions and
across enterprises we do not achieve
agility. We might achieve a necessary
condition for agility, that is, rapid
communications and the exchange and
reuse use of data, but we do not achieve
agility.
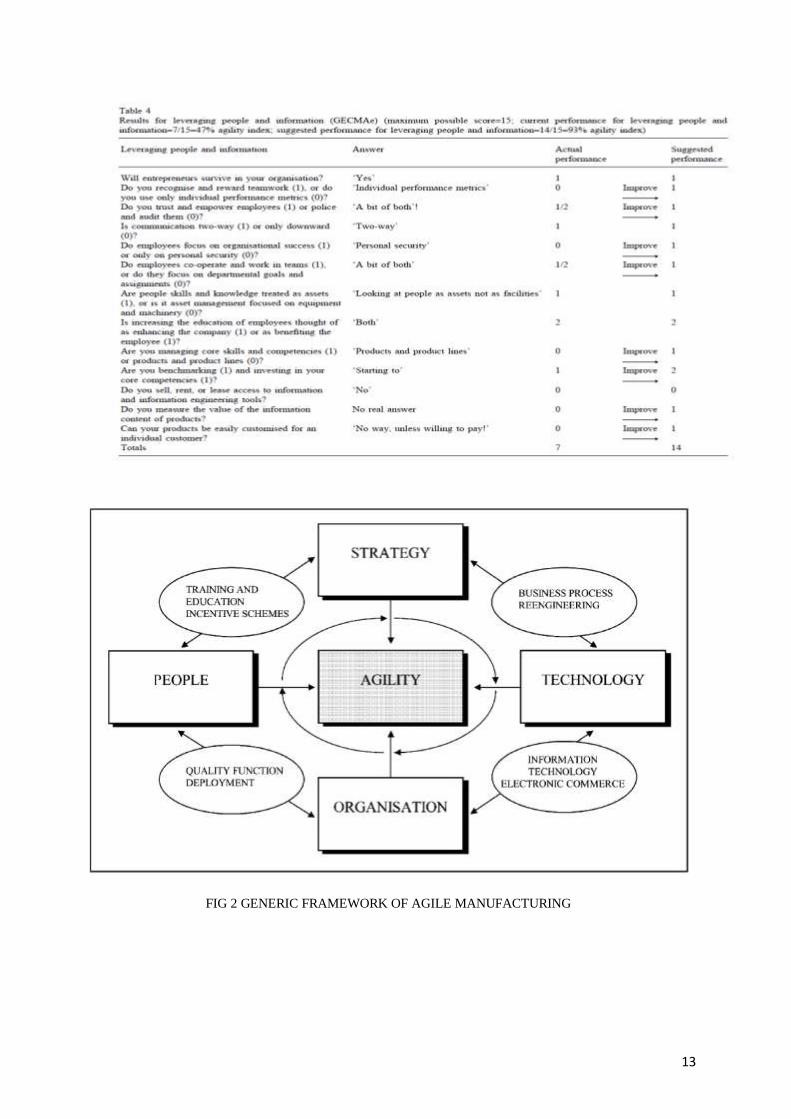
2.1 KEY ELEMENTS OF AGILITY
Enriching the customer,
Co-operating to enhance competitiveness,
Mastering change and uncertainty,
Leveraging people and information
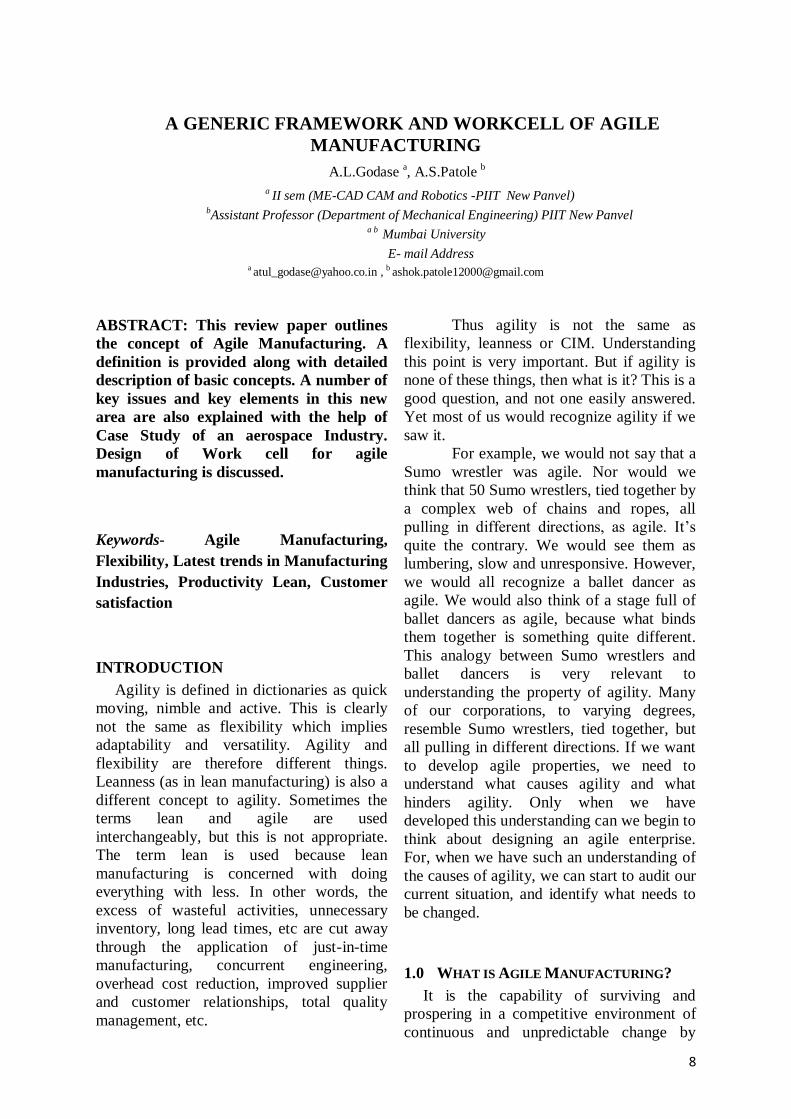
3.0 CASE STUDY 1:
GEC-MARCONI AEROSPACE LTD
(UK)
GECMAe, is a part of the multi-
national group General Electric Company
Occupying a 25-acre site with 351,000 ft2
of factory and office space, employs
about 700 people, and has an annual
turnover in excess of £ 80 million.
GECMAe is an international market
leader in the design and production of a
wide range of critical systems needed to
maximize the performance, integrity and
safety of the current and next generation
aircraft and air/land systems.
It has been active for over 50 years
supplying
Systems for civil and military aircraft
and for A
Review of the product life cycles
revealed that some of the GECMAe
products are within the mature stage and
on the order books for the next 10 years!
GECMAe, however, does not rely on the
safety and security of these orders and
remain stagnant. In addition to investing
extensively in the skills of its people,
GECMAe takes full advantage of the
knowledge and experience available
within the GEC group of companies.
FIG 1 PRODUCT GROUPS
Project plans are regularly reviewed by
external specialists
Furthermore, major investment in the
latest high speed machining centers
provides unattended running and
improved quality, while reducing
processing times by up to 60% such that

11
some of the more complex products can
now be machined in ‘one hit’.
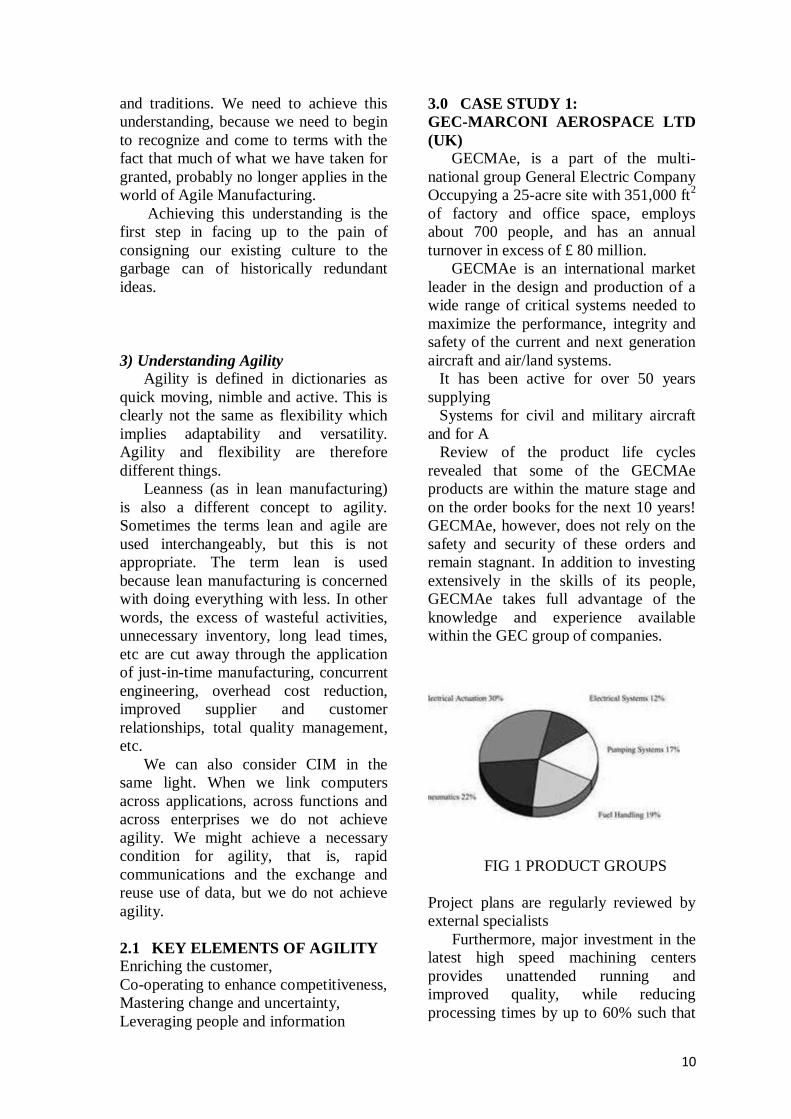
3.1 DATA COLLECTION AND
ANALYSIS
The following data have been
collected by interviewing members of the
GECMAe Change Team using the
Agility Audit Questionnaire.
Using a predetermined scale (see
Tables 1–4), the scores have been
calculated and summarized in each table
as a percentage of the total maximum
possible score, reflecting an actual and a
suggested agility index.
The results are given in Tables 1–4,
where the areas that require improving
with respect to agility are denoted by
(improvement) arrows.
3.2 RECOMMENDATIONS
It is observed that ‘late delivery’ is a
crucial problem area that needs
improving. A move towards a group
(cellular) technology layout would
improve these characteristics
dramatically
On the other hand, it should be noted
that, group technology has a little less
product flexibility than process layout,
but this does not affect the products that
are already well established.
Process layout could still be kept,
dedicated to the new products that require
more flexibility, and hence, facilitate
agility in the area of new build
production.

12
13
FIG 2 GENERIC FRAMEWORK OF AGILE MANUFACTURING
14
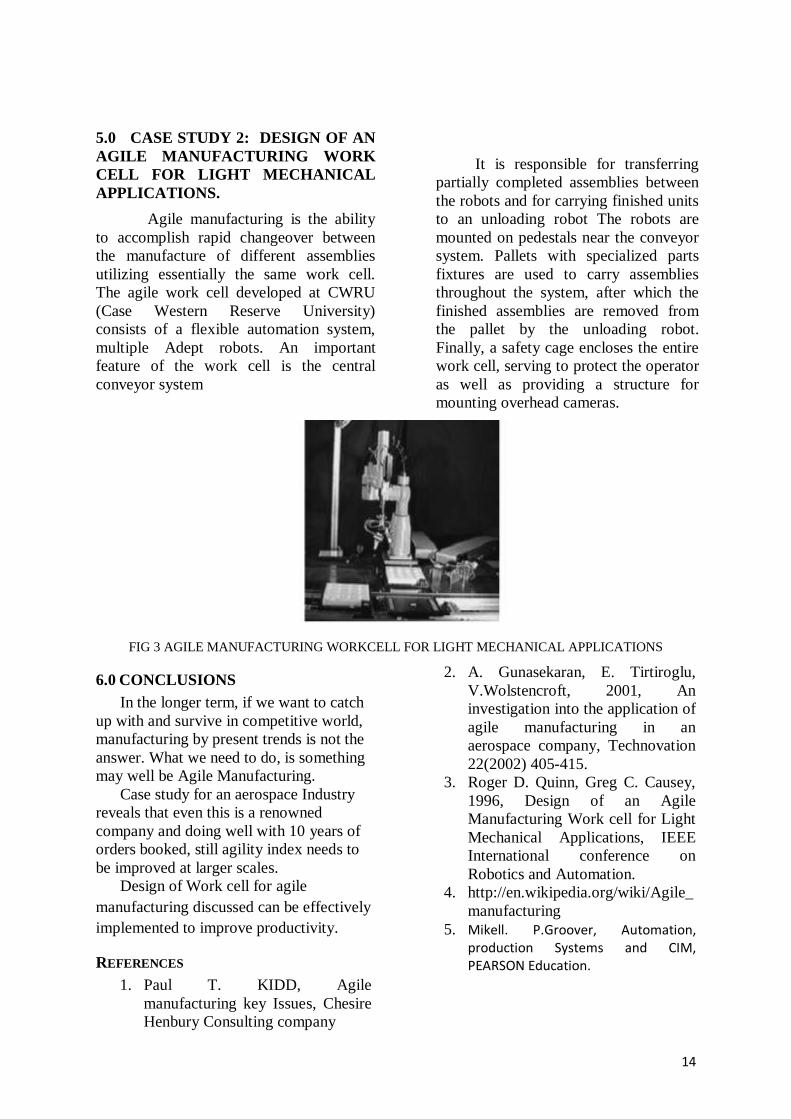
5.0 CASE STUDY 2: DESIGN OF AN
AGILE MANUFACTURING WORK
CELL FOR LIGHT MECHANICAL
APPLICATIONS.
Agile manufacturing is the ability
to accomplish rapid changeover between
the manufacture of different assemblies
utilizing essentially the same work cell.
The agile work cell developed at CWRU
(Case Western Reserve University)
consists of a flexible automation system,
multiple Adept robots. An important
feature of the work cell is the central
conveyor system
It is responsible for transferring
partially completed assemblies between
the robots and for carrying finished units
to an unloading robot The robots are
mounted on pedestals near the conveyor
system. Pallets with specialized parts
fixtures are used to carry assemblies
throughout the system, after which the
finished assemblies are removed from
the pallet by the unloading robot.
Finally, a safety cage encloses the entire
work cell, serving to protect the operator
as well as providing a structure for
mounting overhead cameras.
FIG 3 AGILE MANUFACTURING WORKCELL FOR LIGHT MECHANICAL APPLICATIONS
6.0 CONCLUSIONS
In the longer term, if we want to catch
up with and survive in competitive world,
manufacturing by present trends is not the
answer. What we need to do, is something
may well be Agile Manufacturing.
Case study for an aerospace Industry
reveals that even this is a renowned
company and doing well with 10 years of
orders booked, still agility index needs to
be improved at larger scales.
Design of Work cell for agile
manufacturing discussed can be effectively
implemented to improve productivity.
REFERENCES
1. Paul T. KIDD, Agile
manufacturing key Issues, Chesire
Henbury Consulting company
2. A. Gunasekaran, E. Tirtiroglu,
V.Wolstencroft, 2001, An
investigation into the application of
agile manufacturing in an
aerospace company, Technovation
22(2002) 405-415.
3. Roger D. Quinn, Greg C. Causey,
1996, Design of an Agile
Manufacturing Work cell for Light
Mechanical Applications, IEEE
International conference on
Robotics and Automation.
4. http://en.wikipedia.org/wiki/Agile_
manufacturing
5. Mikell. P.Groover, Automation, production Systems and CIM, PEARSON Education.
15
Lean Six Sigma applications in manufacturing and
non-manufacturing sectors Swati Chougule
#, Ashok Patole
*
#IInd semester (ME – CAD CAM and Robotics - PIIT, New Panvel) Mumbai University
*Assistant Professor (Department Mechanical Engineering, PIIT, New Panvel) Mumbai University
Email Address #[email protected], *[email protected]
ABSTRACT- The common goals of Six
Sigma and lean production are
improvement of process capability and
elimination of waste. Six Sigma and lean
production should be viewed as
complements to each other rather than as
equivalents of or replacements for each
other. The purpose of this paper is to
study the application of Lean Six Sigma,
an integrated model of Six Sigma and lean
production named “DMAIC” which
represents a logical, sequential structure
for driving process improvement in
different fields. It could be applied in both
manufacturing processes and non-
manufacturing processes that are willing
to implement it.
Four main areas focussed in this
paper are, basic concepts of Six Sigma and
lean production, identification of the basic
model structure and implementation steps,
study the toolsets in each of the
implementation phase of this model, and
case studies in the field of Education
System, Public or Government Sector &
Service Industry.
The integrated model will provide
benefits to enterprises, such as to find
optimal process, to create work
standardization, to reduce variation, and
eliminate wastes. According to these
effects above, we deeply believe that it
indeed can enhance product quality by
combining the concepts and methodologies
of Six Sigma and lean production. Finally,
it can satisfy customer’s requirements and
gain more competitive advantages.
Keywords- Lean Production, Six Sigma,
Standard Deviation, Integrated Model,
DMAIC, Lean Six Sigma
I. INTRODUCTION
Many Enterprises are confused about
the relationship between Six Sigma and
lean production, whether they are
independent or not. In fact, many
manufacturers had already used the
concept of lean production to eliminate
waste in the past; recently, lots of
companies lead in Six Sigma to reduce
variation and enhance quality. For most
companies, Six Sigma and lean
production attack problems in different
ways. Enterprises treat each approach as
different and unique, and divide these
two systems into different improvement
teams in practice. Enterprises put efforts
on those high-value added activities and
competitive domain. However, they have
to clearly understand that it is a crucial
issue to enhance competitive advantage
by strengthening product quality and
enriching customer loyalty. Because the
characteristics of most industries are
belonging to high cost operation and
emphasizing quality, we have to look
after both sides of low cost and high
quality. For these reasons, it is necessary
to integrate the systems of Six Sigma and
lean production.
Six Sigma and lean systems are
closely related. A lean culture provides
the ideal foundation for the rapid and
successful implementation of Six Sigma
quality disciplines. And the metrics of
Six Sigma lead to the application of the
discipline of lean production when it is
most appropriate. Furthermore, the
techniques and procedures of Six Sigma
should be used to reduce defects in the
16
processes, which can be a very important
prerequisite for a lean production project
to be successful. The two approaches
should be viewed as complements to each
other rather than as equivalents of or
replacements for each other. The
combination of these two approaches
represents a formidable opponent to
variation in that it includes both re-layout
of the processes and a focus on specific
variations.
The main objective of this paper
is to attempt to study the effect of Lean
Six Sigma implementation in different
types of fields like education system,
public/government sector, and service
sector. The results of this research might
be a reference material to help an
organization diagnose performance gaps
correctly and determine the right
continuous improvement strategy for
their processes.
II. LITERATURE REVIEW
A. Introduction to Six Sigma
Six Sigma is the major focus of
many companies for its powerful
breakthrough performance demonstrated
in GE, Motorola etc. recently. Six Sigma
can help companies to reduce cost,
increase profits, keep current customers
and create new customers. In brief, Six
Sigma is a methodology to reduce the
variation of every process and their
interfaces to achieve a very high quality
level. Six Sigma originated as a set of
practices designed to improve
manufacturing processes and eliminate
defects, but its application was
subsequently extended to other types of
business processes as well.
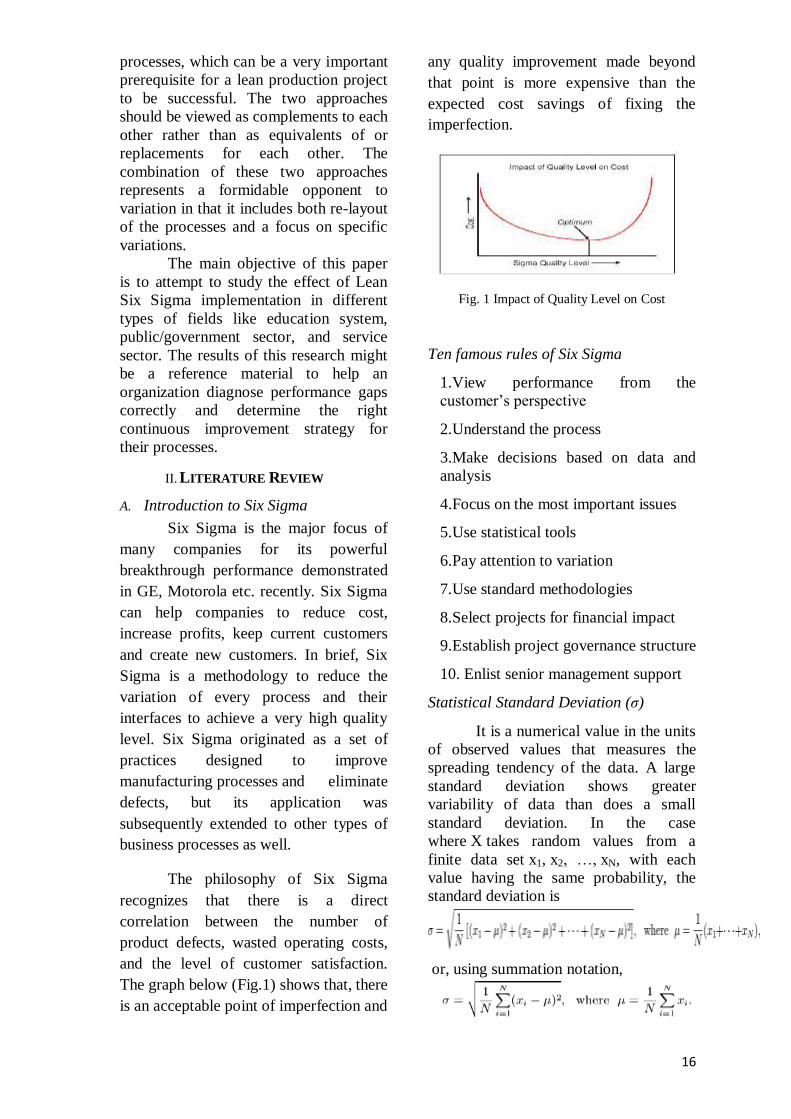
The philosophy of Six Sigma
recognizes that there is a direct
correlation between the number of
product defects, wasted operating costs,
and the level of customer satisfaction.
The graph below (Fig.1) shows that, there
is an acceptable point of imperfection and
any quality improvement made beyond
that point is more expensive than the
expected cost savings of fixing the
imperfection.
Fig. 1 Impact of Quality Level on Cost
Ten famous rules of Six Sigma
1.View performance from the
customer’s perspective
2.Understand the process
3.Make decisions based on data and
analysis
4.Focus on the most important issues
5.Use statistical tools
6.Pay attention to variation
7.Use standard methodologies
8.Select projects for financial impact
9.Establish project governance structure
10. Enlist senior management support
Statistical Standard Deviation (σ)
It is a numerical value in the units
of observed values that measures the
spreading tendency of the data. A large
standard deviation shows greater
variability of data than does a small
standard deviation. In the case
where X takes random values from a
finite data set x1, x2, …, xN, with each
value having the same probability, the
standard deviation is
or, using summation notation,

17
E.g.
Consider a population consisting of the
following eight values: 2, 4, 4, 4, 5, 5, 7,
and 9.
These eight data points have the mean (average) of 5:
To calculate the population standard
deviation, first compute the difference of
each data point from the mean and square the result of each:
Next compute the average of these
values, and take the square root:
This quantity is the population
standard deviation; it is equal to the
square root of the variance.
Six Sigma Statistics
In statistical theory, Six sigma is
an ideal target value, and expressed as:
6σ. It means when the process or product
we observed under a normal distribution,
the probability of a specific attribute
value shifts from the mean about positive
or negative six standard deviation would
be 0.002 part per million (ppm).
Motorola Company found a phenomenon
that the process mean would shift around
the centre point of specifications in a
long-term processing, and the shifting
range would be about positive or negative
1.5 standard deviations from the centre
point of specifications. Hence, Motorola
Company modified the statistical
meaning of six sigma. The definition can
allow the sample mean shifts from the
centre of the population, and the observed
process or product would out lie the six
sigma limits only 3.4 times per million
operations under the original
specifications. In addition, the sigma
performance can also be expressed by
“Defect per Million Operations
(DPMO)”. Bill Smith first formulated the
particulars of the methodology
at Motorola in 1986.
Fig. 2 Normal Distribution Curve
As you can see from Fig.2, +/-6
deviations (6 sigma) contains 99.9999%
of all values. It can never reach 100%
though. This means that there will always be room for improvement.
Because of the properties of the
normal distribution, values lying that far
away from the mean are extremely
unlikely. Even if the mean were to move
right or left by 1.5σ at some point in the
future (1.5 sigma shift), there is still a
good safety cushion. This is why Six
Sigma aims to have processes where the
mean is at least 6σ away from the nearest
specification limit.
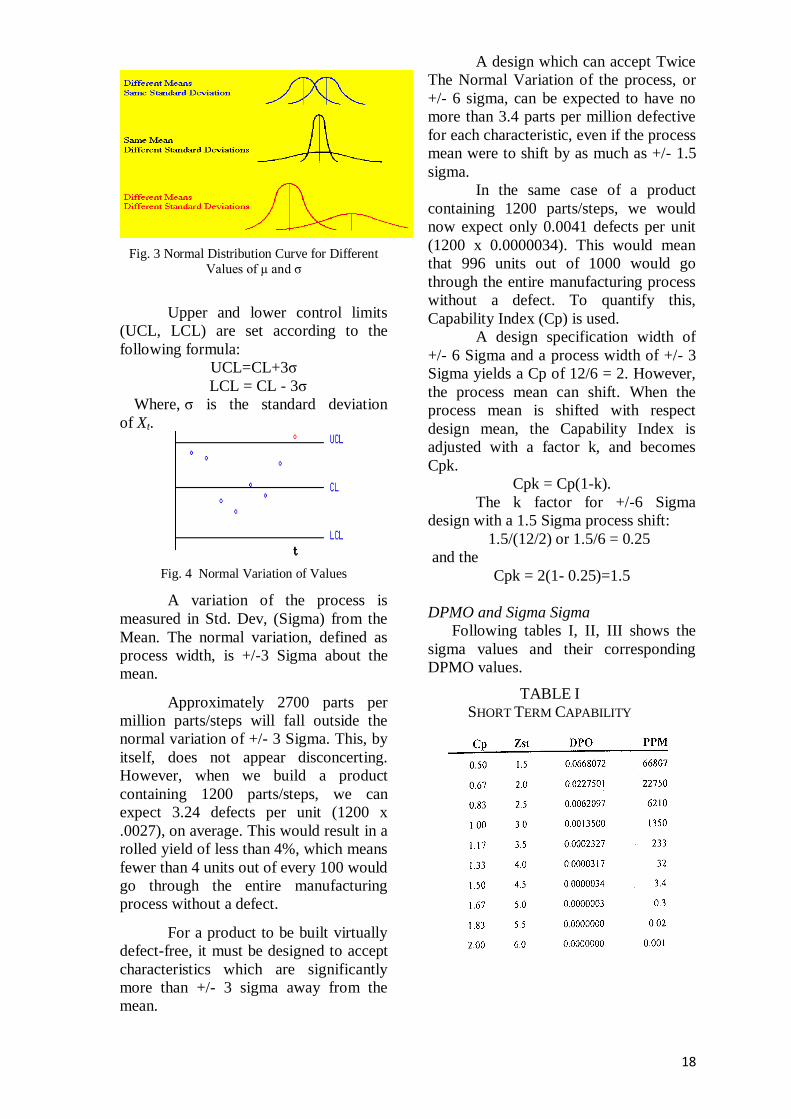
18
Fig. 3 Normal Distribution Curve for Different
Values of µ and σ
Upper and lower control limits
(UCL, LCL) are set according to the
following formula:
UCL=CL+3σ
LCL = CL - 3σ
Where, σ is the standard deviation
of Xt.
Fig. 4 Normal Variation of Values
A variation of the process is
measured in Std. Dev, (Sigma) from the
Mean. The normal variation, defined as
process width, is +/-3 Sigma about the
mean.
Approximately 2700 parts per
million parts/steps will fall outside the
normal variation of +/- 3 Sigma. This, by
itself, does not appear disconcerting.
However, when we build a product
containing 1200 parts/steps, we can
expect 3.24 defects per unit (1200 x
.0027), on average. This would result in a
rolled yield of less than 4%, which means
fewer than 4 units out of every 100 would
go through the entire manufacturing
process without a defect.
For a product to be built virtually
defect-free, it must be designed to accept
characteristics which are significantly
more than +/- 3 sigma away from the
mean.
A design which can accept Twice
The Normal Variation of the process, or
+/- 6 sigma, can be expected to have no
more than 3.4 parts per million defective
for each characteristic, even if the process
mean were to shift by as much as +/- 1.5
sigma.
In the same case of a product
containing 1200 parts/steps, we would
now expect only 0.0041 defects per unit
(1200 x 0.0000034). This would mean
that 996 units out of 1000 would go
through the entire manufacturing process
without a defect. To quantify this,
Capability Index (Cp) is used.
A design specification width of
+/- 6 Sigma and a process width of +/- 3
Sigma yields a Cp of 12/6 = 2. However,
the process mean can shift. When the
process mean is shifted with respect
design mean, the Capability Index is
adjusted with a factor k, and becomes
Cpk.
Cpk = Cp(1-k).
The k factor for +/-6 Sigma
design with a 1.5 Sigma process shift:
1.5/(12/2) or 1.5/6 = 0.25
and the
Cpk = 2(1- 0.25)=1.5
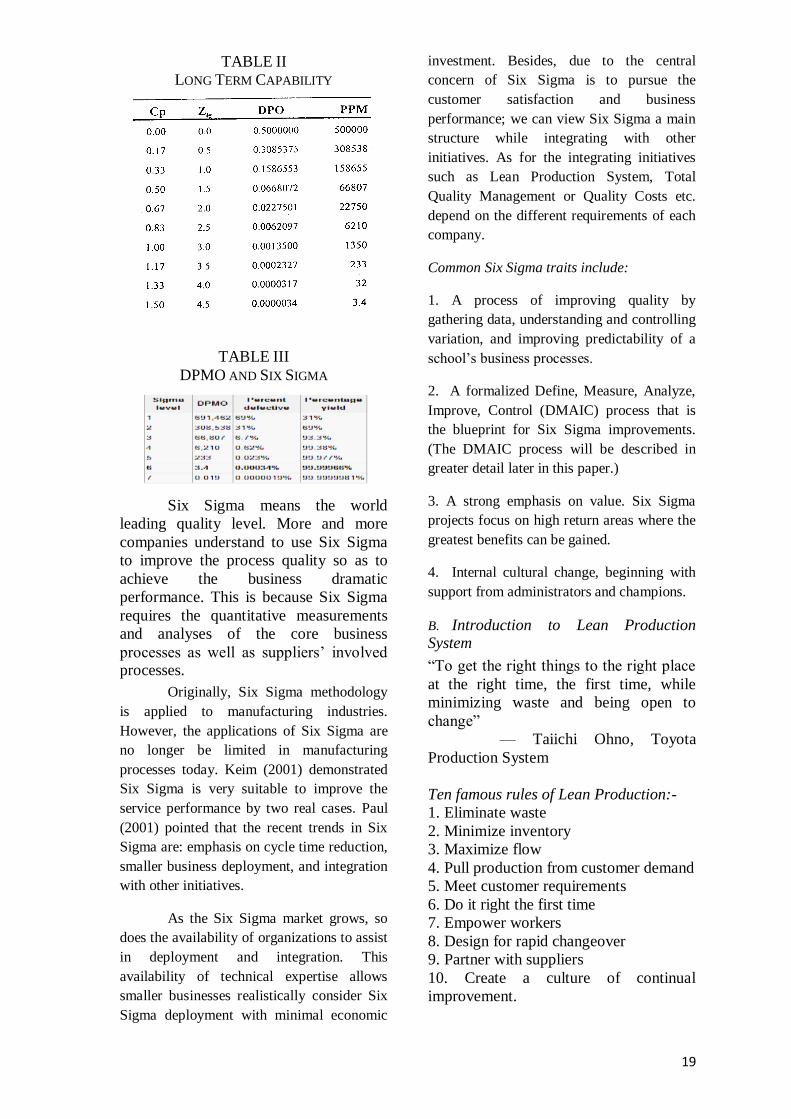
DPMO and Sigma Sigma
Following tables I, II, III shows the
sigma values and their corresponding
DPMO values.
TABLE I
SHORT TERM CAPABILITY
19
TABLE II
LONG TERM CAPABILITY
TABLE III
DPMO AND SIX SIGMA
Six Sigma means the world
leading quality level. More and more
companies understand to use Six Sigma
to improve the process quality so as to
achieve the business dramatic
performance. This is because Six Sigma
requires the quantitative measurements
and analyses of the core business
processes as well as suppliers’ involved processes.
Originally, Six Sigma methodology
is applied to manufacturing industries.
However, the applications of Six Sigma are
no longer be limited in manufacturing
processes today. Keim (2001) demonstrated
Six Sigma is very suitable to improve the
service performance by two real cases. Paul
(2001) pointed that the recent trends in Six
Sigma are: emphasis on cycle time reduction,
smaller business deployment, and integration
with other initiatives.
As the Six Sigma market grows, so
does the availability of organizations to assist
in deployment and integration. This
availability of technical expertise allows
smaller businesses realistically consider Six
Sigma deployment with minimal economic
investment. Besides, due to the central
concern of Six Sigma is to pursue the
customer satisfaction and business
performance; we can view Six Sigma a main
structure while integrating with other
initiatives. As for the integrating initiatives
such as Lean Production System, Total
Quality Management or Quality Costs etc.
depend on the different requirements of each
company.
Common Six Sigma traits include:
1. A process of improving quality by
gathering data, understanding and controlling
variation, and improving predictability of a
school’s business processes.
2. A formalized Define, Measure, Analyze,
Improve, Control (DMAIC) process that is
the blueprint for Six Sigma improvements.
(The DMAIC process will be described in
greater detail later in this paper.)
3. A strong emphasis on value. Six Sigma
projects focus on high return areas where the
greatest benefits can be gained.
4. Internal cultural change, beginning with
support from administrators and champions.
B. Introduction to Lean Production System
“To get the right things to the right place
at the right time, the first time, while
minimizing waste and being open to
change”
— Taiichi Ohno, Toyota
Production System
Ten famous rules of Lean Production:-
1. Eliminate waste
2. Minimize inventory
3. Maximize flow
4. Pull production from customer demand
5. Meet customer requirements
6. Do it right the first time
7. Empower workers
8. Design for rapid changeover
9. Partner with suppliers
10. Create a culture of continual
improvement.
20
Lean Production System (also called
Toyota Production System) is the world
famous production system developed and
practiced by Toyota mobile company for a
long time. It is based on two concepts: “Just-
In-Time” and “Jidohka”. [Jidoka, Japanese
term, to mean "quality-at-the-source” or
"autonomation"] Both are based on varying
thinking to improve the business process,
enhance quality, production and competitive
position. This kind of production system is
very flexible to the dynamic change of
market demands, and Lean Production
System is established by many small group
improvement activities to eliminate all kinds
of wastes in the business.
An important literature written by
Spear and Bowen (1999) published in
Harvard Business Review pointed that, the
Toyota Production System and the scientific
method that underpins it were not imposed
on Toyota – they were not even chosen
consciously. The system grew naturally out
of the workings of the company over five
decades. As a result, it has never been written
down, and Toyota’s workers often are not
able to articulate it. That’s why it’s so hard
for outsiders to grasp. In the article, Spear
and Bowen attempted to lay out how
Toyota’s system works. They tried to make
explicit what is implicit. Finally, they
described four principles – three rules of
design, which show how Toyota sets up all
its operations as experiments, and one rule of
improvement, which describes how Toyota
teaches the scientific method to workers at
every level of the organization. It is these
rules –and not the specific practices and tools
that people observe during their plant visits –
that in their opinion form the essence of
Toyota’s system. Hence the two authors
called the rules as the DNA of the Toyota
Production System.
Lean Flow experts have found that
the greatest success can be achieved by
methodically seeking out inefficiencies and
replacing them with “leaner”, more
streamlined processes.
Sources of waste commonly plaguing
most business processes include:
1. Waste of worker movement
(unneeded steps)
2. Waste of making defective
products
3. Waste of overproduction
4. Waste in transportation
5. Waste of processing
6. Waste of time (idle)
7. Waste of stock on hand
Lean Flow is achieved by:
1. Analyzing the steps of a process and
determining which steps add value and which
do not.
2. Calculating the costs associated with
removing non-value-added steps and
comparing those costs versus expected
benefits.
3. Determining the resources required to
support value-added steps while eliminating
non-value added steps.
4. Taking action.
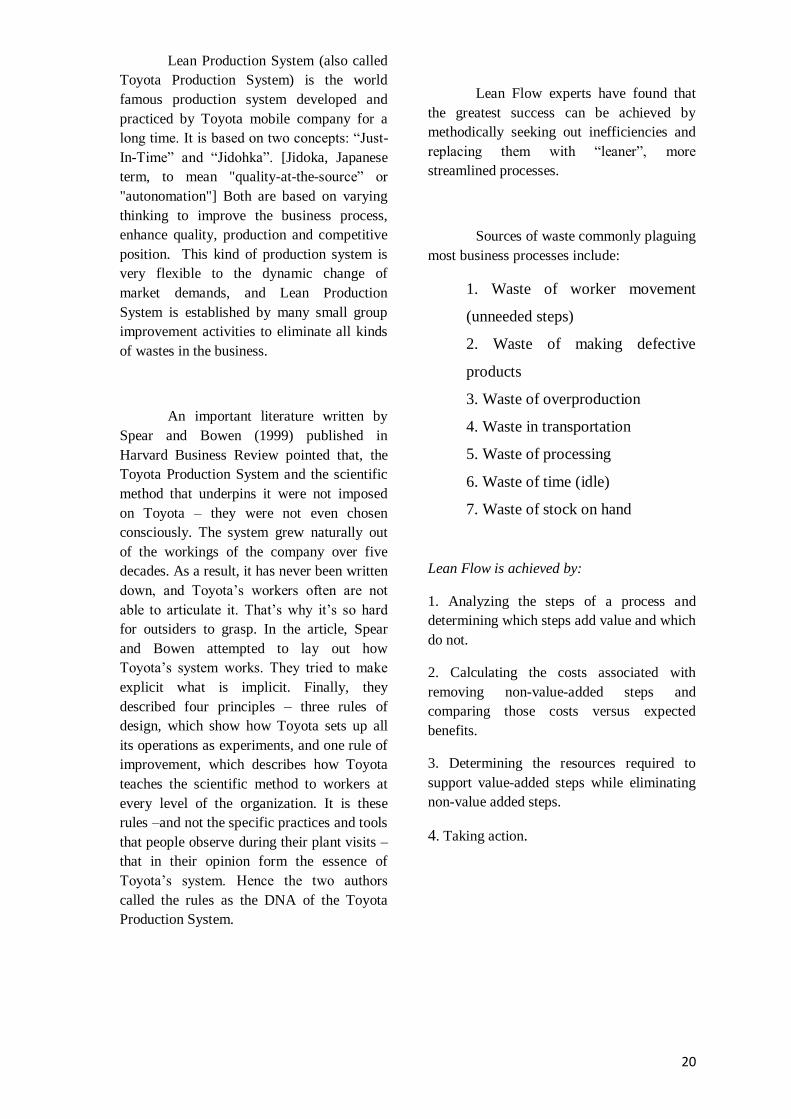
21
Fig. 5 Tools of Lean Production and Six Sigma
C. Characteristics of Methodologies
Characteristics of Six Sigma:
Top-down implementation
Project-focused
Reliance on experts
Use of statistical tools
Rigorous methodology
Emphasis on analysis and financial
results
Characteristics of Lean:
Operational, “shop-floor-focused”
Limited range of application
compared to Six Sigma
Less rigorous methodology compared
to Six Sigma
Challenging when transferring
concepts from production
environment to a service environment.
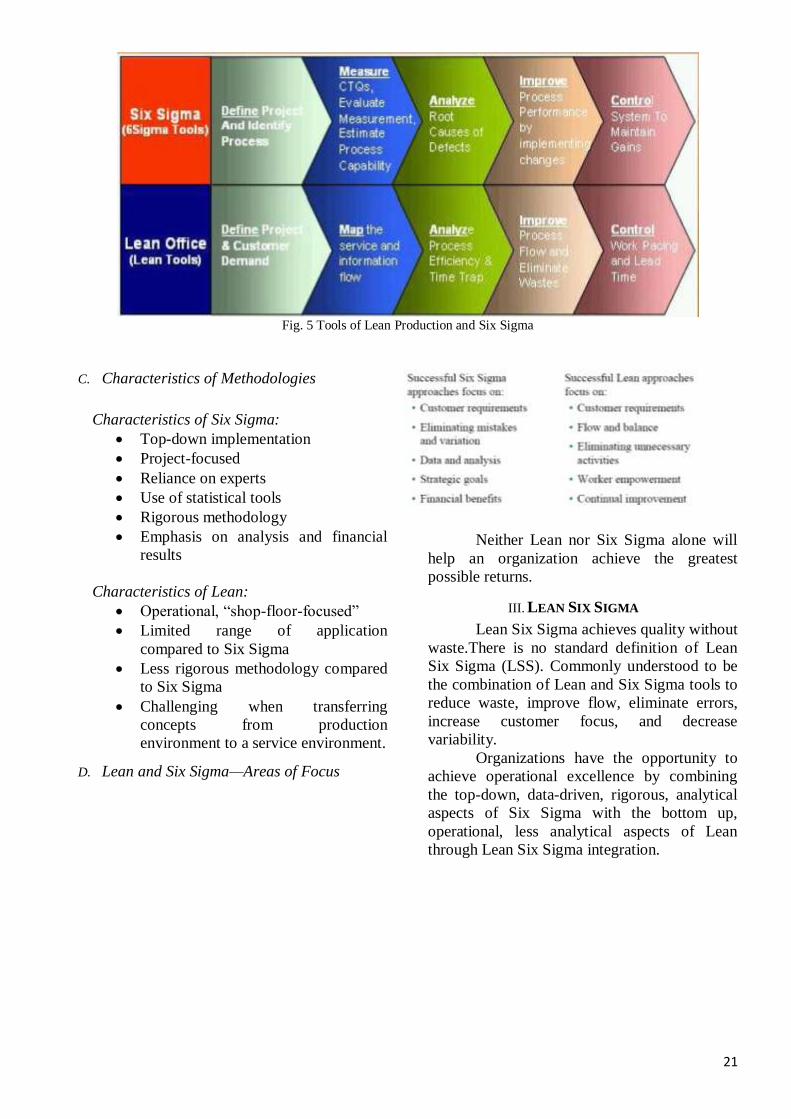
D. Lean and Six Sigma—Areas of Focus
Neither Lean nor Six Sigma alone will
help an organization achieve the greatest
possible returns.
III. LEAN SIX SIGMA
Lean Six Sigma achieves quality without
waste.There is no standard definition of Lean
Six Sigma (LSS). Commonly understood to be
the combination of Lean and Six Sigma tools to
reduce waste, improve flow, eliminate errors,
increase customer focus, and decrease
variability.
Organizations have the opportunity to
achieve operational excellence by combining
the top-down, data-driven, rigorous, analytical
aspects of Six Sigma with the bottom up,
operational, less analytical aspects of Lean
through Lean Six Sigma integration.
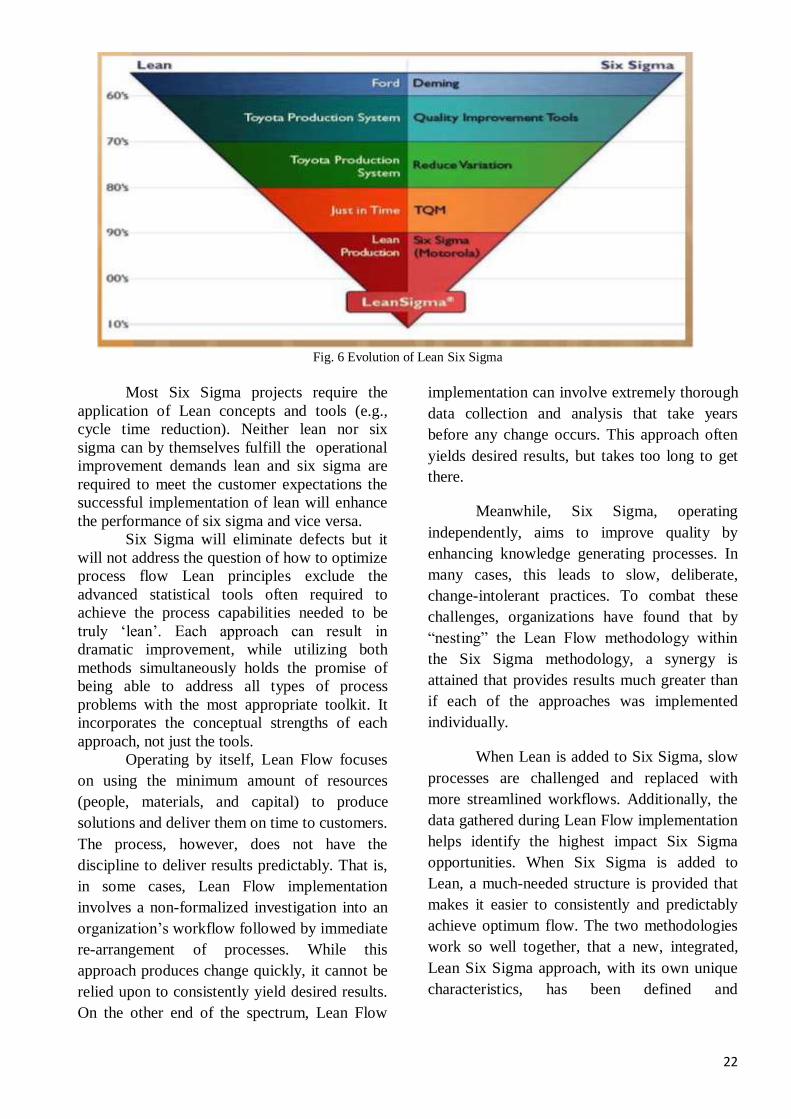
22
Fig. 6 Evolution of Lean Six Sigma
Most Six Sigma projects require the
application of Lean concepts and tools (e.g.,
cycle time reduction). Neither lean nor six
sigma can by themselves fulfill the operational
improvement demands lean and six sigma are
required to meet the customer expectations the
successful implementation of lean will enhance
the performance of six sigma and vice versa.
Six Sigma will eliminate defects but it
will not address the question of how to optimize
process flow Lean principles exclude the
advanced statistical tools often required to
achieve the process capabilities needed to be
truly ‘lean’. Each approach can result in
dramatic improvement, while utilizing both
methods simultaneously holds the promise of
being able to address all types of process
problems with the most appropriate toolkit. It
incorporates the conceptual strengths of each
approach, not just the tools.
Operating by itself, Lean Flow focuses
on using the minimum amount of resources
(people, materials, and capital) to produce
solutions and deliver them on time to customers.
The process, however, does not have the
discipline to deliver results predictably. That is,
in some cases, Lean Flow implementation
involves a non-formalized investigation into an
organization’s workflow followed by immediate
re-arrangement of processes. While this
approach produces change quickly, it cannot be
relied upon to consistently yield desired results.
On the other end of the spectrum, Lean Flow
implementation can involve extremely thorough
data collection and analysis that take years
before any change occurs. This approach often
yields desired results, but takes too long to get
there.
Meanwhile, Six Sigma, operating
independently, aims to improve quality by
enhancing knowledge generating processes. In
many cases, this leads to slow, deliberate,
change-intolerant practices. To combat these
challenges, organizations have found that by
“nesting” the Lean Flow methodology within
the Six Sigma methodology, a synergy is
attained that provides results much greater than
if each of the approaches was implemented
individually.
When Lean is added to Six Sigma, slow
processes are challenged and replaced with
more streamlined workflows. Additionally, the
data gathered during Lean Flow implementation
helps identify the highest impact Six Sigma
opportunities. When Six Sigma is added to
Lean, a much-needed structure is provided that
makes it easier to consistently and predictably
achieve optimum flow. The two methodologies
work so well together, that a new, integrated,
Lean Six Sigma approach, with its own unique
characteristics, has been defined and
23
incorporated by several leading organizations,
including Xerox Corporation.
Lean Six Sigma is the application of
lean techniques to increase speed and reduce
waste, while employing Six Sigma processes to
improve quality and focus on the Voice of the
Customer. Lean Six Sigma means doing things
right the first time, only doing the things that
generate value, and doing it all quickly and
efficiently.
DMAIC Model
Some integration models are introduced
to provide some guidance about how to properly
integrate and apply the best of both systems
(Jiang, et al., 2001). In this paper, we will use
the best combination of lean and Six Sigma
techniques to create a robust solution.
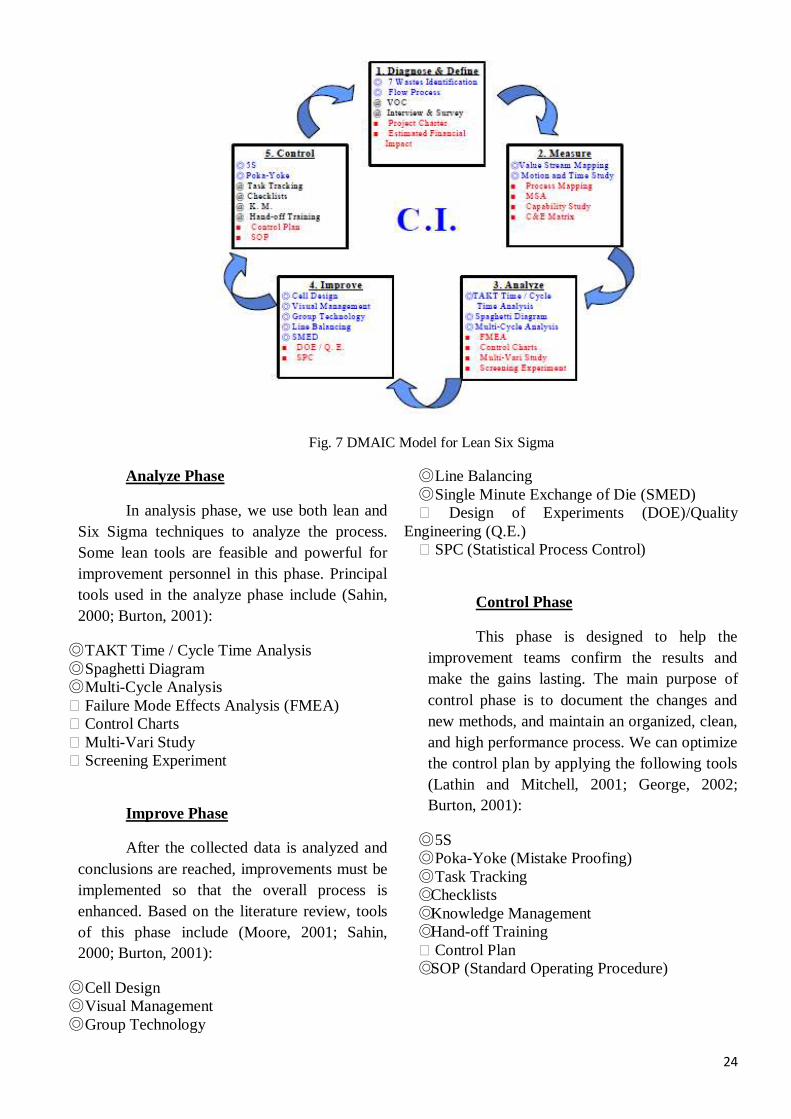
As illustrated in following Figure 7, this
model is named “DMAIC” which represents a
logical, sequential structure for driving process
improvement. We use the roadmap (Diagnose
and Define – Measure – Analyze – Improve –
Control) to provide a disciplined methodology
and a robust solution for firms that are willing
to conduct both Six Sigma and lean production
systems. There are some combined techniques
to form a complete set of improvement
framework in each of the five-infrastructure
shell.
In Fig.7 the blue ones (◎) represent lean
concept tools, the red ones (■) stand for six
Sigma concept techniques and the black ones
(@) symbolize concepts or tools exist in both
Six Sigma and lean production. In addition, the
roadmap is a continuous improvement process
circle that is the pursuit for operational
excellence.
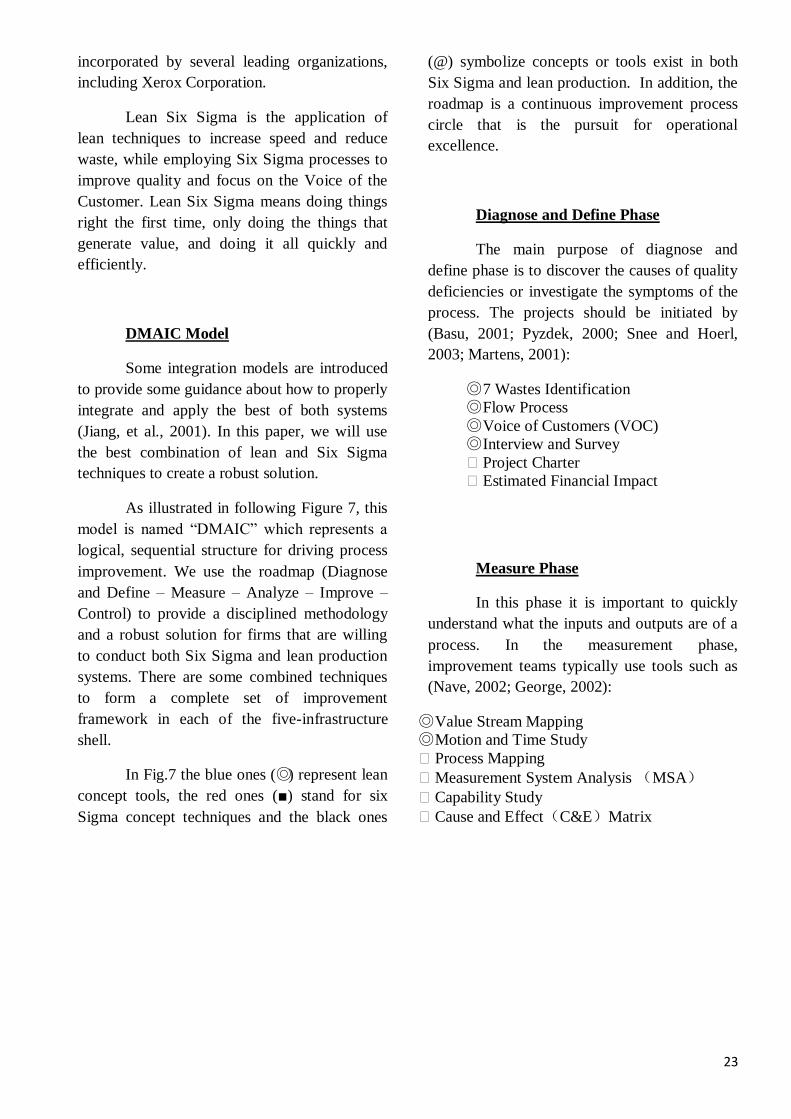
Diagnose and Define Phase
The main purpose of diagnose and
define phase is to discover the causes of quality
deficiencies or investigate the symptoms of the
process. The projects should be initiated by
(Basu, 2001; Pyzdek, 2000; Snee and Hoerl,
2003; Martens, 2001):
◎ 7 Wastes Identification
◎ Flow Process
◎ Voice of Customers (VOC)
◎ Interview and Survey
� Project Charter
� Estimated Financial Impact
Measure Phase
In this phase it is important to quickly
understand what the inputs and outputs are of a
process. In the measurement phase,
improvement teams typically use tools such as
(Nave, 2002; George, 2002):
◎ Value Stream Mapping
◎ Motion and Time Study
� Process Mapping
� Measurement System Analysis (MSA)
� Capability Study
� Cause and Effect(C&E)Matrix
24
Fig. 7 DMAIC Model for Lean Six Sigma
Analyze Phase
In analysis phase, we use both lean and
Six Sigma techniques to analyze the process.
Some lean tools are feasible and powerful for
improvement personnel in this phase. Principal
tools used in the analyze phase include (Sahin,
2000; Burton, 2001):
◎ TAKT Time / Cycle Time Analysis
◎ Spaghetti Diagram
◎ Multi-Cycle Analysis
� Failure Mode Effects Analysis (FMEA)
� Control Charts
� Multi-Vari Study
� Screening Experiment
Improve Phase
After the collected data is analyzed and
conclusions are reached, improvements must be
implemented so that the overall process is
enhanced. Based on the literature review, tools
of this phase include (Moore, 2001; Sahin,
2000; Burton, 2001):
◎ Cell Design
◎ Visual Management
◎ Group Technology
◎ Line Balancing
◎ Single Minute Exchange of Die (SMED)
� Design of Experiments (DOE)/Quality
Engineering (Q.E.)
� SPC (Statistical Process Control)
Control Phase
This phase is designed to help the
improvement teams confirm the results and
make the gains lasting. The main purpose of
control phase is to document the changes and
new methods, and maintain an organized, clean,
and high performance process. We can optimize
the control plan by applying the following tools
(Lathin and Mitchell, 2001; George, 2002;
Burton, 2001):
◎ 5S
◎ Poka-Yoke (Mistake Proofing)
◎ Task Tracking
◎Checklists
◎Knowledge Management
◎Hand-off Training
� Control Plan
◎SOP (Standard Operating Procedure)
25
Lean Six Sigma Principles
1. Specify value in the eyes of the customer
2. Identify the value stream and eliminate waste /
variation.
3. Make value flow smoothly at the pull of the
customer.
4. Involve, align and empower employees.
5. Continuously improve knowledge in pursuit of
perfection.
Benefits of Lean Six Sigma
1. Achieve total customer satisfaction and
improved operational effectiveness and efficiency
-Remove wasteful/non-value added activities
-Decrease defects and cycle time, and increase
first pass yields
2. Improve communication and teamwork through
a common set of tools and techniques (a
disciplined, repeatable methodology)
3. Develop leaders in breakthrough technologies
to meet stretch goals of producing better products
and services delivered faster and at lower cost
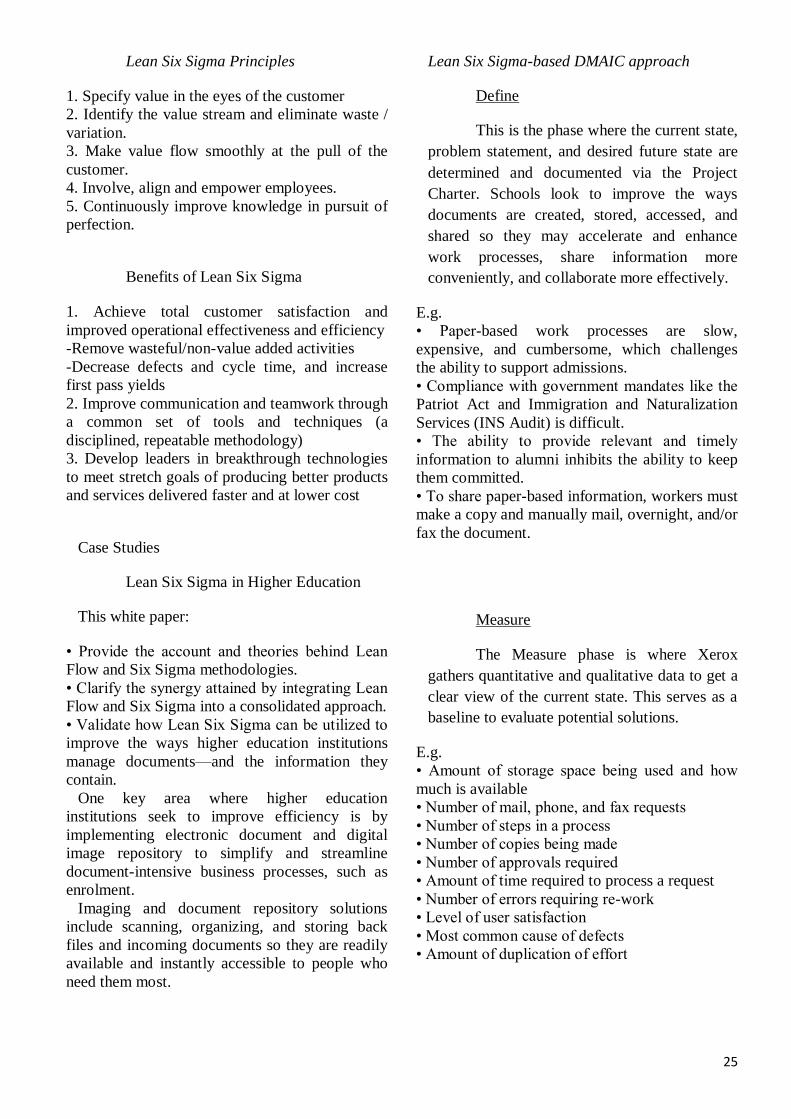
Case Studies
Lean Six Sigma in Higher Education
This white paper:
• Provide the account and theories behind Lean
Flow and Six Sigma methodologies.
• Clarify the synergy attained by integrating Lean
Flow and Six Sigma into a consolidated approach.
• Validate how Lean Six Sigma can be utilized to
improve the ways higher education institutions
manage documents—and the information they
contain.
One key area where higher education
institutions seek to improve efficiency is by
implementing electronic document and digital
image repository to simplify and streamline
document-intensive business processes, such as
enrolment.
Imaging and document repository solutions
include scanning, organizing, and storing back
files and incoming documents so they are readily
available and instantly accessible to people who
need them most.
Lean Six Sigma-based DMAIC approach
Define
This is the phase where the current state,
problem statement, and desired future state are
determined and documented via the Project
Charter. Schools look to improve the ways
documents are created, stored, accessed, and
shared so they may accelerate and enhance
work processes, share information more
conveniently, and collaborate more effectively.
E.g.
• Paper-based work processes are slow,
expensive, and cumbersome, which challenges
the ability to support admissions.
• Compliance with government mandates like the
Patriot Act and Immigration and Naturalization
Services (INS Audit) is difficult.
• The ability to provide relevant and timely
information to alumni inhibits the ability to keep
them committed.
• To share paper-based information, workers must
make a copy and manually mail, overnight, and/or
fax the document.
Measure
The Measure phase is where Xerox
gathers quantitative and qualitative data to get a
clear view of the current state. This serves as a
baseline to evaluate potential solutions.
E.g.
• Amount of storage space being used and how
much is available
• Number of mail, phone, and fax requests
• Number of steps in a process
• Number of copies being made
• Number of approvals required
• Amount of time required to process a request
• Number of errors requiring re-work
• Level of user satisfaction
• Most common cause of defects
• Amount of duplication of effort
26
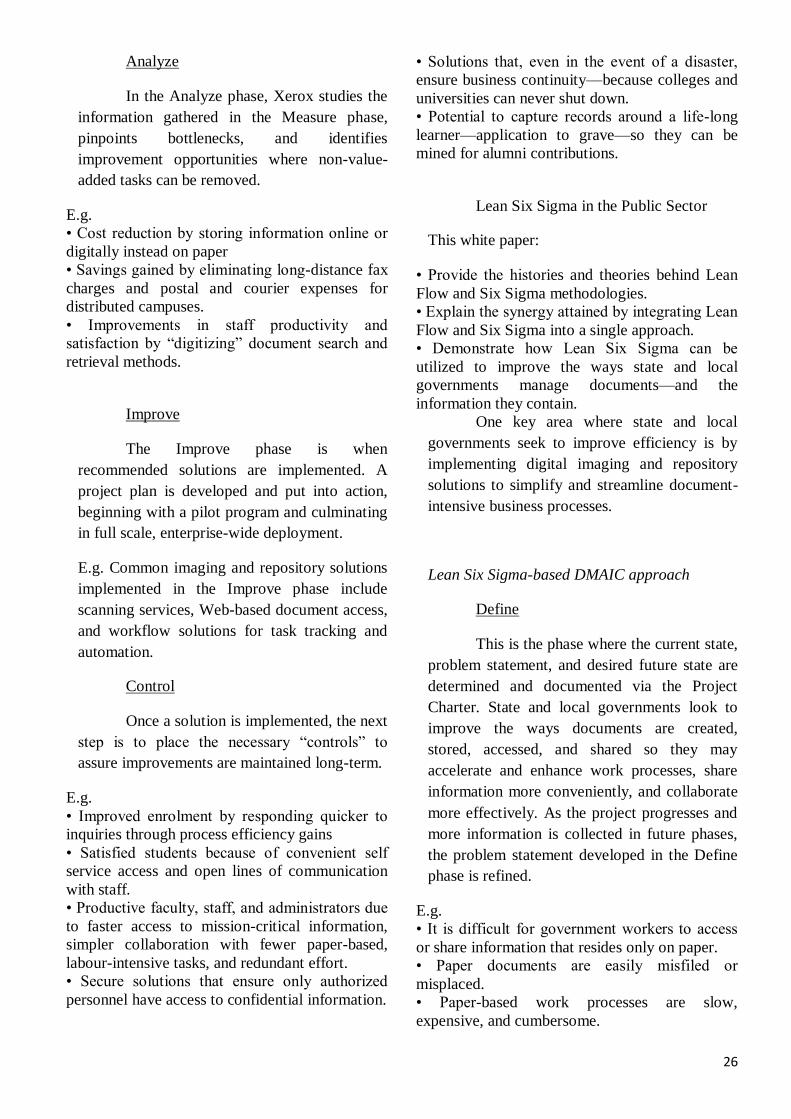
Analyze
In the Analyze phase, Xerox studies the
information gathered in the Measure phase,
pinpoints bottlenecks, and identifies
improvement opportunities where non-value-
added tasks can be removed.
E.g.
• Cost reduction by storing information online or
digitally instead on paper
• Savings gained by eliminating long-distance fax
charges and postal and courier expenses for
distributed campuses.
• Improvements in staff productivity and
satisfaction by “digitizing” document search and
retrieval methods.
Improve
The Improve phase is when
recommended solutions are implemented. A
project plan is developed and put into action,
beginning with a pilot program and culminating
in full scale, enterprise-wide deployment.
E.g. Common imaging and repository solutions
implemented in the Improve phase include
scanning services, Web-based document access,
and workflow solutions for task tracking and
automation.
Control
Once a solution is implemented, the next
step is to place the necessary “controls” to
assure improvements are maintained long-term.
E.g.
• Improved enrolment by responding quicker to
inquiries through process efficiency gains
• Satisfied students because of convenient self
service access and open lines of communication
with staff.
• Productive faculty, staff, and administrators due
to faster access to mission-critical information,
simpler collaboration with fewer paper-based,
labour-intensive tasks, and redundant effort.
• Secure solutions that ensure only authorized
personnel have access to confidential information.
• Solutions that, even in the event of a disaster,
ensure business continuity—because colleges and
universities can never shut down.
• Potential to capture records around a life-long
learner—application to grave—so they can be
mined for alumni contributions.
Lean Six Sigma in the Public Sector
This white paper:
• Provide the histories and theories behind Lean
Flow and Six Sigma methodologies.
• Explain the synergy attained by integrating Lean
Flow and Six Sigma into a single approach.
• Demonstrate how Lean Six Sigma can be
utilized to improve the ways state and local
governments manage documents—and the
information they contain.
One key area where state and local
governments seek to improve efficiency is by
implementing digital imaging and repository
solutions to simplify and streamline document-
intensive business processes.
Lean Six Sigma-based DMAIC approach
Define
This is the phase where the current state,
problem statement, and desired future state are
determined and documented via the Project
Charter. State and local governments look to
improve the ways documents are created,
stored, accessed, and shared so they may
accelerate and enhance work processes, share
information more conveniently, and collaborate
more effectively. As the project progresses and
more information is collected in future phases,
the problem statement developed in the Define
phase is refined.
E.g.
• It is difficult for government workers to access
or share information that resides only on paper.
• Paper documents are easily misfiled or
misplaced.
• Paper-based work processes are slow,
expensive, and cumbersome.
27
• Compliance with the Freedom of Information
Act is difficult.
Measure
The Measure phase is where Xerox
gathers quantitative and qualitative data to get a
clear view of the current state. This serves as a
baseline to evaluate potential solutions.
E.g.
• Amount of storage space being used and how
much is available
• Number of mail, phone, and fax requests
• Number of steps in a process
• Number of copies being made
• Number of approvals required
• Amount of time required to process a request
• Number of errors requiring re-work
• Level of user satisfaction
• Most common cause of defects
• Amount of duplication of effort
Analyze
In the Analyze phase, Xerox studies the
information gathered in the Measure phase,
pinpoints bottlenecks, and identifies
improvement opportunities where non-value-
added tasks can be removed.
E.g.
• Cost reduction by storing information online or
digitally instead of on paper
• Savings gained by eliminating long-distance fax
charges and postal and courier expenses for
distributed campuses.
• Improvements in staff productivity and
satisfaction by “digitizing” document search and
retrieval methods.
Improve
The Improve phase is when
recommended solutions are implemented. A
project plan is developed and put into action,
beginning with a pilot program and culminating
in full scale, enterprise-wide deployment.
E.g. Common imaging and repository solutions
implemented in the Improve phase include
scanning services, Web-based document access,
and workflow solutions for task tracking and
automation.
Control
Once a solution is implemented, the next
step is to place the necessary “controls” to
assure improvements are maintained long-term.
E.g.
• Satisfied constituents because of convenient
self-serve public records access and open lines of
communication with government officials
• Productive government agency workers due to
faster access to mission-critical information and
simpler collaboration with fewer paper-based,
labour-intensive tasks and redundant effort.
• Secure solutions that ensure only authorized
personnel have access to confidential information.
• Reduced costs—a primary objective in the
public sector.
• Solutions that, even in the event of a disaster,
ensure business continuity—because the
government can never shut down.
Lean Six Sigma in the Service Industry
Regarding industry characteristics,
service industry is quite different from
manufacturing industry. Even though there are
more wastes and improvement opportunities,
the application of Six Sigma, Lean Production
System or their integration in service industry is
quite few either in the literature/practice.
28
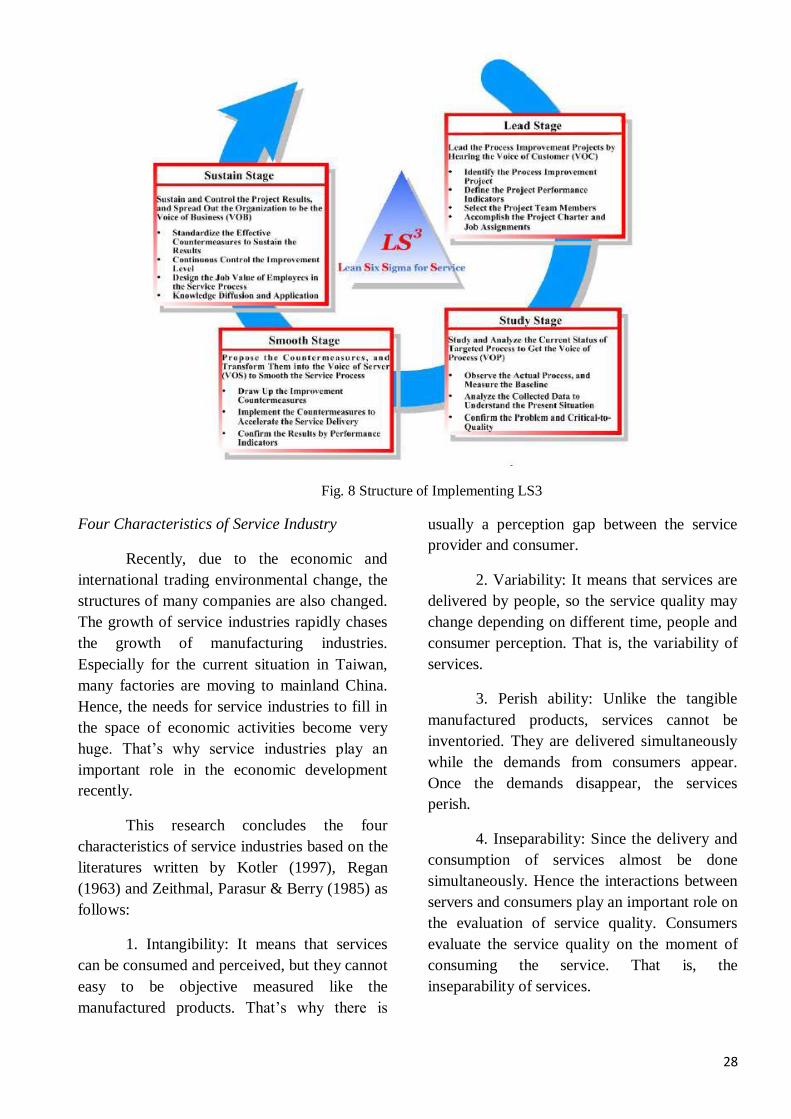
Fig. 8 Structure of Implementing LS3
Four Characteristics of Service Industry
Recently, due to the economic and
international trading environmental change, the
structures of many companies are also changed.
The growth of service industries rapidly chases
the growth of manufacturing industries.
Especially for the current situation in Taiwan,
many factories are moving to mainland China.
Hence, the needs for service industries to fill in
the space of economic activities become very
huge. That’s why service industries play an
important role in the economic development
recently.
This research concludes the four
characteristics of service industries based on the
literatures written by Kotler (1997), Regan
(1963) and Zeithmal, Parasur & Berry (1985) as
follows:
1. Intangibility: It means that services
can be consumed and perceived, but they cannot
easy to be objective measured like the
manufactured products. That’s why there is
usually a perception gap between the service
provider and consumer.
2. Variability: It means that services are
delivered by people, so the service quality may
change depending on different time, people and
consumer perception. That is, the variability of
services.
3. Perish ability: Unlike the tangible
manufactured products, services cannot be
inventoried. They are delivered simultaneously
while the demands from consumers appear.
Once the demands disappear, the services
perish.
4. Inseparability: Since the delivery and
consumption of services almost be done
simultaneously. Hence the interactions between
servers and consumers play an important role on
the evaluation of service quality. Consumers
evaluate the service quality on the moment of
consuming the service. That is, the
inseparability of services.
29
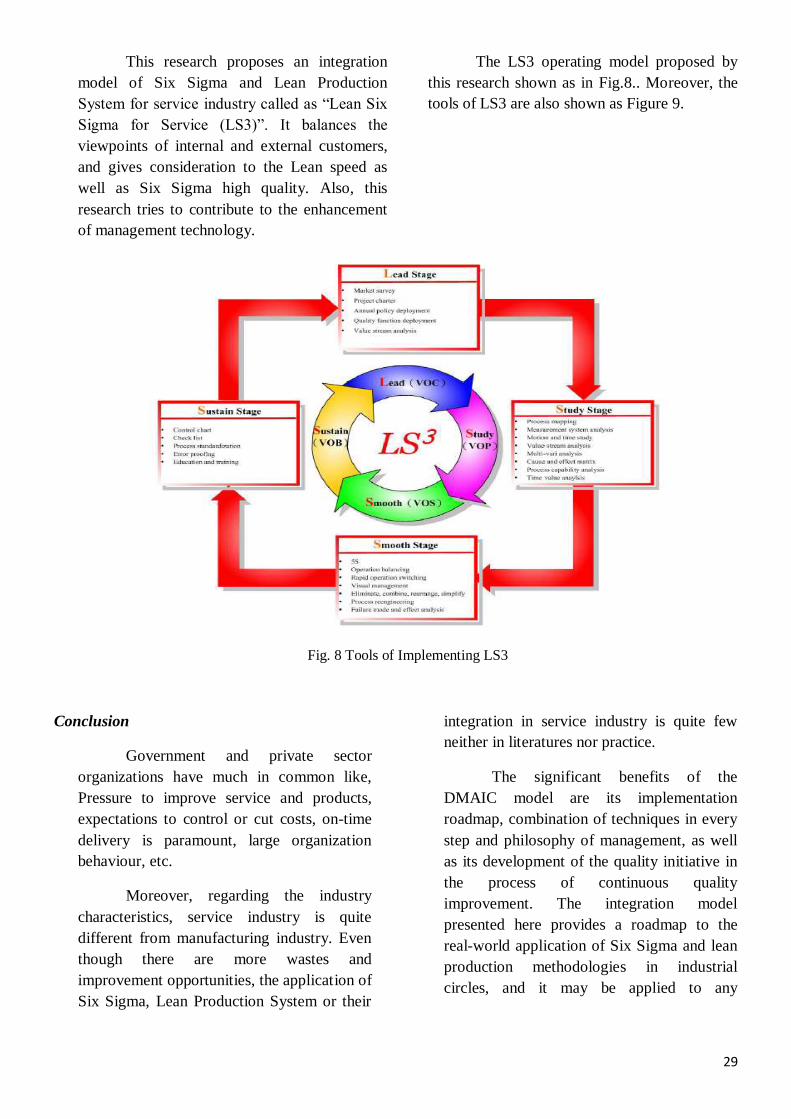
This research proposes an integration
model of Six Sigma and Lean Production
System for service industry called as “Lean Six
Sigma for Service (LS3)”. It balances the
viewpoints of internal and external customers,
and gives consideration to the Lean speed as
well as Six Sigma high quality. Also, this
research tries to contribute to the enhancement
of management technology.
The LS3 operating model proposed by
this research shown as in Fig.8.. Moreover, the
tools of LS3 are also shown as Figure 9.
Fig. 8 Tools of Implementing LS3
Conclusion
Government and private sector
organizations have much in common like,
Pressure to improve service and products,
expectations to control or cut costs, on-time
delivery is paramount, large organization
behaviour, etc.
Moreover, regarding the industry
characteristics, service industry is quite
different from manufacturing industry. Even
though there are more wastes and
improvement opportunities, the application of
Six Sigma, Lean Production System or their
integration in service industry is quite few
neither in literatures nor practice.
The significant benefits of the
DMAIC model are its implementation
roadmap, combination of techniques in every
step and philosophy of management, as well
as its development of the quality initiative in
the process of continuous quality
improvement. The integration model
presented here provides a roadmap to the
real-world application of Six Sigma and lean
production methodologies in industrial
circles, and it may be applied to any

30
industrial circumstance to improve process,
product, and service quality.
Lean Six Sigma can be successful in
higher education, government and private
sector organizations as well as service
industry.
REFERENCES
[1] Ross Raifsnider, Dave Kurt “Lean Six
Sigma In Higher Education”, White Paper,
Sept 2004, Xerox Global Services Inc.
[2] Kent Snyder, Newton Peters “Lean Six
Sigma In The Public Sector”, White Paper,
Sept 2004, Xerox Global Services Inc.
[3] Jui-Chin Jiang, Ming-Li Shiu and Hsin-Ju
Cheng “Integration Of Six Sigma And Lean
Production System For Service Industry”,
Proceedings of Fifth Asia Pacific Industrial
Engineering and Management Systems
Conference 2004
[4] http://www.barringer1.com/jan98prb.htm
[5] http://www.gifted.uconn.edu/siegle/research/
Normal/instructornotes.html
[6] http://en.wikipedia.org/wiki/Six_Sigma
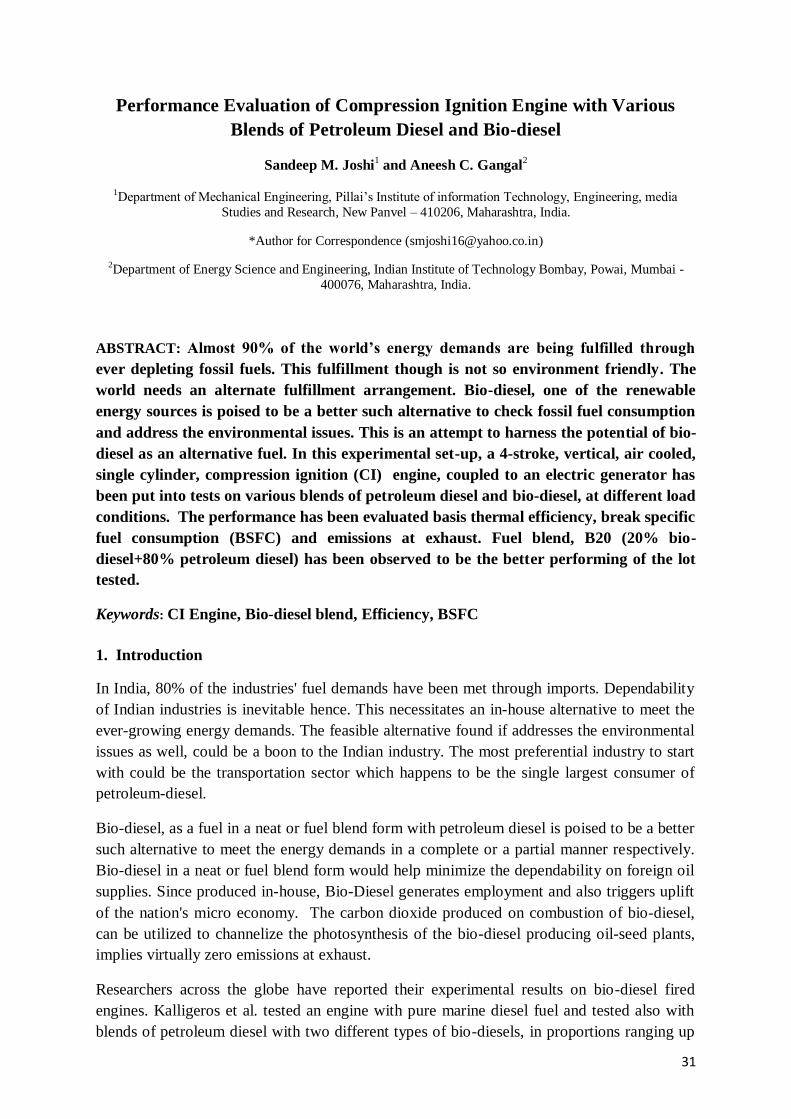
31
Performance Evaluation of Compression Ignition Engine with Various
Blends of Petroleum Diesel and Bio-diesel
Sandeep M. Joshi1 and Aneesh C. Gangal
2
1Department of Mechanical Engineering, Pillai’s Institute of information Technology, Engineering, media
Studies and Research, New Panvel – 410206, Maharashtra, India.
*Author for Correspondence ([email protected])
2Department of Energy Science and Engineering, Indian Institute of Technology Bombay, Powai, Mumbai -
400076, Maharashtra, India.
ABSTRACT: Almost 90% of the world’s energy demands are being fulfilled through
ever depleting fossil fuels. This fulfillment though is not so environment friendly. The
world needs an alternate fulfillment arrangement. Bio-diesel, one of the renewable
energy sources is poised to be a better such alternative to check fossil fuel consumption
and address the environmental issues. This is an attempt to harness the potential of bio-
diesel as an alternative fuel. In this experimental set-up, a 4-stroke, vertical, air cooled,
single cylinder, compression ignition (CI) engine, coupled to an electric generator has
been put into tests on various blends of petroleum diesel and bio-diesel, at different load
conditions. The performance has been evaluated basis thermal efficiency, break specific
fuel consumption (BSFC) and emissions at exhaust. Fuel blend, B20 (20% bio-
diesel+80% petroleum diesel) has been observed to be the better performing of the lot
tested.
Keywords: CI Engine, Bio-diesel blend, Efficiency, BSFC
1. Introduction
In India, 80% of the industries' fuel demands have been met through imports. Dependability
of Indian industries is inevitable hence. This necessitates an in-house alternative to meet the
ever-growing energy demands. The feasible alternative found if addresses the environmental
issues as well, could be a boon to the Indian industry. The most preferential industry to start
with could be the transportation sector which happens to be the single largest consumer of
petroleum-diesel.
Bio-diesel, as a fuel in a neat or fuel blend form with petroleum diesel is poised to be a better
such alternative to meet the energy demands in a complete or a partial manner respectively.
Bio-diesel in a neat or fuel blend form would help minimize the dependability on foreign oil
supplies. Since produced in-house, Bio-Diesel generates employment and also triggers uplift
of the nation's micro economy. The carbon dioxide produced on combustion of bio-diesel,
can be utilized to channelize the photosynthesis of the bio-diesel producing oil-seed plants,
implies virtually zero emissions at exhaust.
Researchers across the globe have reported their experimental results on bio-diesel fired
engines. Kalligeros et al. tested an engine with pure marine diesel fuel and tested also with
blends of petroleum diesel with two different types of bio-diesels, in proportions ranging up
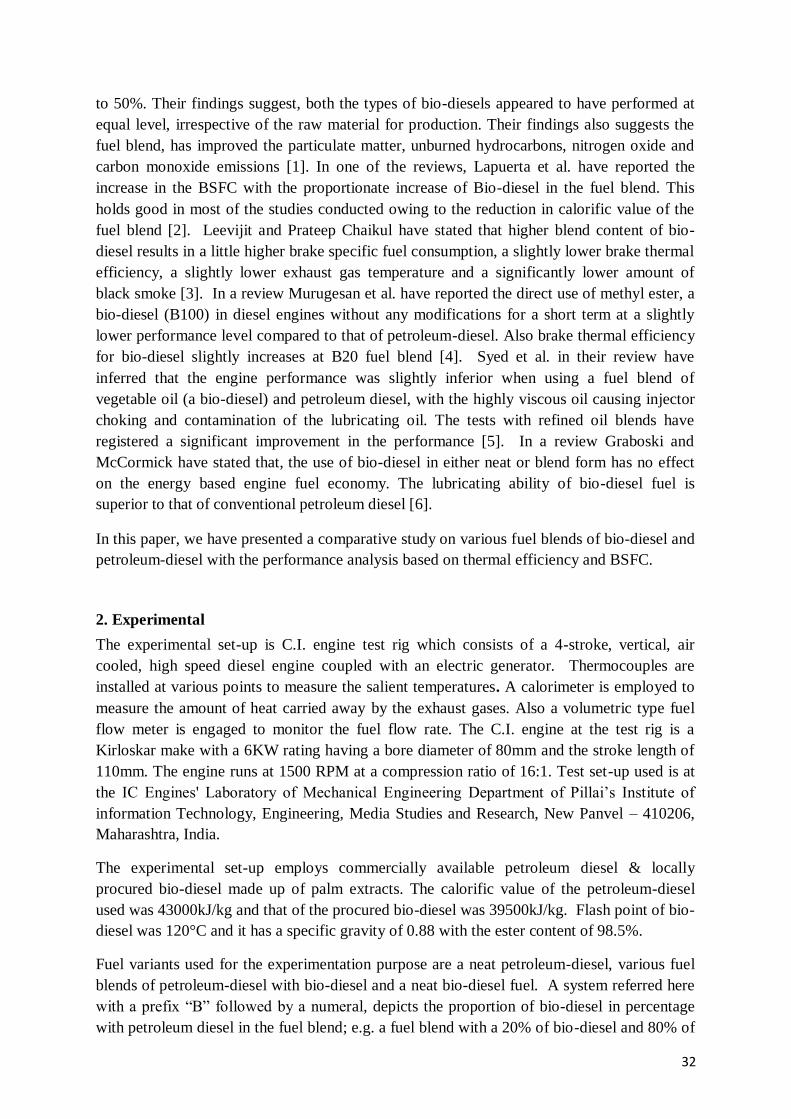
32
to 50%. Their findings suggest, both the types of bio-diesels appeared to have performed at
equal level, irrespective of the raw material for production. Their findings also suggests the
fuel blend, has improved the particulate matter, unburned hydrocarbons, nitrogen oxide and
carbon monoxide emissions [1]. In one of the reviews, Lapuerta et al. have reported the
increase in the BSFC with the proportionate increase of Bio-diesel in the fuel blend. This
holds good in most of the studies conducted owing to the reduction in calorific value of the
fuel blend [2]. Leevijit and Prateep Chaikul have stated that higher blend content of bio-
diesel results in a little higher brake specific fuel consumption, a slightly lower brake thermal
efficiency, a slightly lower exhaust gas temperature and a significantly lower amount of
black smoke [3]. In a review Murugesan et al. have reported the direct use of methyl ester, a
bio-diesel (B100) in diesel engines without any modifications for a short term at a slightly
lower performance level compared to that of petroleum-diesel. Also brake thermal efficiency
for bio-diesel slightly increases at B20 fuel blend [4]. Syed et al. in their review have
inferred that the engine performance was slightly inferior when using a fuel blend of
vegetable oil (a bio-diesel) and petroleum diesel, with the highly viscous oil causing injector
choking and contamination of the lubricating oil. The tests with refined oil blends have
registered a significant improvement in the performance [5]. In a review Graboski and
McCormick have stated that, the use of bio-diesel in either neat or blend form has no effect
on the energy based engine fuel economy. The lubricating ability of bio-diesel fuel is
superior to that of conventional petroleum diesel [6].
In this paper, we have presented a comparative study on various fuel blends of bio-diesel and
petroleum-diesel with the performance analysis based on thermal efficiency and BSFC.
2. Experimental
The experimental set-up is C.I. engine test rig which consists of a 4-stroke, vertical, air
cooled, high speed diesel engine coupled with an electric generator. Thermocouples are
installed at various points to measure the salient temperatures. A calorimeter is employed to
measure the amount of heat carried away by the exhaust gases. Also a volumetric type fuel
flow meter is engaged to monitor the fuel flow rate. The C.I. engine at the test rig is a
Kirloskar make with a 6KW rating having a bore diameter of 80mm and the stroke length of
110mm. The engine runs at 1500 RPM at a compression ratio of 16:1. Test set-up used is at
the IC Engines' Laboratory of Mechanical Engineering Department of Pillai’s Institute of
information Technology, Engineering, Media Studies and Research, New Panvel – 410206,
Maharashtra, India.
The experimental set-up employs commercially available petroleum diesel & locally
procured bio-diesel made up of palm extracts. The calorific value of the petroleum-diesel
used was 43000kJ/kg and that of the procured bio-diesel was 39500kJ/kg. Flash point of bio-
diesel was 120°C and it has a specific gravity of 0.88 with the ester content of 98.5%.
Fuel variants used for the experimentation purpose are a neat petroleum-diesel, various fuel
blends of petroleum-diesel with bio-diesel and a neat bio-diesel fuel. A system referred here
with a prefix “B” followed by a numeral, depicts the proportion of bio-diesel in percentage
with petroleum diesel in the fuel blend; e.g. a fuel blend with a 20% of bio-diesel and 80% of
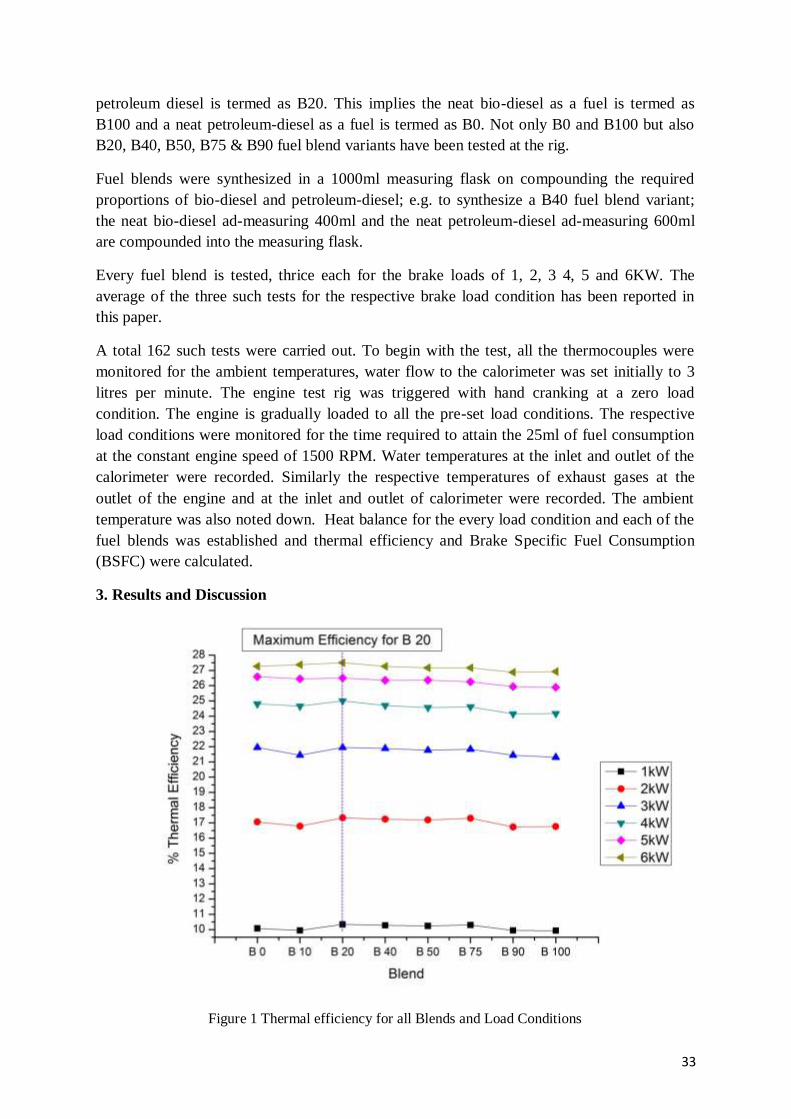
33
petroleum diesel is termed as B20. This implies the neat bio-diesel as a fuel is termed as
B100 and a neat petroleum-diesel as a fuel is termed as B0. Not only B0 and B100 but also
B20, B40, B50, B75 & B90 fuel blend variants have been tested at the rig.
Fuel blends were synthesized in a 1000ml measuring flask on compounding the required
proportions of bio-diesel and petroleum-diesel; e.g. to synthesize a B40 fuel blend variant;
the neat bio-diesel ad-measuring 400ml and the neat petroleum-diesel ad-measuring 600ml
are compounded into the measuring flask.
Every fuel blend is tested, thrice each for the brake loads of 1, 2, 3 4, 5 and 6KW. The
average of the three such tests for the respective brake load condition has been reported in
this paper.
A total 162 such tests were carried out. To begin with the test, all the thermocouples were
monitored for the ambient temperatures, water flow to the calorimeter was set initially to 3
litres per minute. The engine test rig was triggered with hand cranking at a zero load
condition. The engine is gradually loaded to all the pre-set load conditions. The respective
load conditions were monitored for the time required to attain the 25ml of fuel consumption
at the constant engine speed of 1500 RPM. Water temperatures at the inlet and outlet of the
calorimeter were recorded. Similarly the respective temperatures of exhaust gases at the
outlet of the engine and at the inlet and outlet of calorimeter were recorded. The ambient
temperature was also noted down. Heat balance for the every load condition and each of the
fuel blends was established and thermal efficiency and Brake Specific Fuel Consumption
(BSFC) were calculated.
3. Results and Discussion
Figure 1 Thermal efficiency for all Blends and Load Conditions
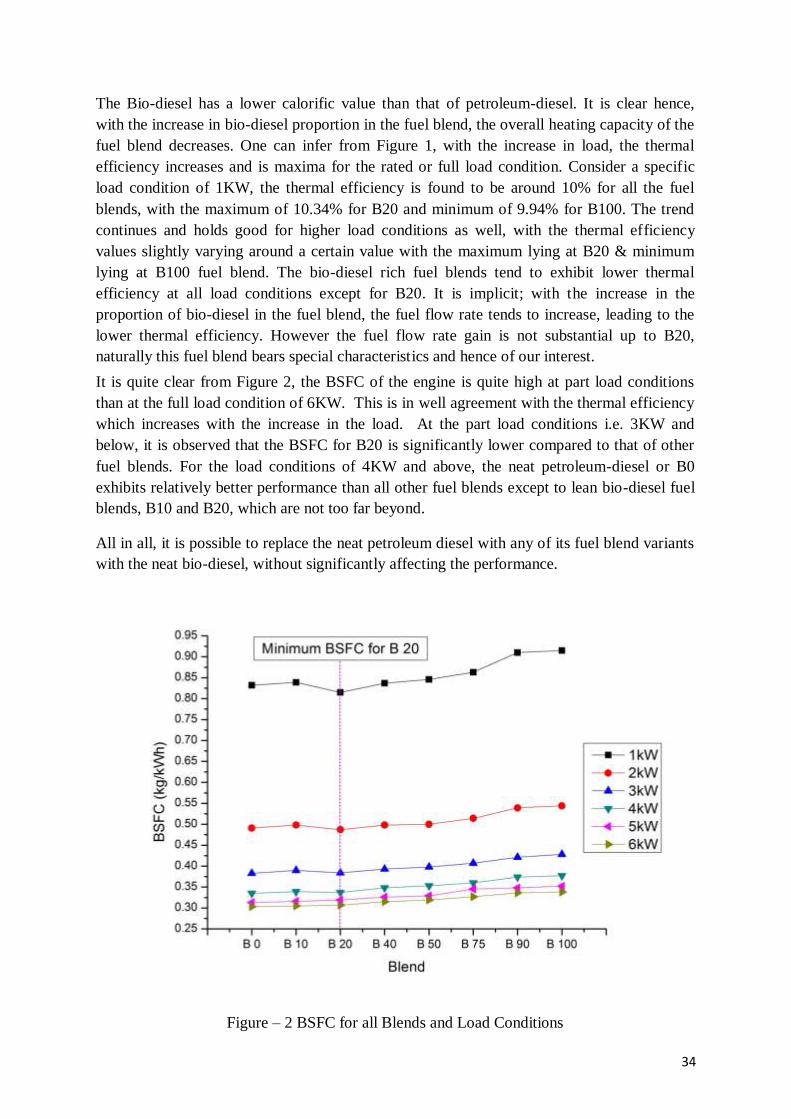
34
The Bio-diesel has a lower calorific value than that of petroleum-diesel. It is clear hence,
with the increase in bio-diesel proportion in the fuel blend, the overall heating capacity of the
fuel blend decreases. One can infer from Figure 1, with the increase in load, the thermal
efficiency increases and is maxima for the rated or full load condition. Consider a specific
load condition of 1KW, the thermal efficiency is found to be around 10% for all the fuel
blends, with the maximum of 10.34% for B20 and minimum of 9.94% for B100. The trend
continues and holds good for higher load conditions as well, with the thermal efficiency
values slightly varying around a certain value with the maximum lying at B20 & minimum
lying at B100 fuel blend. The bio-diesel rich fuel blends tend to exhibit lower thermal
efficiency at all load conditions except for B20. It is implicit; with the increase in the
proportion of bio-diesel in the fuel blend, the fuel flow rate tends to increase, leading to the
lower thermal efficiency. However the fuel flow rate gain is not substantial up to B20,
naturally this fuel blend bears special characteristics and hence of our interest.
It is quite clear from Figure 2, the BSFC of the engine is quite high at part load conditions
than at the full load condition of 6KW. This is in well agreement with the thermal efficiency
which increases with the increase in the load. At the part load conditions i.e. 3KW and
below, it is observed that the BSFC for B20 is significantly lower compared to that of other
fuel blends. For the load conditions of 4KW and above, the neat petroleum-diesel or B0
exhibits relatively better performance than all other fuel blends except to lean bio-diesel fuel
blends, B10 and B20, which are not too far beyond.
All in all, it is possible to replace the neat petroleum diesel with any of its fuel blend variants
with the neat bio-diesel, without significantly affecting the performance.
Figure – 2 BSFC for all Blends and Load Conditions

35
4. Conclusions
Bio-diesel and petroleum-diesel fuel blends were synthesized and tested at a CI engine test
rig. Although the heating capacity of the fuel blend is lesser compared to neat petroleum-
diesel, it is observed that thermal efficiency of the engine improves for certain fuel blends.
The fuel blend B20 is found to be the better alternative basis thermal efficiency concerns.
Also for the lean fuel blends at part load conditions, even the BSFC is found to be lesser than
that of petroleum-diesel. Although with the increase in load, the BSFC increases for rich
fuel blend owing to the decrease in the calorific value of the fuel.
On a broader scale we can conclude with the sure possibility of bio-diesel replacing the
petroleum-diesel either completely or partially without any modifications in the existing CI
engine, with hardly any of a compromise on the performance of it.
5. Acknowledgments
Authors are grateful to Dr. K. M. Vasudevan Pillai, CEO, Mahatma Education Society, for
funding the project.
6. References
S. Kalligeros, F. Zannikos, S. Stournas, E. Lois, G. Anastopoulos, Ch. Teas, F.
Sakellaropoulos, Biomass and Bioenergy, Vol. 24, (2003), 141 – 149
M Lapuerta, Octavio Armas, J Fernandez, Progress in Energy and Combustion Science,
Vol. 34, (2008), 198–223
Leevijit T, Prateep Chaikul G, Fuel (2010), doi:10.1016/j.fuel.2010.10.013
A. Murugesan, C. Umarani, R. Subramanian, N. Nedunchezhian, Renewable and
Sustainable Energy Reviews, Vol. 13, (2009), 653–662
Syed Ameer Basha, K. Raja Gopal, S. Jebaraj, Renewable and Sustainable Energy
Reviews, Vol. 13, (2009), 1628–1634
Michael S. Graboski and Robert L. McCormick, Prog. Energy Combust. Sci. Vol. 24,
(1998), 125-164
This paper has been presented in the International Conference on Renewable Energy, 2011 January 17-21, 2011 at the University of Rajasthan, Jaipur, India.

36
Simplified Production of Large Prototypes using Visible Slicing
Onkar S. Sahasrabudhe1, K.P. Karunakaran
2
1Department of Mechanical Engineering, Pillai’s Institute of information Technology, Engineering, media
Studies and Research, New Panvel – 410206, Maharashtra, India.
2Department of Mechanical Engineering, Indian Institute of Technology Bombay, India.
ABSTRACT: Rapid Prototyping (RP) is a totally automatic generative manufacturing
technique based on a “divide-and-conquer” strategy called ‘slicing’. Simple slicing used
on 2.5-axis kinematics of the existing RP machines is responsible for the staircase error.
Although thinner slices will have less error, the slice thickness has practical limits.
Visible Slicing overcomes these limitations. A few visible slices exactly represent the
object. Each visible slice can be realized using a 3- axis kinematics machine from two
opposite directions. Visible slicing is implemented on Segmented Object Manufacturing
(SOM) machine under development. SOM can produce soft large prototypes faster and
cheaper with accuracy comparable to that of CNC machining.
Keywords: Rapid Prototyping, CNC machining, Visibility.
1. Introduction
CNC machining, a subtractive manufacturing method, is the most accurate process capable of
producing objects out of any material. However, it requires human intervention for generating
the cutter paths. The difficulty in developing foolproof CAPP systems for subtractive
manufacturing led to the development of additive or generative manufacturing methods
popularly known as Rapid prototyping (RP). Essentially RP is a CNC machine with an
embedded CAPP system for generative manufacturing. Total automation in RP is achieved
through a “divide and conquer” strategy called slicing. While slicing simplifies a 3D
manufacturing problem into several 2D manufacturing problems that could be automated, it
is the slicing that also introduces a staircase effect; the resulting stair step errors limit
severely the accuracy of the rapid prototypes (Figure 1). In other words, to achieve total
automation by limiting the motions to 2.5-axis kinematics, existing RP processes compromise
on accuracy. The accuracy can be improved by choosing very thin slices but that would
increase the time for producing the prototype thereby enhancing the cost prohibitively.
Furthermore, the surface finish of the rapid prototypes can hardly match that of the CNC
machined parts as the minimum layer thickness has practical limits. Therefore, ways and
means to increase the slice thickness without sacrificing accuracy have been explored by
many researchers.
The slices of all commercially available RP machines are of uniform thickness and have their
edge surfaces vertical, i.e., both the bottom and top contours of the slice are the same. This
type of slicing is called uniform slicing of 0th order edge surface [1]. As the number of slices
is very high in these RP machines, researchers have been exploring various ways to reduce it.
This led to the proposals for adaptive slicing by several researchers. Adaptive slicing results
in less number of slices than uniform slicing for the same accuracy. In adaptive slicing, the
slice thickness at any location depends on the local geometry, particularly, normal and
curvature. Furthermore, in addition to 0th order edge surfaces, researchers have considered
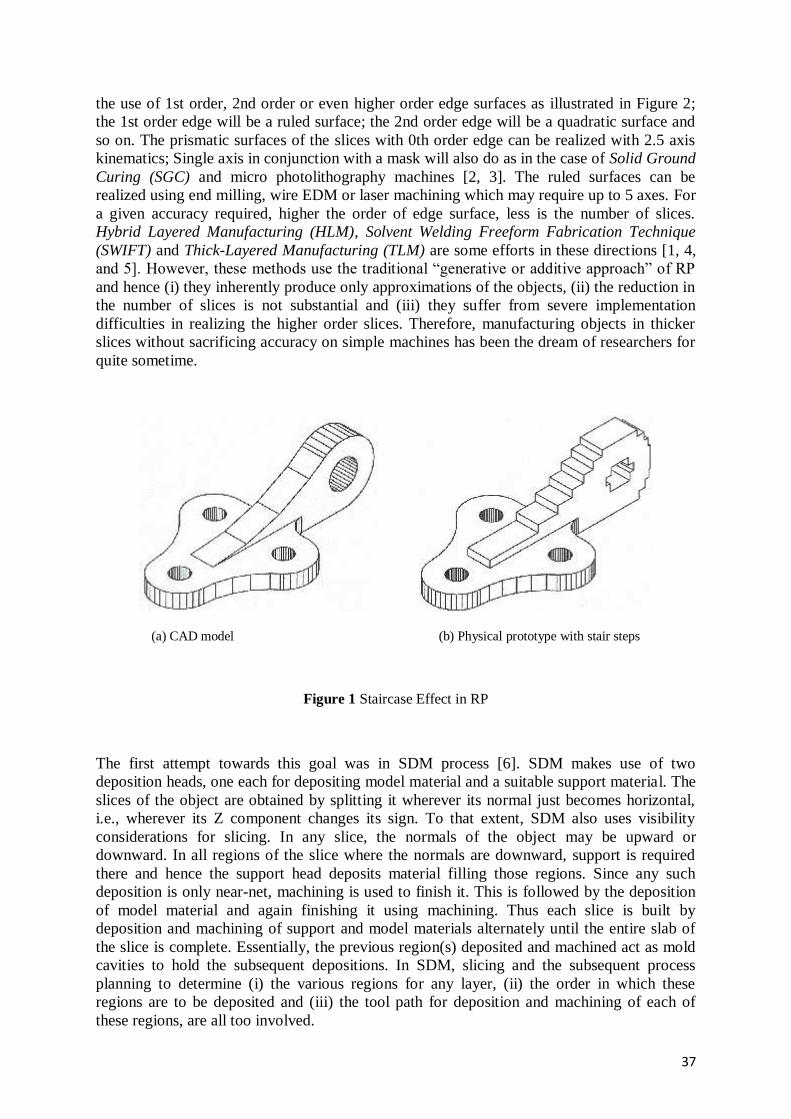
37
the use of 1st order, 2nd order or even higher order edge surfaces as illustrated in Figure 2;
the 1st order edge will be a ruled surface; the 2nd order edge will be a quadratic surface and
so on. The prismatic surfaces of the slices with 0th order edge can be realized with 2.5 axis
kinematics; Single axis in conjunction with a mask will also do as in the case of Solid Ground
Curing (SGC) and micro photolithography machines [2, 3]. The ruled surfaces can be
realized using end milling, wire EDM or laser machining which may require up to 5 axes. For
a given accuracy required, higher the order of edge surface, less is the number of slices.
Hybrid Layered Manufacturing (HLM), Solvent Welding Freeform Fabrication Technique
(SWIFT) and Thick-Layered Manufacturing (TLM) are some efforts in these directions [1, 4,
and 5]. However, these methods use the traditional “generative or additive approach” of RP
and hence (i) they inherently produce only approximations of the objects, (ii) the reduction in
the number of slices is not substantial and (iii) they suffer from severe implementation
difficulties in realizing the higher order slices. Therefore, manufacturing objects in thicker
slices without sacrificing accuracy on simple machines has been the dream of researchers for
quite sometime.
(a) CAD model (b) Physical prototype with stair steps
Figure 1 Staircase Effect in RP
The first attempt towards this goal was in SDM process [6]. SDM makes use of two
deposition heads, one each for depositing model material and a suitable support material. The
slices of the object are obtained by splitting it wherever its normal just becomes horizontal,
i.e., wherever its Z component changes its sign. To that extent, SDM also uses visibility
considerations for slicing. In any slice, the normals of the object may be upward or
downward. In all regions of the slice where the normals are downward, support is required
there and hence the support head deposits material filling those regions. Since any such
deposition is only near-net, machining is used to finish it. This is followed by the deposition
of model material and again finishing it using machining. Thus each slice is built by
deposition and machining of support and model materials alternately until the entire slab of
the slice is complete. Essentially, the previous region(s) deposited and machined act as mold
cavities to hold the subsequent depositions. In SDM, slicing and the subsequent process
planning to determine (i) the various regions for any layer, (ii) the order in which these
regions are to be deposited and (iii) the tool path for deposition and machining of each of
these regions, are all too involved.
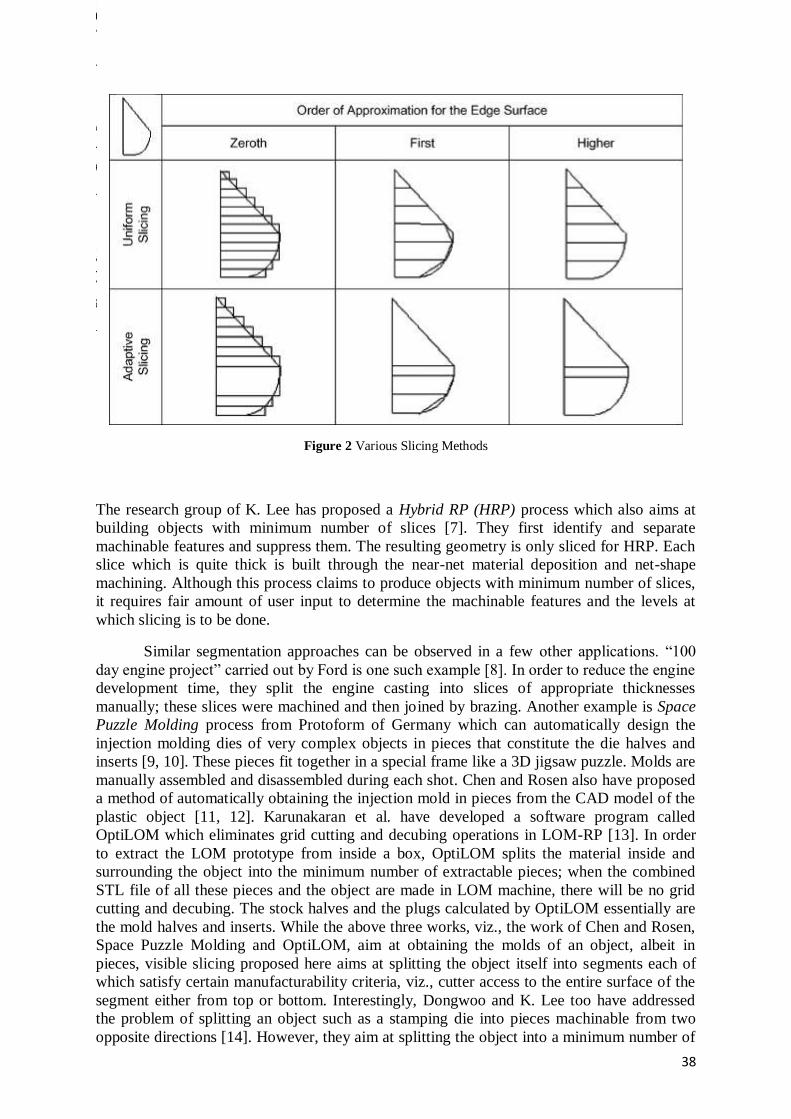
38
Figure 2 Various Slicing Methods
The research group of K. Lee has proposed a Hybrid RP (HRP) process which also aims at
building objects with minimum number of slices [7]. They first identify and separate
machinable features and suppress them. The resulting geometry is only sliced for HRP. Each
slice which is quite thick is built through the near-net material deposition and net-shape
machining. Although this process claims to produce objects with minimum number of slices,
it requires fair amount of user input to determine the machinable features and the levels at
which slicing is to be done.
Similar segmentation approaches can be observed in a few other applications. “100
day engine project” carried out by Ford is one such example [8]. In order to reduce the engine
development time, they split the engine casting into slices of appropriate thicknesses
manually; these slices were machined and then joined by brazing. Another example is Space
Puzzle Molding process from Protoform of Germany which can automatically design the
injection molding dies of very complex objects in pieces that constitute the die halves and
inserts [9, 10]. These pieces fit together in a special frame like a 3D jigsaw puzzle. Molds are
manually assembled and disassembled during each shot. Chen and Rosen also have proposed
a method of automatically obtaining the injection mold in pieces from the CAD model of the
plastic object [11, 12]. Karunakaran et al. have developed a software program called
OptiLOM which eliminates grid cutting and decubing operations in LOM-RP [13]. In order
to extract the LOM prototype from inside a box, OptiLOM splits the material inside and
surrounding the object into the minimum number of extractable pieces; when the combined
STL file of all these pieces and the object are made in LOM machine, there will be no grid
cutting and decubing. The stock halves and the plugs calculated by OptiLOM essentially are
the mold halves and inserts. While the above three works, viz., the work of Chen and Rosen,
Space Puzzle Molding and OptiLOM, aim at obtaining the molds of an object, albeit in
pieces, visible slicing proposed here aims at splitting the object itself into segments each of
which satisfy certain manufacturability criteria, viz., cutter access to the entire surface of the
segment either from top or bottom. Interestingly, Dongwoo and K. Lee too have addressed
the problem of splitting an object such as a stamping die into pieces machinable from two
opposite directions [14]. However, they aim at splitting the object into a minimum number of

39
such machinable pieces so that they can be machined individually and then glued together;
the pair of machining directions corresponding to each piece could be different in their
method.
(a) Visible slices
(b) Visible slices
(c) Visible slices
(d) Visible slices
(e) Visible slices and hori. Levels
Figure 3 Illustration of Visible Slicing
The literature review in slicing reveals several technology gaps. The existing slicing method,
viz., uniform slicing of 0th order edge, used in popular RP machines gives rise to staircase
effect which in turn is responsible for approximation in the prototype geometry, poor surface
finish, large number slices and high cost. Emerging RP machines that make use of higher
order adaptive slicing continue to follow the traditional generative approach. Hence the
prototypes are still approximate albeit better than their predecessors. They use higher axis
kinematics which is too expensive and fool proof CAPP for subtractive manufacturing
required for these systems is still not available. Emerging RP machines that make use of
hybrid approaches, viz., combination of additive and subtractive processes, suffer from
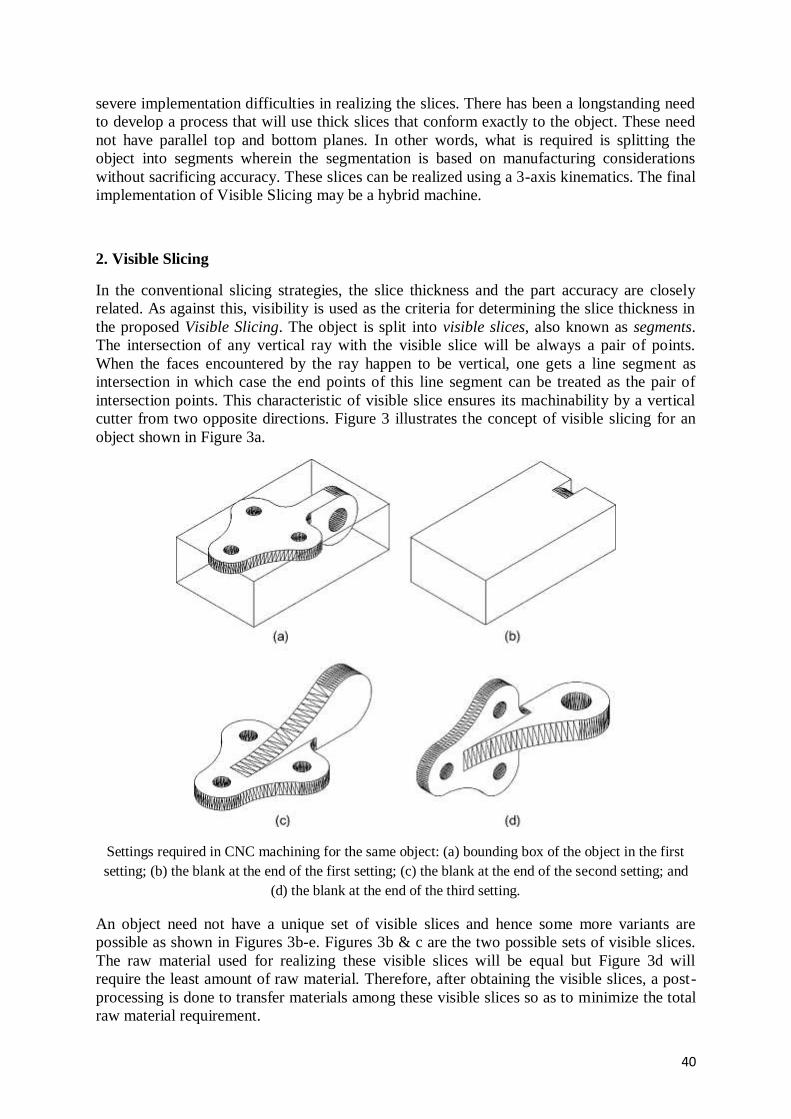
40
severe implementation difficulties in realizing the slices. There has been a longstanding need
to develop a process that will use thick slices that conform exactly to the object. These need
not have parallel top and bottom planes. In other words, what is required is splitting the
object into segments wherein the segmentation is based on manufacturing considerations
without sacrificing accuracy. These slices can be realized using a 3-axis kinematics. The final
implementation of Visible Slicing may be a hybrid machine.
2. Visible Slicing
In the conventional slicing strategies, the slice thickness and the part accuracy are closely
related. As against this, visibility is used as the criteria for determining the slice thickness in
the proposed Visible Slicing. The object is split into visible slices, also known as segments.
The intersection of any vertical ray with the visible slice will be always a pair of points.
When the faces encountered by the ray happen to be vertical, one gets a line segment as
intersection in which case the end points of this line segment can be treated as the pair of
intersection points. This characteristic of visible slice ensures its machinability by a vertical
cutter from two opposite directions. Figure 3 illustrates the concept of visible slicing for an
object shown in Figure 3a.
Settings required in CNC machining for the same object: (a) bounding box of the object in the first
setting; (b) the blank at the end of the first setting; (c) the blank at the end of the second setting; and
(d) the blank at the end of the third setting.
An object need not have a unique set of visible slices and hence some more variants are
possible as shown in Figures 3b-e. Figures 3b & c are the two possible sets of visible slices.
The raw material used for realizing these visible slices will be equal but Figure 3d will
require the least amount of raw material. Therefore, after obtaining the visible slices, a post-
processing is done to transfer materials among these visible slices so as to minimize the total
raw material requirement.
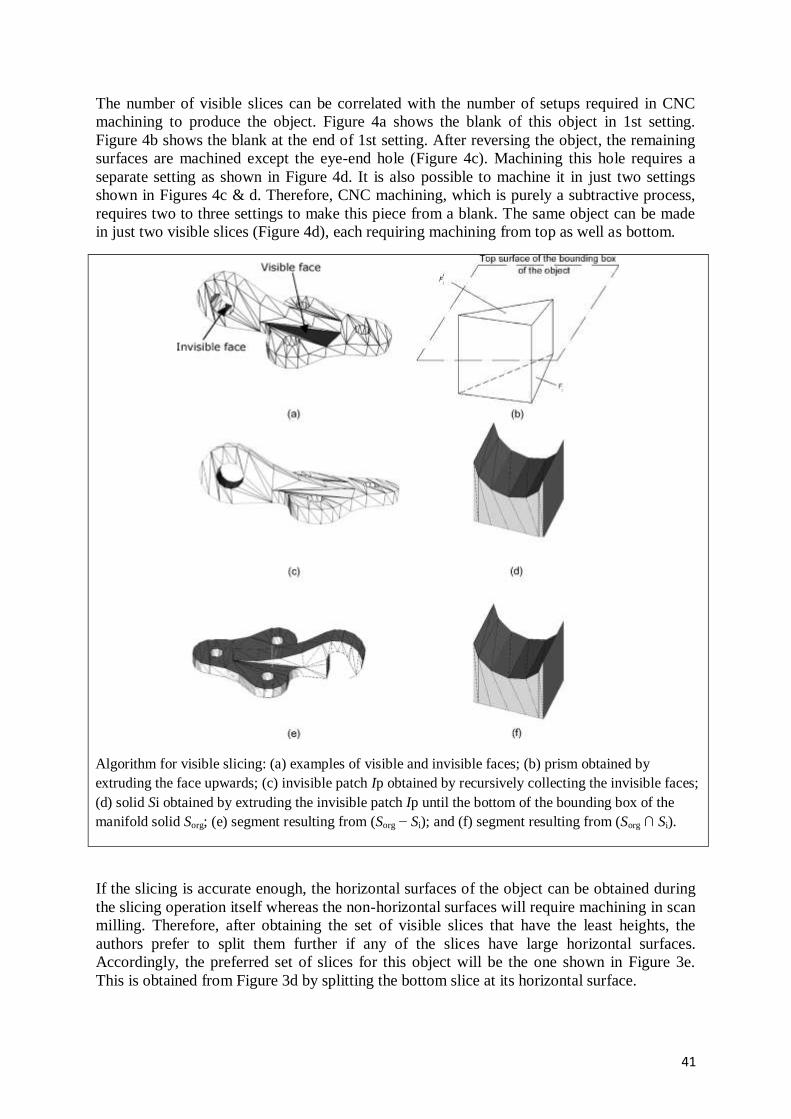
41
The number of visible slices can be correlated with the number of setups required in CNC
machining to produce the object. Figure 4a shows the blank of this object in 1st setting.
Figure 4b shows the blank at the end of 1st setting. After reversing the object, the remaining
surfaces are machined except the eye-end hole (Figure 4c). Machining this hole requires a
separate setting as shown in Figure 4d. It is also possible to machine it in just two settings
shown in Figures 4c & d. Therefore, CNC machining, which is purely a subtractive process,
requires two to three settings to make this piece from a blank. The same object can be made
in just two visible slices (Figure 4d), each requiring machining from top as well as bottom.
Algorithm for visible slicing: (a) examples of visible and invisible faces; (b) prism obtained by
extruding the face upwards; (c) invisible patch Ip obtained by recursively collecting the invisible faces;
(d) solid Si obtained by extruding the invisible patch Ip until the bottom of the bounding box of the
manifold solid Sorg; (e) segment resulting from (Sorg − Si); and (f) segment resulting from (Sorg ∩ Si).
If the slicing is accurate enough, the horizontal surfaces of the object can be obtained during
the slicing operation itself whereas the non-horizontal surfaces will require machining in scan
milling. Therefore, after obtaining the set of visible slices that have the least heights, the
authors prefer to split them further if any of the slices have large horizontal surfaces.
Accordingly, the preferred set of slices for this object will be the one shown in Figure 3e.
This is obtained from Figure 3d by splitting the bottom slice at its horizontal surface.

42
Algorithm for Visible Slicing
A face of the solid will be called invisible face if (i) its normal is upward and (ii) it is
shadowed by its other faces; otherwise, it will be called a visible face. These are illustrated in
Figure 5a. A contiguous set of invisible faces is called invisible patch. The segments of the
object will be identified in a top-down manner in this algorithm. Let S be the set of visible
slices or segments. Algorithm 1 converts the object O into the set of visible slices S. It
produces visible slices but they could be more in number with the possibility of combining
some of the segments into one segment without affecting the visibility. This post-processing
is done by Algorithm 2.
Algorithm 1: Algorithm for determining the V-slices
Initialize S with O.
For each member of S, say Si,
{
status = Segment (Si, Ssegments);
If status = true, then continue as Si is
already a V-slice;
Remove Si from S and add its segments
Ssegments at the end of S;
}
Algorithm 2: Algorithm for the post-processing step to combine
V-slices wherever possible
For each member of S, say Si,
{
For each member of S, say Sj,
{
Continue if i = j;
Continue if Si and Sj do not overlap along z-direction;
Snew = SiUSj;
status = Segment (Snew, Ssegments);
If status = true, // This means that
Snew is a V-slice
{

43
Replace Si by Snew;
Remove Sj from S;
}
}
Function 1, viz., Segment takes a manifold solid S org as input. If S org is already a visible
slice, it returns “status = true”; otherwise, it returns “status = false” and also calculates the
segments S segments of the original solid S org. Note that S segments will be an array of
manifold solids but these may or may not be visible slices.
Function 1. Function to split the given solid Sorg into its segments Ssegments
Status Segment (Sorg, Ssegments)
{
Status = false; // initially assume that Sorg is not a V-slice.
Step 1. Identifying the first invisible face
For every face Fi of the input manifold solid Sorg,
{
Let Fi be the projection of Fi on the top of the bounding box of Sorg. Make an extruded solid P
between Fi and Fi (See Fig. 5(b)).
For every face Fj of Sorg,
{
If (i = j), Continue;
If (Fj is below Fi), Continue;
If Fj intersects P, break this loop since Fj is the first invisible face;
}
if (j > number of faces of Sorg),
{
Status = true; // Declare that the input solid as a V-slice.
Return from this function since the object is already a V-slice;
}
}
Step 2. Recursively growing the first invisible face Fj into an invisible patch Ip.
Initialize the invisible patch Ip with Fj;

44
while (true)
{
For each of the three neighboring faces of Fj, say Fi,
{
For every face Fk of Sorg,
{
If Fk is not same as Fi, continue;
If Fk lies outside the X and Y extents of Fi, continue;
If Fk is below Fi, continue;
If the projections of Fi and Fk in
XY-plane intersect
{
add face Fi to the invisible patch, Ip;
Set Fj = Fi;
}
}
}
If none of the three Fi is added to Ip, break the while loop as construction of the invisible
patch Ip is complete (see Fig. 5(c));
}
Step 3. Obtaining the segments Ssegments from the invisible patch
Make a solid S1 by extruding Ip until the bottom of the bounding box of Sorg (see Fig. 5(d))
Calculate (Sorg − S1) and (Sorg ∩ S1). These are shown in Figs. 5(e) and 5(f). These two solids
are two segments of Sorg.
If these are non-manifold solids, split them into manifold solids. All these manifold solids
will be returned as Ssegments. Note that all the elements of S need not be V-slices. Note also
that S1 and (Sorg ∩ S1) are the same in the illustration of Figs. 5(d) and 5(f); however, this may
not always be the case.
3. Illustrative Example
Gear lever housing, a fairly complex object shown in Figure 6a, was taken for illustrating the
principle of visible slicing. The visible slicing program of the authors was able to split this
object into 4 visible slices or segments. These segments are shown in exploded view in
Figure 6b. These visible slices were built using FDM 1650 RP machine; they could have been
made using a 3-axis CNC machine as well. These four physical segments are shown in
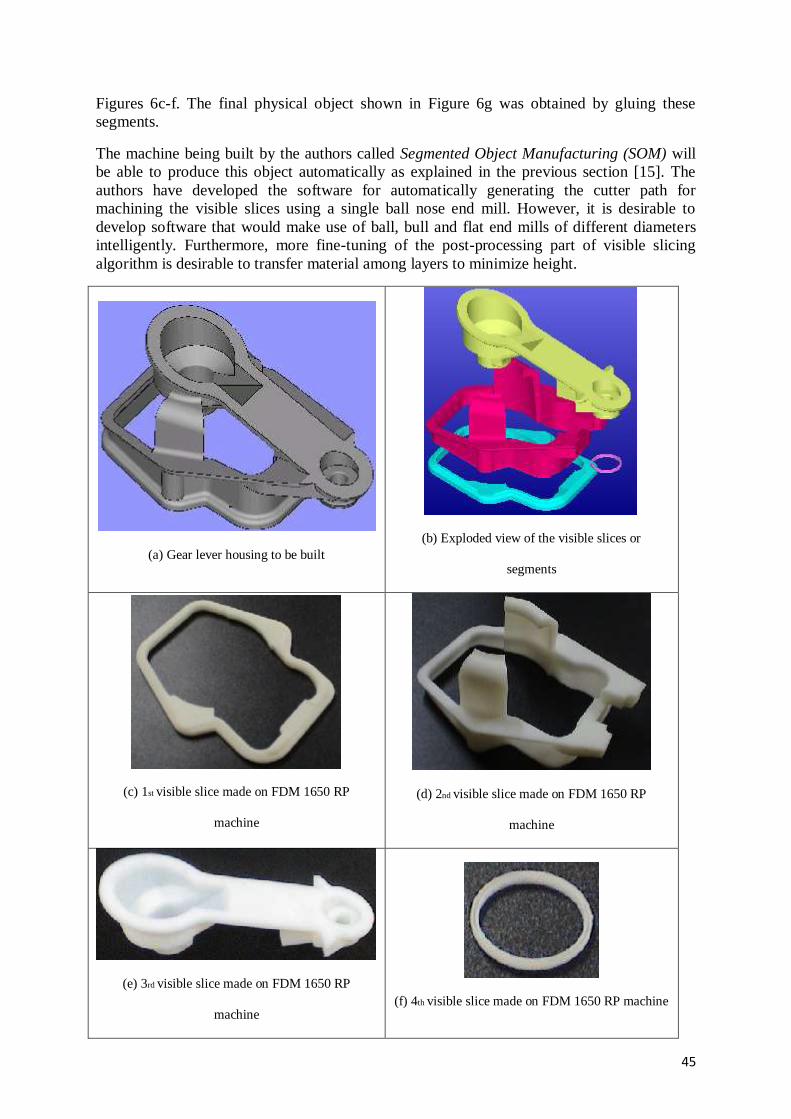
45
Figures 6c-f. The final physical object shown in Figure 6g was obtained by gluing these
segments.
The machine being built by the authors called Segmented Object Manufacturing (SOM) will
be able to produce this object automatically as explained in the previous section [15]. The
authors have developed the software for automatically generating the cutter path for
machining the visible slices using a single ball nose end mill. However, it is desirable to
develop software that would make use of ball, bull and flat end mills of different diameters
intelligently. Furthermore, more fine-tuning of the post-processing part of visible slicing
algorithm is desirable to transfer material among layers to minimize height.
(a) Gear lever housing to be built
(b) Exploded view of the visible slices or
segments
(c) 1st visible slice made on FDM 1650 RP
machine
(d) 2nd visible slice made on FDM 1650 RP
machine
(e) 3rd visible slice made on FDM 1650 RP
machine
(f) 4th visible slice made on FDM 1650 RP machine
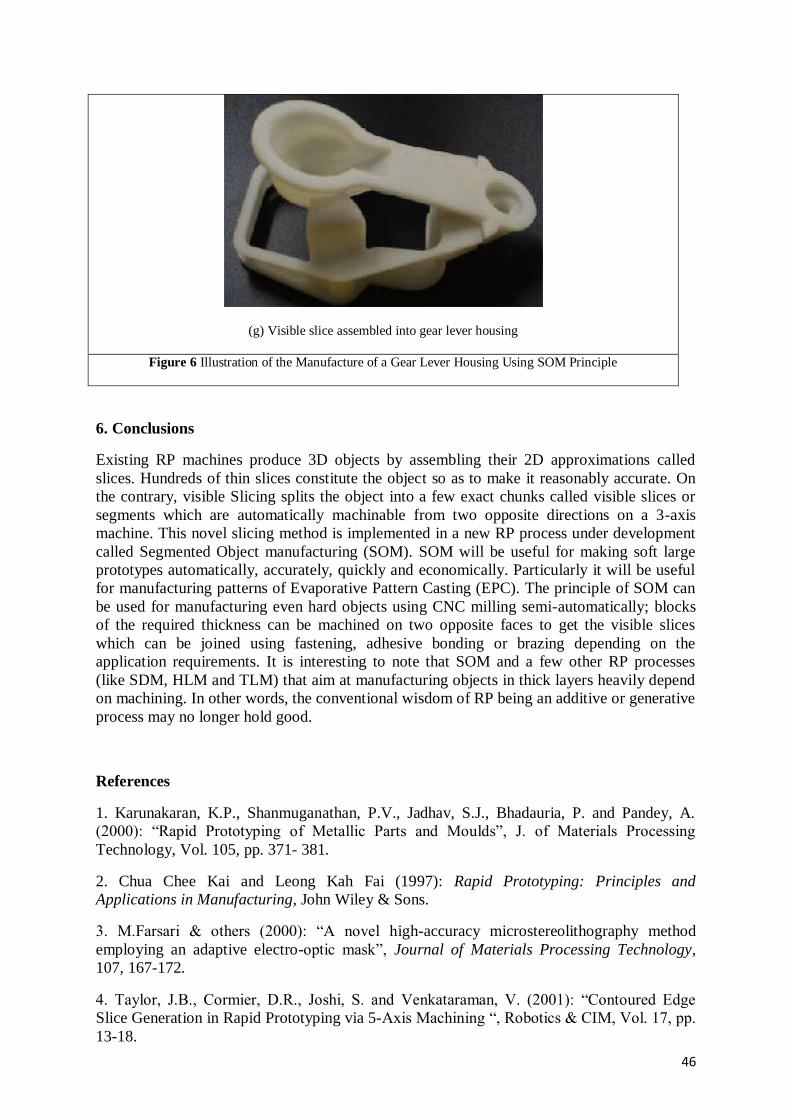
46
(g) Visible slice assembled into gear lever housing
Figure 6 Illustration of the Manufacture of a Gear Lever Housing Using SOM Principle
6. Conclusions
Existing RP machines produce 3D objects by assembling their 2D approximations called
slices. Hundreds of thin slices constitute the object so as to make it reasonably accurate. On
the contrary, visible Slicing splits the object into a few exact chunks called visible slices or
segments which are automatically machinable from two opposite directions on a 3-axis
machine. This novel slicing method is implemented in a new RP process under development
called Segmented Object manufacturing (SOM). SOM will be useful for making soft large
prototypes automatically, accurately, quickly and economically. Particularly it will be useful
for manufacturing patterns of Evaporative Pattern Casting (EPC). The principle of SOM can
be used for manufacturing even hard objects using CNC milling semi-automatically; blocks
of the required thickness can be machined on two opposite faces to get the visible slices
which can be joined using fastening, adhesive bonding or brazing depending on the
application requirements. It is interesting to note that SOM and a few other RP processes
(like SDM, HLM and TLM) that aim at manufacturing objects in thick layers heavily depend
on machining. In other words, the conventional wisdom of RP being an additive or generative
process may no longer hold good.
References
1. Karunakaran, K.P., Shanmuganathan, P.V., Jadhav, S.J., Bhadauria, P. and Pandey, A.
(2000): “Rapid Prototyping of Metallic Parts and Moulds”, J. of Materials Processing
Technology, Vol. 105, pp. 371- 381.
2. Chua Chee Kai and Leong Kah Fai (1997): Rapid Prototyping: Principles and
Applications in Manufacturing, John Wiley & Sons.
3. M.Farsari & others (2000): “A novel high-accuracy microstereolithography method
employing an adaptive electro-optic mask”, Journal of Materials Processing Technology,
107, 167-172.
4. Taylor, J.B., Cormier, D.R., Joshi, S. and Venkataraman, V. (2001): “Contoured Edge
Slice Generation in Rapid Prototyping via 5-Axis Machining “, Robotics & CIM, Vol. 17, pp.
13-18.

47
5. Broek, J.J., Horváth, I., Smit, B., Lennings, A.F., Rusák, Z. and Vergeest, J.S.M. (2002):
“Freeform Thick Layer Object Manufacturing Technology for Large-Sized Physical Models”,
Automation in Construction, Vol. 11, pp. 335-347.
6. Krishnan Ramaswamy (1997): ”Process Planning for Shape Deposition Manufacturing”,
Ph.D. Dissertation, Department of Mechanical Engineering, Stanford University.
7. Junghoon Hur, Kunwoo Lee, Zhu-hu, Jongwon Kim (2002,): “Hybrid Rapid Prototyping
System Using Machining and Deposition”, Computer Aided Design, Vol 34, pp. 741-754.
8. http://rapid.lpt.fi/archives/rp-ml-1997/0366.html (2004): Email Communication of Prof.
Ian Gibson to RPML group.
9. www.protoform.com (2004): Web site of Protoform, Germany.
10. http://www.enimco.com/puzzle.html (2004)
11. Chen, Y., Rosen, D.W. (2003): “A Reverse Glue Approach to Automated Construction of
Multi-Piece Molds”, Journal of Computing and Information Science in Engineering, Vol. 3,
No. 3, pp. 219-230.
12. Chen, Y., Rosen, D.W. (2001): “A Region Based Approach to Automate Design of Multi-
Piece Molds with Applications to Rapid Tooling”, Proceedings of ASME Design Engineering
Technical Conference, September 9-12, Pittsburgh, Pennsylvania.
13. Karunakaran, K.P., Shivmurthy Dibbi, P. Vivekananda Shanmuganathan, Srinivasarao
Kakaraparti and D.Sathyanarayana Raju (2002): "Efficient Stock Cutting in Laminated
Manufacturing", Computer-Aided Design, Vol 34, No. 4, pp. 281-298.
14. Dongwoo Ki and Kunwoo Lee (2002): “Part Decomposition for Die Pattern Making”,
Journal Material processing Technology, Vol. 130-131, pp. 599-607.
15. K.P. Karunakaran, Saurabh Agrawal, Pankaj D. Vengurlekar, Onkar S. Sahasrabudhe,
Vishal Pushpa and Ronald H. Ely (2005): “Segmented Object Manufacturing”, IIE Journal of
Design and Manufacture, Vol. 37, No. 4, pp. 291-302.
This paper is a combined research work of Department of Mechanical Engineering, IIT Bombay and
Department of Mechanical Engineering, Methodist University, USA.

48
-Photgraphs by Avinash Katkar (T.E.Mech)

49
The Nobel Prize
Alfred Nobel left a legacy promoting peace and achievement, yet he made his fortune from a
weapon of war. The son of an arms manufacturer, Nobel was a chemical Engineer with an
interest in explosives. He discovered how to stabilize nitroglycerine named it “dynamite” and
patented it in 1867. Nobel left around 31million Swedish Kronor (valued US $ 240 million
today) in his will to establish a fund rewarding “those who, during the preceding year…have
conferred the greatest benefit on mankind.”
For more than 100 years, Nobel Prizes have had the power to transform scientists into
celebrities, writers and peace activists into legends. Here are few things you would like to
know about Nobel Prizes.
There are 5 Nobel Prize categories: Peace, Literature, Chemistry, Physics and Medicine/
Physiology. An Economic Sciences Prize-the Sveriges Riksbank Prize in the memory of
Alfred Nobel- has also been awarded since 1969.
817 people (40 women) and 23 organizations have been awarded prizes, with 4
individuals getting it twice.
Australian Lawrence Bragg, just 25 years old and the youngest winner, shared the
Physics Prize with his father, William, in 1915.
The Oldest winner was Leonid Hurwicz. He was 90 in 2007 when he got the
Economic Sciences Prize.
Robert Koch, who discovered the TB bacillus, received 55 nominations over 4 years
before he won a prize in 1905.
Two persons declined the Prize: Jean-Paul Sartre (Literature, 1964) and Le Duc Tho
(Peace, 1973).
87 affiliates of UK’s University of Cambridge have won a Nobel Prize- more than any
other institution.
Each prize is now worth 10 million Swedish kronor ($1.45 million), divided equally if a prize
is shared.
Indians in the list;
Ronald Ross, the 1902 Medicine Prize winner for his work on malaria, was born in
Almora (now in Uttarakhand) and did much of his work in India.
Rudyard Kipling, born in Bombay in 1865, got the 1907 Literature Prize.
Rabrindranath Tagore, 1913 Literature Prize. For “his profoundly sen sitive, fresh and
beautiful verse…”said the Nobel citation.
C.V.Raman got the Physics Prize in 1930 for his work on the scattering of light and
for the discovery of the effect named after him.
HarGobind Khorana, geneticist, born in Raipur (British India, now in Pakistan’s
Punjab) shared the 1968 Medicine Prize. He was a US citizen.
Mother Teresa, of Albanian ethnicity, an Indian citizen, won the Peace Prize in 1979.
S.Chandrsekhar, born in Lahore, then British India, got the Physics Prize in 1983 for
his study of stars. He was a US citizen.
Amartya Sen won the 1998 Economics Prize for his contributions to Welfare
economics.
Venkatraman Ramakrishnan, co-winner of the 2009 Chemistry Prize, is a US citizen
who was born in Chidambaram, Tamil Nadu.
- By Ketan Patil (T.E.Mech)
50
My Lovely Angel
Life was full of ups and downs, someone had stole her own view crown,
There was no one she had to blame; every yes was just a shame.
She was running lonely in the crowd; no fellow one was keen to bound,
The voice in her didn't speak for years, maybe lost it somewhere in the tears.
Her mind was full of chaos and things; it needed someone to flap her wings,
Then came this lovely heart and soul, I guess from heaven to make her bold.
He taught her how to be free and strong, gave all his love so that she can run it all along,
And gave her life's beautiful lessons, with all this care she was never blessed.
It made her smile whenever she did, and same was with her when he did,
I asked him once why you came here, he said “in search of LIFE with whom I can share”.
He said his heart was broken & needed care, and when THEY met it mended and repaired,
The timing was perfect for him and her, GOD bless that person who searched the lock for that
key.
Lets come to start his love had no comparison, it made her wise and gave her life a reason,
She flourished a plenty, he knows it all, “Oh my God! Can love do that all?”
The two roads that met are now one; these moments are special that can never be earned,
Stealing it all and keeping it safe, it's the only thing from her that no one can take.
Now there is one fear in her good heart imprisoned, she thinks it may happen someday,
sometime with reason,
If at all someday her Angel will leave, do you think there’s any chance that his love can
live????
-By Yugandhara Sonkusare (S.E.Mech)
- Photograph by Jayesh Raorane (S.E.Mech)
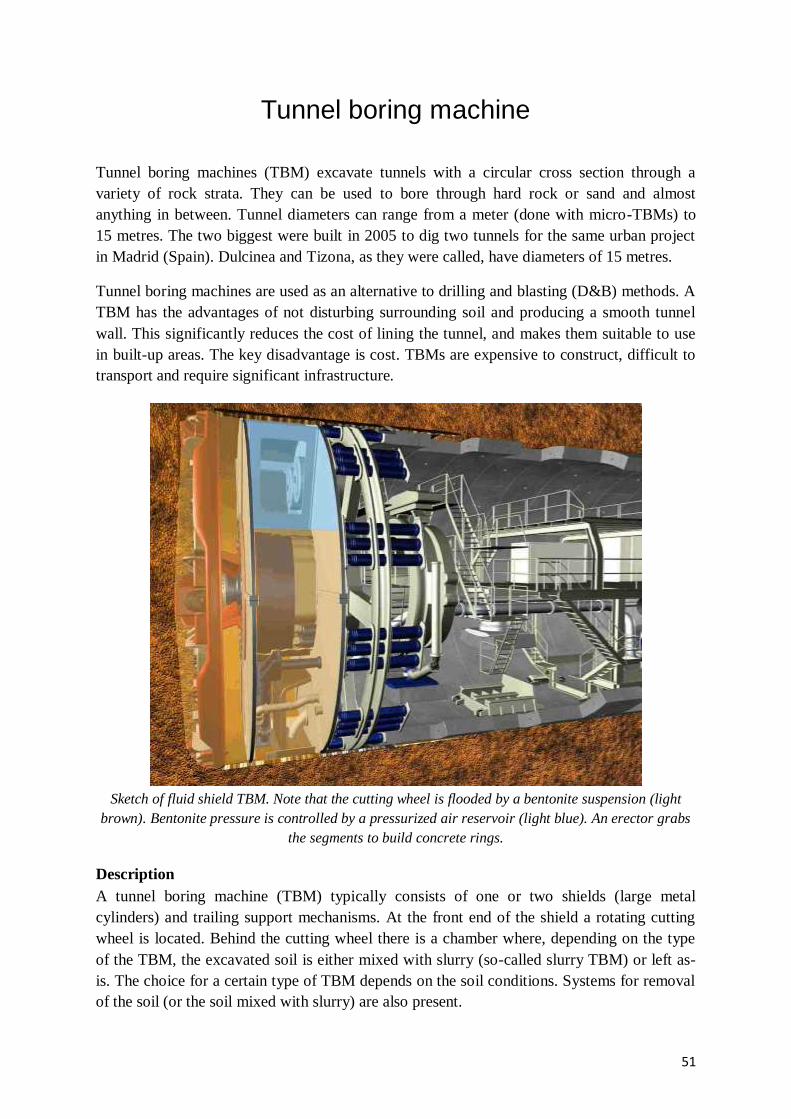
51
Tunnel boring machine
Tunnel boring machines (TBM) excavate tunnels with a circular cross section through a
variety of rock strata. They can be used to bore through hard rock or sand and almost
anything in between. Tunnel diameters can range from a meter (done with micro-TBMs) to
15 metres. The two biggest were built in 2005 to dig two tunnels for the same urban project
in Madrid (Spain). Dulcinea and Tizona, as they were called, have diameters of 15 metres.
Tunnel boring machines are used as an alternative to drilling and blasting (D&B) methods. A
TBM has the advantages of not disturbing surrounding soil and producing a smooth tunnel
wall. This significantly reduces the cost of lining the tunnel, and makes them suitable to use
in built-up areas. The key disadvantage is cost. TBMs are expensive to construct, difficult to
transport and require significant infrastructure.
Sketch of fluid shield TBM. Note that the cutting wheel is flooded by a bentonite suspension (light
brown). Bentonite pressure is controlled by a pressurized air reservoir (light blue). An erector grabs
the segments to build concrete rings.
Description
A tunnel boring machine (TBM) typically consists of one or two shields (large metal
cylinders) and trailing support mechanisms. At the front end of the shield a rotating cutting
wheel is located. Behind the cutting wheel there is a chamber where, depending on the type
of the TBM, the excavated soil is either mixed with slurry (so-called slurry TBM) or left as-
is. The choice for a certain type of TBM depends on the soil conditions. Systems for removal
of the soil (or the soil mixed with slurry) are also present.
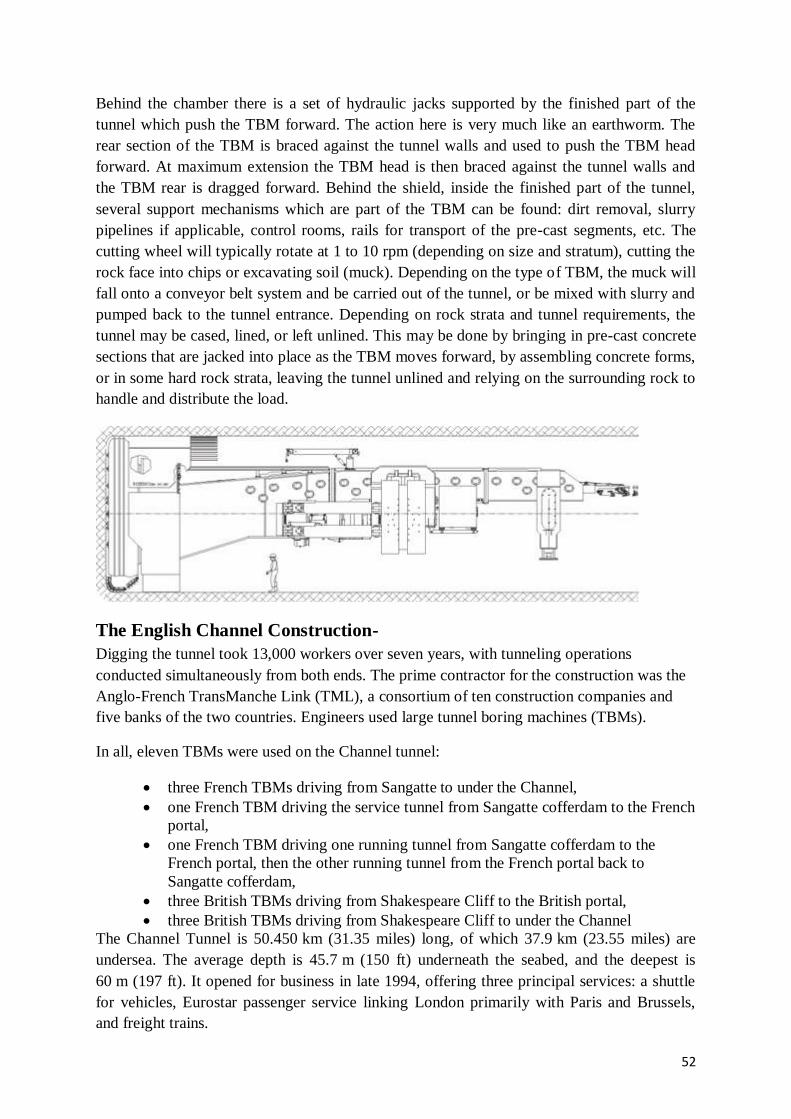
52
Behind the chamber there is a set of hydraulic jacks supported by the finished part of the
tunnel which push the TBM forward. The action here is very much like an earthworm. The
rear section of the TBM is braced against the tunnel walls and used to push the TBM head
forward. At maximum extension the TBM head is then braced against the tunnel walls and
the TBM rear is dragged forward. Behind the shield, inside the finished part of the tunnel,
several support mechanisms which are part of the TBM can be found: dirt removal, slurry
pipelines if applicable, control rooms, rails for transport of the pre-cast segments, etc. The
cutting wheel will typically rotate at 1 to 10 rpm (depending on size and stratum), cutting the
rock face into chips or excavating soil (muck). Depending on the type of TBM, the muck will
fall onto a conveyor belt system and be carried out of the tunnel, or be mixed with slurry and
pumped back to the tunnel entrance. Depending on rock strata and tunnel requirements, the
tunnel may be cased, lined, or left unlined. This may be done by bringing in pre-cast concrete
sections that are jacked into place as the TBM moves forward, by assembling concrete forms,
or in some hard rock strata, leaving the tunnel unlined and relying on the surrounding rock to
handle and distribute the load.
The English Channel Construction-
Digging the tunnel took 13,000 workers over seven years, with tunneling operations
conducted simultaneously from both ends. The prime contractor for the construction was the
Anglo-French TransManche Link (TML), a consortium of ten construction companies and
five banks of the two countries. Engineers used large tunnel boring machines (TBMs).
In all, eleven TBMs were used on the Channel tunnel:
three French TBMs driving from Sangatte to under the Channel,
one French TBM driving the service tunnel from Sangatte cofferdam to the French
portal,
one French TBM driving one running tunnel from Sangatte cofferdam to the
French portal, then the other running tunnel from the French portal back to
Sangatte cofferdam,
three British TBMs driving from Shakespeare Cliff to the British portal,
three British TBMs driving from Shakespeare Cliff to under the Channel
The Channel Tunnel is 50.450 km (31.35 miles) long, of which 37.9 km (23.55 miles) are
undersea. The average depth is 45.7 m (150 ft) underneath the seabed, and the deepest is
60 m (197 ft). It opened for business in late 1994, offering three principal services: a shuttle
for vehicles, Eurostar passenger service linking London primarily with Paris and Brussels,
and freight trains.
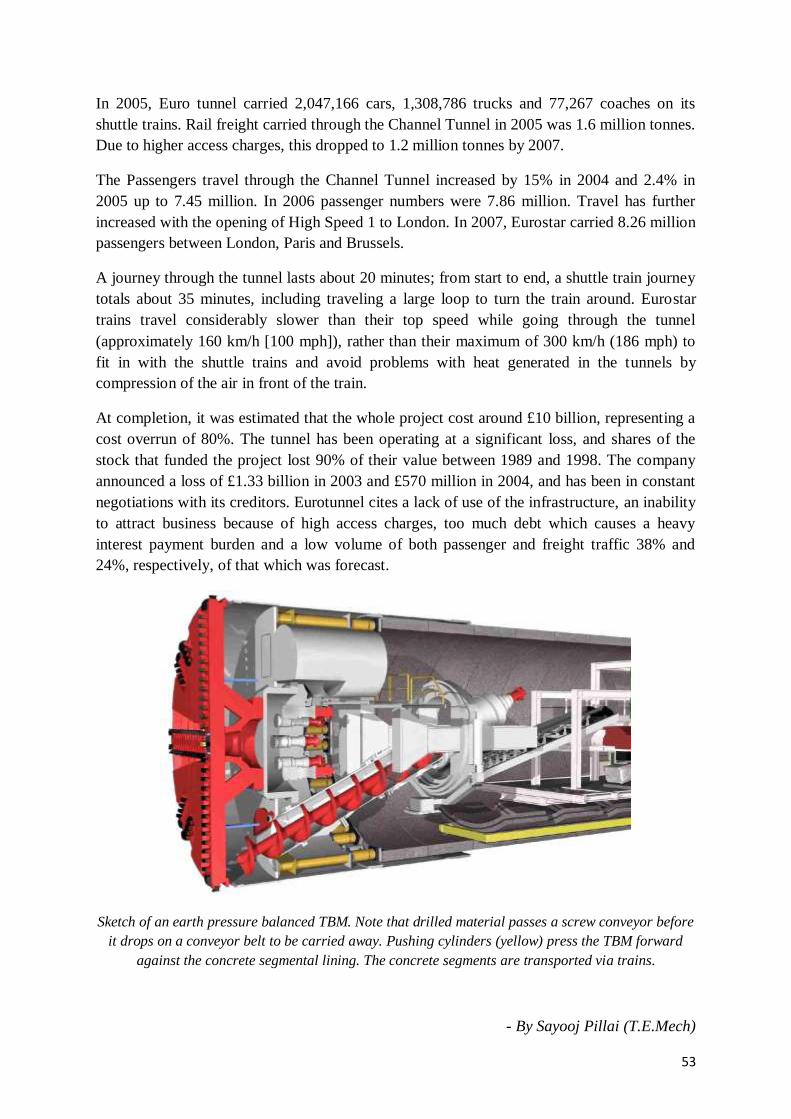
53
In 2005, Euro tunnel carried 2,047,166 cars, 1,308,786 trucks and 77,267 coaches on its
shuttle trains. Rail freight carried through the Channel Tunnel in 2005 was 1.6 million tonnes.
Due to higher access charges, this dropped to 1.2 million tonnes by 2007.
The Passengers travel through the Channel Tunnel increased by 15% in 2004 and 2.4% in
2005 up to 7.45 million. In 2006 passenger numbers were 7.86 million. Travel has further
increased with the opening of High Speed 1 to London. In 2007, Eurostar carried 8.26 million
passengers between London, Paris and Brussels.
A journey through the tunnel lasts about 20 minutes; from start to end, a shuttle train journey
totals about 35 minutes, including traveling a large loop to turn the train around. Eurostar
trains travel considerably slower than their top speed while going through the tunnel
(approximately 160 km/h [100 mph]), rather than their maximum of 300 km/h (186 mph) to
fit in with the shuttle trains and avoid problems with heat generated in the tunnels by
compression of the air in front of the train.
At completion, it was estimated that the whole project cost around £10 billion, representing a
cost overrun of 80%. The tunnel has been operating at a significant loss, and shares of the
stock that funded the project lost 90% of their value between 1989 and 1998. The company
announced a loss of £1.33 billion in 2003 and £570 million in 2004, and has been in constant
negotiations with its creditors. Eurotunnel cites a lack of use of the infrastructure, an inability
to attract business because of high access charges, too much debt which causes a heavy
interest payment burden and a low volume of both passenger and freight traffic 38% and
24%, respectively, of that which was forecast.
Sketch of an earth pressure balanced TBM. Note that drilled material passes a screw conveyor before
it drops on a conveyor belt to be carried away. Pushing cylinders (yellow) press the TBM forward
against the concrete segmental lining. The concrete segments are transported via trains.
- By Sayooj Pillai (T.E.Mech)

54
The Rangoli Life
And so we talked all night about the rest of our lives
Where we're going to be when we turn 25,
I keep thinking times will never change,
Keep on thinking things will always be the same,
But when we leave this year, we won't be coming back,
No more hanging out 'cause we're on a different track
And if you got something that you need to say
You better say it right now 'cause you don't have another day
Cause we're moving on and we can't slow down
These memories are playing like a film without sound
And I keep thinking of that night in June
I didn't know much of love, but it came too soon
And there was me and you all
All together we had a ball.
We'd get so excited; we'd get so scared,
Laughing at ourselves thinking life's not fair.
And this is how it feels as we go on
We remember all the times we had together,
And as our lives change come whatever,
We will still be Friends forever,
So what if we get the big jobs
And we make the big money
When we look back now
Will our jokes still be funny?
Will we still remember everything we learned in school?
Still be trying to break every single rule?
Will we think about tomorrow like we think about now?
Can we survive it out there, can we make it somehow?
I guess I thought that this would never end
And suddenly it's like we're women and men
Will the past be a shadow that will follow us 'round?
Will these memories fade when I leave this town?
I keep; I keep thinking that it's not goodbye
Keep on thinking it's a time to fly.....
-By Lalit Mehta (B.E.Mech)

55
- By Shweta Karampudi (B.E.Mech)
56
From candle seller to CEO of `440-cr biz
He used to sell decorative candles to newly-wed couples along the roadside in
Chandigarh. “I was never interested in studies, and I always wanted to do something of my
own.” says Naresh Gulati,who is now the owner of ` 440-crore Oceanic Consultants Australia
Group(OCA Group).
From selling candles to wholesale cloth trading to cosmetics-wholesale and teaching
at Aptech Computers to running a computer centre, the 39 year old tried his hands at many
things before homing in on overseas education consultancy business.
The journey has not been easy for Mr.Gulati who flunked in class 10 and performed
miserably in college. But he is now a guest lecturer on entrepreneurship in leading Australian
universities. Armed with a diploma in electronic data processing, Mr Gulati went to RMIT,
Melbourne, in 1995 for a post-graduate course in information systems. However, destiny had
scripted a different chapter for him.
“When I reached there, I realized that I had been duped. I was promised a job in
Melbourne by my immigration consultant, and that would have helped me clear the loan that
I took for going overseas”, recalls Mr.Gulati. For the next 6 months, Mr.Gulati came in touch
with several students who had met the same fate. And this made him think about a fantastic
business opportunity-immigration consultancy business.
Mr.Gulati came back to Chandigarh in 1996 and started Oceanic Consultants.
“Chandigarh had over 110 such agencies at that time, and I was discouraged by many not to
venture into this business”, says Mr.Gulati. “There was a time when I had to choose between
two options-paying the rent or using that money for advertising. I chose the latter and the risk
paid off”.
In three years, Oceanic Consultants had opened branches in Ludhiana, Patiala,
Jalandhar and Amritsar. However the franchise model was not sustainable as quality was
getting affected and people were not interested in investing money. Moreover, established
players such as Study Overseas and IBP Education created a dent in whatever little marketing
Oceanic did.
Oceanic Consultants then zeroed in on company owned office model. And the
decision paid off. Oceanic now has 20 offices across India and will take the count to 60 by
2013.
“We opened our Australia office a decade back and the UK office last year. By the
end of this year, we will be present in US and Canada. Punjab offices have now started to
become profitable, while others will soon follow suit”, says Mr.Gulati. He saw another
opportunity in printing and distribution segments of universities. “In 2005, we developed a
new technology enabling online orders of prospectus printing, posting and tracking from
India to anywhere in the world. This outsourcing facility has helped universities save 25-65%
of their profits even when our investment in starting BPO intelligence was A$1000”, adds
Mr.Gulati.
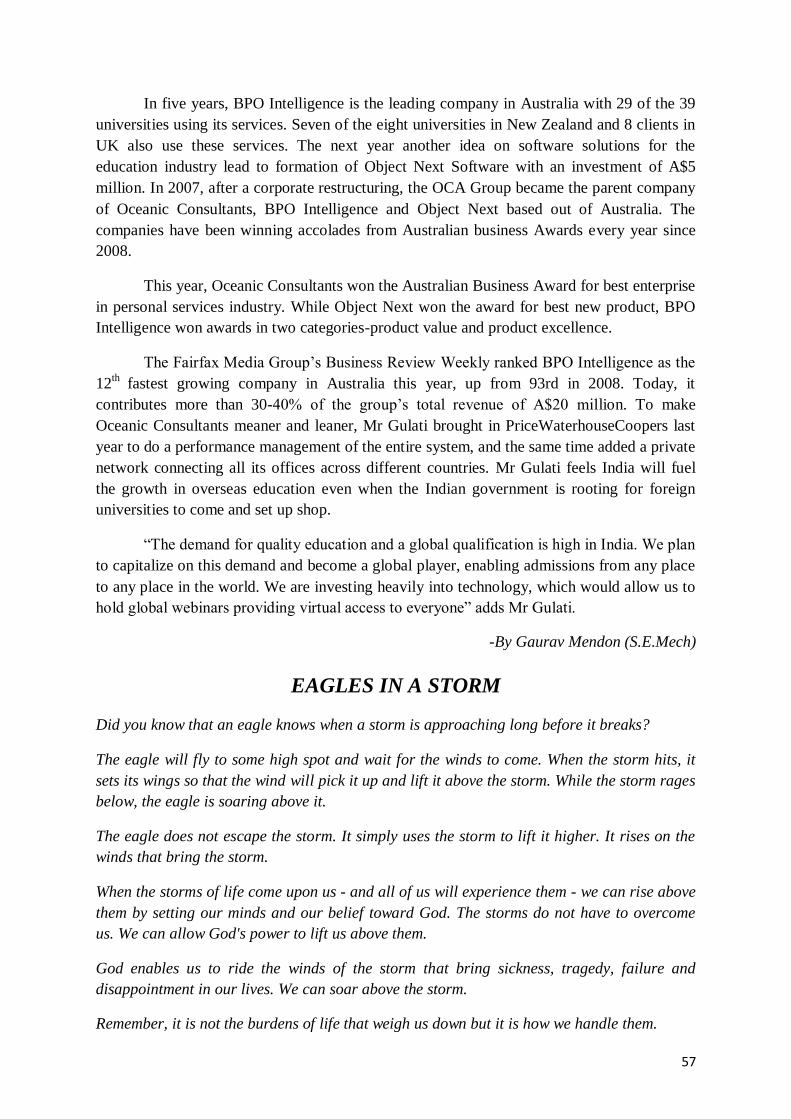
57
In five years, BPO Intelligence is the leading company in Australia with 29 of the 39
universities using its services. Seven of the eight universities in New Zealand and 8 clients in
UK also use these services. The next year another idea on software solutions for the
education industry lead to formation of Object Next Software with an investment of A$5
million. In 2007, after a corporate restructuring, the OCA Group became the parent company
of Oceanic Consultants, BPO Intelligence and Object Next based out of Australia. The
companies have been winning accolades from Australian business Awards every year since
2008.
This year, Oceanic Consultants won the Australian Business Award for best enterprise
in personal services industry. While Object Next won the award for best new product, BPO
Intelligence won awards in two categories-product value and product excellence.
The Fairfax Media Group’s Business Review Weekly ranked BPO Intelligence as the
12th
fastest growing company in Australia this year, up from 93rd in 2008. Today, it
contributes more than 30-40% of the group’s total revenue of A$20 million. To make
Oceanic Consultants meaner and leaner, Mr Gulati brought in PriceWaterhouseCoopers last
year to do a performance management of the entire system, and the same time added a private
network connecting all its offices across different countries. Mr Gulati feels India will fuel
the growth in overseas education even when the Indian government is rooting for foreign
universities to come and set up shop.
“The demand for quality education and a global qualification is high in India. We plan
to capitalize on this demand and become a global player, enabling admissions from any place
to any place in the world. We are investing heavily into technology, which would allow us to
hold global webinars providing virtual access to everyone” adds Mr Gulati.
-By Gaurav Mendon (S.E.Mech)
EAGLES IN A STORM
Did you know that an eagle knows when a storm is approaching long before it breaks?
The eagle will fly to some high spot and wait for the winds to come. When the storm hits, it
sets its wings so that the wind will pick it up and lift it above the storm. While the storm rages
below, the eagle is soaring above it.
The eagle does not escape the storm. It simply uses the storm to lift it higher. It rises on the
winds that bring the storm.
When the storms of life come upon us - and all of us will experience them - we can rise above
them by setting our minds and our belief toward God. The storms do not have to overcome
us. We can allow God's power to lift us above them.
God enables us to ride the winds of the storm that bring sickness, tragedy, failure and
disappointment in our lives. We can soar above the storm.
Remember, it is not the burdens of life that weigh us down but it is how we handle them.
58
-Photograph by Sandeep Jana (T.E.Mech)

59
- Photographs by Aditya Shenoy (S.E.Mech)
60
How the Wright Brothers changed the world
On Dec. 17, 1903, The Wright Brothers' Flyer was the first powered airplane to execute
controlled and sustained flight.
CREDIT: NASA
It was an event that lasted just 12 seconds and made it into only four newspapers the next
morning. The pioneering, 120-foot flight over Kitty Hawk, North Carolina, may have gone
off with little fanfare that day in 1903, but it would soon have enormous implications that
wrapped, very literally, around the world.
Brothers Orville and Wilbur Wright did not invent flight, but they became the Internet of
their era with their invention of the first manned, powered, heavier-than-air and (to some
degree) controlled-flight aircraft, bringing people and ideas together like never before. In just
a few decades, the basics of their science and engineering became instrumental in warfare,
put globalization on the map and man on the moon.
Wilbur an enthusiast, not a crank
The birth of aeronautical science originated not from the laboratory of a respected university,
but the back room of a bicycle shop in Dayton, Ohio.
Interest in aeronautics had exploded during the 19th century, as the technical how-to finally
began to catch up with humanity's centuries-old interest in flight. Several scientists tested
gliders throughout the 1800s, filling data tables about lift and drag, but no gliders ran on
power other than that provided by the wind. A steam-powered airship built by Henri Giffard
flew successfully in 1852, marking what many now call the advent of powered flight.
In 1899, Wilbur wrote this letter to the Smithsonian Institution, requesting copies of all the
past research done:

61
"Dear Sirs:
I am an enthusiast, but not a crank in the sense that I have some pet theories as to the proper
construction of a flying machine. I wish to avail myself of all that is already known and then
if possible add my mite to help on the future worker who will attain final success.”
Paying the bills with sales from their bike store, Wilbur (the visionary) and Orville (the
engineer) set to work on a flying machine. The brothers started by building kites based on the
flight mechanics of birds they had observed and moved onto manned gliders.
Four years after Wilbur's humble letter, the Wrights were ready to test an aircraft powered by
an engine and propeller.
On December 17, 1903, Orville climbed into the primitive cockpit and lifted the "Flyer," as it
was called, from the level ground of Kitty Hawk into the air and flew for 12 seconds before
landing with a thud 120 feet away. The brothers made four flights that day, the last one
soaring 852 feet and lasting almost one minute, launching the world into the aviation age for
good.
From Kitty Hawk to outer space
When news about their feat at Kitty Hawk reached the newswires, the Wright brothers
became instant celebrities. The scientific reaction was swift, too, with competitive inventors
attempting their own flying machines in cornfields around the world.
It was the U.S. government that encouraged the first mass manufacturing of the airplane,
which it saw as a potentially powerful weapon and reconnaissance vehicle. When World War
I broke out in 1914, there was a new battlefield for the first time in millennia. Airplane
technology sped up dramatically during the war and was a pillar of the wartime economy. By
the 1930s, the U.S. had four airlines delivering millions of passengers, limited mostly to the
upper class, to points across the country and the Atlantic Ocean and, by the end of the decade,
the Pacific. With the dawn of commercial air service, the world opened up in a new way,
allowing people to visit places they'd only read about in books. Aviation greatly affected the
outcome of World War II, too, and war equally affected aviation. Airplanes carried
paratroopers across the English Channel, dropped the first atomic bomb and, by the end of
the war, its manufacturing had helped put the United States at the forefront of all the world's
postwar economies, where it remained until the 1970s.
There was nowhere to go but up. The birth of the jet age in the 1950s, man's first steps on the
moon, even Richard Branson's just-announced commercial space tourist plan, all have their
scientific roots in the field of Kitty Hawk.
In less than 100 years, the Wright's shaky craft had turned into a vehicle fit to explore outer
space.
-By Aniket Ranade (T.E.Mech)

62
Alexander Fleming
His name was Fleming, and he was a poor Scottish farmer. One day, while trying to
eke out a living for his family, he heard a cry for help coming from a nearby bog. He dropped
his tools and ran to the bog. There, mired to his waist in black muck, was a terrified boy,
screaming and struggling to free himself. Farmer Fleming saved the lad from what could
have been a slow and terrifying death.
The next day, a fancy carriage pulled up to the Scotsman's sparse surroundings. An
elegantly dressed nobleman stepped out and introduced himself as the father of the boy
Farmer Fleming had saved.
"I want to repay you," said the nobleman. "You saved my son's life."
"No, I can't accept payment for what I did," the Scottish farmer replied, waving off the offer.
At that moment, the farmer's own son came to the door of the family hovel.
"Is that your son?" the nobleman asked. "Yes", the farmer replied proudly.
"I'll make you a deal. Let me take him and give him a good education.
If the lad is anything like his father, he'll grow to a man you can be proud of."
And that he did. In time, Farmer Fleming's son graduated from St. Mary's Hospital
Medical School in London, and went on to become known throughout the world as the noted
Sir Alexander Fleming, the discoverer of Penicillin.
Years afterward, the nobleman's son was stricken with pneumonia.
What saved him? Penicillin!
The name of the nobleman, Lord Randolph Churchill!
His son's name, Sir Winston Churchill!
-By Mayur Patil (T.E.Mech)

63
- Photograph by Akhil Naraynan (T.E.Mech)
Facebook— Did you know?
Facebook has over 550 million members and is expected to grow to one billion by August
2012.
Over 145 million users are in the USA, followed by Indonesia (31.7m), the UK (28.9m),
Turkey (24m), France (20.4m) and India (16.5m). China where Facebook is generally
blocked has some 92,500 members.
Every minute: Facebook gets over 5 lakh comments, 3.8 lakh comments are liked, 2.3 lakh
messages are sent, 1.36 lakh photos are added, and nearly one lakh friendships are approved.
Facebook can be used in more than 75 languages.
At the rate of about 10,000 per day, some two million other websites are integrated with
Facebook.

64
Love & Time
Once upon a time, there was an island where all the feelings lived: Happiness, Sadness,
Knowledge, and all of the others, including Love. One day it was announced to the feelings
that the island would sink, so all constructed boats and left, except for Love.
Love was the only one who stayed. Love wanted to hold out until the last possible moment.
When the island had almost sunk, Love decided to ask for help.
Richness was passing by Love in a grand boat. Love said, "Richness, can you take me with
you?" Richness answered, "No, I can't. There is a lot of gold and silver in my boat. There is
no place here for you."
Love decided to ask Vanity who was also passing by in a beautiful vessel. "Vanity, please
help me!"
"I can't help you, Love. You are all wet and might damage my boat," Vanity answered.
Sadness was close by so Love asked, "Sadness, let me go with you."
"Oh . . . Love, I am so sad that I need to be by myself!"
Happiness passed by Love, too, but she was so happy that she did not even hear when Love
called her.
Suddenly, there was a voice, "Come, Love, I will take you." It was an elder. So blessed and
overjoyed, Love even forgot to ask the elder where they were going. When they arrived at dry
land, the elder went her own way. Realizing how much was owed the elder, Love asked
Knowledge, another elder, "Who helped me?"
"It was Time," Knowledge answered.
"Time?" asked Love. "But why did Time help me?"
Knowledge smiled with deep wisdom and answered, "Because only Time is capable of
understanding how valuable Love is."
-By Suja Pillai (S.E.Mech)
65
Arun Nadar (B.E. Mech)
The Mahindra Autoquotient was the 1st automotive quiz held in India and it was open
only for engineering students only. The 1st round was held at IIT-Mumbai and he won from
Mumbai. After that the regional finals for the western zone was held at the NDTV-studio in
Mumbai. In the western zone the others teams were from Ahemdabad, Bhopal and Pune in
which he won. After the zonal it was time for the national finals in which he was 4th. In that
1st placed were Banglore, 2
nd Pilani and 3
rd Rourkela.
He made our college very proud placing it on 4th
place among the 700 Engineering
colleges that had participated from all over India and the total number of contestants were
around 4,500.
The regional and national finals were broadcasted on NDTV-Profit and were hosted
by one of the premiere auto-journalist of our country, Siddharth Patankar.
66
Rohan Crasto (T.E.Mech), Shashanka Kshetrapalasharma (B.E.Mech)
The 10th
ISHRAE Intercollegiate Engineering Quiz Finals 2011, Mumbai was held on 10th
February, 2011 in the central quadrangle of Sardar Patel College of Engineering campus. The
quiz committee comprising Professor Dr. Roshini Easow, V Krishnan, Nitin Naik, D Krishna
Kumar, Vikram Murthy and the Quiz Master, B. Gautham Baliga, put together a quiz contest
which was a combination of KBC and IPL. Alric Ferns (‘Al’ for short), the radio jockey of
107.1FM, was the host for the evening which was attended by a packed and delirious
audience of over 400 students and faculty members.
The format of the quiz was as follows: Each of the six shortlisted teams got to the
high table, one at a time, and faced a total of 10balls (questions). Each correctly answered
question resulted in a run. As the team accumulated runs, they progressed in their levels.
Starting with 3runs for Gully Level, 6runs & 8 runs got the teams to Maidan and Ranji Level
respectively. With a perfect 10, Test Level was achieved. Giving a wrong answer or not
answering, resulted in the team going back one level, much like the snake and ladder game.
The level attained by the team at the end of 10 balls determined the level of the team and the
prize money earned. Starting from Gully Level, the prize money was progressively: Rs3000/-
, Rs6000/-, Rs12000/-, and Rs25000/-.
The IQL teams from all of the 10 colleges with Student chapters were appropriately
named: S P Lions, V. J Victors, Pillai Panthers, B.A.T.U Blasters, Somaiya Samrats, Datta
Meghe Dashers, Vidya Peeth Veeras, Rodrigues Rockers, Tilak Tigers, and Vardhini
Warriors.
A written elimination reduced the teams to 6 consisting of SP Lions, BATU Blasters,
Vardhini Warriors, Datta Dashers, Pillai Panthers and Rodrigues Rockers.
WINNERS:
The winners were the ‘Pillai Panthers’ team of Rohan Crasto and Shashanka
Kshetrapalasharma of our college with runners-up ‘Rodrigues Rockers’ team of Kaustubh
Pande and Shailesh Tripathi of Fr.C Rodrigues Institute of Technology, Vashi. Both teams

67
represented ISHRAE Mumbai chapter in the All-India Quiz Competition at ACREX 2011 in
New Delhi during 24th and 25th February 2011.
A large number of ISHRAE members including Viresh Ruhal, president - ISHRAE
Mumbai, M. P. Agarwal, president - ASHRAE Mumbai, and V. Krishnan, national president
elect, were present to encourage the students. The enjoyable event was put together by the
ISHRAE Mumbai team including the office staff.
- By Rajeshwari Hegde (B.E.Mech)

68
- By Shweta Karampudi (B.E.Mech)

69

70
The Society for the Promotion of Indian Classical Music And Culture Amongst Youth,
often known by its initials (SPIC MACAY), promotes Indian classical music, Indian
classical dance, and other aspects Indian culture. It is a movement with chapters in over 300
towns and cities all over the world. SPIC MACAY was established by Dr. Kiran Seth in 1977
at IIT Delhi.
It seeks to foster the exchange of traditional Indian values and to generate awareness of the
cultural traditions and heritage of India. In order to achieve its goals, SPICMACAY
organizes concerts, lectures, demonstrations, informal discussions, and seminars. These are
hosted by local chapters of the organization.
The inaugural chapter of SPIC MACAY was started in our college this year. It was held from
31st January to 8
th February 2011. It consisted of performances from various prominent artists
in the field of classical music.
It began with the screening of Satyajit Ray’s movies on the first two days.
The Yakshagana troupe performed Duryodhana Vadh from Mahabharata which was so
frolicsome to watch. It was on 2nd
of February.
On 3rd
February there was a performance by Dr.N.Rajam. She demonstrated the different
subtle variations on violin. Then there was an interactive session cum performance by Arati
Ankalikar-Tikekar on 4th
February. She even invited a student from the crowd to assist her on
Tabla. Students were simply ecstatic after her performance.
There was a workshop on Dhrupad singing from 7th
to 10th February by Ustad Zia Fariduddin
Dagar. On the final day we had performances from Ustad Fariduddin Dagar & Pandit
Pushparaj Koshti.
The event generated a great interest amongst students towards the Indian classical music.

71

72
Some pictures from the E.F.l. 2010-2011

73
Prizes
We are thankful to all the students who have helped us in making ‘The
Mechzine’ September 2010 issue by providing the literary material, sketches &
paintings. We got a lot of material some of which we have used in this edition.
The following are the names of students who have won cash prizes,
decided by the jury members, in different categories of the magazine.
Poems: Swapnil Bhatkar (T.E.Mech)
Sketches: 1.Shweta Karampudi (B.E.Mech) 2. Aniket Ranade (T.E.Mech)
Photographs: 1. Anup Patil (T.E.Mech) 2. Akhil Narayanan (T.E.Mech)
Articles: 1. Technical- Kushal Shamdasani (B.E. Mech) 2. Non-Technical- Santosh Naik (B.E. Mech)
During the last issue of The Mechzine, September 2010, one of the names of the members
from the magazine committee, Aniket Ranade wasn’t printed. The mistake is deeply
regretted.