CURRENT STATUS OF NATIONAL INVENTORY … · The author thanks Stéphane Willems and Jane Ellis ......
62
Organisation for Economic Co-operation and Development 2003 International Energy Agency Organisation de Coopération et de Développement Economiques Agence internationale de l'énergie COM/ENV/EPOC/IEA/SLT(2003)7 OECD ENVIRONMENT DIRECTORATE INTERNATIONAL ENERGY AGENCY CURRENT STATUS OF NATIONAL INVENTORY PREPARATION IN ANNEX I PARTIES AND NON-ANNEX I PARTIES Anke Herold Oeko-Institut, Germany
Transcript of CURRENT STATUS OF NATIONAL INVENTORY … · The author thanks Stéphane Willems and Jane Ellis ......
Organisation for Economic Co-operation and Development 2003 International Energy Agency Organisation de Coopération et de Développement Economiques Agence internationale de l'énergie
COM/ENV/EPOC/IEA/SLT(2003)7
OECD ENVIRONMENT DIRECTORATE INTERNATIONAL ENERGY AGENCY
CURRENT STATUS OF NATIONAL INVENTORY PREPARATION IN ANNEX I PARTIES AND
NON-ANNEX I PARTIES
Anke Herold Oeko-Institut, Germany
COM/ENV/EPOC/IEA/SLT(2003)7
2
Copyright OECD, 2003
Application for permission to reproduce or translate all or part of this material should be addressed to the Head of Publications Services, OECD, 2 rue André Pascal, 75775 Paris, Cedex 16, France.
COM/ENV/EPOC/IEA/SLT(2003)7
3
FOREWORD
This document was prepared in November 2003 by Anke Herold, Oeko-Institut, Germany, under guidance from the OECD Secretariat and at the request of the Annex I Expert Group on the United Nations Framework Convention on Climate Change. The Annex I Expert Group oversees development of analytical papers for the purpose of providing useful and timely input to the climate change negotiations. These papers may also be useful to national policy makers and other decision-makers. In a collaborative effort, authors work with the Annex I Expert Group to develop these papers. However, the papers do not necessarily represent the views of the OECD or the IEA, nor are they intended to prejudge the views of countries participating in the Annex I Expert Group. Rather, they are Secretariat information papers intended to inform Member countries, as well as the UNFCCC audience.
The Annex I Parties or countries referred to in this document refer to those listed in Annex I to the UNFCCC (as amended at the 3rd Conference of the Parties in December 1997): Australia, Austria, Belarus, Belgium, Bulgaria, Canada, Croatia, Czech Republic, Denmark, the European Community, Estonia, Finland, France, Germany, Greece, Hungary, Iceland, Ireland, Italy, Japan, Latvia, Liechtenstein, Lithuania, Luxembourg, Monaco, Netherlands, New Zealand, Norway, Poland, Portugal, Romania, Russian Federation, Slovakia, Slovenia, Spain, Sweden, Switzerland, Turkey, Ukraine, United Kingdom of Great Britain and Northern Ireland, and United States of America. Korea and Mexico, as new OECD member countries, also participate in the Annex I Expert Group. Where this document refers to “countries” or “governments” it is also intended to include “regional economic organisations”, if appropriate.
ACKNOWLEDGEMENTS
The author thanks Stéphane Willems and Jane Ellis (OECD) for their guidance and comments.
Questions and comments should be sent to:
Anke Herold Oeko-Institut Novalisstrasse 10 10115 Berlin Germany Email: [email protected] Tel: +49 30 2804 8686 Fax +49 30 2804 8688
Stéphane Willems OECD Environment Directorate Global and Structural Policies Division 2 rue Andre Pascal 75775 Paris - France Email: [email protected] Tel: +33 1 45 24 96 97 Fax: +33 1 45 24 78 76
OECD and IEA information papers for the Annex I Expert Group on the UNFCCC can be downloaded from: http://www.oecd.org/env/cc/
COM/ENV/EPOC/IEA/SLT(2003)7
4
TABLE OF CONTENTS
EXECUTIVE SUMMARY .......................................................................................................................... 6
1. INTRODUCTION............................................................................................................................ 10
2. STATUS OF NATIONAL INVENTORY PREPARATION IN ANNEX I PARTIES.............. 10
2.1 Legal requirements under the Convention and the Kyoto Protocol ............................................... 10 2.2 Problems of national inventory systems......................................................................................... 11 2.3 Availability and timeliness of inventories...................................................................................... 14 2.4 Completeness.................................................................................................................................. 15 2.5 Comparability................................................................................................................................. 16 2.6 Transparency .................................................................................................................................. 17 2.7 Consistency .................................................................................................................................... 17 2.8 Accuracy......................................................................................................................................... 18
2.8.1 Comparison of reference and sectoral approach ....................................................................... 18 2.8.2 Estimation of uncertainties ....................................................................................................... 18 2.8.3 Methodological choice.............................................................................................................. 21
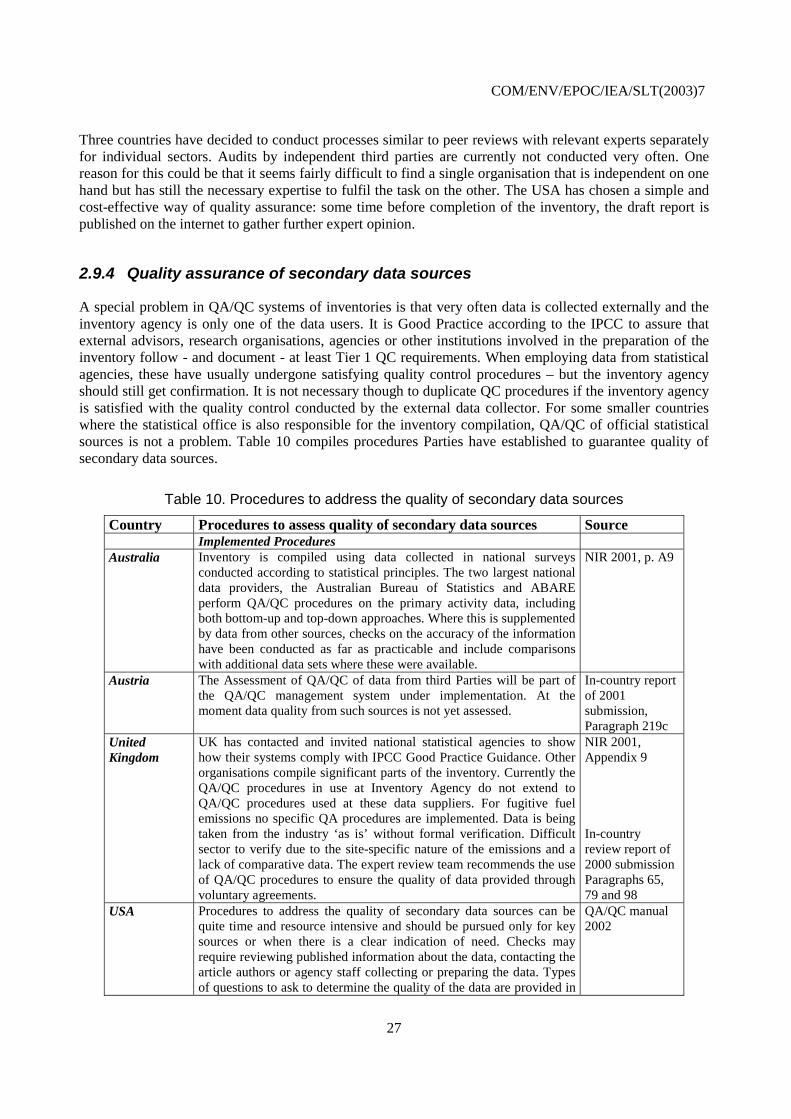
2.9 Quality assurance and quality control ............................................................................................ 21 2.9.1 Status of development of quality management systems ........................................................... 22 2.9.2 Implementation of quality control procedures .......................................................................... 24 2.9.3 Implementation of quality assurance procedures...................................................................... 26 2.9.4 Quality assurance of secondary data sources............................................................................ 27
2.10 Conclusions for Annex I Parties ............................................................................................... 28
3. STATUS OF NATIONAL INVENTORY PREPARATION IN NON-ANNEX I PARTIES.... 29
3.1 Legal requirements under the Convention...................................................................................... 29 3.2 Availability of national communications ....................................................................................... 29 3.3 Problems of national inventory systems......................................................................................... 30
3.3.1 Institutional arrangements......................................................................................................... 30 3.3.2 Activity data and emission factors ............................................................................................ 31 3.3.3 UNFCCC findings .................................................................................................................... 31
3.4 General assessment of Non-Annex I national communications..................................................... 32 3.4.1 Consistency............................................................................................................................... 33 3.4.2 Completeness ............................................................................................................................ 33 3.4.3 Comparability ........................................................................................................................... 33 3.4.4 Transparency............................................................................................................................. 33 3.4.5 Accuracy ................................................................................................................................... 34
3.5 Comparison of inventory data of selected Non-Annex I Parties with international data sources .. 35 3.5.1 Comparison of data for energy, agriculture and waste sectors ................................................. 35 3.5.2 Analysis of LUCF sector .......................................................................................................... 38
3.6 Conclusions for Non-Annex I Parties............................................................................................. 42
REFERENCES............................................................................................................................................ 44
GLOSSARY ................................................................................................................................................ 46
ANNEX 1: USE OF GOOD PRACTICE METHODS FOR KEY SOURCE CATEGORIES IN ANNEX I INVENTORIES......................................................................................................................... 47
COM/ENV/EPOC/IEA/SLT(2003)7
5
ANNEX 2: ASSESSMENT OF INVENTORY SECTIONS OF NATIONAL COMMUNICATIONS FROM NON-ANNEX I PARTIES............................................................................................................ 57
LIST OF TABLES
Table 1. Gaps in inventory submissions of Annex I Parties ......................................................................... 15 Table 2. Completeness of gases in CRF reports ........................................................................................... 16 Table 3. Timing of base year submissions from EIT countries .................................................................... 18 Table 4. Implementation of quantitative uncertainty assessment by Annex I Parties .................................. 20 Table 5. Overview of implementation of Good Practice Guidance for key source categories by Annex I
Parties ................................................................................................................................................... 21 Table 6. Implementation of the QA/QC system and QA/QC plan ............................................................... 23 Table 7. Status of implementation of certified management systems........................................................... 24 Table 8. Overview of Tier 1 quality control procedures in Annex I Parties................................................. 25 Table 9. Verification of inventories .............................................................................................................. 26 Table 10. Procedures to address the quality of secondary data sources........................................................ 27 Table 11. Comparison of greenhouse gas emissions provided by national communications and by
IEA/EDGAR for 1990 .......................................................................................................................... 36 Table 12. Comparison of greenhouse gas emissions provided in national communications and by
IEA/EDGAR for Malaysia.................................................................................................................... 38 Table 13. Problems reported by Non-Annex I Parties with activity and input data in LUCF source
categories .............................................................................................................................................. 39 Table 14. Comparison of forest area in national communication with FAO forest area data....................... 40 Table 15. CO2 emissions from conversion per area converted ..................................................................... 41 Table 16. Comparison of national and FAO deforestation data ................................................................... 42 Table 17. Use of country-specific emission factors in road transport........................................................... 47 Table 18 Methods used by Annex I Parties for the estimation of domestic aviation............................... 48 Table 19. Methods and emission factors used by Annex I Parties for the estimation of CH4 emissions from
fugitive emissions from solid fuels ....................................................................................................... 49 Table 20. Methods, emission factors and activity data used for the estimation of CO2 emissions from
cement production................................................................................................................................. 50 Table 21. Sources of emission factors for N2O from nitric acid production................................................. 51 Table 22. Emission factors and methods used for the estimation of CH4 emissions from enteric
fermentation. ......................................................................................................................................... 52 Table 23. Methods and emission factors used for the estimation of CH4 and N2O from manure management
.............................................................................................................................................................. 54 Table 24. Methods used for CH4 emissions from solid waste disposal ........................................................ 56
LIST OF FIGURES
Figure 1. Timeliness of inventory submissions from Annex I Parties.......................................................... 14 Figure 2. Submissions of national inventory reports and inventory data in the common reporting format in
2003 ...................................................................................................................................................... 15
COM/ENV/EPOC/IEA/SLT(2003)7
6
Executive Summary
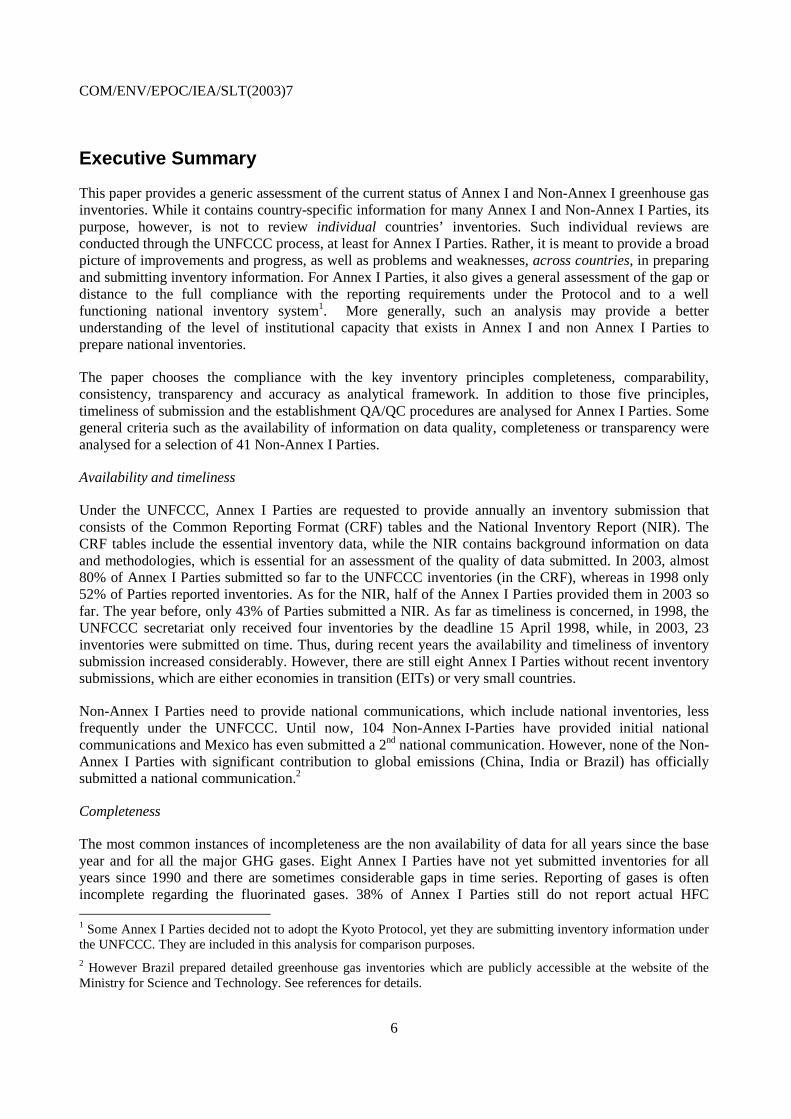
This paper provides a generic assessment of the current status of Annex I and Non-Annex I greenhouse gas inventories. While it contains country-specific information for many Annex I and Non-Annex I Parties, its purpose, however, is not to review individual countries’ inventories. Such individual reviews are conducted through the UNFCCC process, at least for Annex I Parties. Rather, it is meant to provide a broad picture of improvements and progress, as well as problems and weaknesses, across countries, in preparing and submitting inventory information. For Annex I Parties, it also gives a general assessment of the gap or distance to the full compliance with the reporting requirements under the Protocol and to a well functioning national inventory system1. More generally, such an analysis may provide a better understanding of the level of institutional capacity that exists in Annex I and non Annex I Parties to prepare national inventories.
The paper chooses the compliance with the key inventory principles completeness, comparability, consistency, transparency and accuracy as analytical framework. In addition to those five principles, timeliness of submission and the establishment QA/QC procedures are analysed for Annex I Parties. Some general criteria such as the availability of information on data quality, completeness or transparency were analysed for a selection of 41 Non-Annex I Parties.
Availability and timeliness
Under the UNFCCC, Annex I Parties are requested to provide annually an inventory submission that consists of the Common Reporting Format (CRF) tables and the National Inventory Report (NIR). The CRF tables include the essential inventory data, while the NIR contains background information on data and methodologies, which is essential for an assessment of the quality of data submitted. In 2003, almost 80% of Annex I Parties submitted so far to the UNFCCC inventories (in the CRF), whereas in 1998 only 52% of Parties reported inventories. As for the NIR, half of the Annex I Parties provided them in 2003 so far. The year before, only 43% of Parties submitted a NIR. As far as timeliness is concerned, in 1998, the UNFCCC secretariat only received four inventories by the deadline 15 April 1998, while, in 2003, 23 inventories were submitted on time. Thus, during recent years the availability and timeliness of inventory submission increased considerably. However, there are still eight Annex I Parties without recent inventory submissions, which are either economies in transition (EITs) or very small countries.
Non-Annex I Parties need to provide national communications, which include national inventories, less frequently under the UNFCCC. Until now, 104 Non-Annex I-Parties have provided initial national communications and Mexico has even submitted a 2nd national communication. However, none of the Non-Annex I Parties with significant contribution to global emissions (China, India or Brazil) has officially submitted a national communication.2
Completeness
The most common instances of incompleteness are the non availability of data for all years since the base year and for all the major GHG gases. Eight Annex I Parties have not yet submitted inventories for all years since 1990 and there are sometimes considerable gaps in time series. Reporting of gases is often incomplete regarding the fluorinated gases. 38% of Annex I Parties still do not report actual HFC 1 Some Annex I Parties decided not to adopt the Kyoto Protocol, yet they are submitting inventory information under the UNFCCC. They are included in this analysis for comparison purposes. 2 However Brazil prepared detailed greenhouse gas inventories which are publicly accessible at the website of the Ministry for Science and Technology. See references for details.
COM/ENV/EPOC/IEA/SLT(2003)7
7
emissions and 35% have not provided actual PFC and SF6 emission estimates as required in UNFCCC reporting guidelines. Other instances of incompleteness in the CRF tables are the lack of information in recalculation tables, the non-reporting of certain sectoral background data tables of the CRF or the reporting of partial information in some tables. The number of Annex I Parties with complete inventories in all aspects mentioned above is still not higher than 25%. Completeness with regard to full time series, fluorinated gases as well as to the provision of CRF background tables has also improved considerably during recent years. However, six of the thirteen EIT countries provided the first inventory for their base year in 2002.
Most Non-Annex I Parties covered all required sectors in their inventories, however there are frequently gaps within estimated source categories. The degree of completeness of reporting within a source category frequently cannot be assessed as no background information is provided. In particular, it is often unclear if certain source categories do not occur or if they were not estimated. UNFCCC reporting guidelines for initial national communications for Non-Annex I Parties only encouraged reporting of HFCs and SF6 and did not mention PFCs. From the 41 Parties analysed, four reported at least part of the fluorinated gases which indicates a rather advanced level of inventory preparation.3
Comparability
Submitting data in the CRF, and, in particular, providing the sectoral background tables is important for comparisons of information across Annex I Parties. Up to now, 8 Annex I Parties have not submitted sectoral background tables and 29 Parties have provided all or most of the sectoral background tables. As for Non-Annex I Parties, the lack of comparability stems from the lack of similar requirements in the UNFCCC guidelines themselves, which means that comparability is quite low for those Parties.
Transparency
Transparency of inventories refers to the availability of information needed to assess the quality of the inventory. For Annex I Parties, this is still a key problem. Only half of these Parties provided NIRs so far, which are essential for the transparency of information. But also the NIRs submitted sometimes are not sufficiently transparent, therefore the identification of areas that are not sufficiently transparent is one of the most common findings of the current inventory review process under the UNFCCC.
As for Annex I Parties, the lack of transparency is also one of the major problems of inventories provided by Non-Annex I Parties. Few Non-Annex I Parties provided information on the methodologies and data used. Additional methodological information would be extremely helpful with the aim of improving IPCC reporting guidelines for Non-Annex I Parties as well as for the exchange of information across Non-Annex I Parties. Documentation of methodologies and data used would also be essential for any future inventory compilation process in the Non-Annex I Parties. As such documentation rarely exists, many inventory projects will start from scratch in the future as it does not seem likely that information not included in the national communications is kept available for many years.
Consistency
An inventory is consistent if the same methodologies are used for the base and all subsequent years and if consistent data sets are used to estimate emissions or removals from sources or sinks. Because of the lack of transparency, it is not possible to assess consistency for the inventories of at least half of Annex I Parties and no general conclusions can be drawn at the moment on the compliance with the consistency principle.
3 Argentina: HFC, SF6, Costa Rica: HFCs, Honduras: HFCs and PFCs, Sri Lanka: SF6.
COM/ENV/EPOC/IEA/SLT(2003)7
8
66% of Non-Annex I Parties only reported inventories for one year (mainly 1994). Only seven Parties4 estimated emissions for more than three years (usually for a short time series, e.g. 1990 to 1994 in Brazil). The fact that several years were calculated for one report indicates that there are continuous data collection systems in place on which the estimation could be based on. Taking into account the small number of Non-Annex I Parties that reported more than one inventory year, no time series were estimated so far and consistency over time has not yet been implemented for many Parties. Taking into account the long time periods between the preparation of subsequent national communications in Non-Annex I Parties, it is not very likely that consistency over time can be achieved in the future.
Accuracy
The lack of NIR submissions for a number of Annex I Parties also hampers the assessment of inventory accuracy. Therefore the analysis for this paper only includes the Annex I Parties with a NIR submission. For these Parties, this paper chooses several criteria: the comparison of the sectoral approach with the reference approach for fuel combustion, the quantitative estimation of uncertainties as well as the methodological choice in accordance with IPCC Good Practice Guidance as indicators for the status of inventory accuracy.
The comparison of the sectoral approach with the reference approach is currently performed by 29 Annex I Parties. In many cases, differences between both approaches are smaller than 2%. As for the estimation of uncertainties, at present 28% of Annex I Parties have attempted to give a reliable estimate of the accuracy of their greenhouse gas total emissions by providing a quantitative uncertainty estimation. Finally, the share of Annex I Parties that implemented good practice guidance regarding the choice of methodology for their key source categories ranges from 20 to almost 80%, depending on the source category. For only two of the eight source categories investigated in this paper, more than 50% of Parties implemented good practice guidance for key sources in all relevant aspects. More generally, as regards data quality, many Parties need to improve their existing estimation methods, the collection of activity data as well as establish country-specific emission factors.
For six selected Non-Annex I national communications, a comparison of emission estimates between IEA database and national communications or national inventories showed that the CO2 emissions in the energy sector compare quite well for the Non-Annex I Parties included in the analysis. Considerable differences occur for CH4 emissions, especially in the waste sector, and for N2O emissions. The differences between the two data sources could sometimes be explained by different methods used.
Generally, Non-Annex I Parties used IPCC default methods, i.e. the method with lowest accuracy, but several Parties developed their own methodologies and emission factors for specific sectors (e.g. Chile, Brazil, Mexico, Thailand, Israel, Jordan, Korea, Namibia, Senegal or Zimbabwe).
For only about half of Non-Annex I Parties, inventories analysed include a discussion of data quality, at least at a very general level, and provide some information on uncertainties. The quantification of uncertainties did not seem feasible for some Parties due to the quality of available information and the almost exclusive use of default emission factors.
Quality assurance and quality control
Only few Annex I countries have a rather full quality assurance and control system in place so far. Nine Annex I Parties report on the development of such systems. In general, considerable efforts are needed to fully implement the required QA/QC procedures in all Annex I Parties. However, it has to be taken into
4 Argentina, Brazil, Georgia, Ghana, Indonesia, Jordan, Mexico.
COM/ENV/EPOC/IEA/SLT(2003)7
9
account that this requirement is a rather new one which was established in 2000 with the adoption of IPCC Good Practice Guidance and that establishment of a QA/QC system is a resource and time-consuming task.
No Parties from Non-Annex I reported on specific QA/QC procedures or systems implemented.
Conclusions
Inventory reporting of Annex I Parties has improved considerably during the recent years. However, for a large number of Parties, considerable efforts are needed before the inventory complies with the requirements of IPCC Good Practice Guidance and the requirements under the Kyoto Protocol. In particular, fully implementing the IPCC Good Practice Guidance in all Annex I Parties is likely to take approximately ten years. This means, that, even when improved guidelines build on existing ones, as IPCC Good Practice Guidance builds on 1996 IPCC Guidelines, Parties need a number of years for the implementation of the additional requirements.
The Marrakech Accords provide the possibility to fully establish a national inventory system earlier than required in order to get earlier green light from the review process regarding eligibility to participate in emissions trading. Taking into account the actual status of inventory preparation, it is not very likely that many Annex I Parties will be able to choose this option of an early assessment of their eligibility for emissions trading.
For some Parties, especially those that have not yet regularly submitted annual inventories including the CRF tables and the NIR, the remaining time for the implementation of Kyoto requirements until 20065 is quite short and the required efforts are large. Additional exchange of information across Parties, additional resources and capacity building will be needed, especially in some EIT countries. But it also has to be acknowledged that quite a number of EIT countries have recently improved their reporting considerably.
Not surprisingly, the inventory problems identified for Non-Annex I Parties are usually more significant than for Annex I Parties. The most important problems, which significantly decrease the inventory quality, are the lack of a continuous inventory system, as inventory teams are only working temporarily on a project basis, and the non-availability in many sectors of activity data that is collected on a continuous basis. As the national communication frequently does not provide adequate information on methods and data sources used, this lack of transparency may pose problems for time series consistency for future inventories estimated by succeeding teams.
The lack of review of individual Non-Annex I national communications weakens the improvement process of the reports. Without a specific feedback from other experts, it will be difficult for the inventory teams to considerably advance their work for the subsequent report.
5 Under the Kyoto Protocol, the national system has to be established before 31 December 2006 and it will be assessed as part of the pre-commitment period review.
COM/ENV/EPOC/IEA/SLT(2003)7
10
1. Introduction
The aim of this paper is to provide a generic assessment of the current status of greenhouse gas inventories in Annex I and some Non-Annex I Parties. This may provide a better understanding of the existing institutional capacities to prepare greenhouse gas inventories under the UNFCCC, that is, the key capacities to monitor greenhouse gas emission levels and trends.
For Annex I Parties, the assessment of the development of institutional capacities for the preparation of greenhouse gas inventories provides insights on the results of the capacity building process on the preparation of greenhouse gas inventories, which was considerably enhanced with the adoption of the Kyoto Protocol.
The adoption of legally binding targets under the Kyoto Protocol and the Marrakech Accords increased considerably the importance and strictness of requirements regarding inventory reporting. The adoption of IPCC Good Practice Guidance for national GHG inventories (2000) introduced for the first time clear prioritisation and guidance on choice of methods as well as detailed requirements for quality assurance and quality control procedures for inventory estimation. The Protocol requirement to establish a national inventory system also initiated a process that requires continuous improvement of inventory data and methods in Annex I Parties.
This paper aims to identify the improvements and progress in estimating and reporting inventory data that were made recently as well as the problems and weaknesses that would need to be addressed in the future. For Annex I Parties, it also identifies the gap or distance to the full compliance with the reporting requirements under the Protocol and to a well functioning national inventory system6. While the paper contains country-specific information for many Annex I and Non-Annex I Parties, its purpose, however, is not to review individual countries’ inventories. Such individual reviews are conducted through the UNFCCC process, at least for Annex I Parties. Rather, it is meant to provide a broad picture of the institutional capacity that is available across countries in preparing and submitting inventory information.
As an analytical framework, the paper chooses the compliance with the key inventory principles completeness, comparability, consistency, transparency and accuracy. In addition to those five principles timeliness and the establishment QA/QC procedures are analysed for Annex I Parties.
2. Status of national inventory preparation in Annex I Parties
2.1 Legal requirements under the Convention and the Kyoto Protocol
In accordance with Articles 4 and 12 of the Convention on Climate Change, Parties to the Convention submit to the secretariat national greenhouse gas inventories of anthropogenic emissions by sources and removals by sinks of greenhouse gases not controlled by the Montreal Protocol. For Annex I Parties, two sequential processes have been established: the annual reporting of national greenhouse gas inventories, and the annual review of the inventories. Annex I Parties have to submit, by 15 April each year, annual national greenhouse gas inventories, for the period covering the base year (1990 for all except a few Parties undergoing the process of transition to a market economy) up to the last but one year prior to the year of
6 Some Annex I Parties decided not to adopt the Kyoto Protocol, yet they are submitting inventory information. They are included in this analysis for comparison purposes.
COM/ENV/EPOC/IEA/SLT(2003)7
11
submission. Starting in 2000, Annex I Parties had to use the revised UNFCCC reporting guidelines7 for preparing and reporting their annual inventories. These guidelines require the submission of an annual national inventory report (NIR) describing the methodologies and data used in preparing their inventory, and the common reporting format (CRF) that Parties must use for reporting their annual greenhouse gas data electronically. At COP 8, Parties adopted revised reporting guidelines, including a revised set of tables for the CRF.8 These revised guidelines should be used by Annex I Parties starting with the submission due in April 2004. Among a number of modifications, the revised reporting guidelines take into account new elements arising from the requirements from the IPCC report on Good Practice Guidance and Uncertainty Management in National Greenhouse Gas Inventories9 which was elaborated during 1999 and 2000. The new guidelines also indicate the structure and contents of national inventory reports.
The Kyoto Protocol’s effectiveness will largely depend on whether the data on emissions and removals used to assess compliance is reliable. Recognizing this, the Kyoto Protocol and Marrakech Accords include a set of monitoring and review procedures to enhance reliability of greenhouse gas monitoring. The Protocol’s monitoring procedures are based on existing reporting of inventories and in-depth review procedures under the Convention, building on experience gained in the climate change process over the past decade. Articles 5, 7 and 8 of the Kyoto Protocol address the reporting and review of information by Annex I Parties under the Protocol, Article 5.1 commits Annex I Parties to having in place, no later than 2007, national systems for the estimation of greenhouse gas emissions by sources and removals by sinks. It also states that, where agreed methodologies10 are not used to estimate emissions and removals, appropriate "adjustments" - conservative corrections of the inventory estimates - should be calculated by the experts reviewing the inventories (Article 5.2). At SBSTA 18 in June 2003, guidance for methodologies for adjustments was agreed which will be adopted at COP 9.
The following sections assess the status of current inventory preparation in Annex I Parties. This assessment is based on the legal requirements described above, this means the adherence to IPCC and UNFCCC reporting guidelines as well as the requirements related to national inventory systems under the Kyoto Protocol.
2.2 Problems of national inventory systems
The guidelines for national systems for the estimation of anthropogenic greenhouse gas emissions by sources and removals by sinks under Article 5.1 of the Kyoto Protocol define a national inventory system as a system including all institutional, legal and procedural arrangements made within a Party for estimating anthropogenic emissions by sources and removals by sinks of all greenhouse gases not controlled by the Montreal Protocol, and for reporting and archiving inventory information. The guidelines also request that national systems should be designed and operated to ensure the transparency, consistency, comparability, completeness and accuracy of inventories as defined in the UNFCCC reporting guidelines for inventories and to ensure the quality of the inventory through planning, preparation and management of inventory activities. Inventory activities covered by the national system include collecting activity data, selecting methods and emission factors appropriately, estimating anthropogenic GHG emissions by sources and removals by sinks, implementing uncertainty assessment and quality assurance/quality control
7 FCCC/CP/1999/7, pages 3 – 79, adopted by decision 3/CP.5 at COP 5 (October/November 1999, Bonn) 8 Decision 18/CP.8 in FCCC/CP/2002/7/Add.2, reporting guidelines in FCCC/CP/2002/8 9 Further referred to in this paper as IPCC Good Practice Guidance. 10 That is, the revised 1996 IPCC Guidelines for National Greenhouse Gas Inventories and IPCC Good Practice Guidance.
COM/ENV/EPOC/IEA/SLT(2003)7
12
(QA/QC) activities, and carrying out procedures for the verification of the inventory data at the national level.
National inventory systems already exist in all Annex I Parties that provide inventory submissions annually to the UNFCCC (34 Parties in 2002). However, it is difficult to assess whether those inventory systems already comply with the requirements established in the guidelines under Article 5.1 and what type of improvements will be needed. The information provided by Annex I Parties on the stage of development of their national inventory system according to Article 5.1 under the Kyoto Protocol is relatively scarce. In the NIR few Parties currently describe existing weaknesses or additional steps they deem necessary to improve their national inventory system. At a general level some common problems exist with regard to national systems of Annex I Parties:
1. Insufficient institutional framework: Frequently there are no defined formal arrangements that describe co-operation of different national institutions. The inventory work is based on personal contacts, customary practices and not on clearly defined agreements that would provide for continuous quality of all inventory sections. Sometimes there is also a lack of overview about responsibilities and quality of work of contributing organizations. Frequently there are no formal arrangements with industry/ companies for data collection and reporting which creates high uncertainties for the inventory agency as voluntary cooperation of companies or industrial associations may change in the future due to external effects. Even in the energy sector, which accounts for a major part of emissions in most Annex I Parties and where the emission estimation is usually considered as quite reliable, a number of Annex I Parties have not established a legal basis for the collection of energy data from energy industries and data is only provided on a voluntary basis.
2. Lack of cooperation: Frequently there is a lack of cooperation between relevant organizations. This includes cooperation of different institutions responsible for different inventory sectors as well as cooperation of institutions responsible for inventory preparations with data collection institutions (mainly national statistical offices) or research institutions which are working on methodological development. Especially in those countries where statistical offices are not directly involved in the preparation of inventories, inventory agencies face problems in accessing all data available at national level or in accessing all relevant data parameters such as uncertainties. The inventory preparation process does not always and automatically reflect the research results available in a country which indicates a lack of communication between independent research and inventory agencies.
3. Lack of continuity: In smaller countries, teams responsible for inventory preparation are usually quite small, which can cause problems of continuity in expertise and quality of inventories if some experts leave the institutions.
4. Lack of resources: Lack of resources is a common problem of all inventory agencies. One of the purposes of the IPCC Good Practice Guidance was to provide guidance for prioritisation among inventory source categories and estimation methods for an efficient use of resources. However, inventory preparation is still a challenging task for many countries and for a range of countries resources for inventory improvement are insufficient. Especially Economies in Transition (EIT) are lacking resources for inventory preparation. For example in Ukraine the last inventory was reported in 1999, based on a project together with the 1st national communication. After that project no financial resources were available. In other EIT countries no continuous funding for inventory preparation exists. There are contracts from year to year and therefore no continuous planning or quality improvement process is possible. In other EIT countries where continuous teams exist, financing problems still occur for the inventory improvement process necessary for compliance with requirements under the Kyoto Protocol.
COM/ENV/EPOC/IEA/SLT(2003)7
13
5. Changes in political, institutional systems: Changes in political systems frequently lead to disruption in data collection systems. In some EIT countries as well as in Germany it is difficult to collect consistent time series data back to the base year where different political systems with different data collection systems were in place. Recently processes of privatisation and liberalization cause new problems for inventory agencies. Liberalization and enhanced competition in the energy sector decrease the willingness of companies to publish energy data. Data that was regularly published in the past is now considered as confidential business information. Timeliness of data submission to statistical offices decreases. Industrial associations redefine their roles in a liberalized market and stop the collection and publication of regular statistical information. In addition, deregulation policy in many Annex I Parties negatively affects the inventory compilation as governments aim to reduce bureaucratic and administrative burdens for business and industry which often means that certain reporting requirements are waived. However, some experiences, e.g. from United Kingdom, indicate that reporting problems caused by liberalization are of temporary character and can be resolved with some adaptations of the system.
6. Lack of documentation and systematic archiving: In many Parties there is still a lack of appropriate documentation and archiving of underlying inventory data and methods and no appropriate database systems to archive, manage and update inventory data are in place. The documentation is prioritised by IPCC Good Practice Guidance and the requirements to report a NIR is also enhancing documentation. However, there is still a considerable number of Parties that do not report NIRs or whose NIRs do not provide a transparent documentation of estimation methods and data used. The lack of centralized archiving systems was also a finding from in-country visits during the UNFCCC inventory review process for some Parties.
7. Lack of quality assurance and quality control (QA/QC) procedures: As shown in section 2.9, a considerable number of Parties has not yet implemented QA/QC procedures and has not yet finalized an inventory improvement plan that defines quality objectives for the inventory.
The country visits during the UNFCCC inventory review assess the national systems and provide recommendations with regard to their improvement. In some cases the review reports provide specific recommendations. For instance, for Latvia, some restructuring of current institutional arrangements and the promotion of more active collaboration between the inventory agency and other bodies was required. For Hungary review experts indicated that the status and the specific tasks of the inventory agency lack a sound legal basis as does funding, thus the review report stressed the need for a long-term arrangement. However, until now only nine in-country review reports of Annex I Parties conducted during three years11 are available which are not well comparable as the earlier reviews have to be seen as a trial phase to establish a consistent and comparable review procedure. A systematic assessment of the status of inventory systems is not yet possible on the basis of these early UNFCCC review reports. Therefore, this paper chooses a range of qualitative “indicators” in order to assess the gap between the actual quality of inventory submissions from Annex I Parties and the requirements under the Kyoto Protocol.
Section 2.3 explores the availability of inventory submissions, their timeliness, completeness and comparability.
Section 3.4 addresses consistency of inventories and section 3.5 accuracy of inventories. An indicator with regard to accuracy of inventories is the degree to which IPCC Good Practice Guidance was already implemented. Two key requirements from the IPCC Guidance were assessed in this paper: the implementation of a quantitative assessment of uncertainties is analysed in section 2.8.2 and the
11 The following countries were already subject to In-Country reviews under the UNFCCC: Austria, Australia, France, Finland, Hungary, Latvia, New Zealand, Sweden, United Kingdom and USA.
COM/ENV/EPOC/IEA/SLT(2003)7
14
implementation of the IPCC recommendations in relation to methodological choice is assessed in section 2.8.3.
The status of the national system is further assessed in section 2.9 on the basis of how effectively QA/QC procedures are established in the countries, which lead to continuous improvements in the quality of methodologies and data.
2.3 Availability and timeliness of inventories
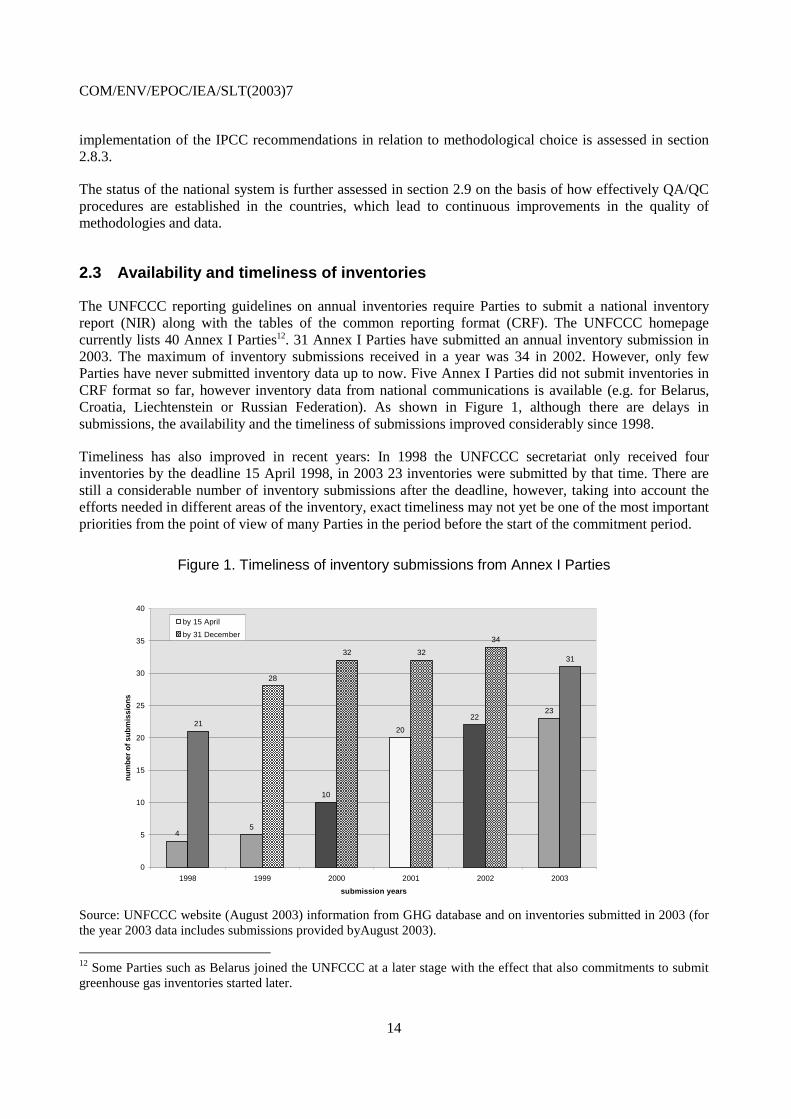
The UNFCCC reporting guidelines on annual inventories require Parties to submit a national inventory report (NIR) along with the tables of the common reporting format (CRF). The UNFCCC homepage currently lists 40 Annex I Parties12. 31 Annex I Parties have submitted an annual inventory submission in 2003. The maximum of inventory submissions received in a year was 34 in 2002. However, only few Parties have never submitted inventory data up to now. Five Annex I Parties did not submit inventories in CRF format so far, however inventory data from national communications is available (e.g. for Belarus, Croatia, Liechtenstein or Russian Federation). As shown in Figure 1, although there are delays in submissions, the availability and the timeliness of submissions improved considerably since 1998.
Timeliness has also improved in recent years: In 1998 the UNFCCC secretariat only received four inventories by the deadline 15 April 1998, in 2003 23 inventories were submitted by that time. There are still a considerable number of inventory submissions after the deadline, however, taking into account the efforts needed in different areas of the inventory, exact timeliness may not yet be one of the most important priorities from the point of view of many Parties in the period before the start of the commitment period.
Figure 1. Timeliness of inventory submissions from Annex I Parties
45
10
20
2223
21
28
32 32
34
31
0
5
10
15
20
25
30
35
40
1998 1999 2000 2001 2002 2003
submission years
nu
mb
er o
f su
bm
issi
on
s
by 15 April
by 31 December
Source: UNFCCC website (August 2003) information from GHG database and on inventories submitted in 2003 (for the year 2003 data includes submissions provided byAugust 2003).
12 Some Parties such as Belarus joined the UNFCCC at a later stage with the effect that also commitments to submit greenhouse gas inventories started later.
COM/ENV/EPOC/IEA/SLT(2003)7
15
Figure 2. Submissions of national inventory reports and inventory data in the common reporting format in 2003
11
23
9
7
20
9
0
5
10
15
20
25
National Inventory Report Common Reporting Format
Nu
mb
er o
f su
bm
issi
on
s
By 15 April 2003
by 31 May 2003
not provided
Source: UNFCCC website (August 2003) information from GHG database and on inventories submitted in 2003, compilation by the author (data includes submissions provided by August 2003),
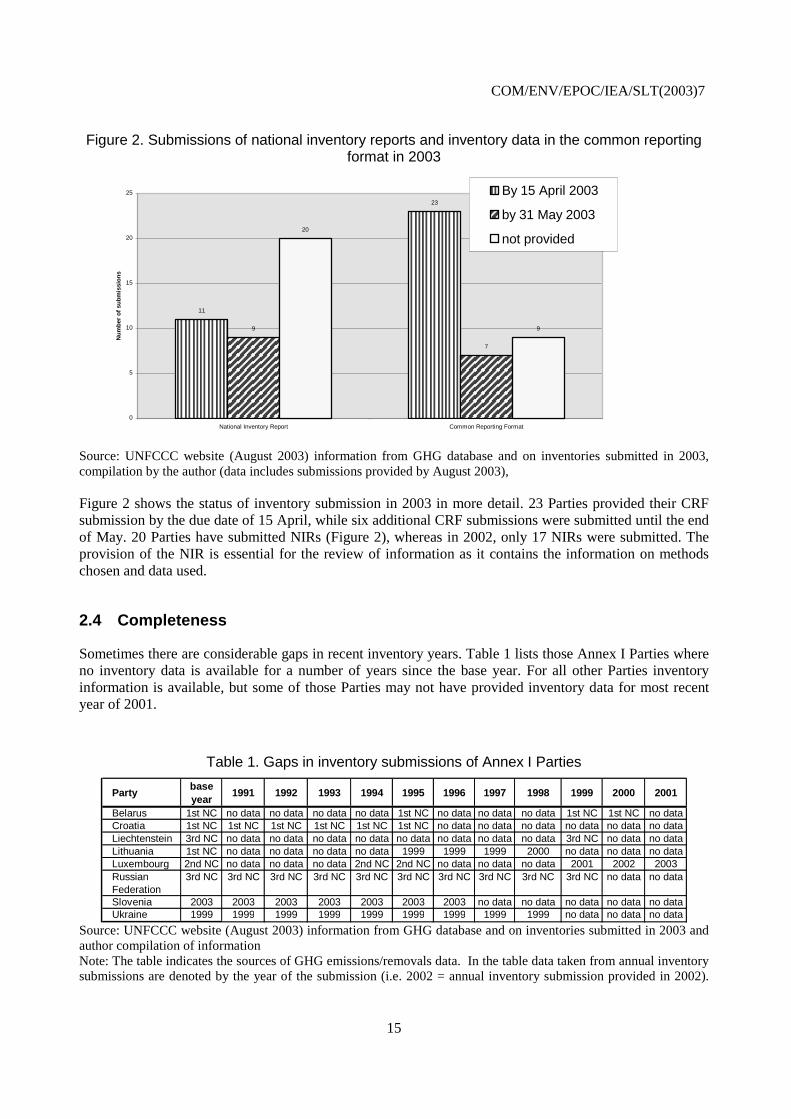
Figure 2 shows the status of inventory submission in 2003 in more detail. 23 Parties provided their CRF submission by the due date of 15 April, while six additional CRF submissions were submitted until the end of May. 20 Parties have submitted NIRs (Figure 2), whereas in 2002, only 17 NIRs were submitted. The provision of the NIR is essential for the review of information as it contains the information on methods chosen and data used.
2.4 Completeness
Sometimes there are considerable gaps in recent inventory years. Table 1 lists those Annex I Parties where no inventory data is available for a number of years since the base year. For all other Parties inventory information is available, but some of those Parties may not have provided inventory data for most recent year of 2001.
Table 1. Gaps in inventory submissions of Annex I Parties
Partybase year
1991 1992 1993 1994 1995 1996 1997 1998 1999 2000 2001
Belarus 1st NC no data no data no data no data 1st NC no data no data no data 1st NC 1st NC no dataCroatia 1st NC 1st NC 1st NC 1st NC 1st NC 1st NC no data no data no data no data no data no dataLiechtenstein 3rd NC no data no data no data no data no data no data no data no data 3rd NC no data no dataLithuania 1st NC no data no data no data no data 1999 1999 1999 2000 no data no data no dataLuxembourg 2nd NC no data no data no data 2nd NC 2nd NC no data no data no data 2001 2002 2003Russian Federation
3rd NC 3rd NC 3rd NC 3rd NC 3rd NC 3rd NC 3rd NC 3rd NC 3rd NC 3rd NC no data no data
Slovenia 2003 2003 2003 2003 2003 2003 2003 no data no data no data no data no dataUkraine 1999 1999 1999 1999 1999 1999 1999 1999 1999 no data no data no data
Source: UNFCCC website (August 2003) information from GHG database and on inventories submitted in 2003 and author compilation of information Note: The table indicates the sources of GHG emissions/removals data. In the table data taken from annual inventory submissions are denoted by the year of the submission (i.e. 2002 = annual inventory submission provided in 2002).
COM/ENV/EPOC/IEA/SLT(2003)7
16
In cases where data was only provided in national communications (NC) it is indicated whether they are from the 1st, 2nd or 3rd NC of the Party.
Completeness is also improving in recent years, e.g. before 3rd national communication from Russian Federation, data was only available until 1996. Bulgaria, Monaco, Romania, Slovenia and Estonia submitted inventory information in 2003 and filled previous gaps.
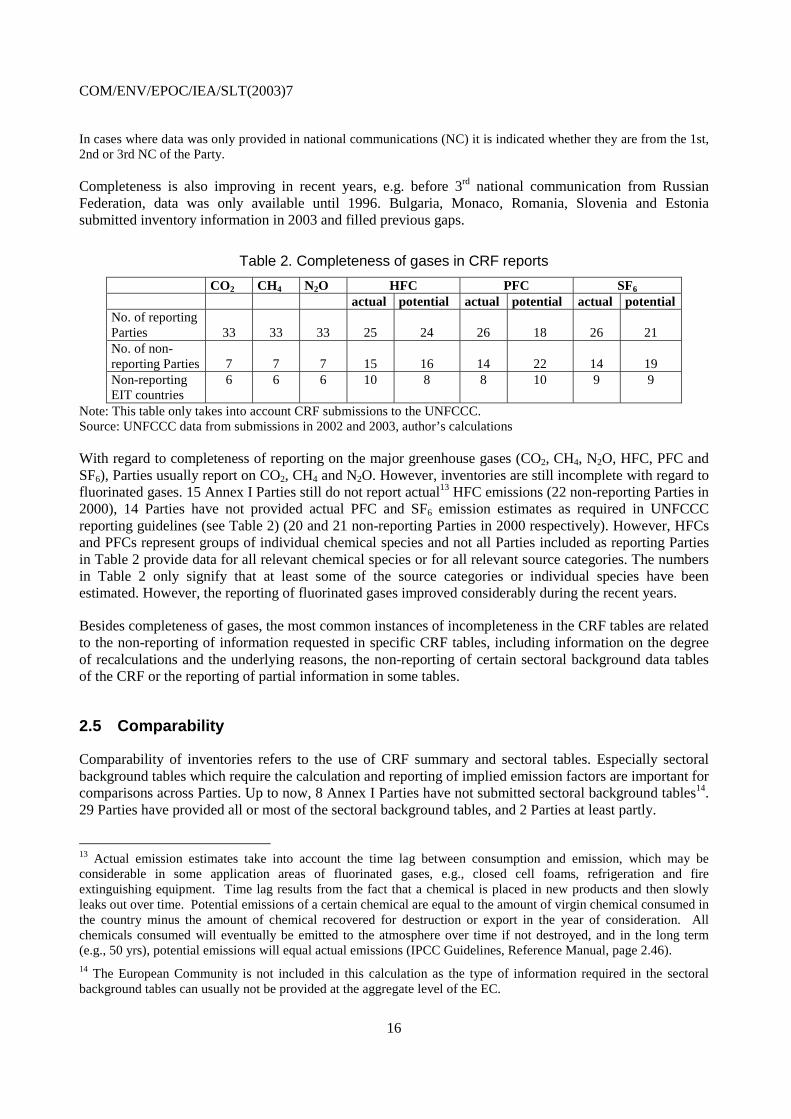
Table 2. Completeness of gases in CRF reports
CO2 CH4 N2O HFC PFC SF6 actual potential actual potential actual potential No. of reporting Parties
33
33
33
25
24
26
18
26
21
No. of non-reporting Parties
7
7
7
15
16
14
22
14
19
Non-reporting EIT countries
6 6 6 10 8 8 10 9 9
Note: This table only takes into account CRF submissions to the UNFCCC. Source: UNFCCC data from submissions in 2002 and 2003, author’s calculations
With regard to completeness of reporting on the major greenhouse gases (CO2, CH4, N2O, HFC, PFC and SF6), Parties usually report on CO2, CH4 and N2O. However, inventories are still incomplete with regard to fluorinated gases. 15 Annex I Parties still do not report actual13 HFC emissions (22 non-reporting Parties in 2000), 14 Parties have not provided actual PFC and SF6 emission estimates as required in UNFCCC reporting guidelines (see Table 2) (20 and 21 non-reporting Parties in 2000 respectively). However, HFCs and PFCs represent groups of individual chemical species and not all Parties included as reporting Parties in Table 2 provide data for all relevant chemical species or for all relevant source categories. The numbers in Table 2 only signify that at least some of the source categories or individual species have been estimated. However, the reporting of fluorinated gases improved considerably during the recent years.
Besides completeness of gases, the most common instances of incompleteness in the CRF tables are related to the non-reporting of information requested in specific CRF tables, including information on the degree of recalculations and the underlying reasons, the non-reporting of certain sectoral background data tables of the CRF or the reporting of partial information in some tables.
2.5 Comparability
Comparability of inventories refers to the use of CRF summary and sectoral tables. Especially sectoral background tables which require the calculation and reporting of implied emission factors are important for comparisons across Parties. Up to now, 8 Annex I Parties have not submitted sectoral background tables14. 29 Parties have provided all or most of the sectoral background tables, and 2 Parties at least partly.
13 Actual emission estimates take into account the time lag between consumption and emission, which may be considerable in some application areas of fluorinated gases, e.g., closed cell foams, refrigeration and fire extinguishing equipment. Time lag results from the fact that a chemical is placed in new products and then slowly leaks out over time. Potential emissions of a certain chemical are equal to the amount of virgin chemical consumed in the country minus the amount of chemical recovered for destruction or export in the year of consideration. All chemicals consumed will eventually be emitted to the atmosphere over time if not destroyed, and in the long term (e.g., 50 yrs), potential emissions will equal actual emissions (IPCC Guidelines, Reference Manual, page 2.46). 14 The European Community is not included in this calculation as the type of information required in the sectoral background tables can usually not be provided at the aggregate level of the EC.
COM/ENV/EPOC/IEA/SLT(2003)7
17
2.6 Transparency
Transparency refers to the availability of the information that is needed to assess inventory quality. It is a key pre-requisite for the review of greenhouse gas inventory information. In general the provision of a NIR considerably increases the transparency of the compilation of inventory estimates. Figure 1 shows that half of Annex I Parties have not yet provided a NIR in 2003. Even for those 20 Parties that submitted a NIR, the quality of this report differs considerably and some NIRs do not provide sufficient information on methodologies and data used. This means that transparency of inventories is still a key problem.
At present, the identification of areas that are not sufficiently transparent is also one of the most common findings of expert review teams during the inventory review. However, for the first years of NIR submissions there were only very general requirements with regard to the NIR content and a structure for the NIR was only recently agreed. The inventory review process will contribute considerably to decrease the areas lacking transparency. The in-country review checks archiving and documentation of inventory data. Internal and external transparency within inventory agencies and contributing institutions is frequently linked.
Under the Convention, it is voluntary for Annex I Parties to provide review teams with access to confidential data. However, the estimates and source categories reported as confidential are at the moment not very frequent and usually limited to some source categories in the industrial sector. This means that the confidentiality of some parts of inventory information at present does not obstruct the review process.
2.7 Consistency
An inventory is consistent if the same methodologies are used for the base and all subsequent years and if consistent data sets are used to estimate emissions or removals from sources or sinks.
Problems with time series consistency exist where no complete time series have been estimated. Complete time series data is currently available for 28 Annex I Parties. Table 1 provides an overview on gaps in time series for 7 Parties.
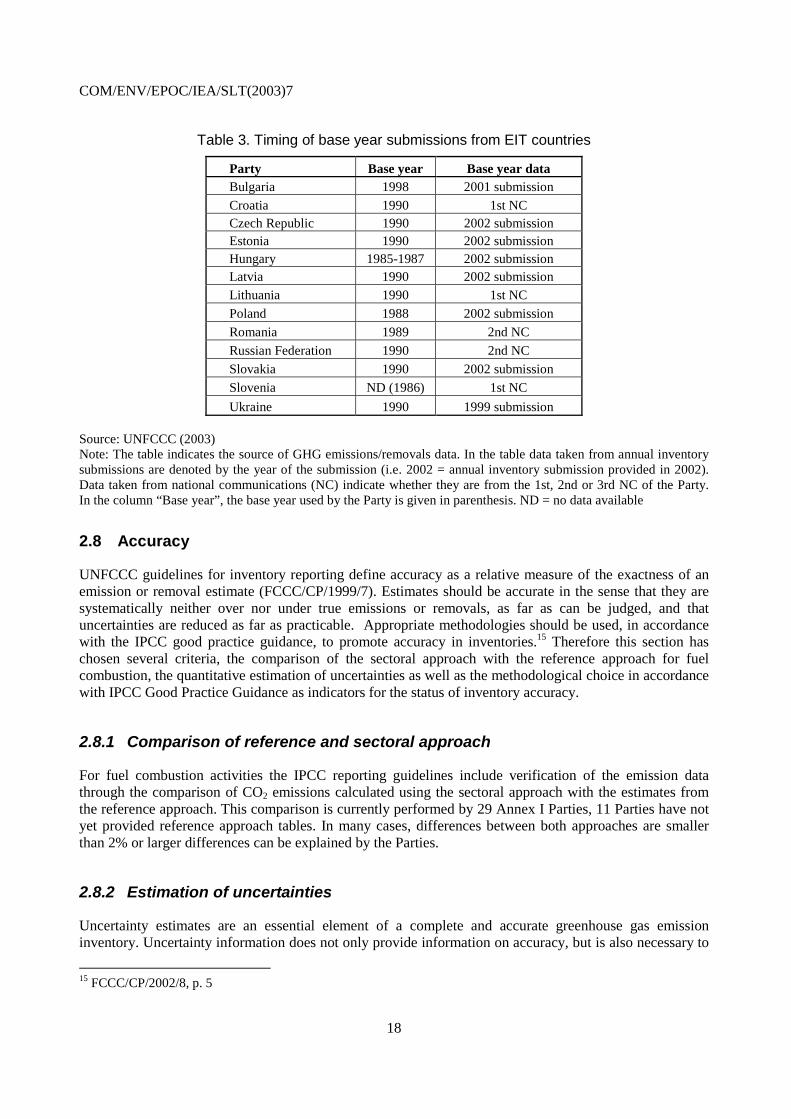
Until recently, many EIT countries had not yet submitted their base year estimates as part of the inventory submissions which is the basis for the calculations of assigned amounts under the Kyoto Protocol. This situation has considerably improved for many EIT countries with the inventory submission in 2002 (Table 3). Some EIT countries still have only provided base year data as part of their national communications and not in annual inventory submissions.
A detailed assessment of the use of consistent methodologies for the base and all subsequent years and of consistent data sets is not possible at the moment for many Parties because of the lack of transparency described above. For those Parties where no NIR or one without appropriate methodological description is submitted, consistency cannot be analysed.
COM/ENV/EPOC/IEA/SLT(2003)7
18
Table 3. Timing of base year submissions from EIT countries
Party Base year Base year data Bulgaria 1998 2001 submission
Croatia 1990 1st NC Czech Republic 1990 2002 submission Estonia 1990 2002 submission Hungary 1985-1987 2002 submission Latvia 1990 2002 submission Lithuania 1990 1st NC
Poland 1988 2002 submission
Romania 1989 2nd NC
Russian Federation 1990 2nd NC
Slovakia 1990 2002 submission
Slovenia ND (1986) 1st NC
Ukraine 1990 1999 submission Source: UNFCCC (2003) Note: The table indicates the source of GHG emissions/removals data. In the table data taken from annual inventory submissions are denoted by the year of the submission (i.e. 2002 = annual inventory submission provided in 2002). Data taken from national communications (NC) indicate whether they are from the 1st, 2nd or 3rd NC of the Party. In the column “Base year”, the base year used by the Party is given in parenthesis. ND = no data available
2.8 Accuracy
UNFCCC guidelines for inventory reporting define accuracy as a relative measure of the exactness of an emission or removal estimate (FCCC/CP/1999/7). Estimates should be accurate in the sense that they are systematically neither over nor under true emissions or removals, as far as can be judged, and that uncertainties are reduced as far as practicable. Appropriate methodologies should be used, in accordance with the IPCC good practice guidance, to promote accuracy in inventories.15 Therefore this section has chosen several criteria, the comparison of the sectoral approach with the reference approach for fuel combustion, the quantitative estimation of uncertainties as well as the methodological choice in accordance with IPCC Good Practice Guidance as indicators for the status of inventory accuracy.
2.8.1 Comparison of reference and sectoral approach
For fuel combustion activities the IPCC reporting guidelines include verification of the emission data through the comparison of CO2 emissions calculated using the sectoral approach with the estimates from the reference approach. This comparison is currently performed by 29 Annex I Parties, 11 Parties have not yet provided reference approach tables. In many cases, differences between both approaches are smaller than 2% or larger differences can be explained by the Parties.
2.8.2 Estimation of uncertainties
Uncertainty estimates are an essential element of a complete and accurate greenhouse gas emission inventory. Uncertainty information does not only provide information on accuracy, but is also necessary to
15 FCCC/CP/2002/8, p. 5
COM/ENV/EPOC/IEA/SLT(2003)7
19
help prioritise efforts to improve accuracy of inventories and guide decisions on methodological choice in accordance with IPCC Good Practice Guidance. National Greenhouse Gas Inventories will typically contain a wide range of emission estimates, varying from carefully measured and complete data on emissions, to order-of-magnitude estimates of highly variable nitrous oxide (N2O) fluxes from soils.
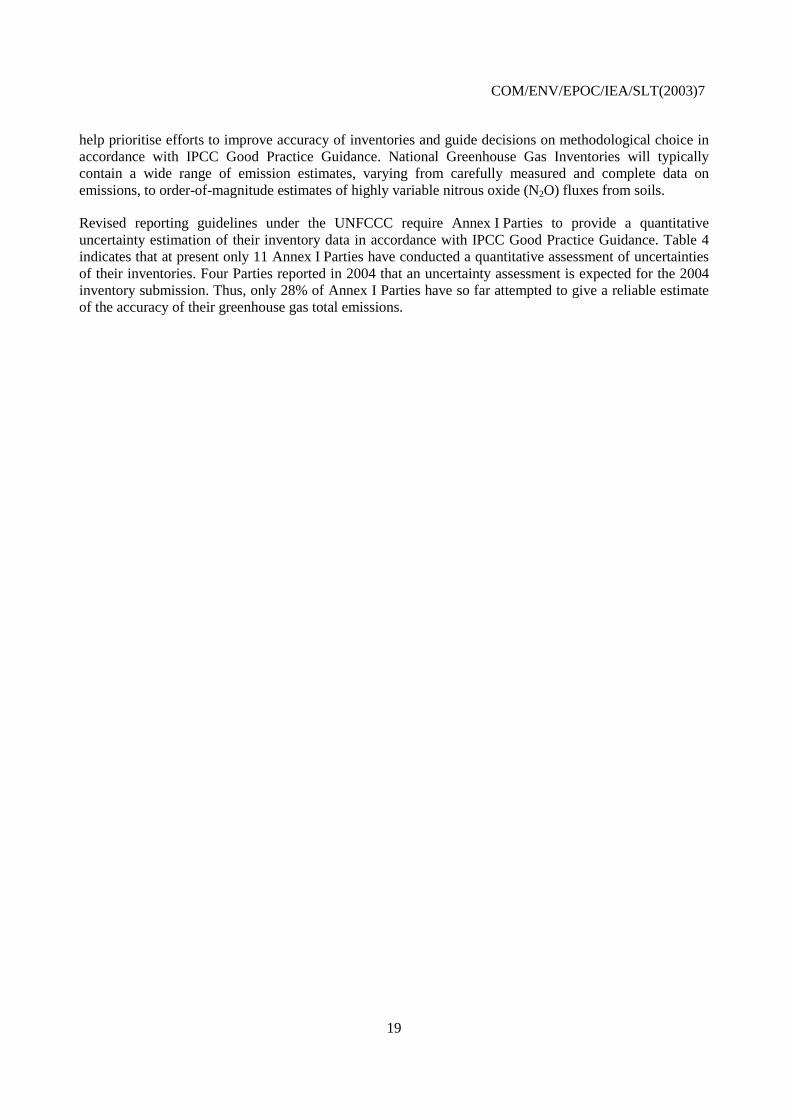
Revised reporting guidelines under the UNFCCC require Annex I Parties to provide a quantitative uncertainty estimation of their inventory data in accordance with IPCC Good Practice Guidance. Table 4 indicates that at present only 11 Annex I Parties have conducted a quantitative assessment of uncertainties of their inventories. Four Parties reported in 2004 that an uncertainty assessment is expected for the 2004 inventory submission. Thus, only 28% of Annex I Parties have so far attempted to give a reliable estimate of the accuracy of their greenhouse gas total emissions.
COM/ENV/EPOC/IEA/SLT(2003)7
20
Table 4. Implementation of quantitative uncertainty assessment by Annex I Parties16
Party Quantitative assessment of uncertainties Austria conducted
Belgiumb not conducted (expected for 2004 submission)
Canadab conducted only for 1990,
assessment requires update (expected for 2004 submission)
Czech Republic not conducted, assessment started (results
expected for 2004 submission)
Denmark conducted
Finland conducted
France conducted (Tier 1)
Germany not conducted, assessment started (results
expected for 2004 submission)
Greece not conducted Ireland conducted (Tier 1)
New Zealand conducted (Tier 1)
Norway conducted (Tier 1 and Tier 2)
Slovenia conducted (Tier 1)
Spain not conducted, assessment started Sweden not conducted, assessment started
United Kingdom conducted (Tier 1 and Tier 2)
United States conducted
Note: Tier 1: estimation of uncertainties by source category using the error propagation equation and simple combination of uncertainties by source category. Tier 2: Estimation of uncertainties by source category using Monte Carlo analysis. Source: information submitted in NIRs in 2002 and 2003.
16 The table only includes those countries for which national inventory reports were available by August 2003, because this is the only source at present where information on uncertainty estimation is reported.
COM/ENV/EPOC/IEA/SLT(2003)7
21
2.8.3 Methodological choice
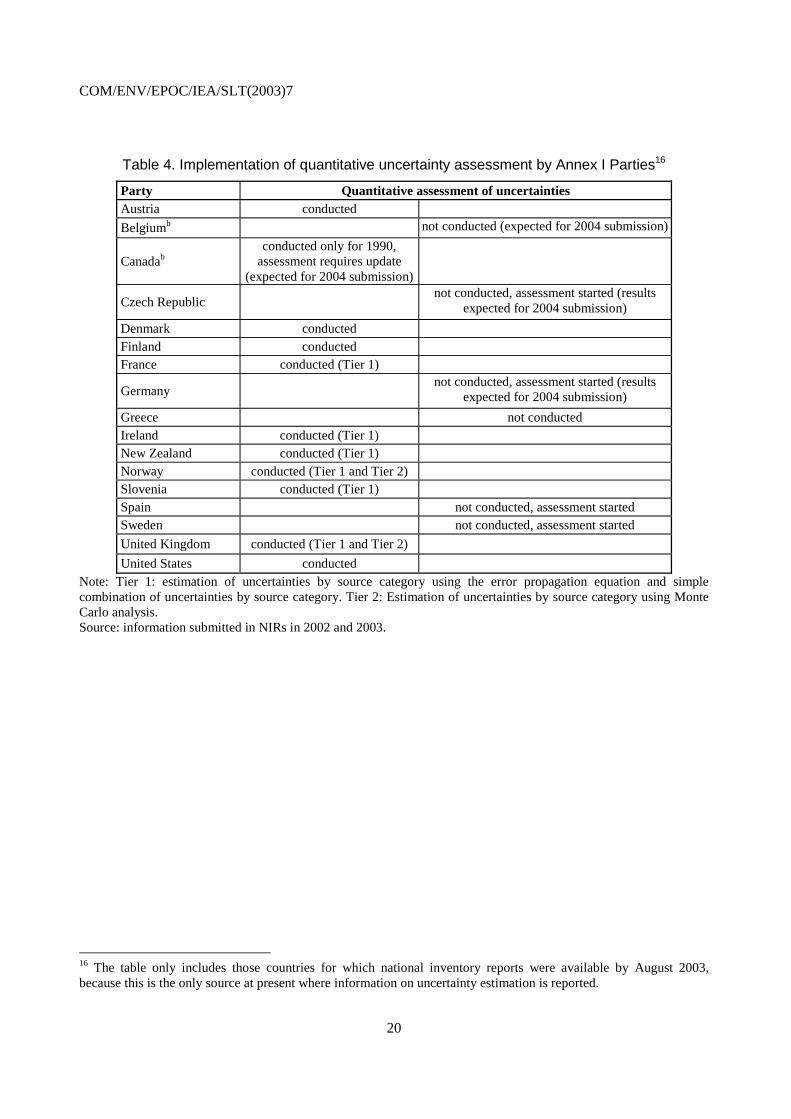
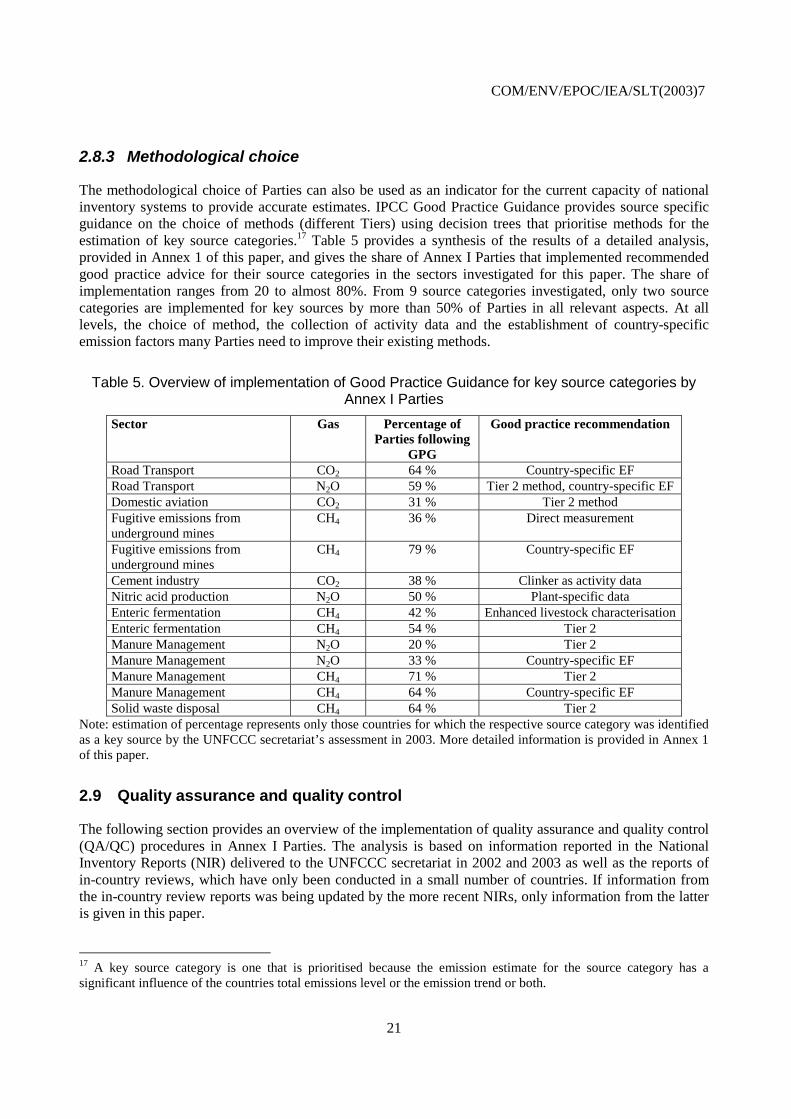
The methodological choice of Parties can also be used as an indicator for the current capacity of national inventory systems to provide accurate estimates. IPCC Good Practice Guidance provides source specific guidance on the choice of methods (different Tiers) using decision trees that prioritise methods for the estimation of key source categories.17 Table 5 provides a synthesis of the results of a detailed analysis, provided in Annex 1 of this paper, and gives the share of Annex I Parties that implemented recommended good practice advice for their source categories in the sectors investigated for this paper. The share of implementation ranges from 20 to almost 80%. From 9 source categories investigated, only two source categories are implemented for key sources by more than 50% of Parties in all relevant aspects. At all levels, the choice of method, the collection of activity data and the establishment of country-specific emission factors many Parties need to improve their existing methods.
Table 5. Overview of implementation of Good Practice Guidance for key source categories by Annex I Parties
Sector Gas Percentage of Parties following
GPG
Good practice recommendation
Road Transport CO2 64 % Country-specific EF Road Transport N2O 59 % Tier 2 method, country-specific EF Domestic aviation CO2 31 % Tier 2 method Fugitive emissions from underground mines
CH4 36 % Direct measurement
Fugitive emissions from underground mines
CH4 79 % Country-specific EF
Cement industry CO2 38 % Clinker as activity data Nitric acid production N2O 50 % Plant-specific data Enteric fermentation CH4 42 % Enhanced livestock characterisation Enteric fermentation CH4 54 % Tier 2 Manure Management N2O 20 % Tier 2 Manure Management N2O 33 % Country-specific EF Manure Management CH4 71 % Tier 2 Manure Management CH4 64 % Country-specific EF Solid waste disposal CH4 64 % Tier 2
Note: estimation of percentage represents only those countries for which the respective source category was identified as a key source by the UNFCCC secretariat’s assessment in 2003. More detailed information is provided in Annex 1 of this paper.
2.9 Quality assurance and quality control
The following section provides an overview of the implementation of quality assurance and quality control (QA/QC) procedures in Annex I Parties. The analysis is based on information reported in the National Inventory Reports (NIR) delivered to the UNFCCC secretariat in 2002 and 2003 as well as the reports of in-country reviews, which have only been conducted in a small number of countries. If information from the in-country review reports was being updated by the more recent NIRs, only information from the latter is given in this paper.
17 A key source category is one that is prioritised because the emission estimate for the source category has a significant influence of the countries total emissions level or the emission trend or both.
COM/ENV/EPOC/IEA/SLT(2003)7
22
2.9.1 Status of development of quality management systems
According to the Guidelines for national inventory systems under Article 5.1 of the Kyoto Protocol and the IPCC Good Practice Guidance, a system of quality control and quality assurance (QA/QC system) procedures, as well as a QA/QC plan for the preparation of the inventory, have to be implemented. The QA/QC plan contains a description of specific QC procedures that have to be conducted during the preparation of the inventory, of QA measures (usually external reviews) and quality objectives.
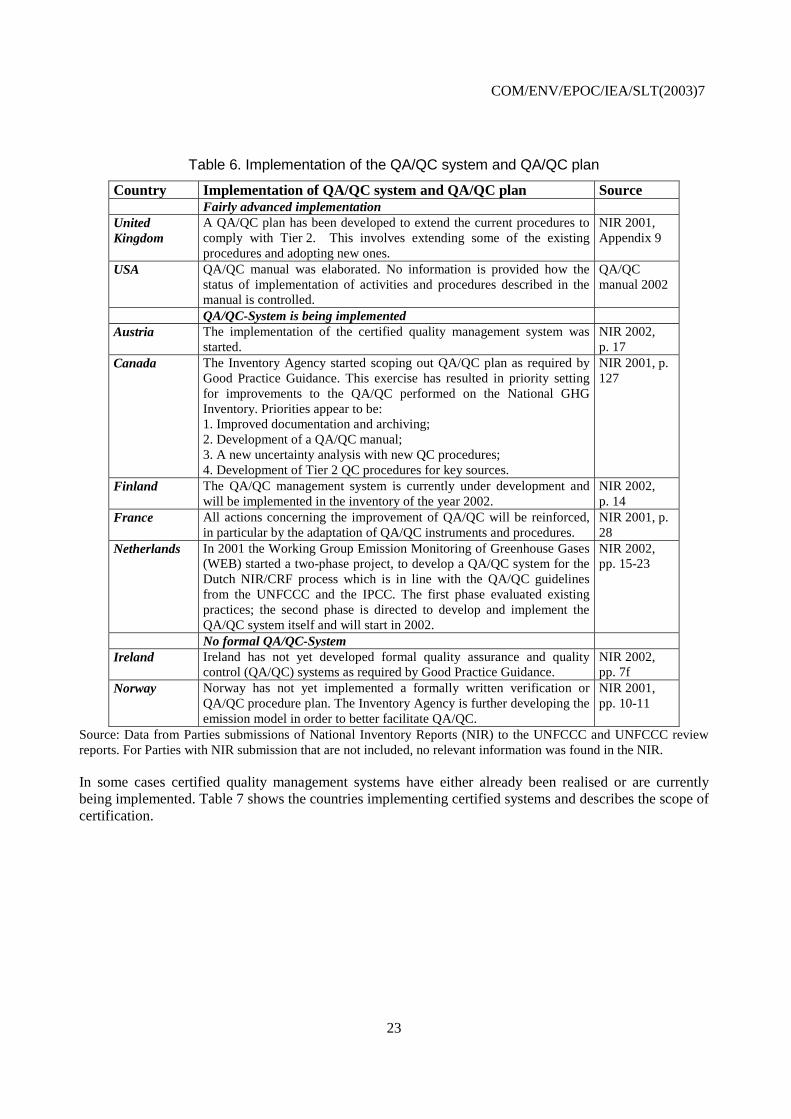
Table 6 summarises the status of implementation of QA/QC systems and plans in several Annex I Parties. Only United Kingdom and the USA seem to have achieved a rather advanced stage of their QA/QC system. Virtually all countries that provide information on this issue are currently improving their QA/QC system. In Canada, Finland, France, Germany, the Netherlands, the United Kingdom and the United States special projects have been set up to fulfil the formal requirements. For 11 Parties that provided NIRs, no information on the QA/QC system was included. However, it can be assumed that no specific efforts may have been undertaken, because they would most likely be included in reports. However, it has to be acknowledged that the IPCC Good Practice Guidance –which includes the requirement to establish a QA/QC system- was only adopted in 2000. Taken into account the considerable inventory improvements that took place in recent years, inventories were improved even without being based on a formal QA/QC system. It is important to also note that reporting about a QA/QC plan is not always consistent across Parties. While some countries mainly present their quality objectives and improvement plans, others refer to the exact procedures to be followed that are usually compiled in a QA/QC manual.
COM/ENV/EPOC/IEA/SLT(2003)7
23
Table 6. Implementation of the QA/QC system and QA/QC plan
Country Implementation of QA/QC system and QA/QC plan Source Fairly advanced implementation United Kingdom
A QA/QC plan has been developed to extend the current procedures to comply with Tier 2. This involves extending some of the existing procedures and adopting new ones.
NIR 2001, Appendix 9
USA QA/QC manual was elaborated. No information is provided how the status of implementation of activities and procedures described in the manual is controlled.
QA/QC manual 2002
QA/QC-System is being implemented Austria The implementation of the certified quality management system was
started. NIR 2002, p. 17
Canada The Inventory Agency started scoping out QA/QC plan as required by Good Practice Guidance. This exercise has resulted in priority setting for improvements to the QA/QC performed on the National GHG Inventory. Priorities appear to be: 1. Improved documentation and archiving; 2. Development of a QA/QC manual; 3. A new uncertainty analysis with new QC procedures; 4. Development of Tier 2 QC procedures for key sources.
NIR 2001, p. 127
Finland The QA/QC management system is currently under development and will be implemented in the inventory of the year 2002.
NIR 2002, p. 14
France All actions concerning the improvement of QA/QC will be reinforced, in particular by the adaptation of QA/QC instruments and procedures.
NIR 2001, p. 28
Netherlands In 2001 the Working Group Emission Monitoring of Greenhouse Gases (WEB) started a two-phase project, to develop a QA/QC system for the Dutch NIR/CRF process which is in line with the QA/QC guidelines from the UNFCCC and the IPCC. The first phase evaluated existing practices; the second phase is directed to develop and implement the QA/QC system itself and will start in 2002.
NIR 2002, pp. 15-23
No formal QA/QC-System Ireland Ireland has not yet developed formal quality assurance and quality
control (QA/QC) systems as required by Good Practice Guidance. NIR 2002, pp. 7f
Norway Norway has not yet implemented a formally written verification or QA/QC procedure plan. The Inventory Agency is further developing the emission model in order to better facilitate QA/QC.
NIR 2001, pp. 10-11
Source: Data from Parties submissions of National Inventory Reports (NIR) to the UNFCCC and UNFCCC review reports. For Parties with NIR submission that are not included, no relevant information was found in the NIR.
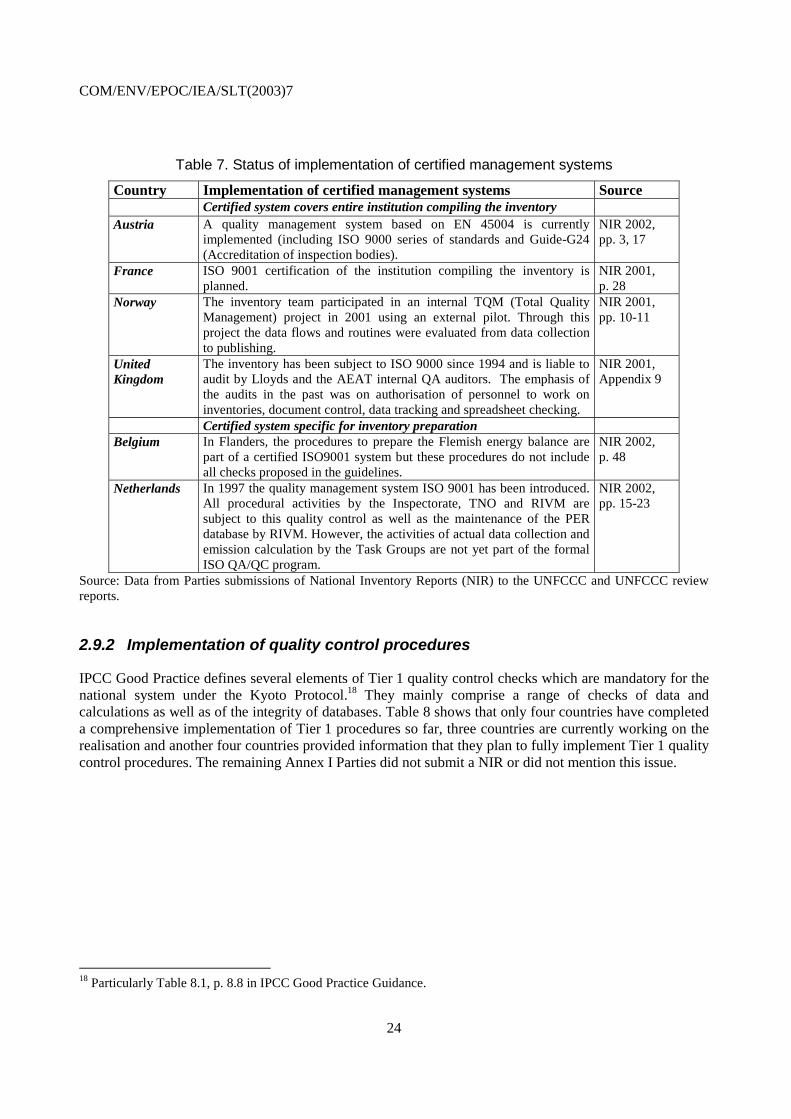
In some cases certified quality management systems have either already been realised or are currently being implemented. Table 7 shows the countries implementing certified systems and describes the scope of certification.
COM/ENV/EPOC/IEA/SLT(2003)7
24
Table 7. Status of implementation of certified management systems
Country Implementation of certified management systems Source Certified system covers entire institution compiling the inventory Austria A quality management system based on EN 45004 is currently
implemented (including ISO 9000 series of standards and Guide-G24 (Accreditation of inspection bodies).
NIR 2002, pp. 3, 17
France ISO 9001 certification of the institution compiling the inventory is planned.
NIR 2001, p. 28
Norway The inventory team participated in an internal TQM (Total Quality Management) project in 2001 using an external pilot. Through this project the data flows and routines were evaluated from data collection to publishing.
NIR 2001, pp. 10-11
United Kingdom
The inventory has been subject to ISO 9000 since 1994 and is liable to audit by Lloyds and the AEAT internal QA auditors. The emphasis of the audits in the past was on authorisation of personnel to work on inventories, document control, data tracking and spreadsheet checking.
NIR 2001, Appendix 9
Certified system specific for inventory preparation Belgium In Flanders, the procedures to prepare the Flemish energy balance are
part of a certified ISO9001 system but these procedures do not include all checks proposed in the guidelines.
NIR 2002, p. 48
Netherlands In 1997 the quality management system ISO 9001 has been introduced. All procedural activities by the Inspectorate, TNO and RIVM are subject to this quality control as well as the maintenance of the PER database by RIVM. However, the activities of actual data collection and emission calculation by the Task Groups are not yet part of the formal ISO QA/QC program.
NIR 2002, pp. 15-23
Source: Data from Parties submissions of National Inventory Reports (NIR) to the UNFCCC and UNFCCC review reports.
2.9.2 Implementation of quality control procedures
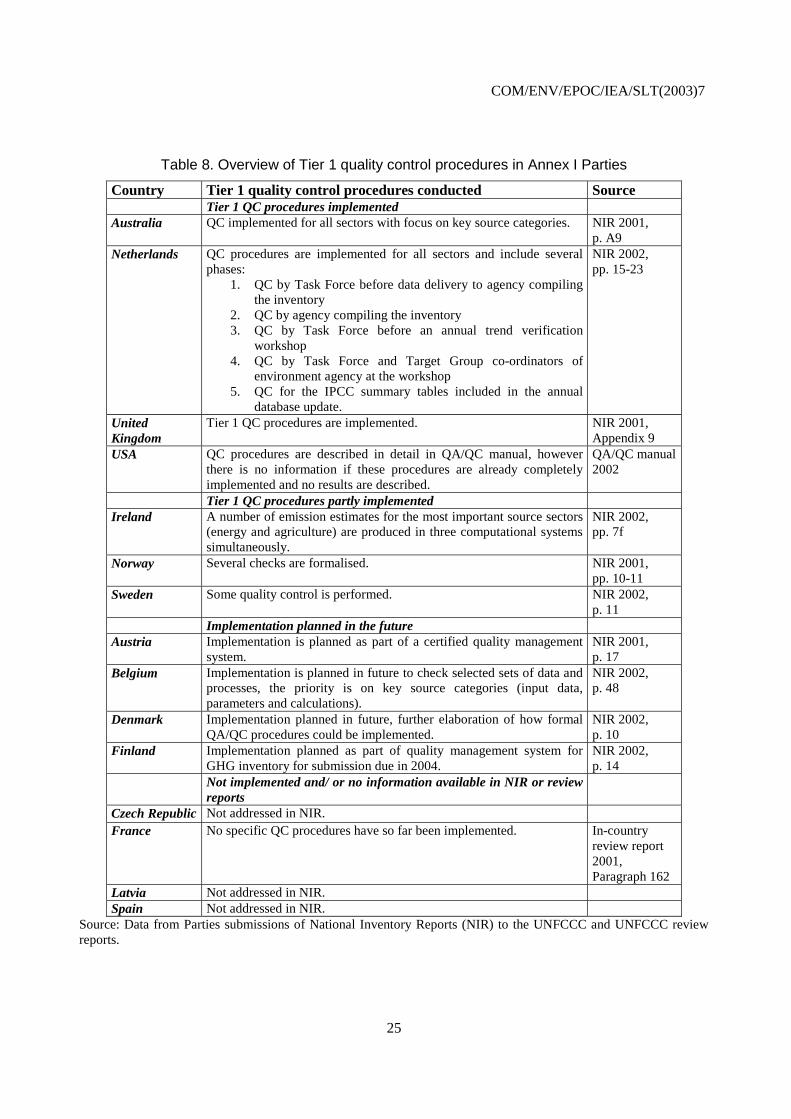
IPCC Good Practice defines several elements of Tier 1 quality control checks which are mandatory for the national system under the Kyoto Protocol.18 They mainly comprise a range of checks of data and calculations as well as of the integrity of databases. Table 8 shows that only four countries have completed a comprehensive implementation of Tier 1 procedures so far, three countries are currently working on the realisation and another four countries provided information that they plan to fully implement Tier 1 quality control procedures. The remaining Annex I Parties did not submit a NIR or did not mention this issue.
18 Particularly Table 8.1, p. 8.8 in IPCC Good Practice Guidance.
COM/ENV/EPOC/IEA/SLT(2003)7
25
Table 8. Overview of Tier 1 quality control procedures in Annex I Parties
Country Tier 1 quality control procedures conducted Source Tier 1 QC procedures implemented Australia QC implemented for all sectors with focus on key source categories. NIR 2001,
p. A9 Netherlands QC procedures are implemented for all sectors and include several
phases: 1. QC by Task Force before data delivery to agency compiling
the inventory 2. QC by agency compiling the inventory 3. QC by Task Force before an annual trend verification
workshop 4. QC by Task Force and Target Group co-ordinators of
environment agency at the workshop 5. QC for the IPCC summary tables included in the annual
database update.
NIR 2002, pp. 15-23
United Kingdom
Tier 1 QC procedures are implemented. NIR 2001, Appendix 9
USA QC procedures are described in detail in QA/QC manual, however there is no information if these procedures are already completely implemented and no results are described.
QA/QC manual 2002
Tier 1 QC procedures partly implemented Ireland A number of emission estimates for the most important source sectors
(energy and agriculture) are produced in three computational systems simultaneously.
NIR 2002, pp. 7f
Norway Several checks are formalised. NIR 2001, pp. 10-11
Sweden Some quality control is performed. NIR 2002, p. 11
Implementation planned in the future Austria Implementation is planned as part of a certified quality management
system. NIR 2001, p. 17
Belgium Implementation is planned in future to check selected sets of data and processes, the priority is on key source categories (input data, parameters and calculations).
NIR 2002, p. 48
Denmark Implementation planned in future, further elaboration of how formal QA/QC procedures could be implemented.
NIR 2002, p. 10
Finland Implementation planned as part of quality management system for GHG inventory for submission due in 2004.
NIR 2002, p. 14
Not implemented and/ or no information available in NIR or review reports
Czech Republic Not addressed in NIR. France No specific QC procedures have so far been implemented. In-country
review report 2001, Paragraph 162
Latvia Not addressed in NIR. Spain Not addressed in NIR.
Source: Data from Parties submissions of National Inventory Reports (NIR) to the UNFCCC and UNFCCC review reports.
COM/ENV/EPOC/IEA/SLT(2003)7
26
Information about source specific QC procedures (Tier 2) is still difficult to obtain, partly because the relating reporting requirements in the NIR have only been established in 2002. Tier 2 procedures vary considerably due to different methods used and have therefore not been included in this analysis.
2.9.3 Implementation of quality assurance procedures
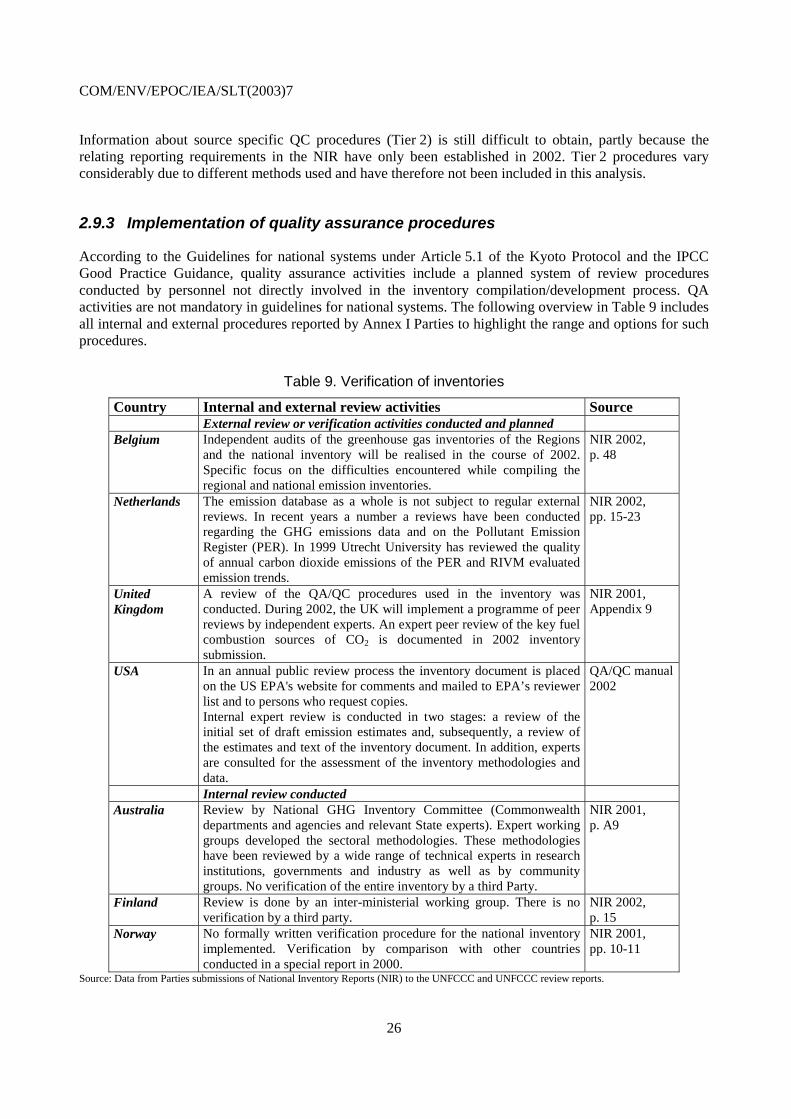
According to the Guidelines for national systems under Article 5.1 of the Kyoto Protocol and the IPCC Good Practice Guidance, quality assurance activities include a planned system of review procedures conducted by personnel not directly involved in the inventory compilation/development process. QA activities are not mandatory in guidelines for national systems. The following overview in Table 9 includes all internal and external procedures reported by Annex I Parties to highlight the range and options for such procedures.
Table 9. Verification of inventories
Country Internal and external review activities Source External review or verification activities conducted and planned Belgium Independent audits of the greenhouse gas inventories of the Regions
and the national inventory will be realised in the course of 2002. Specific focus on the difficulties encountered while compiling the regional and national emission inventories.
NIR 2002, p. 48
Netherlands The emission database as a whole is not subject to regular external reviews. In recent years a number a reviews have been conducted regarding the GHG emissions data and on the Pollutant Emission Register (PER). In 1999 Utrecht University has reviewed the quality of annual carbon dioxide emissions of the PER and RIVM evaluated emission trends.
NIR 2002, pp. 15-23
United Kingdom
A review of the QA/QC procedures used in the inventory was conducted. During 2002, the UK will implement a programme of peer reviews by independent experts. An expert peer review of the key fuel combustion sources of CO2 is documented in 2002 inventory submission.
NIR 2001, Appendix 9
USA In an annual public review process the inventory document is placed on the US EPA's website for comments and mailed to EPA’s reviewer list and to persons who request copies. Internal expert review is conducted in two stages: a review of the initial set of draft emission estimates and, subsequently, a review of the estimates and text of the inventory document. In addition, experts are consulted for the assessment of the inventory methodologies and data.
QA/QC manual 2002
Internal review conducted Australia Review by National GHG Inventory Committee (Commonwealth
departments and agencies and relevant State experts). Expert working groups developed the sectoral methodologies. These methodologies have been reviewed by a wide range of technical experts in research institutions, governments and industry as well as by community groups. No verification of the entire inventory by a third Party.
NIR 2001, p. A9
Finland Review is done by an inter-ministerial working group. There is no verification by a third party.
NIR 2002, p. 15
Norway No formally written verification procedure for the national inventory implemented. Verification by comparison with other countries conducted in a special report in 2000.
NIR 2001, pp. 10-11
Source: Data from Parties submissions of National Inventory Reports (NIR) to the UNFCCC and UNFCCC review reports.
COM/ENV/EPOC/IEA/SLT(2003)7
27
Three countries have decided to conduct processes similar to peer reviews with relevant experts separately for individual sectors. Audits by independent third parties are currently not conducted very often. One reason for this could be that it seems fairly difficult to find a single organisation that is independent on one hand but has still the necessary expertise to fulfil the task on the other. The USA has chosen a simple and cost-effective way of quality assurance: some time before completion of the inventory, the draft report is published on the internet to gather further expert opinion.
2.9.4 Quality assurance of secondary data sources
A special problem in QA/QC systems of inventories is that very often data is collected externally and the inventory agency is only one of the data users. It is Good Practice according to the IPCC to assure that external advisors, research organisations, agencies or other institutions involved in the preparation of the inventory follow - and document - at least Tier 1 QC requirements. When employing data from statistical agencies, these have usually undergone satisfying quality control procedures – but the inventory agency should still get confirmation. It is not necessary though to duplicate QC procedures if the inventory agency is satisfied with the quality control conducted by the external data collector. For some smaller countries where the statistical office is also responsible for the inventory compilation, QA/QC of official statistical sources is not a problem. Table 10 compiles procedures Parties have established to guarantee quality of secondary data sources.
Table 10. Procedures to address the quality of secondary data sources
Country Procedures to assess quality of secondary data sources Source Implemented Procedures Australia Inventory is compiled using data collected in national surveys
conducted according to statistical principles. The two largest national data providers, the Australian Bureau of Statistics and ABARE perform QA/QC procedures on the primary activity data, including both bottom-up and top-down approaches. Where this is supplemented by data from other sources, checks on the accuracy of the information have been conducted as far as practicable and include comparisons with additional data sets where these were available.
NIR 2001, p. A9
Austria The Assessment of QA/QC of data from third Parties will be part of the QA/QC management system under implementation. At the moment data quality from such sources is not yet assessed.
In-country report of 2001 submission, Paragraph 219c
United Kingdom
UK has contacted and invited national statistical agencies to show how their systems comply with IPCC Good Practice Guidance. Other organisations compile significant parts of the inventory. Currently the QA/QC procedures in use at Inventory Agency do not extend to QA/QC procedures used at these data suppliers. For fugitive fuel emissions no specific QA procedures are implemented. Data is being taken from the industry ‘as is’ without formal verification. Difficult sector to verify due to the site-specific nature of the emissions and a lack of comparative data. The expert review team recommends the use of QA/QC procedures to ensure the quality of data provided through voluntary agreements.
NIR 2001, Appendix 9 In-country review report of 2000 submission Paragraphs 65, 79 and 98
USA Procedures to address the quality of secondary data sources can be quite time and resource intensive and should be pursued only for key sources or when there is a clear indication of need. Checks may require reviewing published information about the data, contacting the article authors or agency staff collecting or preparing the data. Types of questions to ask to determine the quality of the data are provided in
QA/QC manual 2002
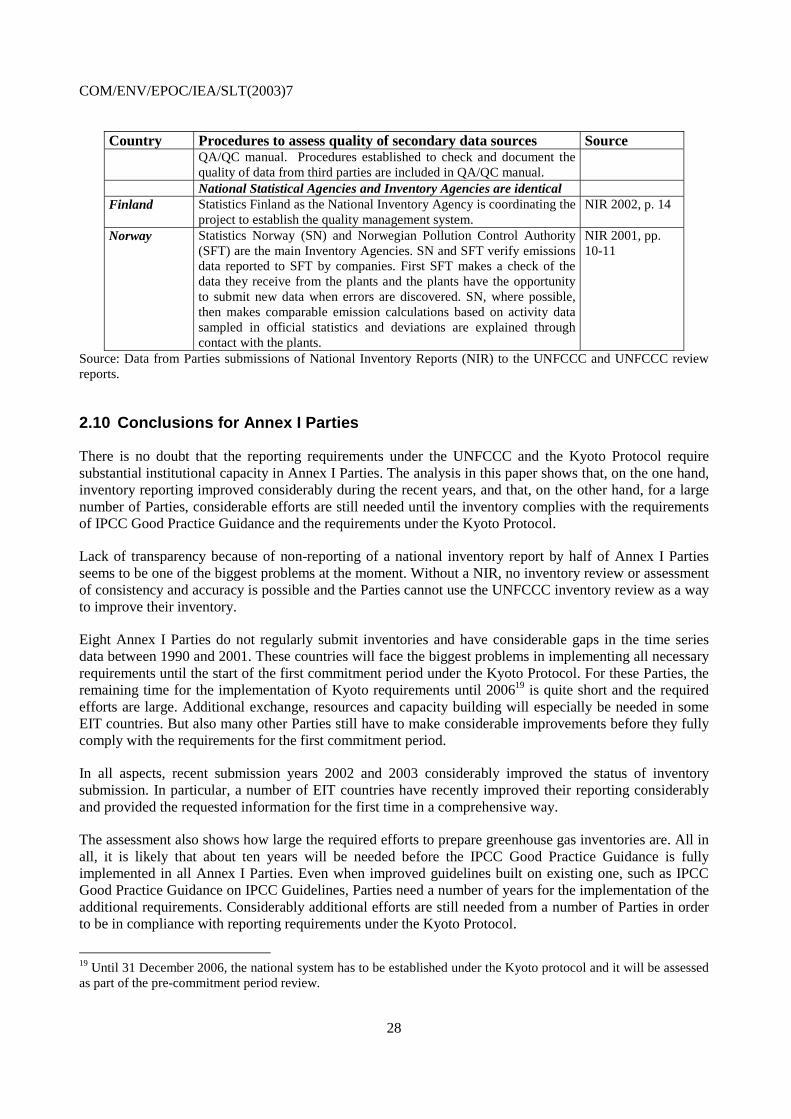
COM/ENV/EPOC/IEA/SLT(2003)7
28
Country Procedures to assess quality of secondary data sources Source QA/QC manual. Procedures established to check and document the quality of data from third parties are included in QA/QC manual.
National Statistical Agencies and Inventory Agencies are identical Finland Statistics Finland as the National Inventory Agency is coordinating the
project to establish the quality management system. NIR 2002, p. 14
Norway Statistics Norway (SN) and Norwegian Pollution Control Authority (SFT) are the main Inventory Agencies. SN and SFT verify emissions data reported to SFT by companies. First SFT makes a check of the data they receive from the plants and the plants have the opportunity to submit new data when errors are discovered. SN, where possible, then makes comparable emission calculations based on activity data sampled in official statistics and deviations are explained through contact with the plants.
NIR 2001, pp. 10-11
Source: Data from Parties submissions of National Inventory Reports (NIR) to the UNFCCC and UNFCCC review reports.
2.10 Conclusions for Annex I Parties
There is no doubt that the reporting requirements under the UNFCCC and the Kyoto Protocol require substantial institutional capacity in Annex I Parties. The analysis in this paper shows that, on the one hand, inventory reporting improved considerably during the recent years, and that, on the other hand, for a large number of Parties, considerable efforts are still needed until the inventory complies with the requirements of IPCC Good Practice Guidance and the requirements under the Kyoto Protocol.
Lack of transparency because of non-reporting of a national inventory report by half of Annex I Parties seems to be one of the biggest problems at the moment. Without a NIR, no inventory review or assessment of consistency and accuracy is possible and the Parties cannot use the UNFCCC inventory review as a way to improve their inventory.
Eight Annex I Parties do not regularly submit inventories and have considerable gaps in the time series data between 1990 and 2001. These countries will face the biggest problems in implementing all necessary requirements until the start of the first commitment period under the Kyoto Protocol. For these Parties, the remaining time for the implementation of Kyoto requirements until 200619 is quite short and the required efforts are large. Additional exchange, resources and capacity building will especially be needed in some EIT countries. But also many other Parties still have to make considerable improvements before they fully comply with the requirements for the first commitment period.
In all aspects, recent submission years 2002 and 2003 considerably improved the status of inventory submission. In particular, a number of EIT countries have recently improved their reporting considerably and provided the requested information for the first time in a comprehensive way.
The assessment also shows how large the required efforts to prepare greenhouse gas inventories are. All in all, it is likely that about ten years will be needed before the IPCC Good Practice Guidance is fully implemented in all Annex I Parties. Even when improved guidelines built on existing one, such as IPCC Good Practice Guidance on IPCC Guidelines, Parties need a number of years for the implementation of the additional requirements. Considerably additional efforts are still needed from a number of Parties in order to be in compliance with reporting requirements under the Kyoto Protocol.
19 Until 31 December 2006, the national system has to be established under the Kyoto protocol and it will be assessed as part of the pre-commitment period review.
COM/ENV/EPOC/IEA/SLT(2003)7
29
The Marrakech Accords provide the possibility to fully establish a national inventory system earlier than required in order to get earlier green light from the review process regarding eligibility to participate in emissions trading. Taking into account the actual status of inventory preparation, it is not very likely that many Annex I Parties will be able to choose this option of an early assessment of their eligibility for emissions trading.
3. Status of national inventory preparation in Non-Annex I Parties
3.1 Legal requirements under the Convention
Under the Convention, all Parties must report on the steps they are taking or envisage undertaking to implement the Convention (Articles 4.1 and 12). In accordance with the principle of "common but differentiated responsibilities", the required contents of these national communications and the timetable for their submission is different for Annex I and Non-Annex I Parties. Each Non-Annex I Party shall submit its initial communication within three years of the entry into force of the Convention for that Party, or of the availability of financial resources (except for the least developed countries, who may do so at their discretion). Under Article 12 of the UNFCCC, Parties not included in Annex I are committed to prepare “a national inventory of anthropogenic emissions by sources and removals by sinks of all greenhouse gases not controlled by the Montreal Protocol, to the extent its capacities permit”, but no commitments for regular inventory submissions were yet agreed.
Guidelines for the preparation of initial national communications from Non-Annex I Parties were adopted at COP 2 in Geneva in 1996. COP 5 established a Consultative Group of Experts on National Communications from Non-Annex I Parties (CGE) in order to improve the preparation of national communications from developing countries. COP 8 adopted the revised guidelines.
3.2 Availability of national communications
The UNFCCC homepage lists 104 submissions of initial national communications from Non-Annex I Parties.20 However, most of the potentially more important Non-Annex I Parties in terms of emissions, such as China, India or Brazil have not yet officially submitted an inventory to the UNFCCC. However, Brazil has prepared an inventory which is publicly available at the website of the Ministry of Science and Technology.21 Mexico is the only Non-Annex I Party at present that has already submitted its second national communication.22 Some other Non-Annex I Parties have also started working on them. 29 Least Developed Countries (LDC) submitted their national communication (from a total of 48 LDCs).
The GEF, as an operating entity of the financial mechanism of the Convention, provides financial assistance to Non-Annex I Parties through its implementing agencies (UNDP, UNEP and the World Bank). Some bilateral agencies, e.g. the US country studies programme, have also provided financial and technical assistance to many Non-Annex I Parties in preparing their national communications. The GEF enabling programme for the preparation of initial national communication usually provided between US$ 100,000 to 450,000 to the countries. Exceptions are Brazil (1.5 million US$), China (3.6 million US$) and India (2
20 By 19 July 2003. 21 http://www.mct.gov.br/clima/Default.htm 22 By July 2003.
COM/ENV/EPOC/IEA/SLT(2003)7
30
million US$) where large amounts where allocated. The Indian project is still under implementation and the project in China was not yet started in August 2002.23
3.3 Problems of national inventory systems
In general, the problems discussed for Annex I Parties in section 2.2 are also valid for Non-Annex I Parties, but are usually more difficult. The following overview provides some more specific problems in the different areas that are already addressed in section 2.2.
3.3.1 Institutional arrangements
National greenhouse gas inventories from Non-Annex I Parties as part of their national communications and their preparation depends on additional funding received from GEF enabling programmes or bilateral funds. Consequently, Non-Annex I Parties established temporary teams on a project basis for the preparation of the inventory during the period when funding was provided. Those teams were frequently dissolved after the performance of the task. The inventory preparation usually did not lead to the establishment of a national inventory system where national authorities have clear responsibilities for the continuous preparation of greenhouse gas inventories. However, there are positive exceptions from this situation where Non-Annex I Parties made efforts to establish more permanent capacities for inventory preparation, such as Brazil or Mexico. Few countries established appropriate information management systems for archiving and updating inventory data which could resolve some of the institutional problems identified by many Non-Annex I Parties.24 This may lead to the situation that inventory teams may need to start from scratch when a new project for inventories for the second national communication will be started.
The preparation of national greenhouse gas inventories is scientifically complex and, usually in developing countries, the number of specialists on this issue is quite limited. In addition, inventory guidelines materials are frequently not available in all languages necessary.25 In most of the reporting sectors, there are not many research activities in developing countries that allow an evaluation of the IPCC default values or the proposed methodology itself. In Non-Annex I Parties there is usually little institutional concern with organizing or providing information and data, particularly at the local level. Especially longer time series and continuous data collection efforts are lacking. There is also a lack of legislation obliging companies to provide information with respect to greenhouse gases. Non-Annex I Parties usually lack of sufficient resources for in-depth studies and data collection exercises to improve their inventory data. Existing linkages between the organizations responsible for the preparation of the national inventories and other national organizations involved in the collection of activity data are weak. This could affect the reliability of emission estimates.26
The exchange of information related to national inventories amongst the countries within a region is presently very weak as only a few national communication teams are sharing information on emission
23 Data as reported in FCCC/SBI/2002/INF.12 24 FCCC/SBI/2002/INF.12 25 1996 IPCC Guidelines for national inventories are available in English, French, Spanish and Russian, IPCC Good Practice Guidance was only recently translated to Spanish, French and Russian. 26 FCCC/SBI/2002/INF.12
COM/ENV/EPOC/IEA/SLT(2003)7
31
factors and activity data. Processes to facilitate such information exchange, including any technical comparative analysis of inventories, are also lacking.27
3.3.2 Activity data and emission factors
In the energy sector, a number of Non-Annex I Parties do not establish energy balances, which is a key obstacle for the estimation of emissions from fuel combustion. The level of disaggregation of national energy balances is not always detailed enough for the purposes of specific methodological approaches of the IPCC Guidelines.28 In recent years, due to privatisation and liberalization, the number of countries without energy balances decreased, e.g. in Panama the preparation of energy balances stopped with the privatisation of the national statistical office. Activity data for energy use is particularly lacking in the informal and households sectors, e.g. for biomass combustion or kerosene use.29
In the LUCF and agricultural sectors, activity data are either lacking or is not accessible in many countries due to the lack of adequate systems for data collection and/or management. It is difficult to obtain activity data in the necessary time-series for estimating more reliable emissions in some source categories of the LUCF sector. It would be possible to obtain data for forest areas or other land use areas via satellite images and aerial photographs. However, frequently resources are lacking for validation of such exercises via field work.
In the industrial processes sector, Parties faced problems in collecting activity data from the private sector. Almost all reporting Parties lack systems for collecting data on HFCs, PFCs and SF6.
30 Although these emissions seem not to be relevant for many Non-Annex I Parties, they might be important for Parties with relatively high level of industrialization.
In all regions, some difficulties exist in obtaining reliable activity data for estimating emissions from the waste sector.
On the other side, access to the internet has offered new possibilities for distribution of data in developing countries, which facilitates the publication of data. For example, Mexico reports in its second national communication that with the development of the internet and the modernization of the public sector, large parts of the information could be gathered on public websites.
Default emission factors and coefficients provided in the IPCC Guidelines for LUCF, agriculture, waste, fugitive methane emissions as well as the non-CO2 emissions from fuel combustion do not reflect sometimes very well the national circumstances of non-Annex I Parties.
3.3.3 UNFCCC findings
There is no review process of national communications from Non-Annex I Parties as for Annex I Parties. Such a review was proposed during the UNFCCC negotiations, but was not accepted by developing countries. COP 5 established a Consultative Group of Experts on National Communications from Non-Annex I Parties (CGE) in order to improve the preparation of national communications from developing
27 FCCC/SBI/2001/INF.12 28 FCCC/SBI/2002/INF.12 29 FCCC/SBI/2002/INF.12 30 FCCC/SBI/2002/INF.12
COM/ENV/EPOC/IEA/SLT(2003)7
32
countries. The CGE assessed general problems in inventory reporting (which are included in the previous section), but did not perform any review of quality of individual inventories from Non-Annex I Parties. During the process of compiling the inventory information of the initial national communications, the UNFCCC secretariat gathered some insights into the quality of the national communications, but this was not the main purpose of the compilation. However, on the basis of this experience, the UNFCCC reported the following problems:31
• Different emission estimates for the same sector or source categories were indicated at different places in the communication;
• Overview tables with inventory data frequently contained errors (units, placement in columns);
• In some cases it was not clear whether certain source categories were not reported because they were not relevant for the country or because they had not been estimated for other reasons. Most Parties did not use the notation keys indicated in the IPCC Guidelines;
• In the land-use change and forestry sector, some inconsistencies were found in the reporting of estimates of biomass during a deforestation process. In addition, there was no clear indication as to the time-frame of the activity data used in some source categories, such as forest and grassland conversion and abandonment of managed lands;
• CH4 and N2O emissions from biomass burning for the production of energy were not reported by most Parties. These emissions may be substantial for some countries.
A more thorough review is missing so far which makes it difficult to provide a general assessment of inventory quality. A review process would also assist the quality improvement process for the second national communications from Non-Annex I Parties, but currently the countries do not get any specific feedback to the work performed on inventories within the national communication.
For this paper two different approaches were chosen to provide at least limited insight into quality of Non-Annex I inventories:
First, a larger number of national communications from Non-Annex I Parties (about 40) was assessed in order to get same basic understanding of the completeness and some indicators for accuracy and quality of the inventory information provided.
Secondly, inventory data for some selected countries was compared with estimates from international data sources, especially data from the International Energy Agency (IEA) and the Food and Agriculture Organization (FAO).
Thirdly, one sector – the emissions and removals from land use change and forestry – was analysed more thoroughly for a limited number of Non-Annex I Parties.
3.4 General assessment of Non-Annex I national communications
For this paper, a general assessment of 41 national communications from Non-Annex I Parties was conducted (see Annex 2). The selection of Non-Annex I Parties was mainly based on the level of absolute emissions and excluded most of the small island states and least developed countries.32
31 Information compiled from FCCC/SBI/2002/8, FCCC/WEB/2002/9, FCCC/SBI/2001/14, FCCC/SBI/2002/16 32 Except for some countries for which the author already had performed such analysis for other purposes.
COM/ENV/EPOC/IEA/SLT(2003)7
33
3.4.1 Consistency
27 from 41 Parties only reported inventories for one year (mainly 1994). Only seven Parties33 estimated emissions for more than three years (usually for a short time series, e.g. 1990 to 1994 in Brazil). The fact that several years were calculated for one report indicates that there are continuous data collection systems in place on which the estimation could be based on. Taking into account the small number of Non-Annex I Parties that report more than one inventory year, consistency over time has not even been started to be implemented for many Parties as no time series were estimated so far. Taking into account the long time periods between the preparation of subsequent national communications in Non-Annex I Parties, it is not very likely that consistency over time can be achieved in the future.
3.4.2 Completeness
With regard to completeness, most Non-Annex I Parties covered all required sectors in their inventories. However, there are frequent gaps within the source categories. For instance, forest fires, fugitive emissions from oil and gas or N2O from manure management are source categories that are not estimated by a number of Parties. In the present situation, the degree of completeness of reporting within a source category frequently cannot be assessed. Often inventories of Non-Annex I Parties do not include all industrial sub-categories. However, assessment of completeness in the industrial sector is difficult as some of the industrial activities requested may not exist in the reporting Parties. For LUCF data, this also means that evidence is lacking to show that reported sources are really sources or that reported sinks are really sinks. As notation key were not widely used, it remains unclear if certain source categories do not occur or if they were not estimated. UNFCCC reporting guidelines for Non-Annex I Parties only encouraged to report HFCs and SF6 and did not mention PFCs. From the 41 Parties analysed, four reported at least part of the fluorinated gases, which indicates a rather advanced level of inventory preparation.34
3.4.3 Comparability
Comparability of the inventory section of the national communications across Non-Annex I Parties is low. Frequently, non-IPCC source categories are reported without clear definitions of the coverage of those categories. The first version of UNFCCC guidelines for national communications from Non-Annex I Parties contained some differences to inventories from Annex I Parties, e.g. a summary table different from the IPCC summary table. However, a large number of Parties used IPCC guidelines and did not consider these special changes of reporting instructions. Some countries do not provide any data tables in the inventory sections of their national communication, other provide large data Annexes or complete IPCC worksheets containing all estimation steps used. The lack of comparability is certainly a weakness of the UNFCCC guidelines for Non-Annex I national communications. With the revision of those guidelines adopted at COP 8, this situation did not improve as the revised document includes many voluntary provisions and lacks clear guidance that would be necessary for comparable results.
3.4.4 Transparency
As for Annex I Parties, the lack of transparency is one of the major problems of the inventories provided. Few Parties provide information on the methodologies and data used. 44% of the Parties analysed (18
33 Argentina, Brazil, Georgia, Ghana, Indonesia, Jordan, Mexico. 34 Argentina: HFC, SF6, Costa Rica: HFCs, Honduras: HFCs and PFCs, Sri Lanka: SF6.
COM/ENV/EPOC/IEA/SLT(2003)7
34
Parties) do not provide any information on the estimation methods used. 34% provided description of methodologies, the rest gave at least very general or partly information on methods used. 44% of Non-Annex I Parties did provide the data sources used, the same number of Parties did not provide any data sources. From the 41 Parties analysed, two included IPCC worksheets with the detailed estimation steps. Few countries described whether Tier 1 methods and default emission factors were used or whether and how IPCC methodology was adapted to national circumstances. Methodological information would be extremely helpful with the aim of improving IPCC reporting guidelines for Non-Annex I Parties as well as for the exchange of information across Non-Annex I Parties. Documentation of methodologies and data used would also be essential for any future inventory compilation process that would be undertaken in these Parties. As such documentation rarely exists, many inventory projects will have to start from scratch in the future, as it does not seem likely that background information that is not included in the national communications is kept available for many years. Any future funding process should aim to enhance transparency and documentation of methods and data used for the inventory preparation. Brazil has adopted a very transparent system where – beyond the detailed methodological descriptions in the sectoral inventory reports - data sources and contact persons that contributed to the inventory are listed on the website of the Ministry for Science and Technology with a active links where data sources can be directly accessed if they are available in the Internet.
3.4.5 Accuracy
23 from 41 Parties (56%) provided a comparison of the sectoral approach with the reference approach for CO2 emissions from fuel combustion. The comparison of the top down with the bottom-up methods gives some indication of the quality of estimation in the energy sector. The usefulness of applying both approaches would be enhanced if the identified differences were explained by Parties, although this was not explicitly required by the UNFCCC Guidelines. For most Parties, the difference between the results obtained with the two approaches was of similar magnitude to the differences reported by Annex I Parties.
20 from 41 Parties (48%) discuss at least at a very general level the data quality and provide some information on uncertainties. A quantitative assessment of uncertainties was provided by four Parties.35 The quantification of uncertainties did not seem feasible for some Parties due to the quality of available information and the almost exclusive use of emission factors by default. The quantification would require an assessment of the level of uncertainty of emission factors from different sources as well as of the data from the socio-economic activities included in the inventory, but this information is not available. Indonesia provided a sensitivity analysis in some cases where high quality data was not available which also provides insights on the possible effects on the total emission and removals estimates.
Generally, Non-Annex I Parties used IPCC default methods, this means the method with lowest accuracy, but several Parties developed their own methodologies and emission factors for specific sectors (e.g. Chile, Costa Rica, Brazil, Mexico, Thailand, Israel, Jordan, Korea, Namibia, Philippines, Senegal or Zimbabwe).
Some Parties expressed the need for a thorough review process of their national communication in order to get advice in which areas further improvements could occur, e.g. El Salvador states:
“The national inventory should be subjected to a thorough technical review in the near future. This review should be participative, open and transparent and carried out by a team of accredited experts in order to:
35 Brazil, Bolivia, Colombia, and Nicaragua.
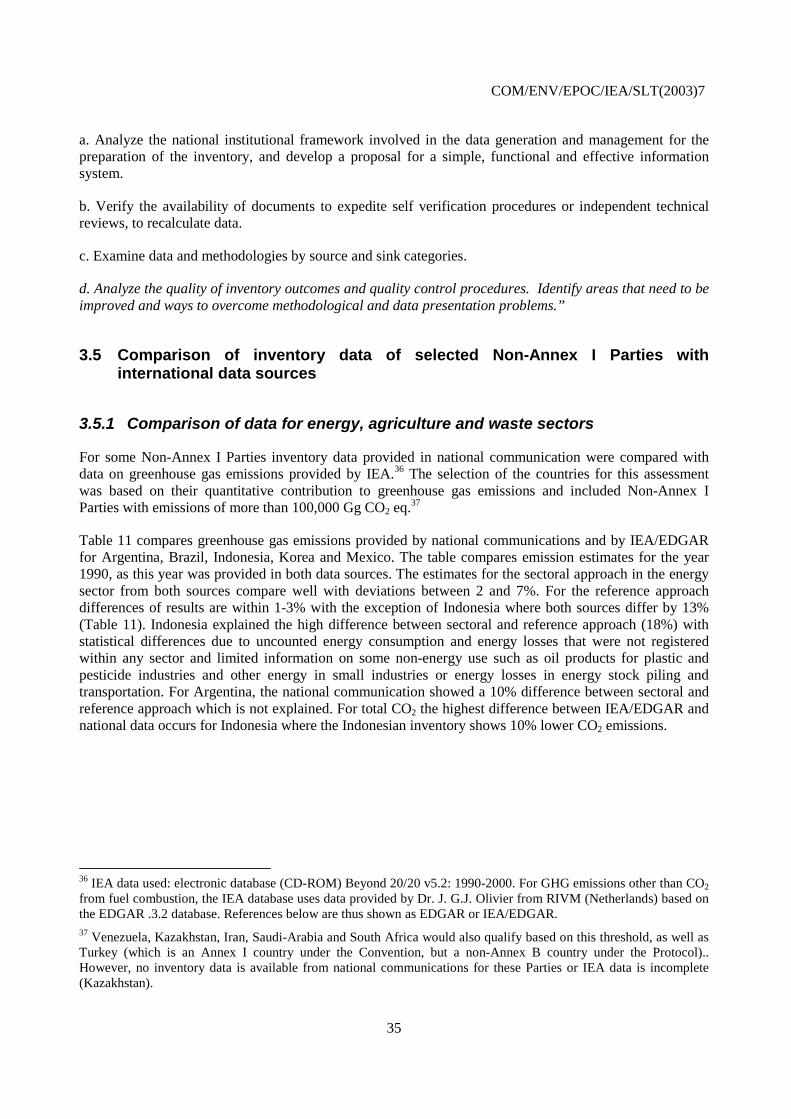
COM/ENV/EPOC/IEA/SLT(2003)7
35
a. Analyze the national institutional framework involved in the data generation and management for the preparation of the inventory, and develop a proposal for a simple, functional and effective information system.
b. Verify the availability of documents to expedite self verification procedures or independent technical reviews, to recalculate data.
c. Examine data and methodologies by source and sink categories.
d. Analyze the quality of inventory outcomes and quality control procedures. Identify areas that need to be improved and ways to overcome methodological and data presentation problems.”
3.5 Comparison of inventory data of selected Non-Annex I Parties with international data sources
3.5.1 Comparison of data for energy, agriculture and waste sectors
For some Non-Annex I Parties inventory data provided in national communication were compared with data on greenhouse gas emissions provided by IEA.36 The selection of the countries for this assessment was based on their quantitative contribution to greenhouse gas emissions and included Non-Annex I Parties with emissions of more than 100,000 Gg CO2 eq.37
Table 11 compares greenhouse gas emissions provided by national communications and by IEA/EDGAR for Argentina, Brazil, Indonesia, Korea and Mexico. The table compares emission estimates for the year 1990, as this year was provided in both data sources. The estimates for the sectoral approach in the energy sector from both sources compare well with deviations between 2 and 7%. For the reference approach differences of results are within 1-3% with the exception of Indonesia where both sources differ by 13% (Table 11). Indonesia explained the high difference between sectoral and reference approach (18%) with statistical differences due to uncounted energy consumption and energy losses that were not registered within any sector and limited information on some non-energy use such as oil products for plastic and pesticide industries and other energy in small industries or energy losses in energy stock piling and transportation. For Argentina, the national communication showed a 10% difference between sectoral and reference approach which is not explained. For total CO2 the highest difference between IEA/EDGAR and national data occurs for Indonesia where the Indonesian inventory shows 10% lower CO2 emissions.
36 IEA data used: electronic database (CD-ROM) Beyond 20/20 v5.2: 1990-2000. For GHG emissions other than CO2 from fuel combustion, the IEA database uses data provided by Dr. J. G.J. Olivier from RIVM (Netherlands) based on the EDGAR .3.2 database. References below are thus shown as EDGAR or IEA/EDGAR. 37 Venezuela, Kazakhstan, Iran, Saudi-Arabia and South Africa would also qualify based on this threshold, as well as Turkey (which is an Annex I country under the Convention, but a non-Annex B country under the Protocol).. However, no inventory data is available from national communications for these Parties or IEA data is incomplete (Kazakhstan).
COM/ENV/EPOC/IEA/SLT(2003)7
36
Table 11. Comparison of greenhouse gas emissions provided by national communications and by IEA/EDGAR for 1990
IEA NC IEA NC IEA NC IEA NC IEA NCCO2
Reference approach 104,240 100,944 201,010 202,910 138,460 156,493 236,750 NA 308,620 311,800Fuel Comb. sectoral 97,770 90,848 193,160 197,972 134,630 128,398 226,170 238,990 301,670 297,011Fugitive emissions 5,260 4,638 2,250 1,654 7,740 NE 2,560 NEInd. Proc.: Cement prod. 1,800 1,790 12,900 10,224 11,550 IE 16,920 14,841 12,320 11,621Total 104,830 97,276 208,310 208,196 142,370 128,398 243,090 238,990 316,550 308,632
CH4
Energy 7,300 10,038 9,260 6,972 63,800 39,644 6,930 5,544 22,870 22,710Agriculture 62,970 57,643 204,820 199,699 78,310 58,662 10,370 12,579 43,630 37,659Waste 10,230 8,318 44,770 15,469 27,290 6,027 9,540 10,395 27,540 11,046Total 80,500 75,999 258,850 222,140 180,250 104,332 26,840 28,518 94,040 71,416
N2OEnergy 200 1,383 2,000 2,449 3,630 1,575 760 3,410 1,250 1,228Agriculture 62,910 52,430 188,010 139,676 43,440 16,439 7,770 310 66,000 1,803Total 63,110 53,813 190,010 142,125 47,070 18,014 8,530 3,720 67,250 3,031
Total all gases 248,440 227,088 657,170 572,461 369,690 250,745 278,460 271,228 477,840 383,079
MexicoIndonesia KoreaArgentina Brazil
Gg CO 2 eq.
Gg CO 2 eq.
Gg CO 2 eq.
Gg CO 2 eq.
Gg CO 2 eq.
Gg CO 2 eq.
Gg CO 2 eq.
Gg CO 2 eq.
Gg CO 2 eq.
Gg CO 2 eq.
Gg CO 2 eq.
Gg CO 2 eq.
Gg CO 2 eq.
Gg CO 2 eq.
Gg CO 2 eq.
Notes: a) Brazil did not yet submit a national communication. Data are compiled from the background reports of the first
Brazilian inventory of anthropogenic greenhouse gas emissions available at http://www.mct.gov.br/clima/ingles/comunic_old/inventar.htm
b) CH4 from agriculture in EDGAR data comprises animals, animal waste, rice production, agricultural waste burning (non-energy, on-site) and savannah burning
c) CH4 from waste in EDGAR data comprises solid waste disposal and wastewater d) N2O from agriculture in EDGAR data comprises fertiliser use, animal waste management, agricultural waste
burning (non-energy, on-site) and savannah burning Sources: national communications from Non-Annex I Parties and IEA electronic database (CD-ROM) Beyond 20/20 v5.2: 1990-2000
For CH4 emissions results from the two sources are less comparable. CH4 emissions from the energy sector show considerable differences in Argentina, Brazil and Indonesia. In agriculture largest differences between the two sources occur for Indonesia and Korea (Indonesia NC 25% lower than in the EDGAR data as published by IEA, Korea NC 21% higher than in the EDGAR data). Especially for waste there are considerable differences between CH4 emission estimates from the two sources. For Brazil this difference (NC 65% lower than EDGAR) can be explained by the use of Tier 1 method by EDGAR and the use of a higher Tier kinetic approach for the estimation of CH4 from solid waste disposal in the Brazilian inventory. For waste disposal Tier 1 and Tier 2 are systematically different as Tier 1 assumes immediate release of CH4 emissions for all waste disposed in a year whereas the kinetic approach estimates actual CH4 release in each year. For Indonesia the CH4 estimate for waste is 78% lower than EDGAR data. However, different numbers are included in the Indonesian inventory in different sections and no further information is available on the methods used in the waste sector to check this deviation. The Mexican estimate in the national communication is also considerably lower (60%) than the EDGAR data. In the 2nd national communication, emissions for 1992 are provided as 45,257 Gg CO2eq., four times higher than the estimate for 1990. Mexico explained that methodological changes occurred after 1990 which could not be implemented for 1990 because of data gaps. It is also explained that the number of sites with managed waste disposal and managed wastewater treatment increased considerably after 1990 due to legislation. For these parts of emissions no data was available previously. The CGE stated in a report that the specific circumstances of waste disposal in many developing countries (burning and/or the use of open dumps) are
COM/ENV/EPOC/IEA/SLT(2003)7
37
not well reflected in methods for estimating waste emissions.38 This could also be one of the reasons for the high discrepancies in the waste sector. Regarding total CH4 emissions, the differences are less pronounced, except for Indonesia where total CH4 emissions is 42% lower in the NC than in EDGAR data.
As the estimation of N2O emissions is generally connected to high uncertainties, especially in the agriculture sector, it can be expected that EDGAR data will not always be close to data reported in national communications. For N2O from energy for Argentina and Korea, data from national communications are considerably higher than EDGAR figures. However, the quantitative contribution of this sector to total emissions is not very high. In the agriculture sector the differences are very high for Korea and Mexico, where data from national communication only represent 4% (Korea) and 3% (Mexico) of those provided by EDGAR. For Mexico, N2O emissions from agriculture for later years are higher in the 2nd national communication and it is explained that methodological changes happened, however it remains unclear what exactly was changed in the emission methodology. For Korea, the major difference may arise from the effect that Korea did not estimate N2O emissions from manure management in its national communication.
Comparing total greenhouse gas estimates for the sources included in the comparison, the data from national communication and IEA/EDGAR are quite close for Korea (national communication 3% lower than IEA/EDGAR data), Argentina (national communication 9% lower than IEA/EDGAR data). For Brazil the total estimates in the national inventory across the sectors described above is 13% lower than the IEA/EDGAR estimates, for Mexico 20% and for Indonesia 32%.
Data comparison between national communications and IEA/EDGAR data was also performed for Malaysia (Table 12). However, data for Malaysia is only provided for 1994 in the national communication whereas IEA/EDGAR data at sectoral level is available for 1990 and 1995 (although data for CO2 from fuel combustion is available for the entire time series). Therefore Table 12 compares 1994 and 1995 data which is only comparable at a very rough level. As for the other countries, CO2 emissions in the energy sector compare reasonably well. For CH4 there is again a considerable difference for emissions from waste and emissions of N2O are generally considerably lower in the national communication than in the EDGAR database.
38 FCCC/SBI/2002/INF.12
COM/ENV/EPOC/IEA/SLT(2003)7
38
Table 12. Comparison of greenhouse gas emissions provided in national communications and by IEA/EDGAR for Malaysia
Notes: a) CH4 from agriculture in IEA/EDGAR data comprises animals, animal waste, rice production, agricultural waste
burning (non-energy, on-site) and savannah burning b) CH4 from waste in IEA/EDGAR data comprises solid waste disposal and wastewater c) N2O from agriculture in IEA/EDGAR data comprises fertiliser use, animal waste management, agricultural waste
burning (non-energy, on-site) and savannah burning Sources: national communications and IEA electronic database (CD-ROM) Beyond 20/20 v5.2: 1990-2000
3.5.2 Analysis of LUCF sector
The IEA data for greenhouse gas emissions from Non-Annex I Parties do not include data on land-use, land-use change and forestry (LUCF). Therefore a separate assessment of the quality of data from 33 national communications in this sector was performed for a number of national communications from Non-Annex I Parties.
The CGE identified that most of the problems for Non-Annex I Parties in the use of the IPCC 1996 Revised Guidelines were related to the land-use change and forestry sector (LUCF).39 In most inventories from Non-Annex I Parties, data on LUCF source categories are provided at a very aggregated level. Several Non-Annex I Parties only reported a net figure for the LUCF source category without disaggregating this figure to LUCF removals and emissions. This limited amount of information provided does not improve exchange of information between developing countries, and reduces considerably the possibilities of any further analysis of problems.
Almost all Non-Annex I Parties included in the analysis for this paper reported problems related to the availability of activity data to perform the estimation for the LUCF source categories according to IPCC guidelines. Table 13 summarizes the problems reported in the national communications.
39 FCCC/SBI/2001/INF.12
1995 1994 1994 IEA IEA NC
CO 2 Fuel Combustion 75,550 68,850 84,415 Indust. Processes: Cement production 5,350 4,973 Fugitive Total 80,900 89,388
CH 4 Energy 11,330 13,335 Agricult. 5,050 6,909 Waste 3,030 26,925 Total 19,410 47,169
N 2 O Energy 1,100 102 Agriculture 5,300 16 Total 6,400 118
Gg CO 2 eq.
Gg CO 2 eq.
Gg CO 2 eq.
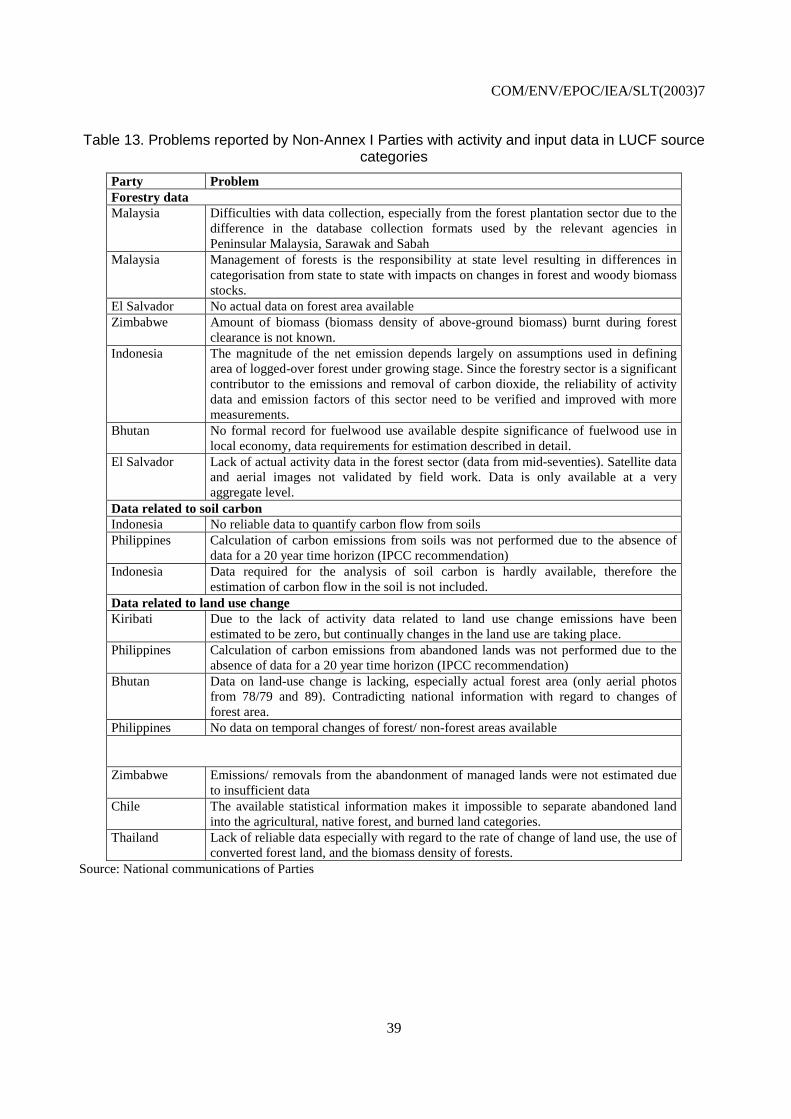
COM/ENV/EPOC/IEA/SLT(2003)7
39
Table 13. Problems reported by Non-Annex I Parties with activity and input data in LUCF source categories
Party Problem Forestry data Malaysia Difficulties with data collection, especially from the forest plantation sector due to the
difference in the database collection formats used by the relevant agencies in Peninsular Malaysia, Sarawak and Sabah
Malaysia Management of forests is the responsibility at state level resulting in differences in categorisation from state to state with impacts on changes in forest and woody biomass stocks.
El Salvador No actual data on forest area available Zimbabwe Amount of biomass (biomass density of above-ground biomass) burnt during forest
clearance is not known. Indonesia The magnitude of the net emission depends largely on assumptions used in defining
area of logged-over forest under growing stage. Since the forestry sector is a significant contributor to the emissions and removal of carbon dioxide, the reliability of activity data and emission factors of this sector need to be verified and improved with more measurements.
Bhutan No formal record for fuelwood use available despite significance of fuelwood use in local economy, data requirements for estimation described in detail.
El Salvador Lack of actual activity data in the forest sector (data from mid-seventies). Satellite data and aerial images not validated by field work. Data is only available at a very aggregate level.
Data related to soil carbon Indonesia No reliable data to quantify carbon flow from soils Philippines Calculation of carbon emissions from soils was not performed due to the absence of
data for a 20 year time horizon (IPCC recommendation) Indonesia Data required for the analysis of soil carbon is hardly available, therefore the
estimation of carbon flow in the soil is not included. Data related to land use change Kiribati Due to the lack of activity data related to land use change emissions have been
estimated to be zero, but continually changes in the land use are taking place. Philippines Calculation of carbon emissions from abandoned lands was not performed due to the
absence of data for a 20 year time horizon (IPCC recommendation) Bhutan Data on land-use change is lacking, especially actual forest area (only aerial photos
from 78/79 and 89). Contradicting national information with regard to changes of forest area.
Philippines No data on temporal changes of forest/ non-forest areas available Zimbabwe Emissions/ removals from the abandonment of managed lands were not estimated due
to insufficient data Chile The available statistical information makes it impossible to separate abandoned land
into the agricultural, native forest, and burned land categories. Thailand Lack of reliable data especially with regard to the rate of change of land use, the use of
converted forest land, and the biomass density of forests. Source: National communications of Parties
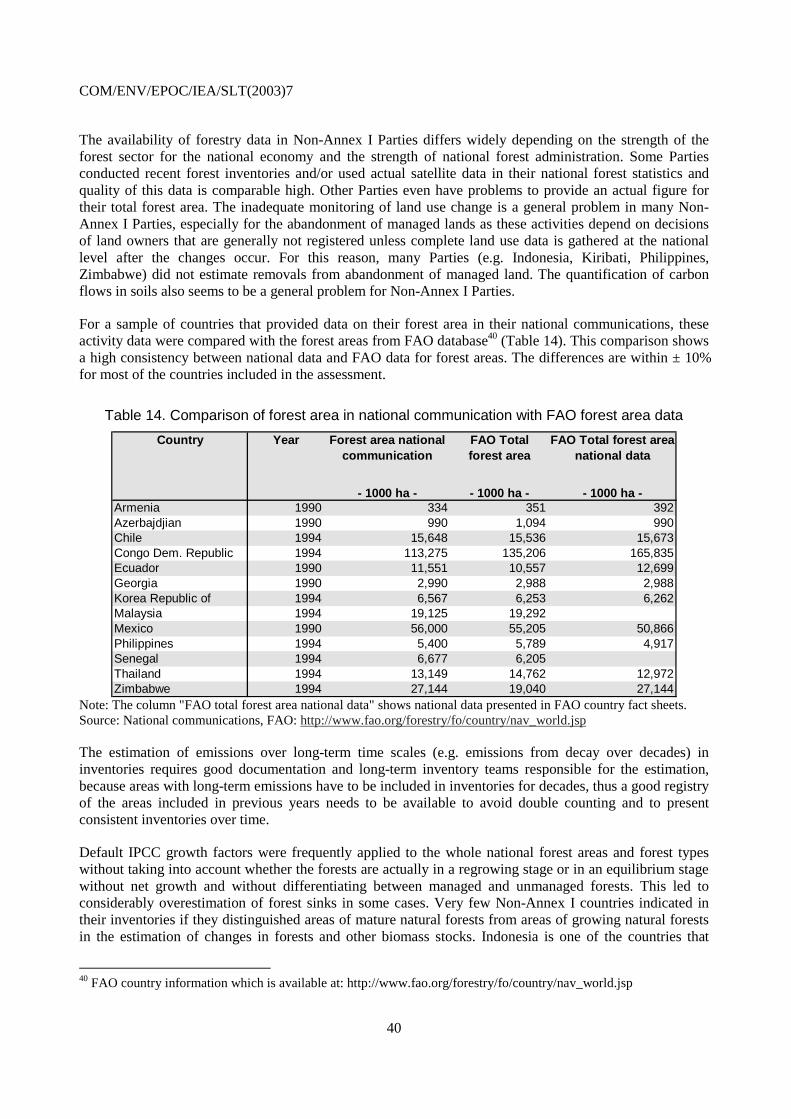
COM/ENV/EPOC/IEA/SLT(2003)7
40
The availability of forestry data in Non-Annex I Parties differs widely depending on the strength of the forest sector for the national economy and the strength of national forest administration. Some Parties conducted recent forest inventories and/or used actual satellite data in their national forest statistics and quality of this data is comparable high. Other Parties even have problems to provide an actual figure for their total forest area. The inadequate monitoring of land use change is a general problem in many Non-Annex I Parties, especially for the abandonment of managed lands as these activities depend on decisions of land owners that are generally not registered unless complete land use data is gathered at the national level after the changes occur. For this reason, many Parties (e.g. Indonesia, Kiribati, Philippines, Zimbabwe) did not estimate removals from abandonment of managed land. The quantification of carbon flows in soils also seems to be a general problem for Non-Annex I Parties.
For a sample of countries that provided data on their forest area in their national communications, these activity data were compared with the forest areas from FAO database40 (Table 14). This comparison shows a high consistency between national data and FAO data for forest areas. The differences are within ± 10% for most of the countries included in the assessment.
Table 14. Comparison of forest area in national communication with FAO forest area data
Country Year Forest area national communication
FAO Total forest area
FAO Total forest area national data
- 1000 ha - - 1000 ha - - 1000 ha -Armenia 1990 334 351 392Azerbajdjian 1990 990 1,094 990Chile 1994 15,648 15,536 15,673Congo Dem. Republic 1994 113,275 135,206 165,835Ecuador 1990 11,551 10,557 12,699Georgia 1990 2,990 2,988 2,988Korea Republic of 1994 6,567 6,253 6,262Malaysia 1994 19,125 19,292Mexico 1990 56,000 55,205 50,866Philippines 1994 5,400 5,789 4,917Senegal 1994 6,677 6,205Thailand 1994 13,149 14,762 12,972Zimbabwe 1994 27,144 19,040 27,144
Note: The column "FAO total forest area national data" shows national data presented in FAO country fact sheets. Source: National communications, FAO: http://www.fao.org/forestry/fo/country/nav_world.jsp
The estimation of emissions over long-term time scales (e.g. emissions from decay over decades) in inventories requires good documentation and long-term inventory teams responsible for the estimation, because areas with long-term emissions have to be included in inventories for decades, thus a good registry of the areas included in previous years needs to be available to avoid double counting and to present consistent inventories over time.
Default IPCC growth factors were frequently applied to the whole national forest areas and forest types without taking into account whether the forests are actually in a regrowing stage or in an equilibrium stage without net growth and without differentiating between managed and unmanaged forests. This led to considerably overestimation of forest sinks in some cases. Very few Non-Annex I countries indicated in their inventories if they distinguished areas of mature natural forests from areas of growing natural forests in the estimation of changes in forests and other biomass stocks. Indonesia is one of the countries that
40 FAO country information which is available at: http://www.fao.org/forestry/fo/country/nav_world.jsp
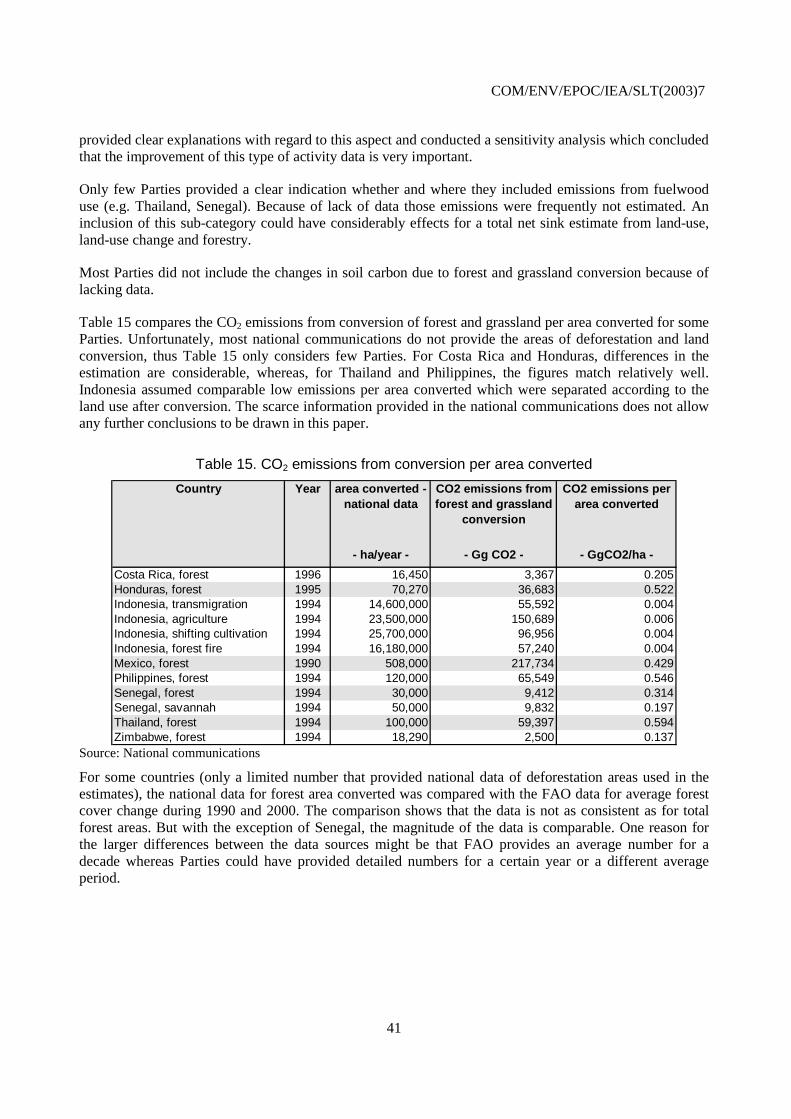
COM/ENV/EPOC/IEA/SLT(2003)7
41
provided clear explanations with regard to this aspect and conducted a sensitivity analysis which concluded that the improvement of this type of activity data is very important.
Only few Parties provided a clear indication whether and where they included emissions from fuelwood use (e.g. Thailand, Senegal). Because of lack of data those emissions were frequently not estimated. An inclusion of this sub-category could have considerably effects for a total net sink estimate from land-use, land-use change and forestry.
Most Parties did not include the changes in soil carbon due to forest and grassland conversion because of lacking data.
Table 15 compares the CO2 emissions from conversion of forest and grassland per area converted for some Parties. Unfortunately, most national communications do not provide the areas of deforestation and land conversion, thus Table 15 only considers few Parties. For Costa Rica and Honduras, differences in the estimation are considerable, whereas, for Thailand and Philippines, the figures match relatively well. Indonesia assumed comparable low emissions per area converted which were separated according to the land use after conversion. The scarce information provided in the national communications does not allow any further conclusions to be drawn in this paper.
Table 15. CO2 emissions from conversion per area converted
Country Year area converted - national data
CO2 emissions from forest and grassland
conversion
CO2 emissions per area converted
- ha/year - - Gg CO2 - - GgCO2/ha -
Costa Rica, forest 1996 16,450 3,367 0.205Honduras, forest 1995 70,270 36,683 0.522Indonesia, transmigration 1994 14,600,000 55,592 0.004Indonesia, agriculture 1994 23,500,000 150,689 0.006Indonesia, shifting cultivation 1994 25,700,000 96,956 0.004Indonesia, forest fire 1994 16,180,000 57,240 0.004Mexico, forest 1990 508,000 217,734 0.429Philippines, forest 1994 120,000 65,549 0.546Senegal, forest 1994 30,000 9,412 0.314Senegal, savannah 1994 50,000 9,832 0.197Thailand, forest 1994 100,000 59,397 0.594Zimbabwe, forest 1994 18,290 2,500 0.137
Source: National communications
For some countries (only a limited number that provided national data of deforestation areas used in the estimates), the national data for forest area converted was compared with the FAO data for average forest cover change during 1990 and 2000. The comparison shows that the data is not as consistent as for total forest areas. But with the exception of Senegal, the magnitude of the data is comparable. One reason for the larger differences between the data sources might be that FAO provides an average number for a decade whereas Parties could have provided detailed numbers for a certain year or a different average period.
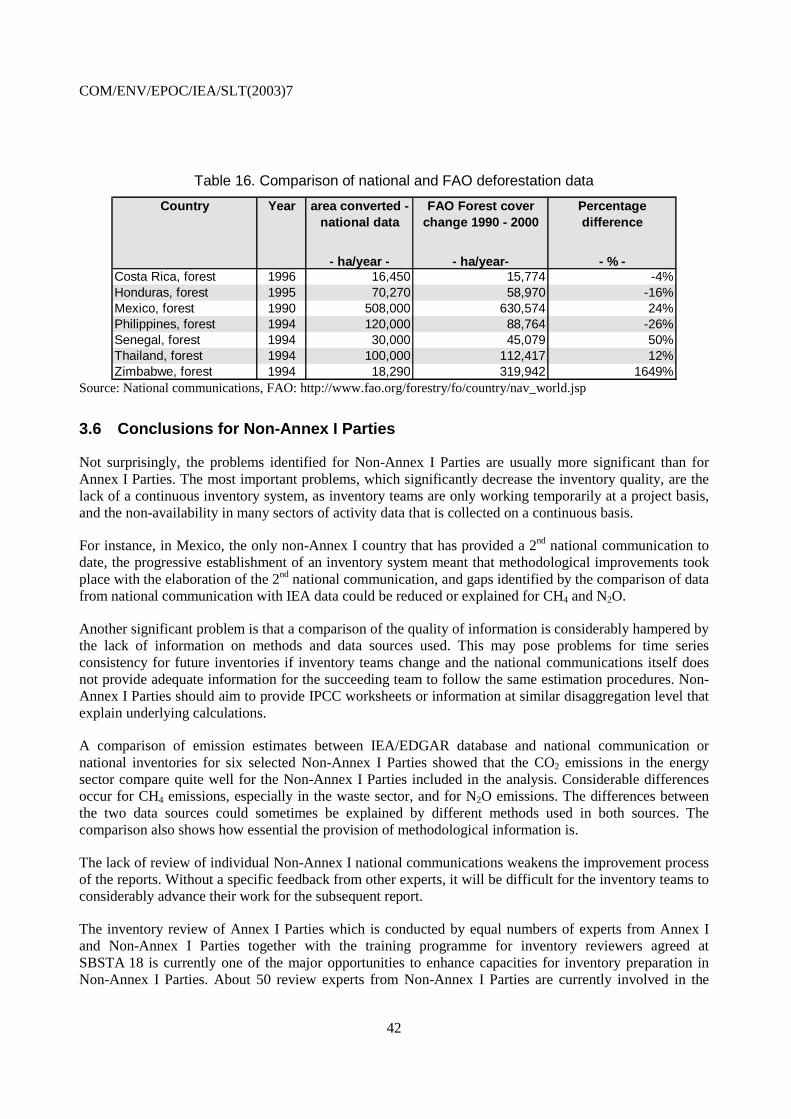
COM/ENV/EPOC/IEA/SLT(2003)7
42
Table 16. Comparison of national and FAO deforestation data
Country Year area converted - national data
FAO Forest cover change 1990 - 2000
Percentage difference
- ha/year - - ha/year- - % -Costa Rica, forest 1996 16,450 15,774 -4%Honduras, forest 1995 70,270 58,970 -16%Mexico, forest 1990 508,000 630,574 24%Philippines, forest 1994 120,000 88,764 -26%Senegal, forest 1994 30,000 45,079 50%Thailand, forest 1994 100,000 112,417 12%Zimbabwe, forest 1994 18,290 319,942 1649%
Source: National communications, FAO: http://www.fao.org/forestry/fo/country/nav_world.jsp
3.6 Conclusions for Non-Annex I Parties
Not surprisingly, the problems identified for Non-Annex I Parties are usually more significant than for Annex I Parties. The most important problems, which significantly decrease the inventory quality, are the lack of a continuous inventory system, as inventory teams are only working temporarily at a project basis, and the non-availability in many sectors of activity data that is collected on a continuous basis.
For instance, in Mexico, the only non-Annex I country that has provided a 2nd national communication to date, the progressive establishment of an inventory system meant that methodological improvements took place with the elaboration of the 2nd national communication, and gaps identified by the comparison of data from national communication with IEA data could be reduced or explained for CH4 and N2O.
Another significant problem is that a comparison of the quality of information is considerably hampered by the lack of information on methods and data sources used. This may pose problems for time series consistency for future inventories if inventory teams change and the national communications itself does not provide adequate information for the succeeding team to follow the same estimation procedures. Non-Annex I Parties should aim to provide IPCC worksheets or information at similar disaggregation level that explain underlying calculations.
A comparison of emission estimates between IEA/EDGAR database and national communication or national inventories for six selected Non-Annex I Parties showed that the CO2 emissions in the energy sector compare quite well for the Non-Annex I Parties included in the analysis. Considerable differences occur for CH4 emissions, especially in the waste sector, and for N2O emissions. The differences between the two data sources could sometimes be explained by different methods used in both sources. The comparison also shows how essential the provision of methodological information is.
The lack of review of individual Non-Annex I national communications weakens the improvement process of the reports. Without a specific feedback from other experts, it will be difficult for the inventory teams to considerably advance their work for the subsequent report.
The inventory review of Annex I Parties which is conducted by equal numbers of experts from Annex I and Non-Annex I Parties together with the training programme for inventory reviewers agreed at SBSTA 18 is currently one of the major opportunities to enhance capacities for inventory preparation in Non-Annex I Parties. About 50 review experts from Non-Annex I Parties are currently involved in the
COM/ENV/EPOC/IEA/SLT(2003)7
43
inventory review teams and a number of experts from Non-Annex I Parties participated as lead reviewers in the technical review of national greenhouse gas inventories41 . The participation as inventory reviewers or the participation in the new training programme for inventory review will in parallel increase capacities for the inventory preparation in the home countries of those experts and will certainly contribute to enhanced quality of greenhouse gas inventories from Non-Annex I Parties.
The process of revision of 1996 IPCC Guidelines for the national greenhouse gas inventories, which is starting in 2003, is also an opportunity to further consider the specific methodological needs and to include additional default parameters for Non-Annex I Parties. However, a number of Non-Annex I Parties that reported on the use of country-specific emission factors did not report these factors and related information, which makes the dissemination of such information very difficult.
41 Experts from Nigeria, Chile, Ghana, Tunesia, Togo, Thailand, Brazil, Peru, Bolivia, China, Iran, Mexico, Kazakhstan
COM/ENV/EPOC/IEA/SLT(2003)7
44
References
FCCC/CP/1999/7: Review of the implementation of commitments and of other provisions of the Convention: UNFCCC guidelines on reporting and review, 16 February 2000.
FCCC/CP/2002/7/Add.2: Report of the Conference of the Parties on its eighth session, held at New Delhi from 23 October to 1 November 2002. Addendum Part two: Action taken by the Conference of the Parties at its eighth session. 28 March 2003
FCCC/CP/2002/8: Review of the implementation of commitments and of other provisions of the Convention – national communication: greenhouse gas inventories from Parties included in Annex I to the Convention - UNFCCC guidelines on reporting and review, 28 March 2003.
FCCC/SBI/2001/14: National Communications from Parties not included in Annex I to the Convention.. Third compilation and synthesis of initial national communications from Parties not included in Annex I to the Convention, 5 October 2001.
FCCC/SBI/2001/INF.1: Reports on inter-sessional activities: Report of the interregional workshop of the Consultative Group of Experts on National Communications from Parties Not Included in Annex I to the Convention, 28 June 2001.
FCCC/SBI/2002/8: National Communications from Parties not included in Annex I to the Convention. Consideration of the Fourth compilation and synthesis of initial national communications - Executive summary of information contained in initial national communications from Parties not included in Annex I to the Convention, 23 August 2002.
FCCC/SBI/2002/16: National Communications from Parties not included in Annex I to the Convention. Fourth compilation and synthesis of initial national communications from Parties not included in Annex I to the Convention, 1 October 2002.
FCCC/SBI/2002/INF.12: National Communications from Parties not included in Annex I to the Convention. Provision of financial and technical support. Information on activities by the Global Environment Facility, 30 August 2002.
FCCC/WEB/2002/9: National Communications from Parties not included in Annex I to the Convention. Provision of financial and technical support: Status of the preparation of national communications from Parties not included in Annex I to the Convention, 1 October 2002.
Herold, Anke (2002): Reporting of emissions and removals from land use change and forestry in Greenhouse Gas Inventories of Non-Annex I National Communications. Paper provided for Consultative Group of Experts on Non-Annex I National Communications, Sub-group on inventories as background material.
IPCC, 1996, IPCC Guidelines for National Greenhouse Gas Inventories, IPCC/UNEP/WMO/OECD/IEA.
IPCC, 2000, Good Practice Guidance and Uncertainty Management in National Greenhouse Gas Inventories, IPCC/UNEP/WMO/IGES/OECD/IEA.
COM/ENV/EPOC/IEA/SLT(2003)7
45
Ministry of Science and Technology (2002): First Brazilian inventory of anthropogenic greenhouse gas emissions. Background reports - greenhouse gas emissions from industrial processes and use of solvents. Brasilia, http://www.mct.gov.br/clima/ingles/comunic_old/energia.htm
Ministry of Science and Technology (2002): First Brazilian inventory of anthropogenic greenhouse gas emissions. Background reports – fugitive emissions from coal mining and handling, Brasilia, http://www.mct.gov.br/clima/ingles/comunic_old/energia.htm
Ministry of Science and Technology (2002): First Brazilian inventory of anthropogenic greenhouse gas emissions. Background reports – greenhouse gas emissions from fuel combustion: bottom-up approach. Brasilia, http://www.mct.gov.br/clima/ingles/comunic_old/energia.htm
Ministry of Science and Technology (2002): First Brazilian inventory of anthropogenic greenhouse gas emissions. Background reports – methane emissions from waste treatment and disposal, Brasilia, http://www.mct.gov.br/clima/ingles/comunic_old/energia.htm
Ministry of Science and Technology (2002): First Brazilian inventory of anthropogenic greenhouse gas emissions. Background reports – nitrous oxide (N2O) emissions from agricultural soils. Brasilia, http://www.mct.gov.br/clima/ingles/comunic_old/energia.htm
Willems, Stéphane, Baumert, Kevin (2003): Institutional Capacity and Climate Actions. OECD and IEA Information Paper, COM/ENV/EPOC/IEA/SLT(2003)5, Paris.
COM/ENV/EPOC/IEA/SLT(2003)7
46
Glossary
CGE Consultative Group of experts on Non-Annex I national communications
COP Conference of the Parties
CRF Common Reporting Format
EF Emission factor
EIT Economy in transition
EPA Environment Protection Agency
FAO Food and Agriculture Organization
GEF Global Environment Facility
GHG greenhouse gas
HFC Hydrofluorcarbon
ICAO International Civil Aviation Organization
IEA International Energy Agency
IEF Implied emission factor
IPCC Intergovernmental Panel on Climate Change
LDC Least developed country
LTO Landing and take-off
LUCF Land-use change and forestry
NC National Communication
NIR National Inventory Report
PFC Perfluorocarbon
QA/QC Quality assurance and quality control
QC Quality control
SBSTA Subsidiary Body for Scientific and Technological Advice
UNDP United Nations Development Programme
UNEP United Nations Environment Programme
UNFCCC United Nations Framework Convention on Climate Change
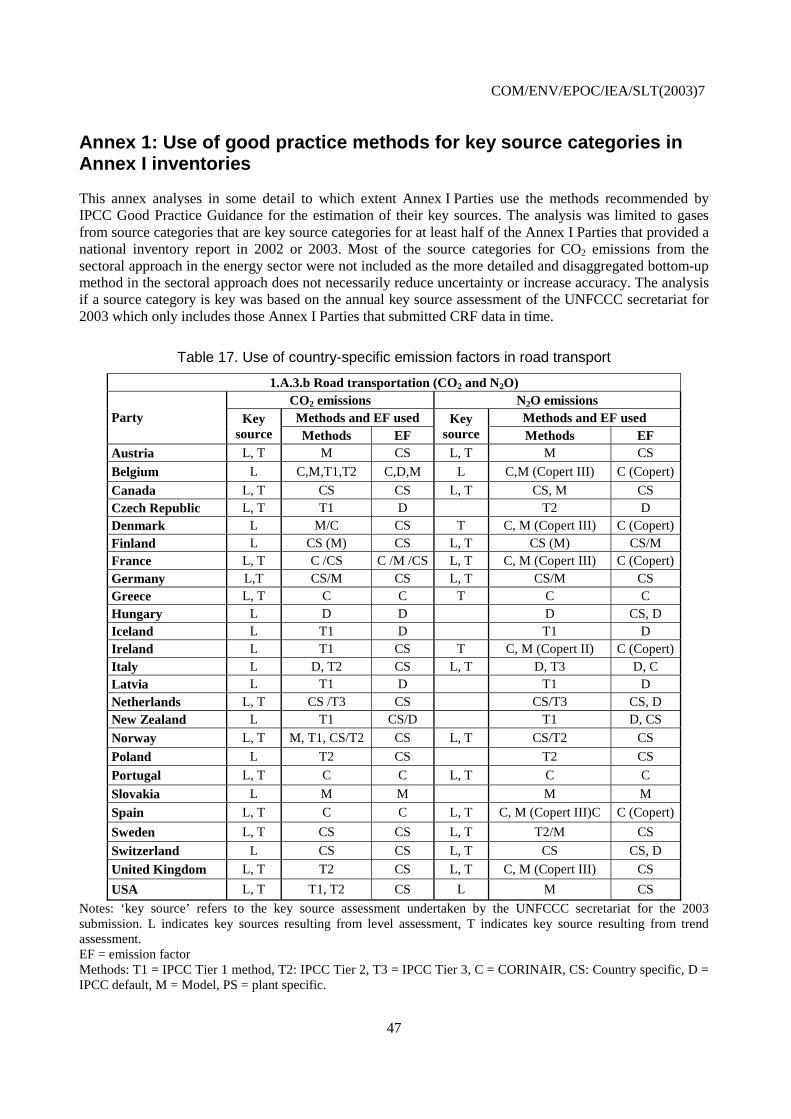
COM/ENV/EPOC/IEA/SLT(2003)7
47
Annex 1: Use of good practice methods for key source categories in Annex I inventories
This annex analyses in some detail to which extent Annex I Parties use the methods recommended by IPCC Good Practice Guidance for the estimation of their key sources. The analysis was limited to gases from source categories that are key source categories for at least half of the Annex I Parties that provided a national inventory report in 2002 or 2003. Most of the source categories for CO2 emissions from the sectoral approach in the energy sector were not included as the more detailed and disaggregated bottom-up method in the sectoral approach does not necessarily reduce uncertainty or increase accuracy. The analysis if a source category is key was based on the annual key source assessment of the UNFCCC secretariat for 2003 which only includes those Annex I Parties that submitted CRF data in time.
Table 17. Use of country-specific emission factors in road transport
1.A.3.b Road transportation (CO2 and N2O) CO2 emissions N2O emissions Methods and EF used Methods and EF used Party Key
source Methods EF Key
source Methods EF Austria L, T M CS L, T M CS
Belgium L C,M,T1,T2 C,D,M L C,M (Copert III) C (Copert)
Canada L, T CS CS L, T CS, M CS Czech Republic L, T T1 D T2 D Denmark L M/C CS T C, M (Copert III) C (Copert) Finland L CS (M) CS L, T CS (M) CS/M France L, T C /CS C /M /CS L, T C, M (Copert III) C (Copert) Germany L,T CS/M CS L, T CS/M CS Greece L, T C C T C C Hungary L D D D CS, D Iceland L T1 D T1 D Ireland L T1 CS T C, M (Copert II) C (Copert) Italy L D, T2 CS L, T D, T3 D, C Latvia L T1 D T1 D Netherlands L, T CS /T3 CS CS/T3 CS, D New Zealand L T1 CS/D T1 D, CS
Norway L, T M, T1, CS/T2 CS L, T CS/T2 CS
Poland L T2 CS T2 CS
Portugal L, T C C L, T C C
Slovakia L M M M M
Spain L, T C C L, T C, M (Copert III)C C (Copert)
Sweden L, T CS CS L, T T2/M CS
Switzerland L CS CS L, T CS CS, D
United Kingdom L, T T2 CS L, T C, M (Copert III) CS
USA L, T T1, T2 CS L M CS
Notes: ‘key source’ refers to the key source assessment undertaken by the UNFCCC secretariat for the 2003 submission. L indicates key sources resulting from level assessment, T indicates key source resulting from trend assessment. EF = emission factor Methods: T1 = IPCC Tier 1 method, T2: IPCC Tier 2, T3 = IPCC Tier 3, C = CORINAIR, CS: Country specific, D = IPCC default, M = Model, PS = plant specific.
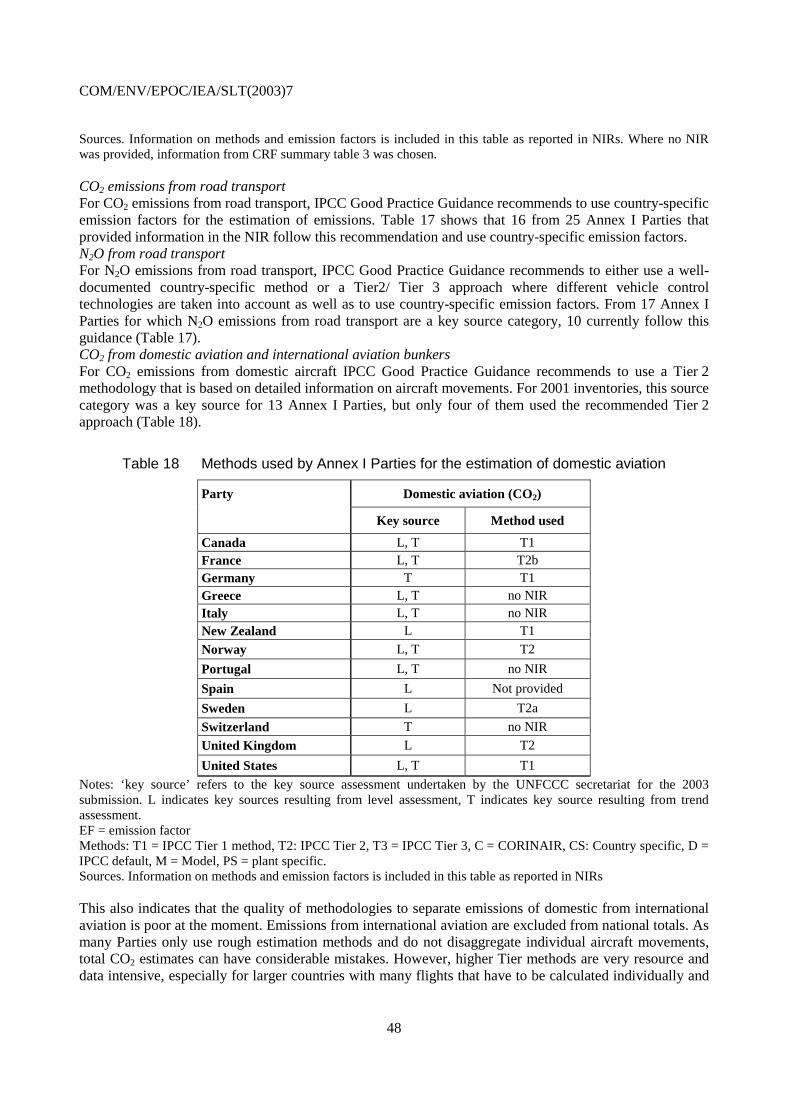
COM/ENV/EPOC/IEA/SLT(2003)7
48
Sources. Information on methods and emission factors is included in this table as reported in NIRs. Where no NIR was provided, information from CRF summary table 3 was chosen.
CO2 emissions from road transport For CO2 emissions from road transport, IPCC Good Practice Guidance recommends to use country-specific emission factors for the estimation of emissions. Table 17 shows that 16 from 25 Annex I Parties that provided information in the NIR follow this recommendation and use country-specific emission factors. N2O from road transport For N2O emissions from road transport, IPCC Good Practice Guidance recommends to either use a well-documented country-specific method or a Tier2/ Tier 3 approach where different vehicle control technologies are taken into account as well as to use country-specific emission factors. From 17 Annex I Parties for which N2O emissions from road transport are a key source category, 10 currently follow this guidance (Table 17). CO2 from domestic aviation and international aviation bunkers For CO2 emissions from domestic aircraft IPCC Good Practice Guidance recommends to use a Tier 2 methodology that is based on detailed information on aircraft movements. For 2001 inventories, this source category was a key source for 13 Annex I Parties, but only four of them used the recommended Tier 2 approach (Table 18).
Table 18 Methods used by Annex I Parties for the estimation of domestic aviation
Party Domestic aviation (CO2)
Key source Method used
Canada L, T T1 France L, T T2b Germany T T1 Greece L, T no NIR Italy L, T no NIR New Zealand L T1
Norway L, T T2
Portugal L, T no NIR
Spain L Not provided
Sweden L T2a
Switzerland T no NIR
United Kingdom L T2
United States L, T T1
Notes: ‘key source’ refers to the key source assessment undertaken by the UNFCCC secretariat for the 2003 submission. L indicates key sources resulting from level assessment, T indicates key source resulting from trend assessment. EF = emission factor Methods: T1 = IPCC Tier 1 method, T2: IPCC Tier 2, T3 = IPCC Tier 3, C = CORINAIR, CS: Country specific, D = IPCC default, M = Model, PS = plant specific. Sources. Information on methods and emission factors is included in this table as reported in NIRs
This also indicates that the quality of methodologies to separate emissions of domestic from international aviation is poor at the moment. Emissions from international aviation are excluded from national totals. As many Parties only use rough estimation methods and do not disaggregate individual aircraft movements, total CO2 estimates can have considerable mistakes. However, higher Tier methods are very resource and data intensive, especially for larger countries with many flights that have to be calculated individually and
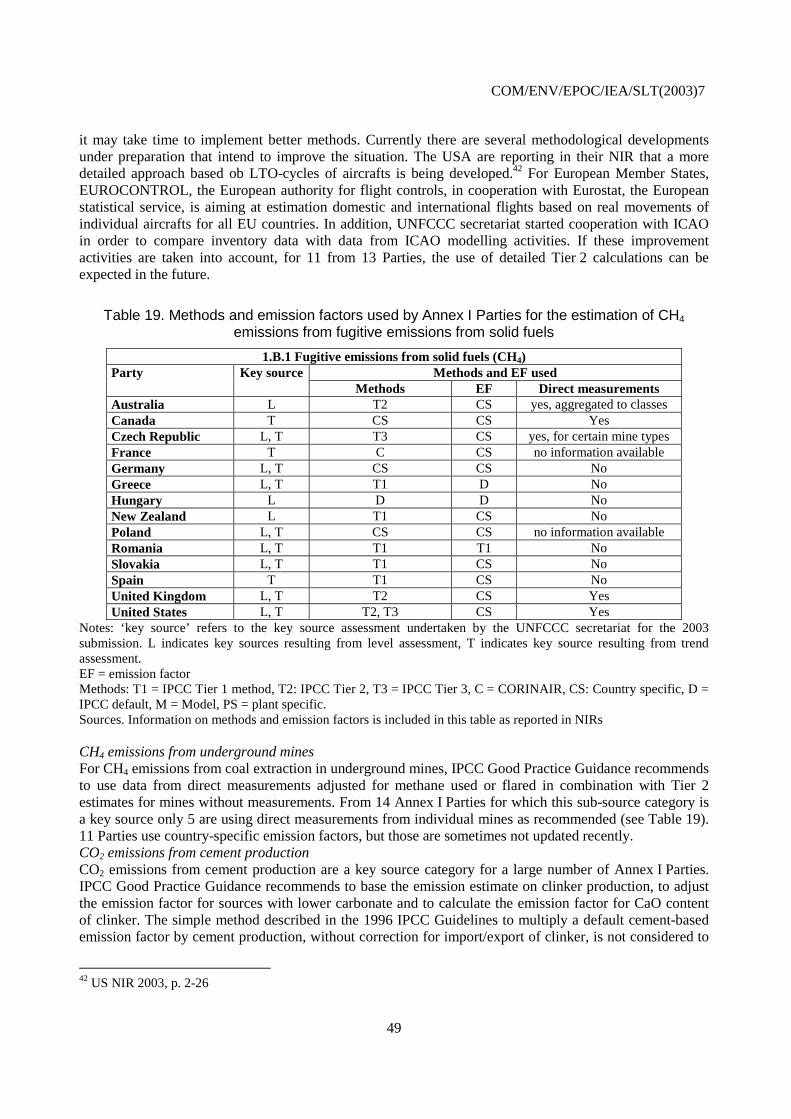
COM/ENV/EPOC/IEA/SLT(2003)7
49
it may take time to implement better methods. Currently there are several methodological developments under preparation that intend to improve the situation. The USA are reporting in their NIR that a more detailed approach based ob LTO-cycles of aircrafts is being developed.42 For European Member States, EUROCONTROL, the European authority for flight controls, in cooperation with Eurostat, the European statistical service, is aiming at estimation domestic and international flights based on real movements of individual aircrafts for all EU countries. In addition, UNFCCC secretariat started cooperation with ICAO in order to compare inventory data with data from ICAO modelling activities. If these improvement activities are taken into account, for 11 from 13 Parties, the use of detailed Tier 2 calculations can be expected in the future.
Table 19. Methods and emission factors used by Annex I Parties for the estimation of CH4 emissions from fugitive emissions from solid fuels
1.B.1 Fugitive emissions from solid fuels (CH4) Methods and EF used Party Key source
Methods EF Direct measurements Australia L T2 CS yes, aggregated to classes Canada T CS CS Yes Czech Republic L, T T3 CS yes, for certain mine types France T C CS no information available Germany L, T CS CS No Greece L, T T1 D No Hungary L D D No New Zealand L T1 CS No Poland L, T CS CS no information available Romania L, T T1 T1 No Slovakia L, T T1 CS No Spain T T1 CS No United Kingdom L, T T2 CS Yes United States L, T T2, T3 CS Yes
Notes: ‘key source’ refers to the key source assessment undertaken by the UNFCCC secretariat for the 2003 submission. L indicates key sources resulting from level assessment, T indicates key source resulting from trend assessment. EF = emission factor Methods: T1 = IPCC Tier 1 method, T2: IPCC Tier 2, T3 = IPCC Tier 3, C = CORINAIR, CS: Country specific, D = IPCC default, M = Model, PS = plant specific. Sources. Information on methods and emission factors is included in this table as reported in NIRs
CH4 emissions from underground mines For CH4 emissions from coal extraction in underground mines, IPCC Good Practice Guidance recommends to use data from direct measurements adjusted for methane used or flared in combination with Tier 2 estimates for mines without measurements. From 14 Annex I Parties for which this sub-source category is a key source only 5 are using direct measurements from individual mines as recommended (see Table 19). 11 Parties use country-specific emission factors, but those are sometimes not updated recently. CO2 emissions from cement production CO2 emissions from cement production are a key source category for a large number of Annex I Parties. IPCC Good Practice Guidance recommends to base the emission estimate on clinker production, to adjust the emission factor for sources with lower carbonate and to calculate the emission factor for CaO content of clinker. The simple method described in the 1996 IPCC Guidelines to multiply a default cement-based emission factor by cement production, without correction for import/export of clinker, is not considered to
42 US NIR 2003, p. 2-26
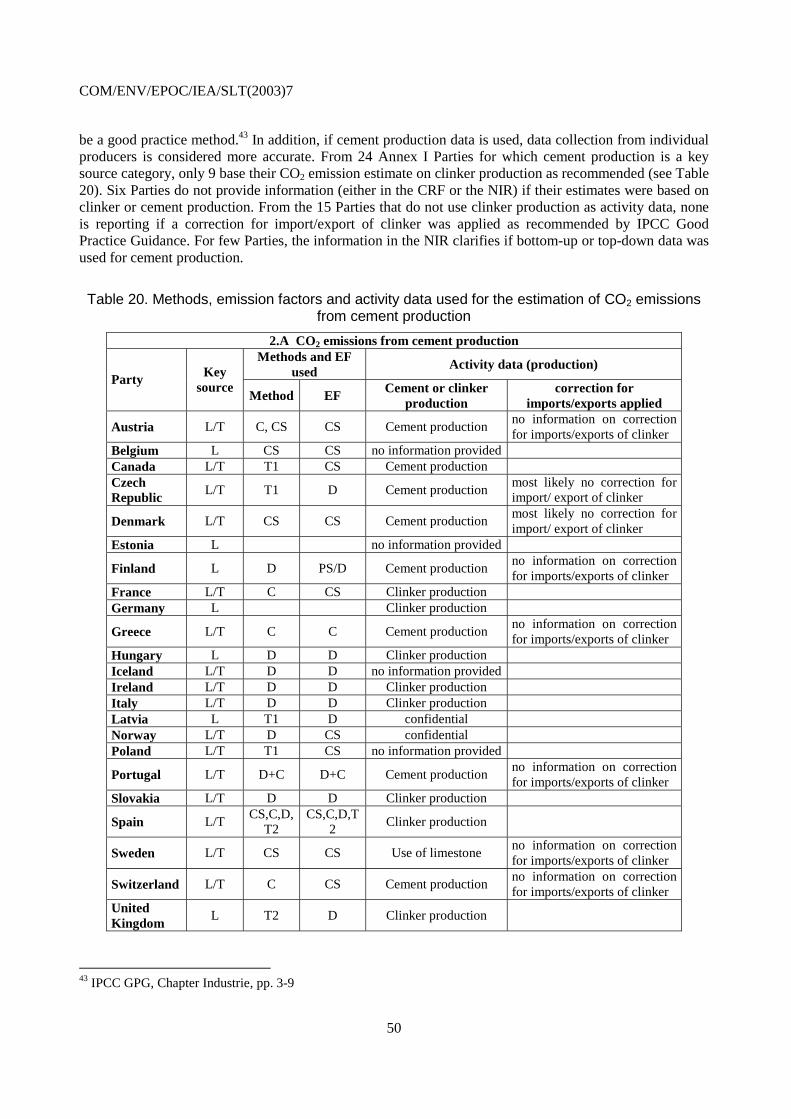
COM/ENV/EPOC/IEA/SLT(2003)7
50
be a good practice method.43 In addition, if cement production data is used, data collection from individual producers is considered more accurate. From 24 Annex I Parties for which cement production is a key source category, only 9 base their CO2 emission estimate on clinker production as recommended (see Table 20). Six Parties do not provide information (either in the CRF or the NIR) if their estimates were based on clinker or cement production. From the 15 Parties that do not use clinker production as activity data, none is reporting if a correction for import/export of clinker was applied as recommended by IPCC Good Practice Guidance. For few Parties, the information in the NIR clarifies if bottom-up or top-down data was used for cement production.
Table 20. Methods, emission factors and activity data used for the estimation of CO2 emissions from cement production
2.A CO2 emissions from cement production Methods and EF
used Activity data (production)
Party Key source
Method EF Cement or clinker
production correction for
imports/exports applied
Austria L/T C, CS CS Cement production no information on correction for imports/exports of clinker
Belgium L CS CS no information provided Canada L/T T1 CS Cement production Czech Republic
L/T T1 D Cement production most likely no correction for import/ export of clinker
Denmark L/T CS CS Cement production most likely no correction for import/ export of clinker
Estonia L no information provided
Finland L D PS/D Cement production no information on correction for imports/exports of clinker
France L/T C CS Clinker production Germany L Clinker production
Greece L/T C C Cement production no information on correction for imports/exports of clinker
Hungary L D D Clinker production Iceland L/T D D no information provided Ireland L/T D D Clinker production Italy L/T D D Clinker production Latvia L T1 D confidential Norway L/T D CS confidential Poland L/T T1 CS no information provided
Portugal L/T D+C D+C Cement production no information on correction for imports/exports of clinker
Slovakia L/T D D Clinker production
Spain L/T CS,C,D,
T2 CS,C,D,T
2 Clinker production
Sweden L/T CS CS Use of limestone no information on correction for imports/exports of clinker
Switzerland L/T C CS Cement production no information on correction for imports/exports of clinker
United Kingdom
L T2 D Clinker production
43 IPCC GPG, Chapter Industrie, pp. 3-9
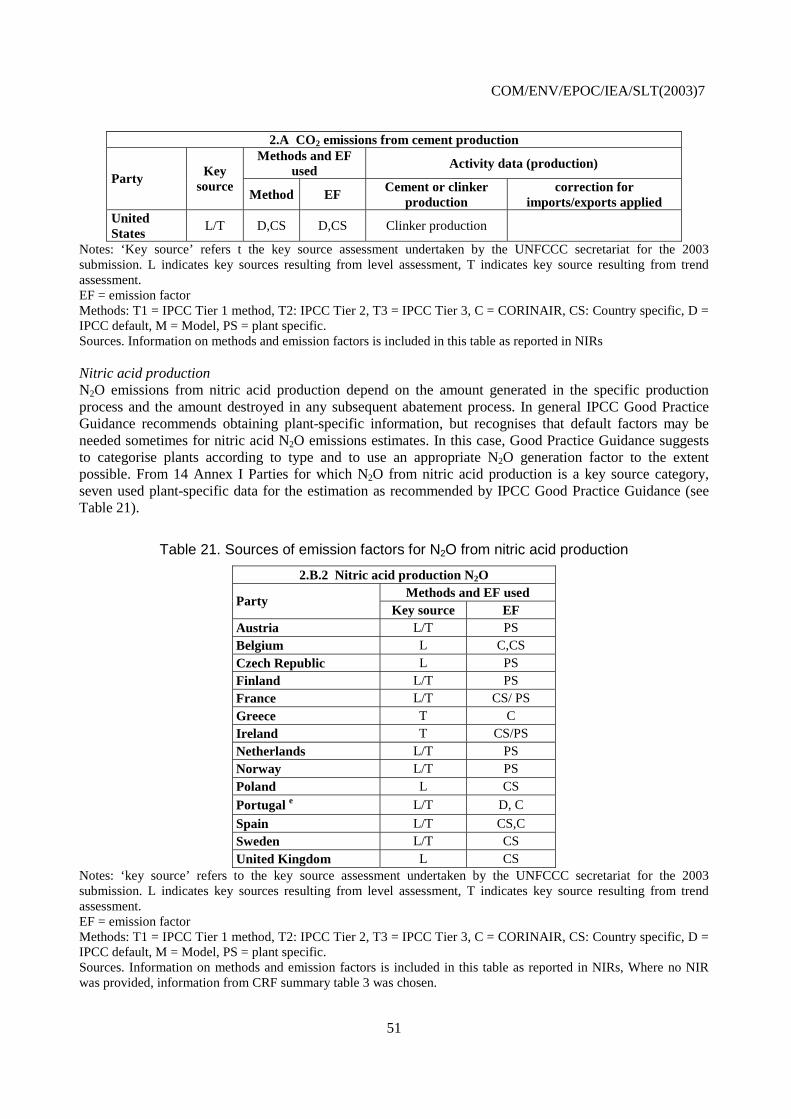
COM/ENV/EPOC/IEA/SLT(2003)7
51
2.A CO2 emissions from cement production Methods and EF
used Activity data (production) Party Key
source Method EF
Cement or clinker production
correction for imports/exports applied
United States
L/T D,CS D,CS Clinker production
Notes: ‘Key source’ refers t the key source assessment undertaken by the UNFCCC secretariat for the 2003 submission. L indicates key sources resulting from level assessment, T indicates key source resulting from trend assessment. EF = emission factor Methods: T1 = IPCC Tier 1 method, T2: IPCC Tier 2, T3 = IPCC Tier 3, C = CORINAIR, CS: Country specific, D = IPCC default, M = Model, PS = plant specific. Sources. Information on methods and emission factors is included in this table as reported in NIRs
Nitric acid production N2O emissions from nitric acid production depend on the amount generated in the specific production process and the amount destroyed in any subsequent abatement process. In general IPCC Good Practice Guidance recommends obtaining plant-specific information, but recognises that default factors may be needed sometimes for nitric acid N2O emissions estimates. In this case, Good Practice Guidance suggests to categorise plants according to type and to use an appropriate N2O generation factor to the extent possible. From 14 Annex I Parties for which N2O from nitric acid production is a key source category, seven used plant-specific data for the estimation as recommended by IPCC Good Practice Guidance (see Table 21).
Table 21. Sources of emission factors for N2O from nitric acid production
2.B.2 Nitric acid production N2O Methods and EF used
Party Key source EF
Austria L/T PS Belgium L C,CS Czech Republic L PS Finland L/T PS France L/T CS/ PS Greece T C Ireland T CS/PS Netherlands L/T PS Norway L/T PS Poland L CS
Portugal e L/T D, C
Spain L/T CS,C Sweden L/T CS United Kingdom L CS
Notes: ‘key source’ refers to the key source assessment undertaken by the UNFCCC secretariat for the 2003 submission. L indicates key sources resulting from level assessment, T indicates key source resulting from trend assessment. EF = emission factor Methods: T1 = IPCC Tier 1 method, T2: IPCC Tier 2, T3 = IPCC Tier 3, C = CORINAIR, CS: Country specific, D = IPCC default, M = Model, PS = plant specific. Sources. Information on methods and emission factors is included in this table as reported in NIRs, Where no NIR was provided, information from CRF summary table 3 was chosen.
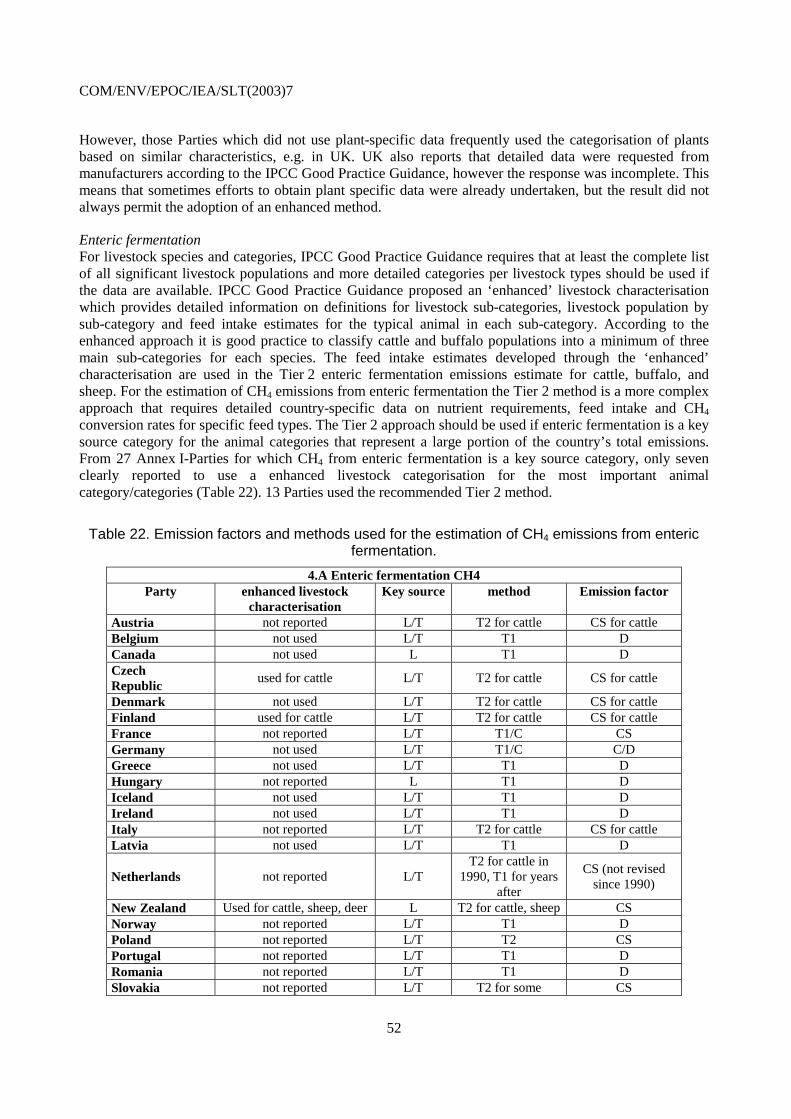
COM/ENV/EPOC/IEA/SLT(2003)7
52
However, those Parties which did not use plant-specific data frequently used the categorisation of plants based on similar characteristics, e.g. in UK. UK also reports that detailed data were requested from manufacturers according to the IPCC Good Practice Guidance, however the response was incomplete. This means that sometimes efforts to obtain plant specific data were already undertaken, but the result did not always permit the adoption of an enhanced method.
Enteric fermentation For livestock species and categories, IPCC Good Practice Guidance requires that at least the complete list of all significant livestock populations and more detailed categories per livestock types should be used if the data are available. IPCC Good Practice Guidance proposed an ‘enhanced’ livestock characterisation which provides detailed information on definitions for livestock sub-categories, livestock population by sub-category and feed intake estimates for the typical animal in each sub-category. According to the enhanced approach it is good practice to classify cattle and buffalo populations into a minimum of three main sub-categories for each species. The feed intake estimates developed through the ‘enhanced’ characterisation are used in the Tier 2 enteric fermentation emissions estimate for cattle, buffalo, and sheep. For the estimation of CH4 emissions from enteric fermentation the Tier 2 method is a more complex approach that requires detailed country-specific data on nutrient requirements, feed intake and CH4 conversion rates for specific feed types. The Tier 2 approach should be used if enteric fermentation is a key source category for the animal categories that represent a large portion of the country’s total emissions. From 27 Annex I-Parties for which CH4 from enteric fermentation is a key source category, only seven clearly reported to use a enhanced livestock categorisation for the most important animal category/categories (Table 22). 13 Parties used the recommended Tier 2 method.
Table 22. Emission factors and methods used for the estimation of CH4 emissions from enteric fermentation.
4.A Enteric fermentation CH4 Party enhanced livestock
characterisation Key source method Emission factor
Austria not reported L/T T2 for cattle CS for cattle Belgium not used L/T T1 D Canada not used L T1 D Czech Republic
used for cattle L/T T2 for cattle CS for cattle
Denmark not used L/T T2 for cattle CS for cattle Finland used for cattle L/T T2 for cattle CS for cattle France not reported L/T T1/C CS Germany not used L/T T1/C C/D Greece not used L/T T1 D Hungary not reported L T1 D Iceland not used L/T T1 D Ireland not used L/T T1 D Italy not reported L/T T2 for cattle CS for cattle Latvia not used L/T T1 D
Netherlands not reported L/T T2 for cattle in
1990, T1 for years after
CS (not revised since 1990)
New Zealand Used for cattle, sheep, deer L T2 for cattle, sheep CS Norway not reported L/T T1 D Poland not reported L/T T2 CS Portugal not reported L/T T1 D Romania not reported L/T T1 D Slovakia not reported L/T T2 for some CS
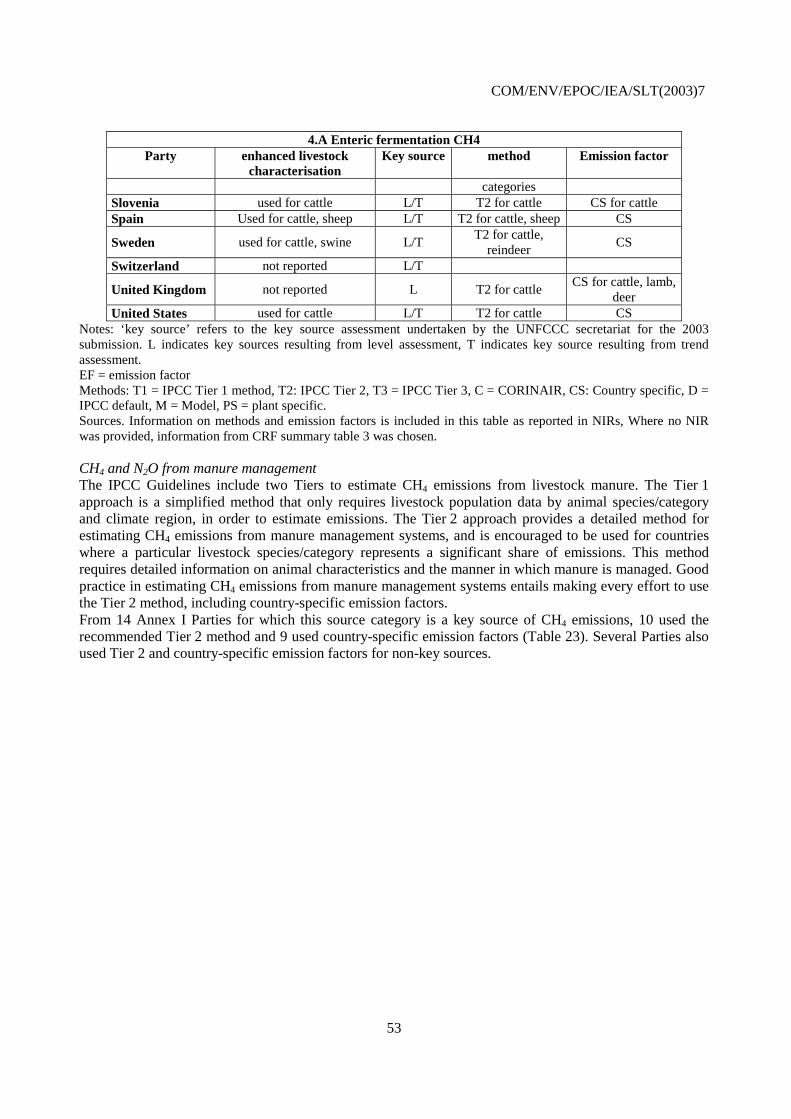
COM/ENV/EPOC/IEA/SLT(2003)7
53
4.A Enteric fermentation CH4 Party enhanced livestock
characterisation Key source method Emission factor
categories Slovenia used for cattle L/T T2 for cattle CS for cattle Spain Used for cattle, sheep L/T T2 for cattle, sheep CS
Sweden used for cattle, swine L/T T2 for cattle,
reindeer CS
Switzerland not reported L/T
United Kingdom not reported L T2 for cattle CS for cattle, lamb,
deer United States used for cattle L/T T2 for cattle CS
Notes: ‘key source’ refers to the key source assessment undertaken by the UNFCCC secretariat for the 2003 submission. L indicates key sources resulting from level assessment, T indicates key source resulting from trend assessment. EF = emission factor Methods: T1 = IPCC Tier 1 method, T2: IPCC Tier 2, T3 = IPCC Tier 3, C = CORINAIR, CS: Country specific, D = IPCC default, M = Model, PS = plant specific. Sources. Information on methods and emission factors is included in this table as reported in NIRs, Where no NIR was provided, information from CRF summary table 3 was chosen.
CH4 and N2O from manure management The IPCC Guidelines include two Tiers to estimate CH4 emissions from livestock manure. The Tier 1 approach is a simplified method that only requires livestock population data by animal species/category and climate region, in order to estimate emissions. The Tier 2 approach provides a detailed method for estimating CH4 emissions from manure management systems, and is encouraged to be used for countries where a particular livestock species/category represents a significant share of emissions. This method requires detailed information on animal characteristics and the manner in which manure is managed. Good practice in estimating CH4 emissions from manure management systems entails making every effort to use the Tier 2 method, including country-specific emission factors. From 14 Annex I Parties for which this source category is a key source of CH4 emissions, 10 used the recommended Tier 2 method and 9 used country-specific emission factors (Table 23). Several Parties also used Tier 2 and country-specific emission factors for non-key sources.
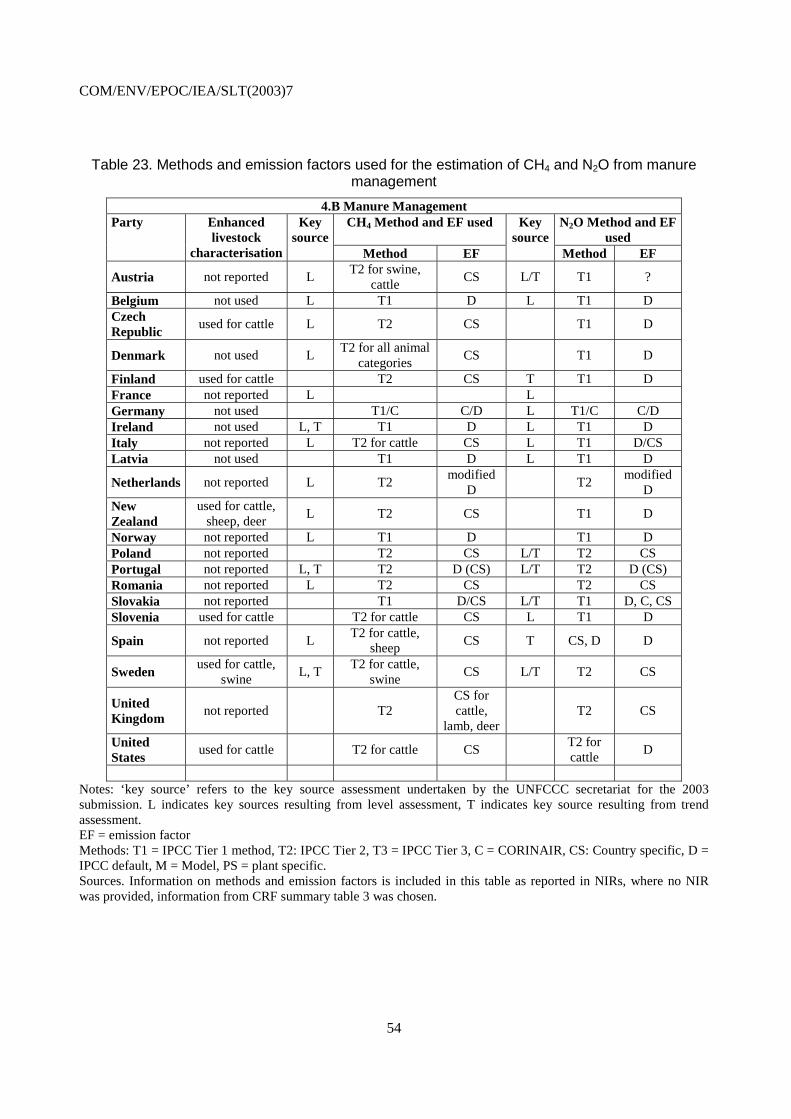
COM/ENV/EPOC/IEA/SLT(2003)7
54
Table 23. Methods and emission factors used for the estimation of CH4 and N2O from manure management
4.B Manure Management CH4 Method and EF used N2O Method and EF
used Party Enhanced
livestock characterisation
Key source
Method EF
Key source
Method EF
Austria not reported L T2 for swine,
cattle CS L/T T1 ?
Belgium not used L T1 D L T1 D Czech Republic
used for cattle L T2 CS T1 D
Denmark not used L T2 for all animal
categories CS T1 D
Finland used for cattle T2 CS T T1 D France not reported L L Germany not used T1/C C/D L T1/C C/D Ireland not used L, T T1 D L T1 D Italy not reported L T2 for cattle CS L T1 D/CS Latvia not used T1 D L T1 D
Netherlands not reported L T2 modified
D T2
modified D
New Zealand
used for cattle, sheep, deer
L T2 CS T1 D
Norway not reported L T1 D T1 D Poland not reported T2 CS L/T T2 CS Portugal not reported L, T T2 D (CS) L/T T2 D (CS) Romania not reported L T2 CS T2 CS Slovakia not reported T1 D/CS L/T T1 D, C, CS Slovenia used for cattle T2 for cattle CS L T1 D
Spain not reported L T2 for cattle,
sheep CS T CS, D D
Sweden used for cattle,
swine L, T
T2 for cattle, swine
CS L/T T2 CS
United Kingdom
not reported T2 CS for cattle,
lamb, deer T2 CS
United States
used for cattle T2 for cattle CS T2 for cattle
D
Notes: ‘key source’ refers to the key source assessment undertaken by the UNFCCC secretariat for the 2003 submission. L indicates key sources resulting from level assessment, T indicates key source resulting from trend assessment. EF = emission factor Methods: T1 = IPCC Tier 1 method, T2: IPCC Tier 2, T3 = IPCC Tier 3, C = CORINAIR, CS: Country specific, D = IPCC default, M = Model, PS = plant specific. Sources. Information on methods and emission factors is included in this table as reported in NIRs, where no NIR was provided, information from CRF summary table 3 was chosen.
COM/ENV/EPOC/IEA/SLT(2003)7
55
The IPCC Guidelines method for estimating N2O emissions from manure management entails multiplying the total amount of N excretion (from all animal species/categories) in each type of manure management system by an emission factor for that type of system. The decision tree for N2O emissions from Manure Management describes good practice as adapting the methods in the IPCC Guidelines to country-specific circumstances. From 15 Annex I Parties for which this source category is a key source, only three used the Tier 2 method and five used at least partly country-specific emission factors (Table 23).
CH4 from solid waste disposal The Revised 1996 IPCC Guidelines outline two methods for estimating CH4 emissions from solid waste disposal sites, the default method (Tier 1) and the First Order Decay (FOD) method (Tier 2). The main difference between the two methods is that the FOD method produces a time-dependent emission profile that better reflects the true pattern of the degradation process over time, whereas the default method is based on the assumption that all potential CH4 is released in the year of waste disposal. The default method will give a reasonable annual estimate of actual emissions if the amount and composition of deposited waste have been constant or slowly varying over a period of several decades. If the amount or composition of waste disposed of at solid waste disposal sites is changing more rapidly over time, however, the IPCC default method will not provide an accurate trend. It is considered as good practice to use the FOD method, if possible, because it more accurately reflects the emissions trend over time. Especially in countries where the amounts of solid waste disposed at landfills is strongly decreasing between base year and commitment period years (e.g. due to national activities favouring waste incineration or waste reduction), the Tier 1 method has the potential to move quantities of CH4 emissions from the inventories in the commitment period years to earlier inventory years. The comparison in Table 24 shows that at present from 25 Annex I Parties for which CH4 emissions from solid waste disposal are a key source category, 16 use the recommended Tier 2 methods, usually partly applying IPCC default parameters and partly applying country-specific parameters. Table 24 also provides information about the trend in waste disposal in landfills and CH4 emissions. This shows that particularly Austria and Germany should adopt Tier 2 methods for the estimation of CH4 emissions from solid waste disposal sites.
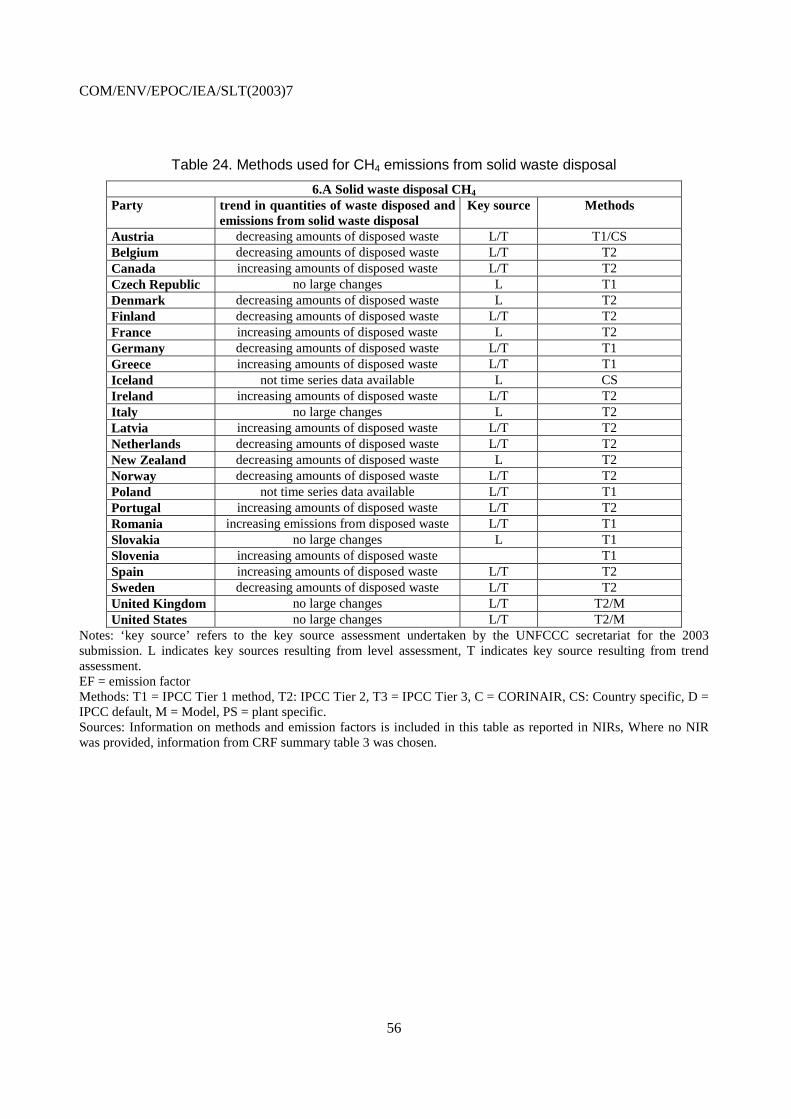
COM/ENV/EPOC/IEA/SLT(2003)7
56
Table 24. Methods used for CH4 emissions from solid waste disposal
6.A Solid waste disposal CH4 Party trend in quantities of waste disposed and
emissions from solid waste disposal Key source Methods
Austria decreasing amounts of disposed waste L/T T1/CS Belgium decreasing amounts of disposed waste L/T T2 Canada increasing amounts of disposed waste L/T T2 Czech Republic no large changes L T1 Denmark decreasing amounts of disposed waste L T2 Finland decreasing amounts of disposed waste L/T T2 France increasing amounts of disposed waste L T2 Germany decreasing amounts of disposed waste L/T T1 Greece increasing amounts of disposed waste L/T T1 Iceland not time series data available L CS Ireland increasing amounts of disposed waste L/T T2 Italy no large changes L T2 Latvia increasing amounts of disposed waste L/T T2 Netherlands decreasing amounts of disposed waste L/T T2 New Zealand decreasing amounts of disposed waste L T2 Norway decreasing amounts of disposed waste L/T T2 Poland not time series data available L/T T1 Portugal increasing amounts of disposed waste L/T T2 Romania increasing emissions from disposed waste L/T T1 Slovakia no large changes L T1 Slovenia increasing amounts of disposed waste T1 Spain increasing amounts of disposed waste L/T T2 Sweden decreasing amounts of disposed waste L/T T2 United Kingdom no large changes L/T T2/M United States no large changes L/T T2/M
Notes: ‘key source’ refers to the key source assessment undertaken by the UNFCCC secretariat for the 2003 submission. L indicates key sources resulting from level assessment, T indicates key source resulting from trend assessment. EF = emission factor Methods: T1 = IPCC Tier 1 method, T2: IPCC Tier 2, T3 = IPCC Tier 3, C = CORINAIR, CS: Country specific, D = IPCC default, M = Model, PS = plant specific. Sources: Information on methods and emission factors is included in this table as reported in NIRs, Where no NIR was provided, information from CRF summary table 3 was chosen.
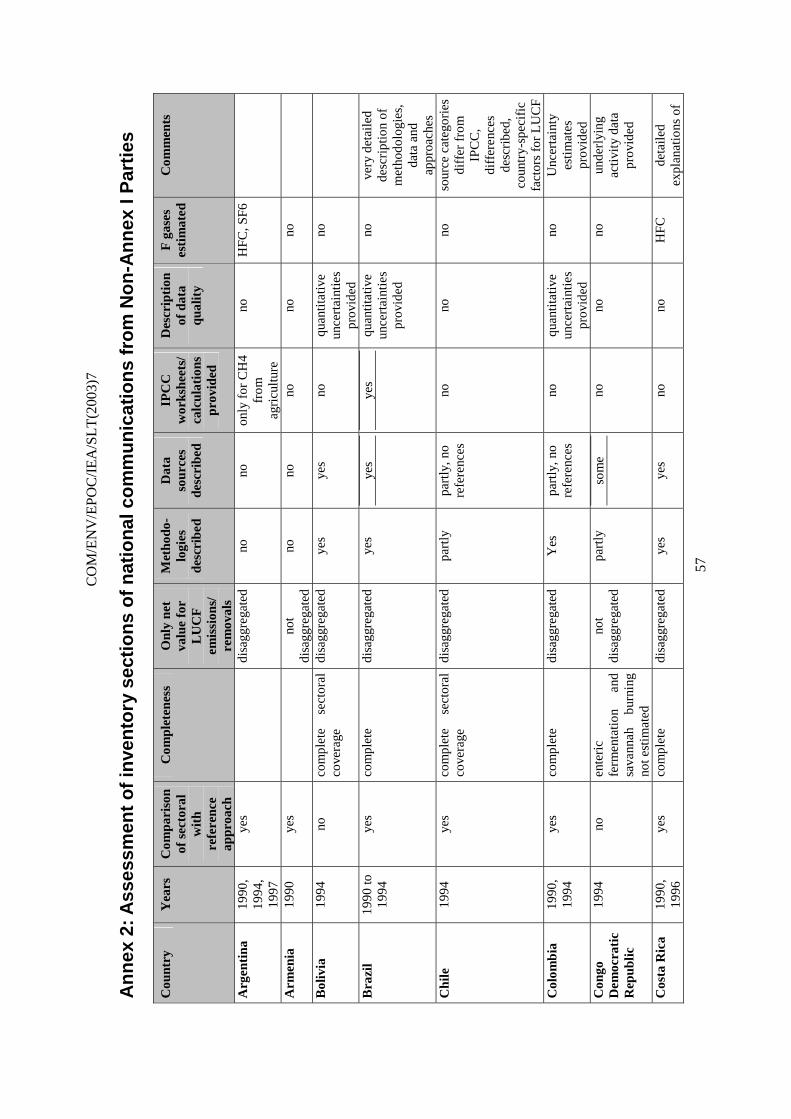
C
OM
/EN
V/E
POC
/IE
A/S
LT
(200
3)7
57
An
nex
2: A
sses
smen
t o
f in
ven
tory
sec
tio
ns
of
nat
ion
al c
om
mu
nic
atio
ns
fro
m N
on
-An
nex
I P
arti
es
Cou
ntry
Y
ears
C
ompa
riso
n of
sec
tora
l w
ith
refe
renc
e ap
proa
ch
Com
plet
enes
s O
nly
net
valu
e fo
r L
UC
F
emis
sion
s/
rem
oval
s
Met
hodo
-lo
gies
de
scri
bed
Dat
a so
urce
s de
scri
bed
IPC
C
wor
kshe
ets/
ca
lcul
atio
ns
prov
ided
Des
crip
tion
of
dat
a qu
alit
y
F g
ases
es
tim
ated
C
omm
ents
Arg
enti
na
1990
, 19
94,
1997
yes
di
sagg
rega
ted
no
no
only
for
CH
4 fr
om
agri
cult
ure
no
HFC
, SF6
Arm
enia
19
90
yes
no
t di
sagg
rega
ted
no
no
no
no
no
Bol
ivia
19
94
no
com
plet
e se
ctor
al
cove
rage
di
sagg
rega
ted
yes
yes
no
quan
titat
ive
unce
rtai
ntie
s pr
ovid
ed
no
Bra
zil
1990
to
1994
ye
s co
mpl
ete
disa
ggre
gate
d ye
s ye
s ye
s qu
antit
ativ
e un
cert
aint
ies
prov
ided
no
very
det
aile
d de
scri
ptio
n of
m
etho
dolo
gies
, da
ta a
nd
appr
oach
es
Chi
le
1994
ye
s co
mpl
ete
sect
oral
co
vera
ge
disa
ggre
gate
d pa
rtly
pa
rtly
, no
refe
renc
es
no
no
no
sour
ce c
ateg
orie
s di
ffer
fro
m
IPC
C,
diff
eren
ces
desc
ribe
d,
coun
try-
spec
ific
fa
ctor
s fo
r L
UC
F C
olom
bia
1990
, 19
94
yes
com
plet
e di
sagg
rega
ted
Yes
pa
rtly
, no
refe
renc
es
no
quan
titat
ive
unce
rtai
ntie
s pr
ovid
ed
no
Unc
erta
inty
es
tim
ates
pr
ovid
ed
Con
go
Dem
ocra
tic
Rep
ublic
1994
no
en
teri
c fe
rmen
tatio
n an
d sa
vann
ah
burn
ing
not e
stim
ated
not
disa
ggre
gate
d pa
rtly
so
me
no
no
no
unde
rlyi
ng
activ
ity
data
pr
ovid
ed
Cos
ta R
ica
1990
, 19
96
yes
com
plet
e di
sagg
rega
ted
yes
yes
no
no
HFC
de
taile
d ex
plan
atio
ns o
f
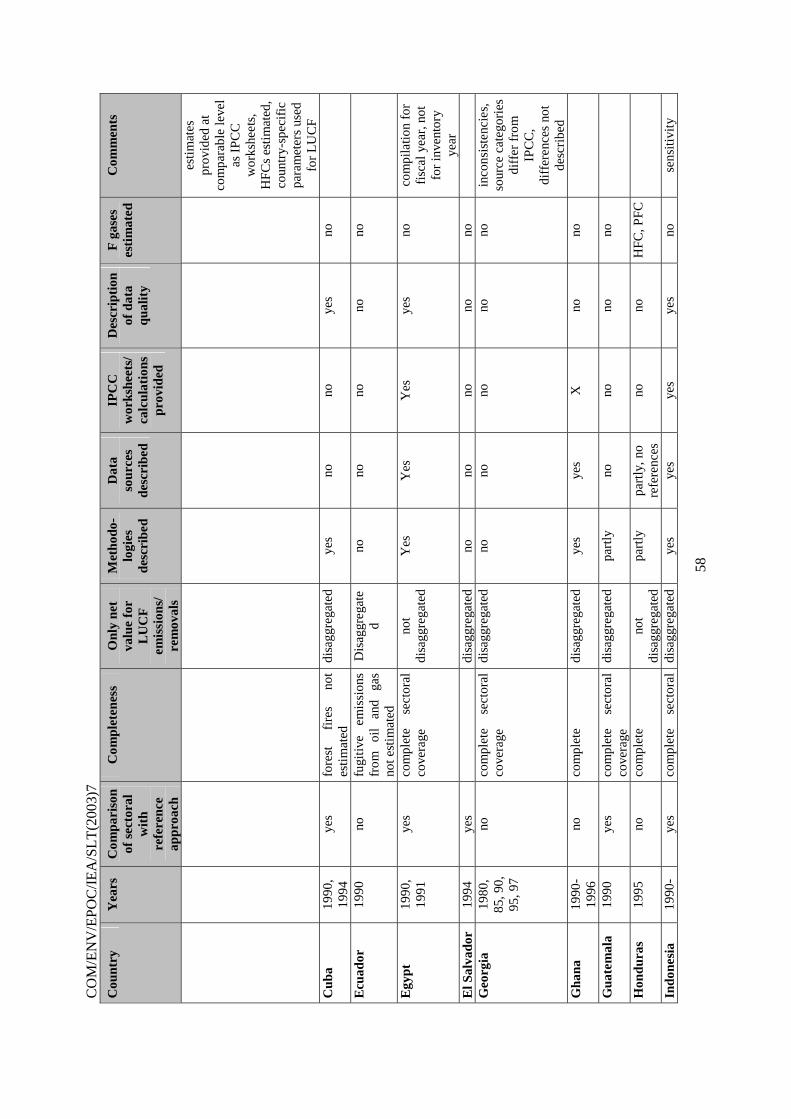
CO
M/E
NV
/EPO
C/I
EA
/SL
T(2
003)
7
58
Cou
ntry
Y
ears
C
ompa
riso
n of
sec
tora
l w
ith
refe
renc
e ap
proa
ch
Com
plet
enes
s O
nly
net
valu
e fo
r L
UC
F
emis
sion
s/
rem
oval
s
Met
hodo
-lo
gies
de
scri
bed
Dat
a so
urce
s de
scri
bed
IPC
C
wor
kshe
ets/
ca
lcul
atio
ns
prov
ided
Des
crip
tion
of
dat
a qu
alit
y
F g
ases
es
tim
ated
C
omm
ents
esti
mat
es
prov
ided
at
com
para
ble
leve
l as
IP
CC
w
orks
heet
s,
HFC
s es
tim
ated
, co
untr
y-sp
ecif
ic
para
met
ers
used
fo
r L
UC
F C
uba
1990
, 19
94
yes
fore
st
fire
s no
t es
tim
ated
di
sagg
rega
ted
yes
no
no
yes
no
Ecu
ador
19
90
no
fugi
tive
em
issi
ons
from
oi
l an
d ga
s no
t est
imat
ed
Dis
aggr
egat
ed
no
no
no
no
no
Egy
pt
1990
, 19
91
yes
com
plet
e se
ctor
al
cove
rage
no
t di
sagg
rega
ted
Yes
Y
es
Yes
ye
s no
co
mpi
latio
n fo
r fi
scal
yea
r, n
ot
for
inve
ntor
y ye
ar
El S
alva
dor
1994
ye
s
disa
ggre
gate
d no
no
no
no
no
Geo
rgia
19
80,
85, 9
0,
95, 9
7
no
com
plet
e se
ctor
al
cove
rage
di
sagg
rega
ted
no
no
no
no
no
inco
nsis
tenc
ies,
so
urce
cat
egor
ies
diff
er f
rom
IP
CC
, di
ffer
ence
s no
t de
scri
bed
Gha
na
1990
-19
96
no
com
plet
e di
sagg
rega
ted
yes
yes
X
no
no
Gua
tem
ala
1990
ye
s co
mpl
ete
sect
oral
co
vera
ge
disa
ggre
gate
d pa
rtly
no
no
no
no
Hon
dura
s 19
95
no
com
plet
e no
t di
sagg
rega
ted
part
ly
part
ly, n
o re
fere
nces
no
no
H
FC, P
FC
Indo
nesi
a 19
90-
yes
com
plet
e se
ctor
al
disa
ggre
gate
d ye
s ye
s ye
s ye
s no
se
nsiti
vity

C
OM
/EN
V/E
POC
/IE
A/S
LT
(200
3)7
59
Cou
ntry
Y
ears
C
ompa
riso
n of
sec
tora
l w
ith
refe
renc
e ap
proa
ch
Com
plet
enes
s O
nly
net
valu
e fo
r L
UC
F
emis
sion
s/
rem
oval
s
Met
hodo
-lo
gies
de
scri
bed
Dat
a so
urce
s de
scri
bed
IPC
C
wor
kshe
ets/
ca
lcul
atio
ns
prov
ided
Des
crip
tion
of
dat
a qu
alit
y
F g
ases
es
tim
ated
C
omm
ents
1994
co
vera
ge
anal
ysis
pe
rfor
med
, as
sum
ptio
ns
desc
ribe
d Is
rael
19
96
no
com
plet
e no
t di
sagg
rega
ted
no
no
no
no
no
natio
nal
inve
ntor
y w
ill b
e up
date
d ev
ery
thre
e ye
ars,
co
untr
y-sp
ecif
ic
EF
for
CH
4 fr
om
cattl
e Jo
rdan
19
94
(par
tly
1990
-19
95)
yes
com
plet
e se
ctor
al
cove
rage
di
sagg
rega
ted
yes
no
yes
no
no
kine
tic a
ppro
ach
for
CH
4 fr
om
land
fills
Kaz
akhs
tan
1990
, 19
94
yes
som
e ag
ricu
ltur
al
and
LU
CF
sour
ces
NE
disa
ggre
gate
d pa
rtly
no
no
ye
s no
Kor
ea
1991
, 19
95
no
indu
stri
al
sect
or
inco
mpl
ete
disa
ggre
gate
d no
no
no
ye
s,
qual
itati
vely
no
em
issi
ons
from
fo
rest
and
gr
assl
and
conv
ersi
on n
ot
esti
mat
ed, C
H4
from
ric
e fi
elds
es
tim
ated
with
co
untr
y-sp
ecif
ic
fact
ors
Mal
aysi
a 19
94
yes
N2O
fro
m m
anur
e m
anag
emen
t N
E,
fore
st f
ires
NE
not
disa
ggre
gate
d pa
rtly
no
no
ye
s no
em
issi
ons
from
fo
rest
fir
es n
ot
esti
mat
ed, N
2O
from
man
ure
man
agem
ent N
E
Mex
ico
1990
, ye
s so
me
indu
stri
al
not
no
part
ly, n
o no
no
no
na
tiona
l EF
and
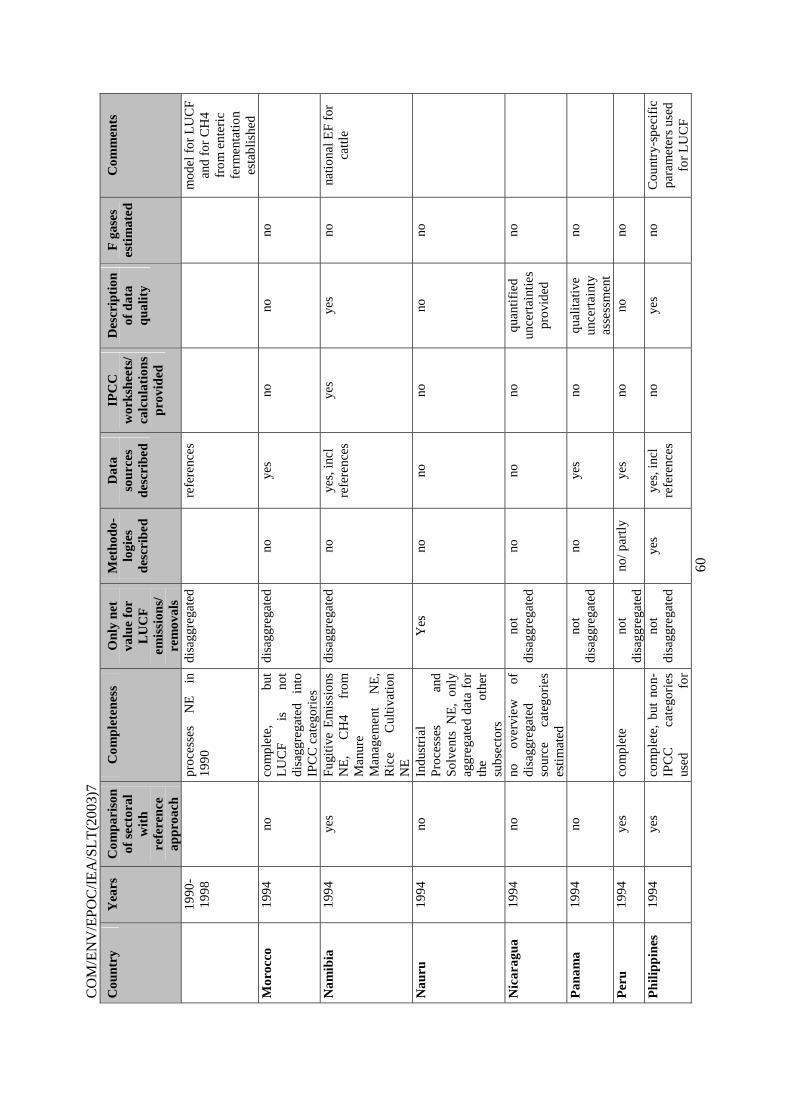
CO
M/E
NV
/EPO
C/I
EA
/SL
T(2
003)
7
60
Cou
ntry
Y
ears
C
ompa
riso
n of
sec
tora
l w
ith
refe
renc
e ap
proa
ch
Com
plet
enes
s O
nly
net
valu
e fo
r L
UC
F
emis
sion
s/
rem
oval
s
Met
hodo
-lo
gies
de
scri
bed
Dat
a so
urce
s de
scri
bed
IPC
C
wor
kshe
ets/
ca
lcul
atio
ns
prov
ided
Des
crip
tion
of
dat
a qu
alit
y
F g
ases
es
tim
ated
C
omm
ents
1990
-19
98
proc
esse
s N
E
in
1990
di
sagg
rega
ted
refe
renc
es
mod
el f
or L
UC
F an
d fo
r C
H4
from
ent
eric
fe
rmen
tatio
n es
tabl
ishe
d M
oroc
co
1994
no
co
mpl
ete,
bu
t L
UC
F is
no
t di
sagg
rega
ted
into
IP
CC
cat
egor
ies
disa
ggre
gate
d no
ye
s no
no
no
Nam
ibia
19
94
yes
Fugi
tive
Em
issi
ons
NE
, C
H4
from
M
anur
e M
anag
emen
t N
E,
Ric
e C
ulti
vatio
n N
E
disa
ggre
gate
d no
ye
s, in
cl
refe
renc
es
yes
yes
no
natio
nal E
F fo
r ca
ttle
Nau
ru
1994
no
In
dust
rial
P
roce
sses
an
d So
lven
ts N
E,
only
ag
greg
ated
dat
a fo
r th
e ot
her
subs
ecto
rs
Yes
no
no
no
no
no
Nic
arag
ua
1994
no
no
ov
ervi
ew
of
disa
ggre
gate
d so
urce
ca
tego
ries
es
tim
ated
not
disa
ggre
gate
d no
no
no
qu
anti
fied
un
cert
aint
ies
prov
ided
no
Pan
ama
1994
no
not
disa
ggre
gate
d no
ye
s no
qu
alita
tive
un
cert
aint
y as
sess
men
t
no
Per
u 19
94
yes
co
mpl
ete
not
disa
ggre
gate
d no
/ par
tly
yes
no
no
no
Phi
lippi
nes
1994
ye
s co
mpl
ete,
but
non
-IP
CC
ca
tego
ries
us
ed
for
not
disa
ggre
gate
d ye
s ye
s, in
cl
refe
renc
es
no
yes
no
Cou
ntry
-spe
cifi
c pa
ram
eter
s us
ed
for
LU
CF
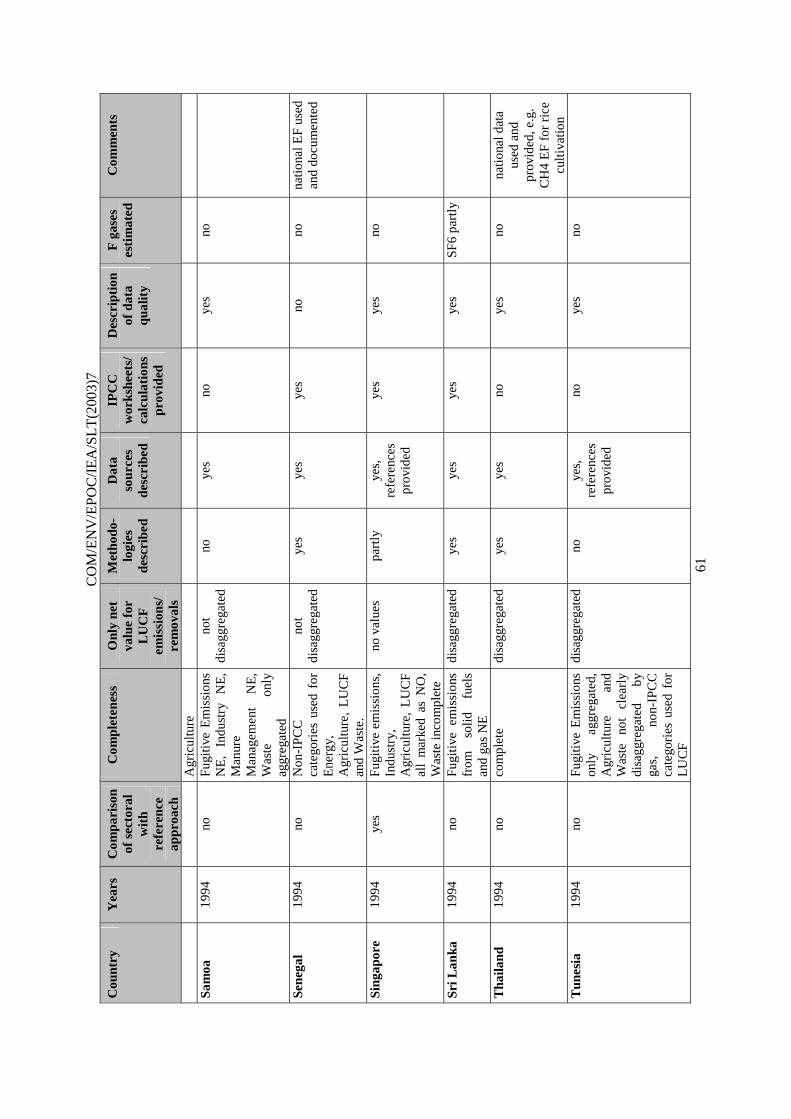
C
OM
/EN
V/E
POC
/IE
A/S
LT
(200
3)7
61
Cou
ntry
Y
ears
C
ompa
riso
n of
sec
tora
l w
ith
refe
renc
e ap
proa
ch
Com
plet
enes
s O
nly
net
valu
e fo
r L
UC
F
emis
sion
s/
rem
oval
s
Met
hodo
-lo
gies
de
scri
bed
Dat
a so
urce
s de
scri
bed
IPC
C
wor
kshe
ets/
ca
lcul
atio
ns
prov
ided
Des
crip
tion
of
dat
a qu
alit
y
F g
ases
es
tim
ated
C
omm
ents
Agr
icul
ture
Sa
moa
19
94
no
Fugi
tive
Em
issi
ons
NE
, In
dust
ry
NE
, M
anur
e M
anag
emen
t N
E,
Was
te
only
ag
greg
ated
not
disa
ggre
gate
d no
ye
s no
ye
s no
Sene
gal
1994
no
N
on-I
PC
C
cate
gori
es u
sed
for
Ene
rgy,
A
gric
ultu
re,
LU
CF
an
d W
aste
.
not
disa
ggre
gate
d ye
s ye
s ye
s no
no
na
tiona
l EF
used
an
d do
cum
ente
d
Sing
apor
e 19
94
yes
Fugi
tive
em
issi
ons,
In
dust
ry,
Agr
icul
ture
, L
UC
F
all
mar
ked
as N
O,
Was
te in
com
plet
e
no v
alue
s pa
rtly
ye
s,
refe
renc
es
prov
ided
yes
yes
no
Sri L
anka
19
94
no
Fugi
tive
em
issi
ons
from
so
lid
fuel
s an
d ga
s N
E
disa
ggre
gate
d ye
s ye
s ye
s ye
s SF
6 pa
rtly
Tha
iland
19
94
no
com
plet
e di
sagg
rega
ted
yes
yes
no
yes
no
natio
nal d
ata
used
and
pr
ovid
ed, e
.g.
CH
4 E
F fo
r ri
ce
culti
vatio
n T
unes
ia
1994
no
Fu
giti
ve E
mis
sion
s on
ly
aggr
egat
ed,
Agr
icul
ture
an
d W
aste
no
t cl
earl
y di
sagg
rega
ted
by
gas,
no
n-IP
CC
ca
tego
ries
use
d fo
r L
UC
F
disa
ggre
gate
d no
ye
s,
refe
renc
es
prov
ided
no
yes
no
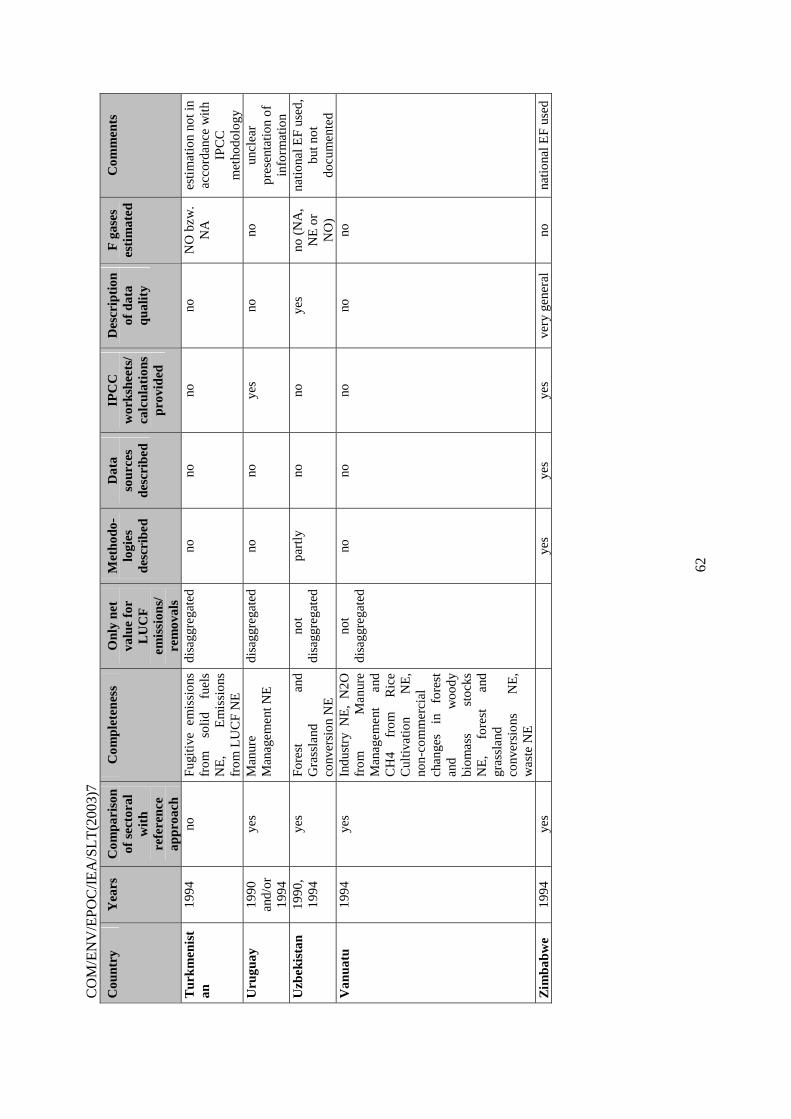
CO
M/E
NV
/EPO
C/I
EA
/SL
T(2
003)
7
62
Cou
ntry
Y
ears
C
ompa
riso
n of
sec
tora
l w
ith
refe
renc
e ap
proa
ch
Com
plet
enes
s O
nly
net
valu
e fo
r L
UC
F
emis
sion
s/
rem
oval
s
Met
hodo
-lo
gies
de
scri
bed
Dat
a so
urce
s de
scri
bed
IPC
C
wor
kshe
ets/
ca
lcul
atio
ns
prov
ided
Des
crip
tion
of
dat
a qu
alit
y
F g
ases
es
tim
ated
C
omm
ents
Tur
kmen
ist
an
1994
no
Fu
giti
ve e
mis
sion
s fr
om
solid
fu
els
NE
, E
mis
sion
s fr
om L
UC
F N
E
disa
ggre
gate
d no
no
no
no
N
O b
zw.
NA
es
tim
atio
n no
t in
acco
rdan
ce w
ith
IPC
C
met
hodo
logy
U
rugu
ay
1990
an
d/or
19
94
yes
Man
ure
Man
agem
ent N
E
disa
ggre
gate
d no
no
ye
s no
no
un
clea
r pr
esen
tatio
n of
in
form
atio
n U
zbek
ista
n 19
90,
1994
ye
s Fo
rest
an
d G
rass
land
co
nver
sion
NE
not
disa
ggre
gate
d pa
rtly
no
no
ye
s no
(N
A,
NE
or
NO
)
natio
nal E
F us
ed,
but n
ot
docu
men
ted
Van
uatu
19
94
yes
Indu
stry
NE
, N
2O
from
M
anur
e M
anag
emen
t an
d C
H4
from
R
ice
Cul
tivat
ion
NE
, no
n-co
mm
erci
al
chan
ges
in
fore
st
and
woo
dy
biom
ass
stoc
ks
NE
, fo
rest
an
d gr
assl
and
conv
ersi
ons
NE
, w
aste
NE
not
disa
ggre
gate
d no
no
no
no
no
Zim
babw
e 19
94
yes
yes
yes
yes
very
gen
eral
no
na
tiona
l EF
used