Current State of Indian Eco - Finance Min (Dec 07)
28
Current State Of Indian Economy December 2007 Federation of Indian Chambers of Commerce and Industry New Delhi
description
CURRENT STATE OF ECONOMY
Transcript of Current State of Indian Eco - Finance Min (Dec 07)

Current State
Of Indian Economy
December 2007
Federa t ion o f Ind ian Chambers o f Commerce and Indust ry New De lh i

1
Executive Summary
Overall Economy : India’s GDP at constant prices for the first half of 2007-08 shows GDP growth maintained the 9 percent plus level. During April-September 2007-08, growth in agriculture, forestry and fisheries picked up by 3.7 percent compared to that of 2.8 percent during the same period of previous year. However the share of agriculture and allied services in GDP slipped to 16 percent from a high 16.8 percent during the same period of previous fiscal. Growth in manufacturing sector slowed in the first half of the current fiscal while the percentage share to GDP was maintained. Share of mining, electricity, manufacturing and construction in GDP inched up against the share in the corresponding period of previous year. Services sector maintained a double-digit growth rate with widening share in GDP compared to that of last year. Industrial Production: During the first seventh-month period of the current fiscal India’s industrial production went up by 9.7 percent compared to 10.1 percent increase registered during the same period of the previous year. Strong overall industrial growth numbers arrived in October 2007 after months of slowdown. This strong growth was mainly led by the manufacturing sector. The capital and intermediate goods recorded an increase in the growth compared to that of the growth posted in the last fiscal. The slowdown was however witnessed in the basic goods. Growth in the consumer goods category picked up in October 2007 in contrast to the negative growth in the same month of the previous fiscal. This high growth is attributed to both the consumer durables and non-durables category. 13 of the 17 industry sectors posted a positive growth and these included the food products, beverages, tobacco, wool, textile, wood products, paper, leather, basic chemicals and rubber, non metallic mineral products, machinery equipment, transport products and other manufactured items. Core Infrastructure Industries : Production growth numbers of the six core infrastructure industries in the first half of the present fiscal stays behind the growth posted in the corresponding period of the previous fiscal. Growth slipped for five-core infrastructure industries compared to that of the previous year. The growth of only power sector exceeded the growth recorded in the previous year Telecommunication: In October 2007 total number of phone connections touched 256 million. The rise in the total phone connections has been mainly on account of adding 7 million connections on an average each month.
2
Inflation : The average inflation numbers up to November 2007 remains within the targeted inflation for the current fiscal. Overall inflation stood at 4.33 percent averaged during April- November period of 2007-08. Some of the primary articles and the fuel prices have mainly contributed in checking inflation. Monetary Indicators: In October 2007 money supply has increased (April-October) by 9 percent compared to the 8 percent increase in the same period of the previous year. Borrowings have dropped both in the government and in commercial sector. Aggregate deposits increased mainly due to the increase in the benefit linked time deposits. Credit off take was witnessed only in the non-food category, decline was witnessed only in the food. CRR has been increased by 50-point basis to 7.5 percent and this step will check the excess liquidity due to foreign capital inflows. Stock Market Trends: Negative signals in some of the major markets have forced the foreign institutional investors to divert their funds in safe havens. Recently the Indian stock market has been primarily pulled by the FI investments, partially fueled by domestic investments. Fiscal Management: Growth in the gross tax collection stood at 25 percent in October2007. The corporation tax collection grew at 43 percent , little lower than the growth rate in the previous year. Tax from the income sources grew at a much higher rate that it recorded in the previous year. While growth in the tax collection from the indirect sources slowed compared to the growth registered in the corresponding period of previous year. Receipts from the revenue in October 2007 was 54 percent of the targeted for 2007-08 . The total expenditure too was little above 50 percent of the 2007-08 target. Merchandise Trade : Merchandise exports for the seven months of this financial year were valued at USD 85.5 billion. The growth during the April- October period of 2007-08 has slowed to 20.8 percent compared to the 34.9 percent in the corresponding period of 2006-07. There was a slippage in the growth of imports to 25.3 percent compared to 32.9 percent in the previous year. Oil imports slowed expected in the first half of the year, however a pick up is expected in the following months as domestic demand for oil products rises in the second half of the fiscal. Comparing the absolute numbers of India’s imports and exports one observes that our trade deficits have widened than ever before. Expected increase in global crude oil prices and slowdown in the global economy might widen the trade deficit even further.
3
Capital Flows : Data on total foreign direct investments shows India received USD 26.6 billion up to September 2007. Of the total FDI USD 18.4 billion came from the portfolio sources and the rest USD 8.2 billion arrived as foreign direct investments. Foreign Exchange Reserves : By the end of October 2007 our foreign exchange reserves touched USD 262.4 billion, surging from USD 200 billion in March 2007. The current level of forex reserves is adequate to meet 15 months of India’s imports. Trends in Exchange Rate: Indian Rupee against the USD further sunk to an average Rs 39.4 in November 2007 from Rs 40.3 in September 2007. November 2007 saw Indian Rupee weaken gradually from a strong Rs 39.32 to Rs 39.67 traded in the concluding sessions of the month. The RBI intervention was observed, maintaining the exchange rate at Rs 39-40 level despite huge foreign exchange inflows. The trend of Indian Rupee vis-a vis Euro was no different from the Rupee-Dollar trend. Rupee too weakened against the Euro as it approached the last trading sessions it averaged at Rs 57.9 and traded at a high / low of Rs 59.21/56.83.

4
Contents
Title Page
1 Industrial Growth 6
2 Core Infrastructure Industries 8
3 Telecom 10
4 Trends in inflation 11
5 Monetary indicators 17
6 Stock Market trends 21
7 Fiscal management 22
8 Foreign trade 24
9 Capital inflows 25
10 Foreign exchange reserves 26
11 Trends in exchange rates 27
5
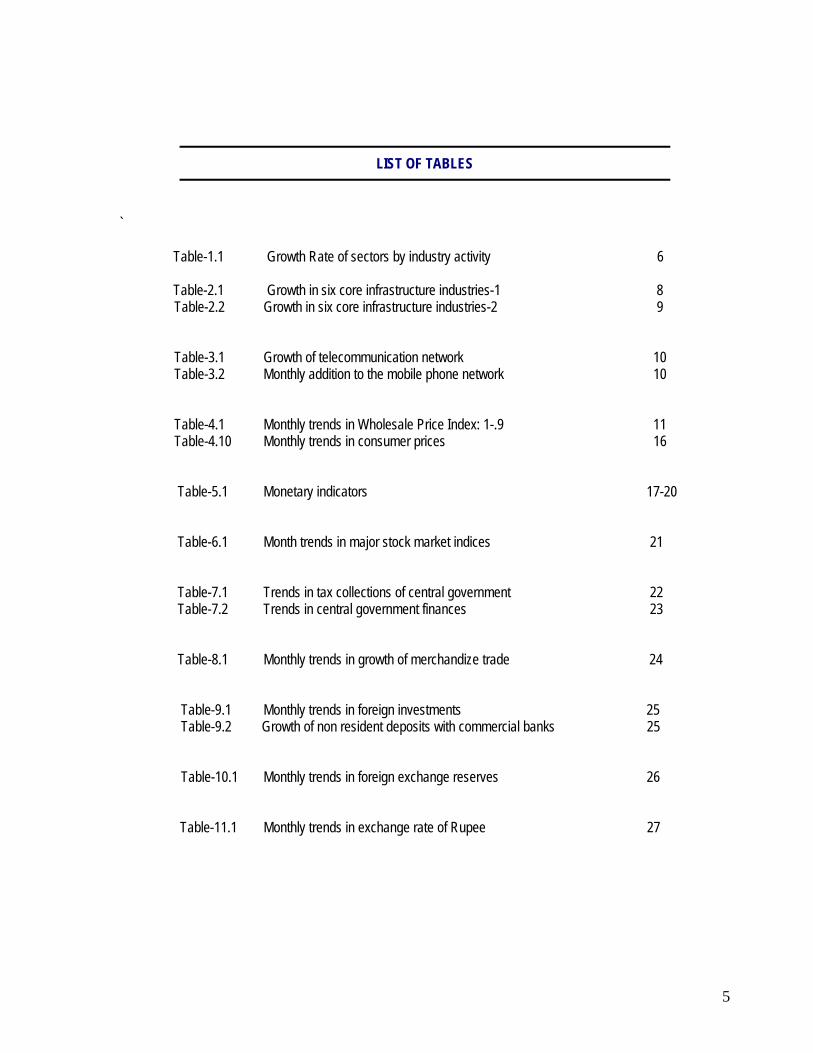
LIST OF TABLES
` Table-1.1 Growth Rate of sectors by industry activity 6 Table-2.1 Growth in six core infrastructure industries-1 8
Table-2.2 Growth in six core infrastructure industries-2 9
Table-3.1 Growth of telecommunication network 10 Table-3.2 Monthly addition to the mobile phone network 10
Table-4.1 Monthly trends in Wholesale Price Index: 1-.9 11 Table-4.10 Monthly trends in consumer prices 16
Table-5.1 Monetary indicators 17-20
Table-6.1 Month trends in major stock market indices 21
Table-7.1 Trends in tax collections of central government 22 Table-7.2 Trends in central government finances 23
Table-8.1 Monthly trends in growth of merchandize trade 24
Table-9.1 Monthly trends in foreign investments 25 Table-9.2 Growth of non resident deposits with commercial banks 25
Table-10.1 Monthly trends in foreign exchange reserves 26 Table-11.1 Monthly trends in exchange rate of Rupee 27

6
Industrial Growth
Index of industrial production during April – October period of 2007-08 is up by 9.7 percent, slightly lower compared to the increase in overall production of 10.1 percent during the seven-month period of 2006-07. After months of slackened growth, strong growth numbers were recorded by the industry during the month of October 2007 11.8 percent compared to that of 4.5 percent in the same month of last fiscal. Manufacturing sector is mainly attributed for the double-digit growth in October 2007 as the sector posted a growth of 13.3 percent as against 3.8 percent in the corresponding month of the previous fiscal. In October 2007 the slowdown was witnessed in the mining and electricity sectors.
Index of capital goods and intermediate goods production have seen a sharp rise in October 2007 compared to the increase in the previous year, where as basic goods production slowed a bit.
Consumer goods have seen a sharp pick up in growth in October 2007 as against the negative growth in the same month a year ago. The rise in the consumer goods index is attributed to record increase in the consumer durables and non-durables category of 9.3 percent and 13.9 percent as against 0.2 percent and –4.1 percent growth in the same month of 2006-07 respectively.
Among the 17 industry sectors, 13 industry sectors posted higher growths compared to the growth in the same month of previous year. Those 13 industry sectors are food products, beverages and tobacco, wool, textile, wood, paper, leather, basic chemicals and rubber, non metallic mineral products, machinery equipment, transport products and other manufactured items. 1.1 - Growth Of Industry: Recent Trends – April-October (in percentage)
Weights FY 2005-06
FY 2006-07
April- October 2006-07
April- October 2007-08
Industry 100 8.2 11.3 10.1 9.7 Mining 10.2 1.0 5.1 3.6 4.8 Manufacturing 79.4 9.1 12.3 11.1 10.4 Electricity 10.5 5.3 7.2 7.1 7.2 Basic 35.6 6.7 10.2 9.1 8.9 Intermediate 26.5 2.5 11.7 10.2 10.5 Capital 9.3 15.8 17.7 15.7 20.1 Consumer Goods 28.7 12.0 10.0 9.3 6.4 Consumer non Durables 23.3 11.0 10.3 8.1 9.3 Consumer Durables 5.4 15.3 9.0 12.7 -1.3 Textile Products 2.5 16.3 11.2 12.6 4.4 Beverages & Tobacco 2.4 15.7 11.3 2.5 9.8 Basic Metals 7.5 15.8 22.8 19.7 17.3

7
Basic Chemicals 14 8.3 9.2 9.0 9.5 Machinery & Equipment 9.6 12.0 14.0 14.4 12.4 Transport Equipment 3.9 12.7 14.9 15.5 3.2 Cotton Textiles 5.5 8.5 14.8 12.3 6.2 Leather 1.1 -4.8 0.3 -6.4 12.0 Paper 2.6 -0.9 8.3 7.5 1.61 Food Products 9.1 2.0 8.2 0.3 11.4 Non metallic mineral products 2.8 11.0 12.8 13.0 9.4 Rubber , Plastic , Petrol and Coal 9.1 4.3 12.7 10.5 11.4 Jute and Other fibre textiles 0.6 0.5 -17.2 1.1 16.1 Wood 2.7 -5.7 29.1 1.4 78.0 Manmade textiles, wool and silk 2.3 0.0 8.2 5.1 5.2 Metal Products and parts 2.8 -1.1 11.4 8.0 -4.3
Source: Central Statistical Organization
8
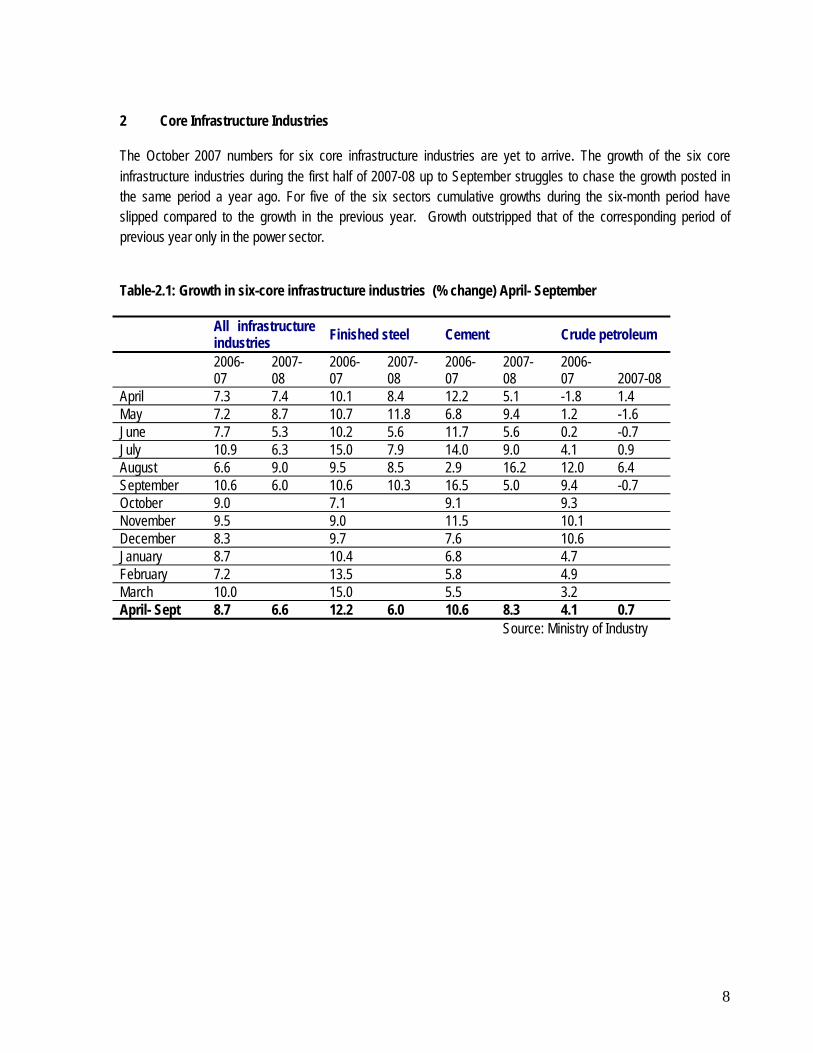
2 Core Infrastructure Industries The October 2007 numbers for six core infrastructure industries are yet to arrive. The growth of the six core infrastructure industries during the first half of 2007-08 up to September struggles to chase the growth posted in the same period a year ago. For five of the six sectors cumulative growths during the six-month period have slipped compared to the growth in the previous year. Growth outstripped that of the corresponding period of previous year only in the power sector. Table-2.1: Growth in six-core infrastructure industries (% change) April- September All infrastructure
industries Finished steel Cement Crude petroleum
2006-07
2007-08
2006-07
2007-08
2006-07
2007-08
2006-07 2007-08
April 7.3 7.4 10.1 8.4 12.2 5.1 -1.8 1.4 May 7.2 8.7 10.7 11.8 6.8 9.4 1.2 -1.6 June 7.7 5.3 10.2 5.6 11.7 5.6 0.2 -0.7 July 10.9 6.3 15.0 7.9 14.0 9.0 4.1 0.9 August 6.6 9.0 9.5 8.5 2.9 16.2 12.0 6.4 September 10.6 6.0 10.6 10.3 16.5 5.0 9.4 -0.7 October 9.0 7.1 9.1 9.3 November 9.5 9.0 11.5 10.1 December 8.3 9.7 7.6 10.6 January 8.7 10.4 6.8 4.7 February 7.2 13.5 5.8 4.9 March 10.0 15.0 5.5 3.2 April- Sept 8.7 6.6 12.2 6.0 10.6 8.3 4.1 0.7 Source: Ministry of Industry

9
Table-2.2: Growth in six-core infrastructure industries (% change) Petroleum refinery Coal Power 2006-07 2007-08 2006-07 2007-08 2006-07 2007-08 April 13.1 15.1 3.4 0.5 5.9 8.7 May 12.1 14.9 8.3 0.9 5.1 9.3 June 10.5 9.8 11.8 1.3 4.9 6.8 July 12.6 4.6 9.1 1.1 8.9 7.5 August 12.1 8.2 0.6 8.7 4.1 8.8 September 13.5 6.9 -0.8 6.2 11.5 4.3 October 18.0 6.1 9.7 November 16.4 4.9 8.8 December 6.1 2.9 9.1 January 9.0 10.0 8.5 February 6.8 6.6 3.3 March 13.4 10.6 8.0 April- Sept 12.3 9.8 5.3 2.8 6.7 7.6
Source: Ministry of Industry

10
3 Telecommunications Total number of phones stood at 256 million in October 2007. The increase in the total phone connection is mainly on account of mobile phone connections that are seeing an increase of about 7 million connections every month. Wired line remains stable at around 40 million Table-3.1 - Growth of the telecommunication network (in million) October Fixed line (including WLL
fixed) Cellular mobile phones (including WLL mobile)
Total phones
1996-97 14.5 0.3 14.9 1997-98 17.8(3.3) 0.9(0.5) 18.7(3.8) 1998-99 21.6(3.8) 1.2(0.3) 22.8(4.2) 1999-00 26.8(5.2) 1.9(0.7) 28.7(5.8) 2000-01 33.0(6.2) 3.6(1.7) 36.6(7.9) 2001-02 39.1(6.2) 6.4(2.9) 45.6(9.0) 2002-03 41.5(2.4) 13.0(6.6) 54.5(8.9) 2003-04 42.6(1.1) 33.6(20.6) 76.2(21.7) 2004-05 45.9(3.3) 52.2(18.6) 98.1(21.9) 2005-06 49.7(3.8) 90.0(37.8) 139.8(41.7) 2006-07 40.71(-9.0) 166.0(76.0) 206.8(67.0) 2007-08 (Oct) 39.41(-1.29) 217.14(51.14) 256.55 (49.75)
Source: Telecom Regulatory Authority of India Table-3.2: Monthly addition to the mobile phone network (in million) 2002 2003 2004 2005 2006 2007 January 0.73 1.64 1.77 4.69 6.78 February 0.79 1.67 1.67 4.28 6.20 March 0.95 1.91 0.73 5.03 3.53 April 0.28 0.64 1.37 1.44 3.88 6.11 May 0.29 2.26 1.33 1.70 4.25 6.57 June 0.35 1.42 1.43 1.98 4.78 7.16 July 0.36 2.31 1.74 2.44 5.28 8.06 August 0.49 1.79 1.67 2.74 5.90 8.31 September 0.37 1.61 1.84 2.48 6.07 7.80 October 0.53 1.67 1.51 2.90 6.71 7.89 November 0.72 1.90 1.56 3.51 6.79 December 0.80 1.90 1.95 4.46 6.40
Source: Telecom Regulatory Authority of India
1 WLL subscribers of all the service providers are now counted as mobile subscribers by TRAI

11
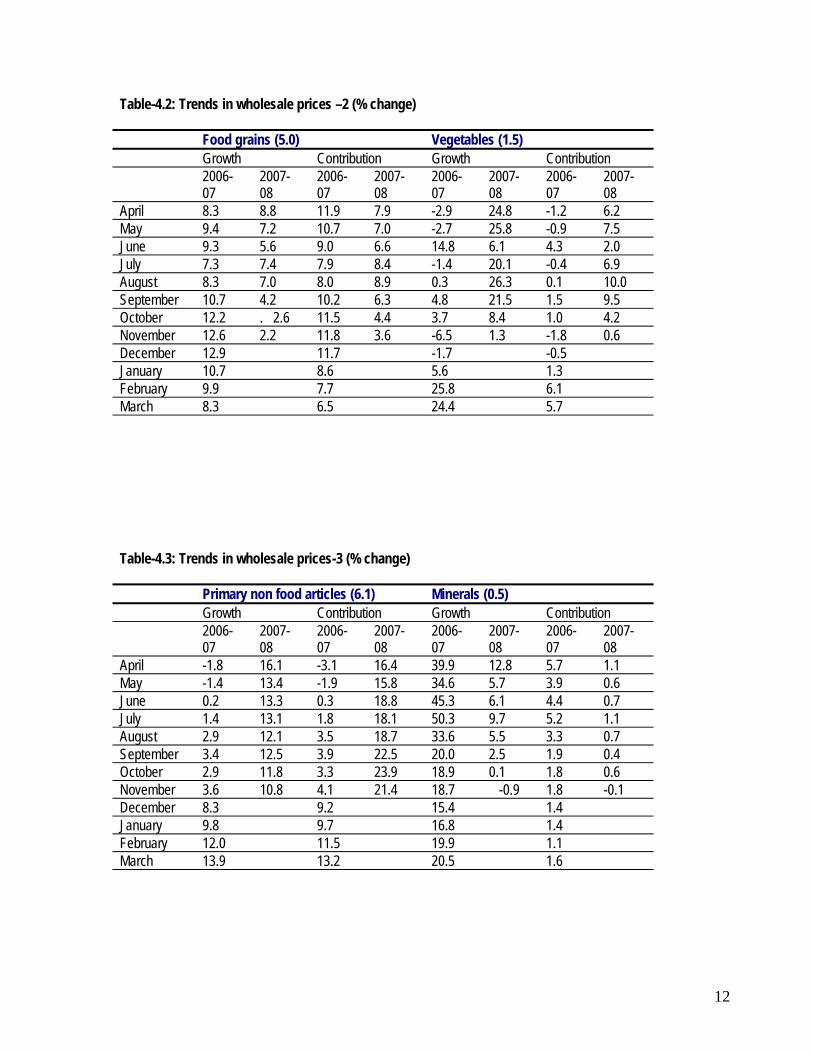
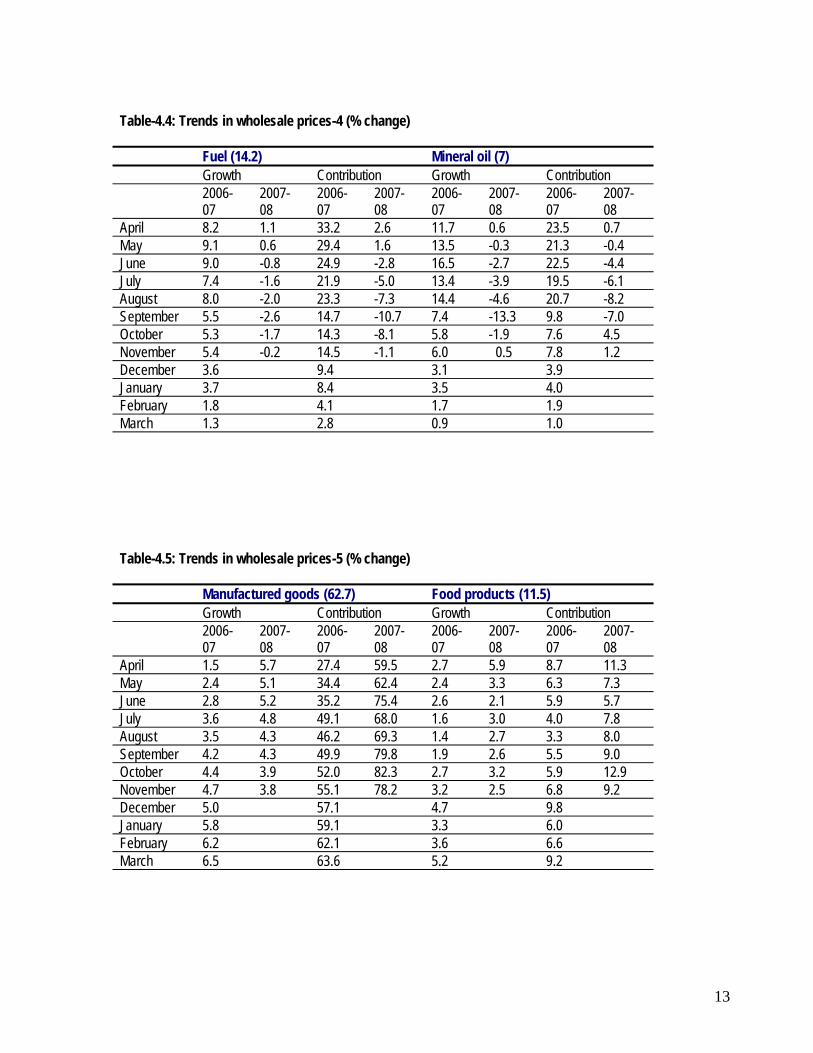
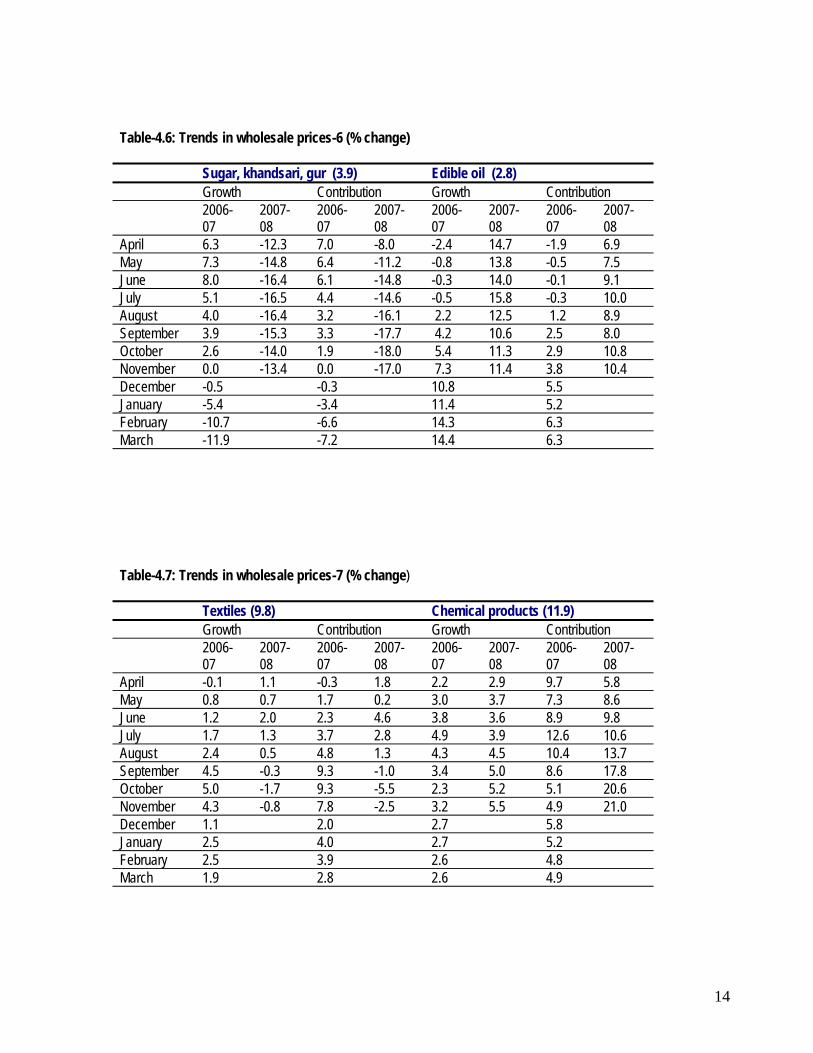
4. Inflation Trends The WPI based inflation averaged for November 2007 was little above 3 percent. In the corresponding month of last year inflation recorded was 5.5%. Wholesale price index fell below 4 percent since September 2007. However, money supply is running in excess of the RBI target and this may resist in controlling inflation. The articles that aided in keeping the WPI based inflation within reasonable boundaries were, primary - food articles, mainly the pulses, fruits and condiments. Price index of fuel, power, light and lubricants was seen to drop compared to the index in the corresponding month of last year. Manufactured segment inflation however slowed to 3.8 percent as against 5.2 percent rise in manufactured price index in which only textiles represented fall in the prices compared to that of last year. The items that became dearer were the primary non-food articles and among the manufactured segment were leather, wood and chemicals products. Table-4.1: Trends in wholesale prices-1 (% change) All commodities (100) Primary food articles (15.4) Growth Contribution Growth Contribution 2006-
07 2007-08
2006-07
2007-08
2006-07
2007-08
2006-07
2007-08
April 3.5 6.0 100 100 4.6 8.6 20.2 22.0 May 4.4 5.2 100 100 6.9 8.6 22.8 26.3 June 5.1 4.3 100 100 8.2 5.5 24.8 19.5 July 4.8 4.4 100 100 4.4 8.5 14.9 29.6 August 5.1 4.1 100 100 5.2 8.3 16.0 32.5 September 5.3 3.3 100 100 9.0 5.4 25.8 24.7 October 5.3 3.0 100 100 8.7 3.4 25.3 17.5 November 5.3 3.1 100 100 7.4 2.7 21.5 13.4 December 5.5 100 8.7 24.4 January 6.2 100 9.5 23.6 February 6.4 100 10.9 26.2 March 6.4 100 10.5 25.3
12
Table-4.2: Trends in wholesale prices –2 (% change) Food grains (5.0) Vegetables (1.5) Growth Contribution Growth Contribution 2006-
07 2007-08
2006-07
2007-08
2006-07
2007-08
2006-07
2007-08
April 8.3 8.8 11.9 7.9 -2.9 24.8 -1.2 6.2 May 9.4 7.2 10.7 7.0 -2.7 25.8 -0.9 7.5 June 9.3 5.6 9.0 6.6 14.8 6.1 4.3 2.0 July 7.3 7.4 7.9 8.4 -1.4 20.1 -0.4 6.9 August 8.3 7.0 8.0 8.9 0.3 26.3 0.1 10.0 September 10.7 4.2 10.2 6.3 4.8 21.5 1.5 9.5 October 12.2 . 2.6 11.5 4.4 3.7 8.4 1.0 4.2 November 12.6 2.2 11.8 3.6 -6.5 1.3 -1.8 0.6 December 12.9 11.7 -1.7 -0.5 January 10.7 8.6 5.6 1.3 February 9.9 7.7 25.8 6.1 March 8.3 6.5 24.4 5.7 Table-4.3: Trends in wholesale prices-3 (% change) Primary non food articles (6.1) Minerals (0.5) Growth Contribution Growth Contribution 2006-
07 2007-08
2006-07
2007-08
2006-07
2007-08
2006-07
2007-08
April -1.8 16.1 -3.1 16.4 39.9 12.8 5.7 1.1 May -1.4 13.4 -1.9 15.8 34.6 5.7 3.9 0.6 June 0.2 13.3 0.3 18.8 45.3 6.1 4.4 0.7 July 1.4 13.1 1.8 18.1 50.3 9.7 5.2 1.1 August 2.9 12.1 3.5 18.7 33.6 5.5 3.3 0.7 September 3.4 12.5 3.9 22.5 20.0 2.5 1.9 0.4 October 2.9 11.8 3.3 23.9 18.9 0.1 1.8 0.6 November 3.6 10.8 4.1 21.4 18.7 -0.9 1.8 -0.1 December 8.3 9.2 15.4 1.4 January 9.8 9.7 16.8 1.4 February 12.0 11.5 19.9 1.1 March 13.9 13.2 20.5 1.6
13
Table-4.4: Trends in wholesale prices-4 (% change) Fuel (14.2) Mineral oil (7) Growth Contribution Growth Contribution 2006-
07 2007-08
2006-07
2007-08
2006-07
2007-08
2006-07
2007-08
April 8.2 1.1 33.2 2.6 11.7 0.6 23.5 0.7 May 9.1 0.6 29.4 1.6 13.5 -0.3 21.3 -0.4 June 9.0 -0.8 24.9 -2.8 16.5 -2.7 22.5 -4.4 July 7.4 -1.6 21.9 -5.0 13.4 -3.9 19.5 -6.1 August 8.0 -2.0 23.3 -7.3 14.4 -4.6 20.7 -8.2 September 5.5 -2.6 14.7 -10.7 7.4 -13.3 9.8 -7.0 October 5.3 -1.7 14.3 -8.1 5.8 -1.9 7.6 4.5 November 5.4 -0.2 14.5 -1.1 6.0 0.5 7.8 1.2 December 3.6 9.4 3.1 3.9 January 3.7 8.4 3.5 4.0 February 1.8 4.1 1.7 1.9 March 1.3 2.8 0.9 1.0 Table-4.5: Trends in wholesale prices-5 (% change) Manufactured goods (62.7) Food products (11.5) Growth Contribution Growth Contribution 2006-
07 2007-08
2006-07
2007-08
2006-07
2007-08
2006-07
2007-08
April 1.5 5.7 27.4 59.5 2.7 5.9 8.7 11.3 May 2.4 5.1 34.4 62.4 2.4 3.3 6.3 7.3 June 2.8 5.2 35.2 75.4 2.6 2.1 5.9 5.7 July 3.6 4.8 49.1 68.0 1.6 3.0 4.0 7.8 August 3.5 4.3 46.2 69.3 1.4 2.7 3.3 8.0 September 4.2 4.3 49.9 79.8 1.9 2.6 5.5 9.0 October 4.4 3.9 52.0 82.3 2.7 3.2 5.9 12.9 November 4.7 3.8 55.1 78.2 3.2 2.5 6.8 9.2 December 5.0 57.1 4.7 9.8 January 5.8 59.1 3.3 6.0 February 6.2 62.1 3.6 6.6 March 6.5 63.6 5.2 9.2
14
Table-4.6: Trends in wholesale prices-6 (% change) Sugar, khandsari, gur (3.9) Edible oil (2.8) Growth Contribution Growth Contribution 2006-
07 2007-08
2006-07
2007-08
2006-07
2007-08
2006-07
2007-08
April 6.3 -12.3 7.0 -8.0 -2.4 14.7 -1.9 6.9 May 7.3 -14.8 6.4 -11.2 -0.8 13.8 -0.5 7.5 June 8.0 -16.4 6.1 -14.8 -0.3 14.0 -0.1 9.1 July 5.1 -16.5 4.4 -14.6 -0.5 15.8 -0.3 10.0 August 4.0 -16.4 3.2 -16.1 2.2 12.5 1.2 8.9 September 3.9 -15.3 3.3 -17.7 4.2 10.6 2.5 8.0 October 2.6 -14.0 1.9 -18.0 5.4 11.3 2.9 10.8 November 0.0 -13.4 0.0 -17.0 7.3 11.4 3.8 10.4 December -0.5 -0.3 10.8 5.5 January -5.4 -3.4 11.4 5.2 February -10.7 -6.6 14.3 6.3 March -11.9 -7.2 14.4 6.3 Table-4.7: Trends in wholesale prices-7 (% change) Textiles (9.8) Chemical products (11.9) Growth Contribution Growth Contribution 2006-
07 2007-08
2006-07
2007-08
2006-07
2007-08
2006-07
2007-08
April -0.1 1.1 -0.3 1.8 2.2 2.9 9.7 5.8 May 0.8 0.7 1.7 0.2 3.0 3.7 7.3 8.6 June 1.2 2.0 2.3 4.6 3.8 3.6 8.9 9.8 July 1.7 1.3 3.7 2.8 4.9 3.9 12.6 10.6 August 2.4 0.5 4.8 1.3 4.3 4.5 10.4 13.7 September 4.5 -0.3 9.3 -1.0 3.4 5.0 8.6 17.8 October 5.0 -1.7 9.3 -5.5 2.3 5.2 5.1 20.6 November 4.3 -0.8 7.8 -2.5 3.2 5.5 4.9 21.0 December 1.1 2.0 2.7 5.8 January 2.5 4.0 2.7 5.2 February 2.5 3.9 2.6 4.8 March 1.9 2.8 2.6 4.9

15
Table-4.8: Trends in wholesale prices-8 (% change) Drugs & medicines (2.5) Cement (6.2) Growth Contribution Growth 2006-
07 2007-08
2006-07
2007-08
2006-07
2007-08
2006-07
2007-08
April 7.2 5.8 4.7 2.4 16.3 10.5 26.3 10.9 May 7.3 6.2 3.8 3.0 18.1 9.5 23.6 11.4 June 7.2 6.7 3.5 3.9 18.8 10.1 22.4 14.5 July 6.6 8.3 3.6 4.7 19.6 10.6 25.7 14.9 August 5.9 8.2 3.0 5.2 19.4 10.5 24.4 16.5 September 5.9 8.2 3.2 6.1 18.1 11.3 21.4 23.8 October 5.5 7.7 2.6 6.4 18.6 11.3 21.1 20.3 November 3.6 8.4 1.7 6.8 19.9 10.5 22.8 21.0 December 3.5 1.6 21.9 22.8 January 2.7 1.1 18.0 17.5 February 3.3 1.3 15.0 14.9 March 5.8 2.3 16.1 14.9 Table-4.9: Trends in wholesale prices-9 (% change) Iron and steel (3.6) Machinery & equipment (8.4) Growth Contribution Growth Contribution 2006-
07 2007-08
2006-07
2007-08
2006-07
2007-08
2006-07
2007-08
April -5.5 7.7 -5.1 4.6 3.3 7.9 7.1 11.2 May -5.6 8.9 -4.6 6.2 3.2 8.2 5.7 13.3 June -5.7 10.1 -4.0 8.5 3.7 8.5 6.0 16.3 July -1.7 6.9 -0.4 5.6 4.0 8.7 -1.4 16.6 August -1.3 5.5 -0.9 5.0 4.3 7.8 -1.2 16.6 September -1.2 7.1 -1.5 7.6 4.1 7.8 5.6 19.5 October 0.3 6.7 0.2 8.1 5.1 6.8 8.1 19.1 November 0.9 7.0 0.5 8.2 6.3 7.0 10.0 19.0 December 1.1 0.7 7.7 11.1 January 12.3 7.2 7.9 10.7 February 15.4 3.6 7.8 10.3 March 15.4 8.6 8.4 11.0 Source : Reserve Bank of India

16
Table-4.10: Monthly trends in consumer prices (% change) CPI-IW CPI-UNME CPI-AL CPI-RL 2006-
07 2007-08
2006-07
2007-08
2006-07
2007-08
2006-07
2007-08
April 5.0 6.7 5.2 7.7 5.6 9.4 5.2 9.1 May 6.3 6.6 5.8 6.8 6.4 8.2 6.4 7.9 June 7.7 5.7 6.5 6.1 7.2 7.4 7.2 7.5 July 6.7 6.5 5.7 6.9 6.3 8.6 5.9 8.0 August 6.3 7.3 6.1 6.4 6.5 8.8 6.2 8.5 September 6.8 6.4 6.6 5.7 7.3 7.9 7.0 7.6 October 7.3 7.2 8.4 8.1 November 6.3 6.7 8.3 8.0 December 6.9 6.9 8.9 8.3 January 6.7 7.4 9.5 8.9 February 7.6 7.8 9.8 9.5 March 6.7 NA 9.5 9.2 April-Sept
6.5 6.5 6.0 6.6 6.6 8.5 6.3 8.1
Source: Ministry of Labor, Center for Monitoring Indian Economy

17
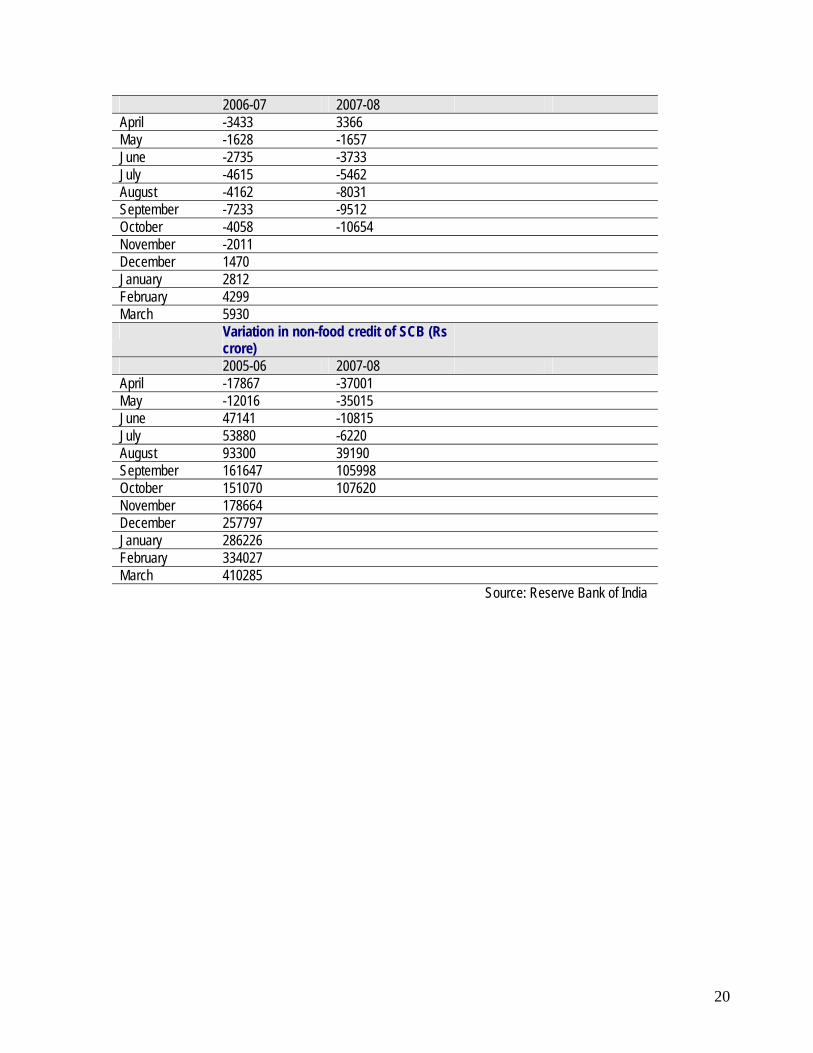
5 Monetary Indicators Money supply continues to widen. Money supply calculated for October 2007 since end March 2007 shows an increase of 9 percent compared to that of 8 percent increase in the same period of last year. Growth in the bank credit to the government and commercial sector slid compared to the percentage increase in the previous year. Large inflows have led to swelling of net foreign exchange assets of the banks that grew by 16.9 percent against 10.3 percent in the last fiscal. This has increased M3 over the targeted level for the present fiscal ( YoY basis). The good part was negative growth in the Non monetary liabilities of banks. Aggregate deposits have picked up faster than the last year and this came after the RBI attached host of benefits to time deposits. Investments in the government and other approved securities have also shown higher increase compared to last year’s. Credit off take was seen to divert towards the non-food category. CRR has been increased by 50 basis points to 7.5%, a measure to check excess liquidity due to foreign capital inflows. Policy rates however remain unaltered.
Table-5.1: Monetary sector indicators – upto October Variation in M3 (Rs crore) Variation in M3 (%) 2006-07 2007-08 2006-07 2007-08 April 42834 24852 1.6 1.8 May 49734 28328 1.8 0.9 June 55411 78638 2.0 2.4 July 106964 140792 4.0 4.3 August 166054 165806 6.1 5.0 September 223812 264149 8.2 8.0 October 216784 297906 7.9 9.0 November 222433 8.1 December 289087 10.6 January 380403 13.9 February 458241 16.8 March 566096 20.7 Variation in net bank credit to
government (Rs crore) Variation in net bank credit to government (%)
2006-07 2007-08 2006-07 2007-08 April 38413 32071 5.0 3.9 May 27727 25887 3.6 3.1 June 23431 18976 3.1 2.3 July 38221 74427 5.0 8.9 August 34787 40458 4.5 4.8 September 37606 34501 4.9 4.1 October 43203 14584 5.6 1.7 November 37129 4.8 December 20264 2.6

18
January 39672 5.2 February 50355 6.5 March 59108 7.7 Variation in bank credit to commercial
sector (Rs crore) Variation in bank credit to commercial sector (%)
2006-07 2007-08 2006-07 2007-08 April -20751 -33982 -1.2 -1.6 May -13066 -39111 -0.8 -1.8 June 14930 -25063 0.9 -1.2 July 44262 -5445 2.6 0.3 August 92023 39877 5.4 1.9 September 159135 108519 9.4 5.1 October 152669 108937 9.0 5.1 November 186019 11.0 December 236849 14.0 January 302764 17.9 February 352913 20.9 March 430287 25.4 Variation in net foreign exchange
assets of banks (Rs crore) Variation in net foreign exchange assets of banks (%)
2006-07 2007-08 2006-07 2007-08 April 46064 -29024 6.3 -3.0 May 68341 -35519 9.4 -3.8 June 58087 -2745 8.0 -0.3 July 74130 27735 10.2 3.0 August 84213 69317 11.6 7.6 September 78283 101485 10.8 11.1 October 75137 153944 10.3 16.9 November 85678 11.8 December 105533 14.5 January 113834 15.7 February 181829 25.0 March 204124 28.9 Variation in non-monetary liabilities of
banks (Rs crore) Variation in non-monetary liabilities of banks (%)
2006-07 2007-08 2006-07 2007-08 April 19859 -54687 4.3 -9.1 May 32289 -77071 6.9 -12.9 June 40117 -87299 8.6 -15.2 July 48810 -43905 10.5 7.7 August 44146 -16138 9.5 -2.8 September 50447 -19238 10.8 3.4 October 53524 -20033 11.5 -3.5 November 47843 10.3 December 72859 15.7 January 75166 16.1 February 126156 27.1 March 126898 27.0

19
Variation of aggregate deposits of SCB (Rs crore)
Variation in aggregate deposits of SCB (%)
2006-07 2007-08 2006-07 2007-08 April 25689 5857 1.2 0.2 May 27960 14406 1.3 0.6 June 84185 94550 4.0 3.6 July 94504 162203 4.6 6.2 August 146525 163715 6.9 6.3 September 202662 255988 9.6 9.8 October 177849 269646 8.4 10.3 November 222323 10.5 December 279343 13.2 January 317655 15.1 February 383805 18.2 March 485210 18.1 23.0 Variation in investments of SCB (Rs
crore) Variation in investments of SCB (%)
2006-07 2007-08 2006-07 2007-08 April 29377 17598 4.1 2.2 May 28381 24897 4.0 3.1 June 37432 57456 5.2 7.3 July 43784 81850 6.1 10.4 August 48807 114420 6.8 14.5 September 33355 117515 4.6 14.9 October 40054 158860 5.6 20.1 November 47906 6.7 December 27600 3.8 January 40103 5.6 February 84481 11.8 March 74706 10.4 Variation in total credit of SCB (Rs
crore) Variation in total credit of SCB (%)
2006-07 2007-08 2006-07 2007-08 April -21299 -33645 -1.4 -1.7 May -13644 -36672 -0.9 -1.9 June 44406 -14549 2.9 -0.8 July 49266 -11682 3.3 -0.6 August 89137 31159 5.9 1.6 September 154414 96486 10.2 5.0 October 147012 96966 9.8 5.0 November 176653 11.7 December 259267 17.2 January 289038 19.2 February 339326 22.5 March 416115 27.6 Variation in food credit of SCB (Rs
crore)
20
2006-07 2007-08 April -3433 3366 May -1628 -1657 June -2735 -3733 July -4615 -5462 August -4162 -8031 September -7233 -9512 October -4058 -10654 November -2011 December 1470 January 2812 February 4299 March 5930 Variation in non-food credit of SCB (Rs
crore)
2005-06 2007-08 April -17867 -37001 May -12016 -35015 June 47141 -10815 July 53880 -6220 August 93300 39190 September 161647 105998 October 151070 107620 November 178664 December 257797 January 286226 February 334027 March 410285
Source: Reserve Bank of India

21
6 Stock Market Trends
Negative signals in some of the major markets have forced the foreign institutional investors to divert their funds in safe havens. Recently the Indian stock market has been primarily pulled by the FI investments, partially fueled by domestic investments. The 30 stock index sensex neared 19724 points, rising by over 15 percentage points over the previous month’s close. The NSE index Nifty was seen some 100 points behind from touching the 6000 mark. Table-6.1: Monthly trends in stock market indices (beginning of month figures) Date BSE Sensex % Change S&P CNX NIFTY % Change 1.1.05 6679 7.2 2115 7.8 1.2.05 6552 -1.9 2058 -2.7 1.3.05 6651 1.5 2084 1.3 1.4.05 6605 -0.7 2068 -0.8 1.5.05 6195 -6.2 1917 -7.3 1.6.05 6730 8.6 2088 8.9 1.7.05 7210 7.1 2211 5.9 1.8.05 7669 6.4 2318 4.8 1.9.05 7876 2.7 2406 3.8 1.10.05 8492 7.8 2574 6.9 1.11.05 7944 -6.5 2387 -7.3 1.12.05 8944 12.5 2699 4.8 2.01.06 9390 5.0 2835 5.0 1.02.06 9859 5.0 2971 4.8 1.03.06 10566 7.7 3123 5.1 3.04.06 11564 9.4 3473 11.2 1.05.06 12128 4.9 3605 3.8 1.06.06 10071 -17.0 2962 -17.8 3.07.06 10695 6.1 3150 6.3 1.08.06 10751 0.5 3147 -0.1 1.09.06 11778 9.5 3435 9.1 3.10.06 12366 5.0 3569 3.9 1.11.06 13033 5.4 3767 5.5 1.12.06 13844 6.2 3997 6.1 2.01.07 13942 0.7 4007 0.3 1.02.07 14267 2.3 4137 3.2 1.03.07 13159 -7.7 3811 -7.8 2.04.07 12455 -5.3 3633 -4.7 3.05.07 14078 13.0 4150 14.2 1.06.07 14570 3.5 4297 3.5 2.07.07 14664 0.6 4313 0.4 1.08.07 14935 1.8 4345 0.7 3.09.07 15422 3.2 4474 2.9 1.10.07 17328 12.3 5068 13.2 1.11.07 19724 15.7 5866 13.8 Source: Reserve Bank of India

22
7 Fiscal Trends Growth in the gross tax collection in October stays roughly at 25%. It has been observed that collection rate in the same months of the previous fiscal ( 2006-07) has been higher compared to increase this year. Corporation tax collection rate has was 43 percent in October 2007 this remained slightly behind the previous month’s rate of collection. However increase in the income tax collection paced faster during the October month of 2007-08 than the corresponding months of previous year. The direct tax (Corporation and Income tax) accounts for 46 percent of the total tax collected. In October 2007 growth in the indirect tax collection, customs, excise and other taxes slowed compared to the growth in October 2006-07. Rate of collection of taxes from customs witnessed slowdown from May 2007, while in the case of excise a slowdown in the collection rate was witnessed from July 2007. Other taxes increased at a lower rate compared to that of last year. Revenue receipt in the 7th month of this fiscal was 54.1 percent of the targeted figure for 2007-08, and total expenditure neared 60 percent of the budgeted during the period. Table-7.1: Trends in cumulative tax collections of central government (%) Gross tax revenue Corporation tax Income tax 2006-07 2007-08 2006-07 2007-08 2006-07 2007-08 April 128.3 5.4 238.6 -36.2 40.5 -4.1 May 40.0 35.0 271 231.8 35.4 22.1 June 32.1 28.1 50.0 48.2 29.3 25.6 July 35.0 25.7 80.6 49.3 31.9 32.4 August 32.0 24.1 71.2 46.1 27.3 34.4 September 30.5 24.5 49.2 38.6 24.3 35.3 October 29.8 25.8 47.5 43.0 28.5 34.5 November 31.1 53.8 27.8 December 32.2 55.2 27.0 January 31.5 50.1 27.8 February 29.6 44.1 29.9 March 29.3 41.6 35.4 Customs Excise duties Other taxes 2006-07 2007-08 2006-07 2007-08 2006-07 2007-08 April 17.9 30.1 -42.7 29.6 69.6 29.6 May 25.8 23.1 0.5 13.5 75.1 37.1 June 31.9 19.8 6.6 11.3 81.0 43.5 July 32.7 19.6 6.2 6.3 69.3 32.1 August 33.1 18.6 6.9 4.9 66.4 33.9 September 32.7 15.8 7.4 3.4 63.7 40.2 October 31.3 18.2 7.1 3.8 58.4 37.4 November 33.6 6.7 61.7 December 32.9 6.8 64.3

23
January 33.4 7.7 60.9 February 34.4 5.8 59.7 March 32.7 5.8 NA
Source: Controller General of Accounts Table-7.2 Trends in central government finances: April-October Actual to budget estimates
( in Rs crores) Growth (%) YoY 2006-07 2007-08 2006-07 2007-08 Revenue receipts 196474 246546 26.8 25.5 Tax revenue 155660 195339 33.8 25.5 Non tax revenue 40814 51207 5.7 25.5 Non debt capital receipts 5695 40100 5.8 604.1 Recovery of loans 5695 2400 6.1 -57.9 Total receipts 202169 286646 26.1 41.8 Non plan expenditure 214017 269549 17.4 25.9 On revenue account 200666 223797 17.2 11.5 On capital account 13351 45752 20.2 242.7 Plan expenditure 75252 99353 7.4 32.0 On revenue account 63107 80311 16.8 27.3 On capital account 12145 19042 -24.4 56.8 Total expenditure 289269 368902 14.6 27.5 Fiscal deficit 87100 82256 -5.4 -5.6 Revenue deficit 67299 57562 -4.2 -14.5 Primary deficit 12950 -7727 -55.1 -159.7
Source: Controller General of Accounts

24
8 Foreign Trade Cumulative merchandise exports from April to October 2007-08 stood at USD 85.5 billion. Growth recorded during the April- October period of 2007-08 has been 20.8 percent compared to the 34.9 percent growth rate in the corresponding period of 2006-07. Growth in Imports slipped to 25.3 percent compared to 32.9 percent in the previous year. The oil import bill is too seen shrink during the months of the current fiscal, however it is expected to pick up in the following months as domestic demand for oil products rises in the second half of the fiscal. The recently released numbers on merchandise exports for the month of October 2007 show an increase by 35 percent. Such an increase would be needed to achieve the exports targets for the current fiscal. During the month of October trade deficit is seen to increase even more USD 7.4 billion. In the coming months the trade gap may widen due to increase in the global crude oil price s and slowdown in the global economy. Detailed numbers on merchandise exports available from April- June 2007-08 show higher growth compared to that of April-June last year in the exports of rice, spices and iron ore in the primary category and gems and jewelry in the manufactured goods. Negative growth was seen in the exports of tea, coffee, wheat, sugar, marine products, and cashew, processed minerals in the primary products group and textiles and handicrafts in the manufactured products group. Table-8.1: Monthly trends in growth of merchandize trade (% change) Exports Oil imports Non-oil imports Total imports 2006-
07 2007-08 2006-
07 2007-08
2006-07
2007-08 2006-07
2007-08
April 27.0 23.0 34.6 11.4 14.5 54.2 20.5 40.6 May 29.6 18.0 27.3 2.9 19.2 41.5 21.6 26.3 June 40.1 14.0 55.6 9.8 9.8 52.2 23.9 36.6 July 40.6 18.5 32.8 8.7 20.4 25.8 42.8 20.4 August 20.5 18.9 27.2 19.5 4.4 39.5 11.6 32.6 September 41.2 19.2 25.8 7.9 24.3 0.1 49.1 2.3 October 19.0 35.6 55.4 14.5 28.9 28.8 39.3 24.2 November 57.0 48.3 40.4 36.5 December 7.7 43.3 31.2 21.9 January 5.5 15.0 27.3 23.2 February 7.8 -1.1 39.7 25.1 March 8.8 9.3 16.5 14.4 April-Oct 34.9 20.8 34.9 9.2 13.5 33.2 32.9 25.3 Source: Ministry of Commerce
25
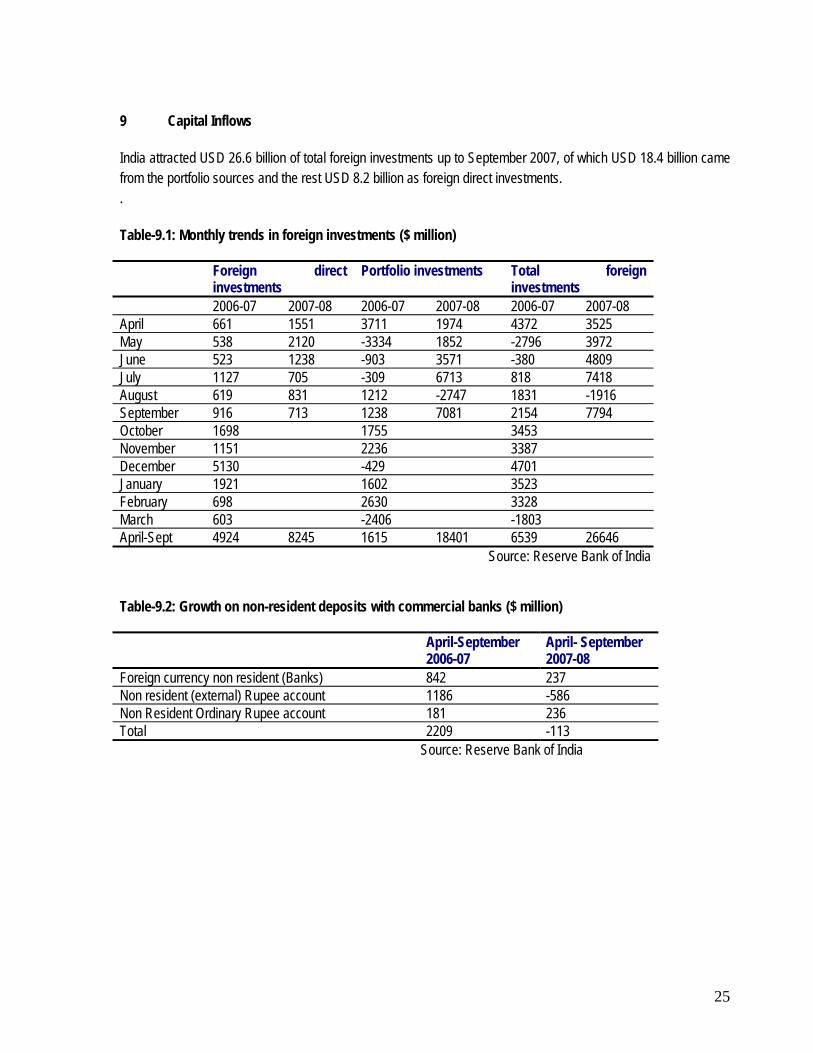
9 Capital Inflows India attracted USD 26.6 billion of total foreign investments up to September 2007, of which USD 18.4 billion came from the portfolio sources and the rest USD 8.2 billion as foreign direct investments. . Table-9.1: Monthly trends in foreign investments ($ million) Foreign direct
investments Portfolio investments Total foreign
investments 2006-07 2007-08 2006-07 2007-08 2006-07 2007-08 April 661 1551 3711 1974 4372 3525 May 538 2120 -3334 1852 -2796 3972 June 523 1238 -903 3571 -380 4809 July 1127 705 -309 6713 818 7418 August 619 831 1212 -2747 1831 -1916 September 916 713 1238 7081 2154 7794 October 1698 1755 3453 November 1151 2236 3387 December 5130 -429 4701 January 1921 1602 3523 February 698 2630 3328 March 603 -2406 -1803 April-Sept 4924 8245 1615 18401 6539 26646 Source: Reserve Bank of India Table-9.2: Growth on non-resident deposits with commercial banks ($ million) April-September
2006-07 April- September 2007-08
Foreign currency non resident (Banks) 842 237 Non resident (external) Rupee account 1186 -586 Non Resident Ordinary Rupee account 181 236 Total 2209 -113 Source: Reserve Bank of India
26
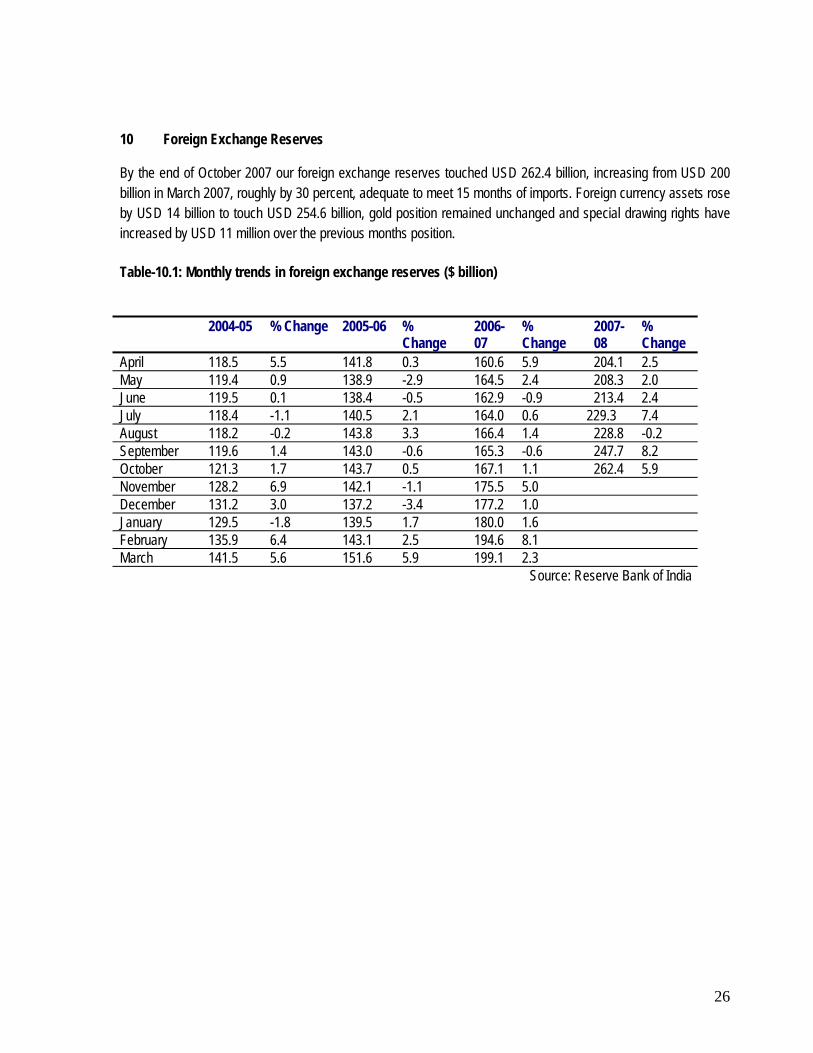
10 Foreign Exchange Reserves By the end of October 2007 our foreign exchange reserves touched USD 262.4 billion, increasing from USD 200 billion in March 2007, roughly by 30 percent, adequate to meet 15 months of imports. Foreign currency assets rose by USD 14 billion to touch USD 254.6 billion, gold position remained unchanged and special drawing rights have increased by USD 11 million over the previous months position.
Table-10.1: Monthly trends in foreign exchange reserves ($ billion)
2004-05 % Change 2005-06 %
Change 2006-07
% Change
2007-08
% Change
April 118.5 5.5 141.8 0.3 160.6 5.9 204.1 2.5 May 119.4 0.9 138.9 -2.9 164.5 2.4 208.3 2.0 June 119.5 0.1 138.4 -0.5 162.9 -0.9 213.4 2.4 July 118.4 -1.1 140.5 2.1 164.0 0.6 229.3 7.4 August 118.2 -0.2 143.8 3.3 166.4 1.4 228.8 -0.2 September 119.6 1.4 143.0 -0.6 165.3 -0.6 247.7 8.2 October 121.3 1.7 143.7 0.5 167.1 1.1 262.4 5.9 November 128.2 6.9 142.1 -1.1 175.5 5.0 December 131.2 3.0 137.2 -3.4 177.2 1.0 January 129.5 -1.8 139.5 1.7 180.0 1.6 February 135.9 6.4 143.1 2.5 194.6 8.1 March 141.5 5.6 151.6 5.9 199.1 2.3
Source: Reserve Bank of India

27
11 Trends in the Exchange Rates Indian Rupee against the USD further sunk to an average Rs 39.4 in November 2007 from Rs 40.3 in September 2007. November 2007 saw Indian Rupee weaken gradually from a strong Rs 39.32 to Rs 39.67 traded in the concluding session of the month. The RBI has maintained the exchange rate at Rs 39-40 level despite huge foreign exchange inflows. In November 2007 the trend of Indian Rupee vis-à-vis Euro was similar to that of the Rupee Dollar trend. Rupee weakened against the Euro as in the last trading sessions, it averaged at Rs 57.9 and traded at a high / low of Rs 59.21/56.83. Table-11.1: Exchange rate of Rupee (per unit of other currencies). US dollar Euro Exchange rate Change (%) Exchange rate Change (%) 2006-
07 2007-08
2006- 07
2007-08
2006-07
2007-08
2006-07
2007-08
April 44.9 42.2 1.4 -4.0 55.2 57.0 3.4 -2.2 May 45.4 40.7 1.1 -3.5 58.0 55.1 4.8 -3.3 June 46.0 40.8 1.3 0.2 58.3 54.7 0.5 -0.7 July 46.5 40.4 1.0 -0.9 59.0 55.4 1.2 1.2 August 46.5 40.8 0.1 1.0 59.6 55.6 1.0 0.4 September 46.1 40.3 -0.8 -1.2 58.8 56.0 -1.4 0.7 October 45.5 39.5 -1.3 -1.9 57.4 56.2 -2.4 0.3 November 44.9 39.4 -1.3 -0.2 57.8 57.9 0.7 3.0 December 44.6 -0.7 59.0 2.1 January 44.3 -0.7 57.7 -2.2 February 44.2 -0.2 57.7 0.0 March 44.0 0.4 58.3 0.7
Source: Reserve Bank of India