CURRENT DEMOGRAPHICS OF THE JAMAICAN DAIRY … · CURRENT DEMOGRAPHICS OF THE JAMAICAN DAIRY...
38
Jamaica Dairy Development Board CURRENT DEMOGRAPHICS OF THE JAMAICAN DAIRY FARMING SECTOR: ANALYSIS OF A 2004 SURVEY P.G. Jennings, R.C. Miller, D.L. Ffrench Jamaica Dairy Development Board and M. A. Pryce Data Bank and Evaluation Division, Ministry of Agriculture Jamaica Dairy Development Board, Ministry of Agriculture, Hope Gardens, Kingston 6 Phone: (876) 927-1732/50 Fax: (876( 977-1875 e-mail: [email protected] i
Transcript of CURRENT DEMOGRAPHICS OF THE JAMAICAN DAIRY … · CURRENT DEMOGRAPHICS OF THE JAMAICAN DAIRY...

Jamaica Dairy Development Board
CURRENT DEMOGRAPHICS OF THE JAMAICAN
DAIRY FARMING SECTOR:
ANALYSIS OF A 2004 SURVEY
P.G. Jennings, R.C. Miller, D.L. Ffrench
Jamaica Dairy Development Board
and
M. A. Pryce
Data Bank and Evaluation Division, Ministry of Agriculture
Jamaica Dairy Development Board, Ministry of Agriculture, Hope Gardens, Kingston 6
Phone: (876) 927-1732/50 Fax: (876( 977-1875 e-mail: [email protected]
i

TABLE OF CONTENTS
PAGE
SUMMARY
1. INTRODUCTION ……………………………………………….. 1
2. OBJECTIVES ……………………………………………………. 2
3. SURVEY DESIGN ………………………………………………. 3
4. RESULTS AND DISCUSSION …………………………………. 3
4.1 Distribution of Farms and Farm Size ……………………. 3
4.2 Aspects of Pasture Management ………………………….. 6
4.3 Herd Profile ………………………………………………… 7
4.4 Distribution of Dairy Farm Ownership and
Employment Levels ……………………………………….. 8
4.5 Feeding Systems and Milk Production …………………... 9
5. ESTIMATED LEVELS OF INVESTMENT …………………… 11
ACKNOWLEDEGMENTS .,…………………………………………... 13
REFERENCES …………………………………………………………. 14
APPENDICES ………………………………………………………….. 16-34
ii

CURRENT DEMOGRAPHICS OF THE JAMAICAN DAIRY FARMING SECTOR:
ANALYSIS OF A 2004 SURVEY
P.G. Jennings, R.C. Miller, D.L. Ffrench
Jamaica Dairy Development Board
and
M.A. Pryce
Data Bank and Evaluation Division, Ministry of Agriculture
SUMMARY
A survey of commercial dairy farms was carried out between mid-March and mid-June 2004 todetermine the current parameters of the dairy farming sector.
Farms were designated small (<10 ac), medium ( 10-100 ac) or large (>100ac) based on the area of land allocated to the dairy enterprise.
The survey was designed to canvass all medium and large farms and 5 per cent of small farms. A total of 76 farms were canvassed (7-small; 39-medium and 30-large) including one large farmengaged exclusively in heifer rearing and one medium operation which had suspended milking due to the effects of prolonged drought on herbage availability.
Based on information supplied by processors there are 185 small farms currently engaged in dairy farming. On this basis there are currently 254 specialized dairy farms in operation occupying 18,200 acres (7 375 ha.) of land and carrying a total dairy herd of 18,511 head. These data suggest percentage reduction of 66 and 33 since 1990 in respect of number of farms and land allocation respectively. With respect to the national breeding herd, a reduction of 15.6 per cent was indicated , the current breeding herd comprising 11,440 females.
The data suggest that the overall mean yield on dairy farms was 3334 litres per hectare; medium sized farms the highest at 5690 litres per hectare per annum.
A computation of the current value of physical assets employed indicate that total investment in dairy farming is at minimum, J$1.8 billion.
1. INTRODUCTION
Anecdotal evidence has indicated that the local dairy farming sector has undergone severe
attrition over the past decade. This has to some extent been substantiated by the fact of a 52
percent reduction in formally traded milk between 1992 and 2003, production having declined
from 38.8 to 18.4 million litres in the latter year.
1

Sector stakeholders led by the Jamaica Dairy Farmers’ Federation have been lobbying for a
reform of existing Government Policy on the Dairy Industry and have projected that local milk
production could reach 70 million litres over the next decade given the creation of a favourable
policy environment.
There has been reservation about the validity of several of the major assumptions underlying
these projections given the absence of factual current information on the dairy farming sector.
The last focused survey of the sector was conducted in 1990 as part of the Ministry of
Agriculture Livestock Census (Anon.1990). A more recent survey of the sector was
incorporated in the 1996 Agricultural Census carried out by STATIN (Anon. 1997). Given the
broad scope of this Census, it was difficult to glean detailed information of the Dairy Farm
Sector.
It was therefore considered essential that a purpose-designed survey be carried out to determine
the current parameters of the sector. A survey designed in collaboration with the Data Bank and
Evaluation Division of the Ministry of Agriculture was carried out during the period March –
June, 2004. Originally it was intended to complete the survey within a 30 day period but
tardiness in the return of questionnaires resulted in the data collection period being extended to
mid-June, 2004.
2. OBJECTIVES OF SURVEY
The survey was undertaken to provide an accurate, up-to-date profile of the size and scope of the
dairy farming sector and the magnitude of the investment in dairy farming as an aid to
meaningful planning and policy making.
The primary parameters included in the survey were:-
i) Number of farmers engaged in commercial dairy activity
ii) Acreage of land specifically allocated to dairy farming.
iii) Dairy herd size and composition
iv) Acreage of holdings in improved pastures
2

v) Acreage of pasture land under irrigation
vi) Number of persons employed
vii) Average monthly milk production
viii) Equipment employed in dairy farming activity.
3. SURVEY DESIGN
Farms were designated according to acreages into the following categories
SMALL: Below 10 acres (4 ha)
MEDIUM: 10 – 100 acres (4 – 40 ha)
LARGE: Above 100 acres
The survey was designed to collect data from all medium and large farms currently engaged in
the commercial production of milk and to record similar data from a 5% sample of small
farmers. The decision only to sample small farms was largely cost determined, but was also
guided by the greater homogeneity among small farmers.
One large farmer currently engaged solely in heifer rearing and a medium sized producer who
had at the time of the survey suspended milking due to the effects of prolonged drought, were
also included in the survey.
Survey questionnaires were distributed with the assistance of the major processors commencing,
March 15, 2004. It was intended to complete the collection of questionnaires within a 30- day
period. Slow returns from a number of farms and the need to ensure full participation resulted in
the survey period being extended to mid – June 2004. Twelve farmers were interviewed by
telephone in a final ‘mopping-up’ operation.
4. RESULTS AND DISCUSSION
4.1 Distribution of Farms and Farm Size
Seventy-six producers participated in the survey. The numbers per size-class were being 7, 39
and 30 for small, medium and large farms respectively. (Table1).
3

Table 1: Distribution of farms by parish and size class
SIZE CLASS
PARISH
SMALL MEDIUM LARGE
TOTAL
St Thomas 3 4 2 9
Portland - - 1 1
St. Mary 1 - - 1
St. Ann 3 5 4 12
Hanover - - 4 4
Westmoreland - 2 1 3
St. Elizabeth - 14 4 18
Manchester - - 1 1
Clarendon - 13 5 18
St. Catherine - 1 8 9
ALL ISLAND 7 39 30 76
Based on information provided by processors there are 185 small farmers on register. The initial
intent was to record data from 10 small farmers. However upon return of the questionnaires
three (3) farmers had to be re-designated as medium-sized as they operated on more than 10
acres of land.
The acreages occupied by responding farms are summarized in Appendix 1. The adjusted
acreages (based on total numbers of small dairy farms) are shown in Table 2.
Table 2: Estimated Total Acreage in Dairy Farming
Size Class Total No.
Farms
% Total Mean Farm
Size (ac)
Estimate
Acreage
% Total
Small 185* 72.8 7.8 1443 7.9
Medium 39 15.4 41.8 1632 9.0
Large 30 11.8 504.7 15,141 83.1
All 254 100 71.7 18,216 -
4

The available information and survey data suggest that farms primarily engaged in dairy farming,
occupy approximately 18,200 acres (7375 ha.) of land, the proportionate allocation between size
classes being 7.9, 9.0 and 83.1 per cent to small, medium and large farms respectively.
By way of contrast, the 1990 Livestock Census reported 753 specialized dairy farms in addition
to 1500 dual purpose producers.
Table 3: Comparative Numbers of Farmers Within Size Groups –
1990 V 2004
Size Group 1990 Census 2004 Survey % Change
Small 613 185 -69.8
Medium 109 39 -64.2
Large 31 30 -3.2
All 753 254 -66.3
Table 3 presents a comparison of the numbers of commercial dairy farms in operation between
1990 and 2004. The 1990 Census categorized farms into size groups based on number of head of
cattle. For this comparison, we have attempted to correlate the two data sets by designating the
1990 categories into small (<10 head); medium (10-100 head); large(> 100 head).
Applying this reconfiguration suggests that the attrition in the sector has been largely from the
exit of small (70%) and medium sized farmers (64%).
The 1990 Census did not disaggregate acreage occupied by dairy farms from the total acreage
under livestock.. On the basis of the 170,995 acres (69,228 ha.) reported as the total in livestock
farming, it was calculated that approximately (10 940 ha) 27,033 ac. were allocated to dairy
farming (Jennings and Wellington, 1992) . The current estimate of 18,216 acres (7 375 ha.)
suggests that one third of total acreage in dairying in 1990 have since been reallocated to
alternate enterprises.
5

4.2 Aspects of Pasture Management
The 2004 Survey data indicate that among the farms reporting, only 73.5 percent of the farm
acreage was actually cultivated in pasture, the proportions in pasture within size classes being
98.7, 89.0 and 71.7 per cent to small, medium and large farms respectively. Table 4 summarizes
the relevant survey data. Appendix 2 shows the distribution of pastures between parishes and
size classes; St. Ann (2584 ac), Manchester (2050 ac.) and St. Catherine (1803 ac.) accounting
for 52 percent of total acreage established in pasture.
Table 4: Acreage in pasture by size class
SIZE CLASS TOTAL AREA IN
PASTURE (ac)
MEAN AREA IN
PASTURE (ac)
PERCENTAGE IN
PASTURE
Small 53.80 7.69 98.7
Medium 1,453.00 38.24 89.0
Large 10,863.00 362.10 71.7
ALL 12,369.80 164.93 73.5
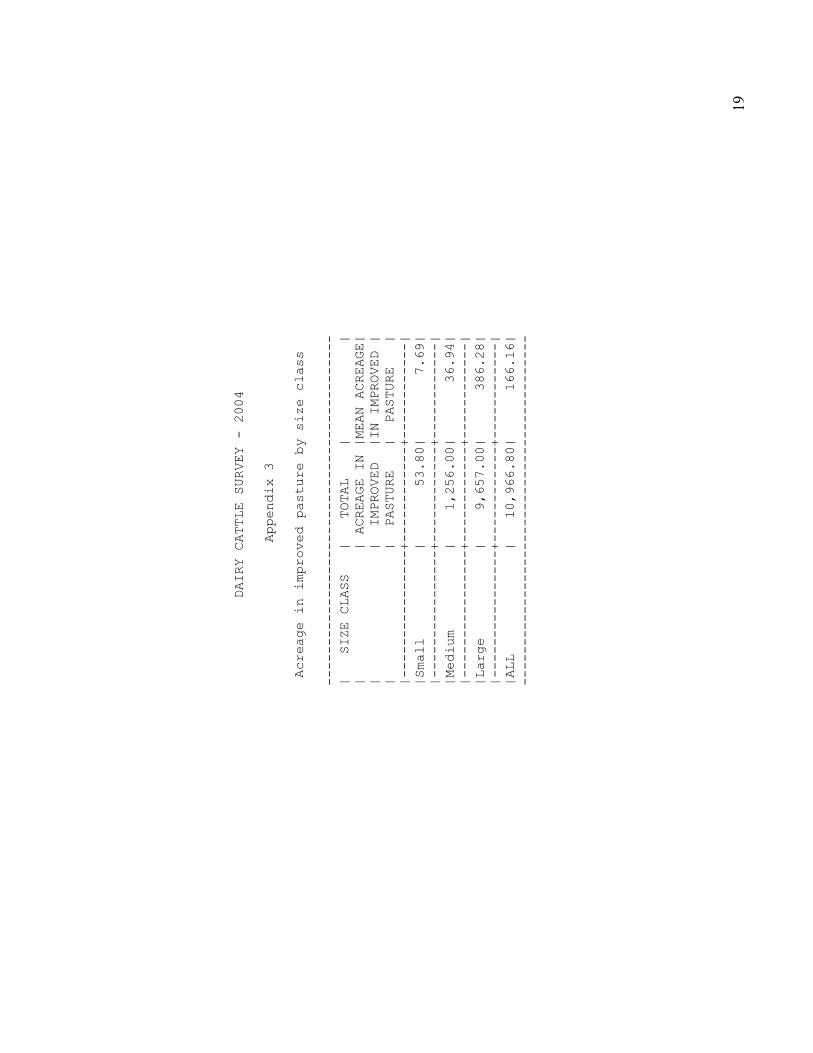
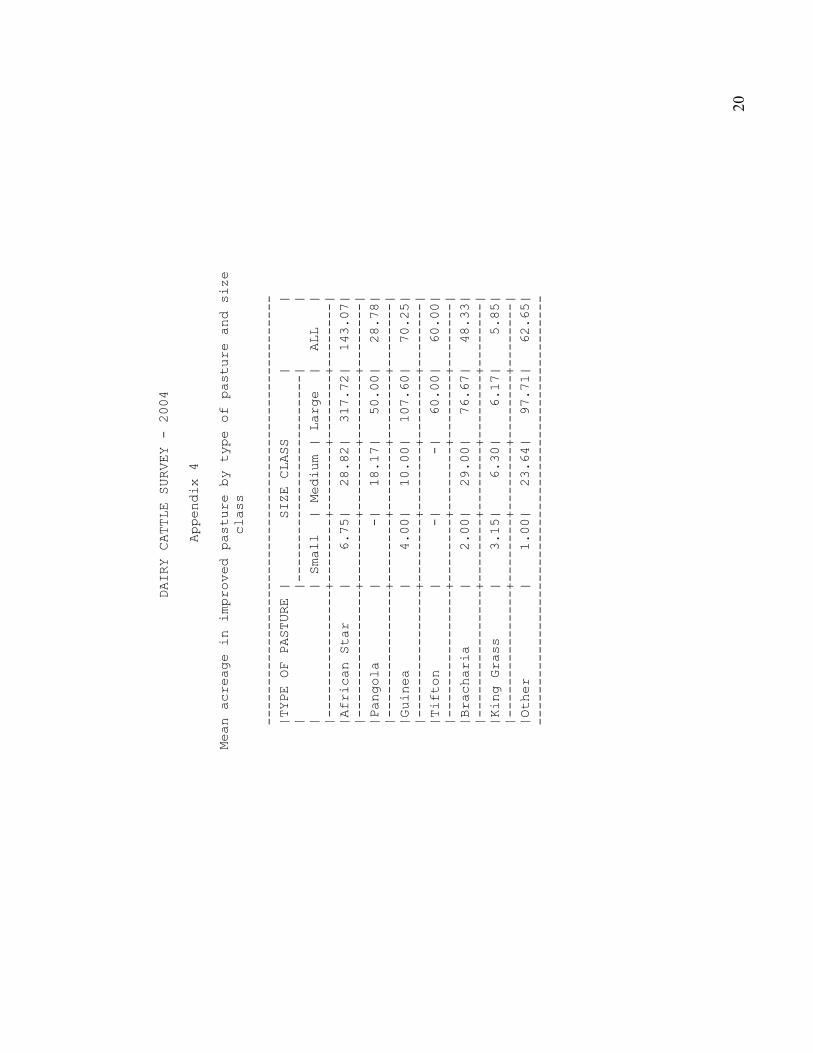
The information from respondents indicate that overall 89 per cent of pasture acreage was
established in improved grasses African Star Grass was the major cultivar among dairy farmers
accounting for 74 per cent of the area established in improved grasses (Table 5). The fact that
Tifton occupied only 120 acres (1%) of the total reported, highlighted the reluctance of Jamaican
dairy farmers to adopt newer, highly productive cultivars that have become available over the
past decade. It should be noted that African Star Grass was first introduced to Jamaica in 1973.
Recent local evaluation of Tifton 85, suggests significantly higher yields than African Star
(Miller, Jennings, Ffrench, 2003) and Pangola Grass (McLeod, D.S., 2003, Pers. Comm.).
6

Table 5: Acreage in improved pasture by type of pasture and size class
SIZE CLASS
SMALL MEDIUM LARGE
ALLTYPE OF
PASTURE
Acreage Acreage Acreage Acreage % of
improved
pasture Area
African Star 40.50 807.00 7,307.50 8,155.00 74.4
Pangola - 109.00 150.00 259.00 2.4
Guinea 4.00 20.00 538.00 562.00 5.1
Tifton - - 120.00 120.00 1.1
Brachiaria 2.00 58.00 230.00 290.00 2.6
King Grass 6.30 63.00 18.50 87.80 .08
Other 1.00 260.00 1,368.00 1,629.00 14.9
All 53.8 1,256.0 9,657.00 10,966.8 100
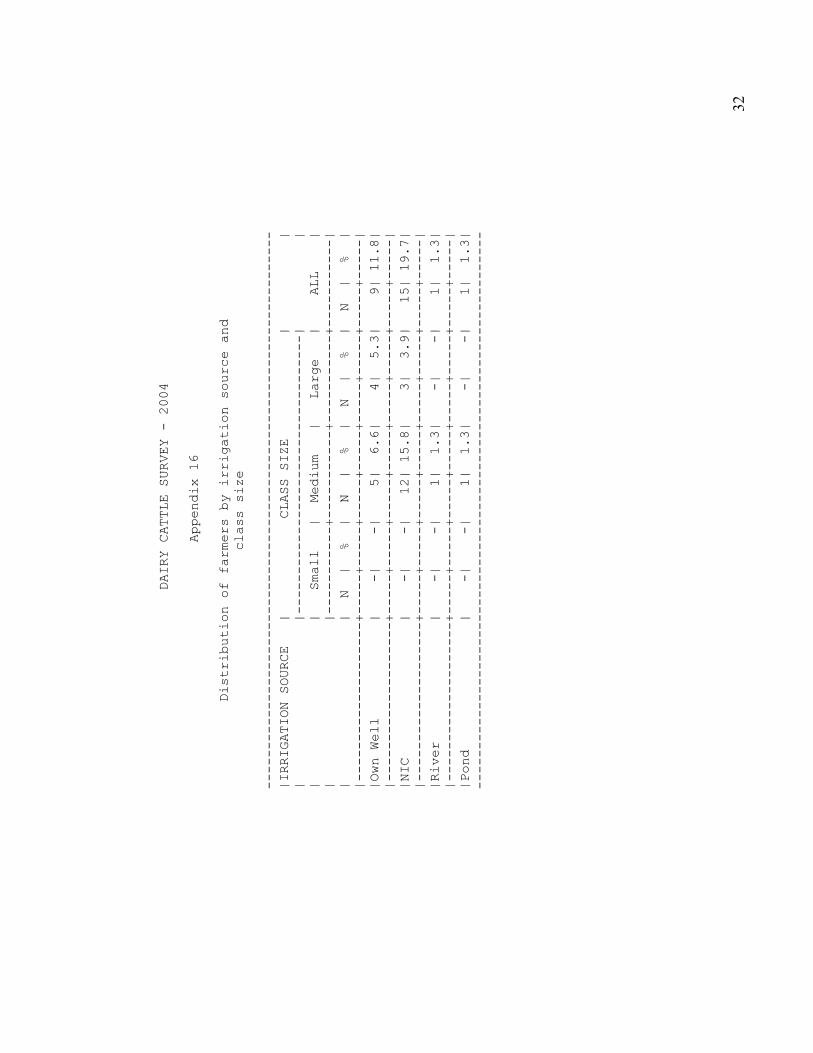
Twelve medium and 4 large farms reported applying irrigation to pastures. A total of 1880 acres
(15.2% of total pastures) were under irrigation, the four large farms accounting for 79.5 percent
of irrigated acreage (Tables 6). The Mid-Clarendon Irrigation System supplied eleven of the
sixteen irrigated farms, the remaining farmers utilizing on-farm wells or riparian sources.
Table 6: Acreage under Irrigation by size class
SIZE CLASS TOTAL AREA
UNDER
IRRIGATION (ac)
MEAN AREA
UNDER
IRRIGATION (ac)
% PASTURE AREA
IRRIGATED
Small - - -
Medium 480.00 40.00 33.0
Large 1,400.00 350.00 12.9
All 1,880.00 117.50 15.2
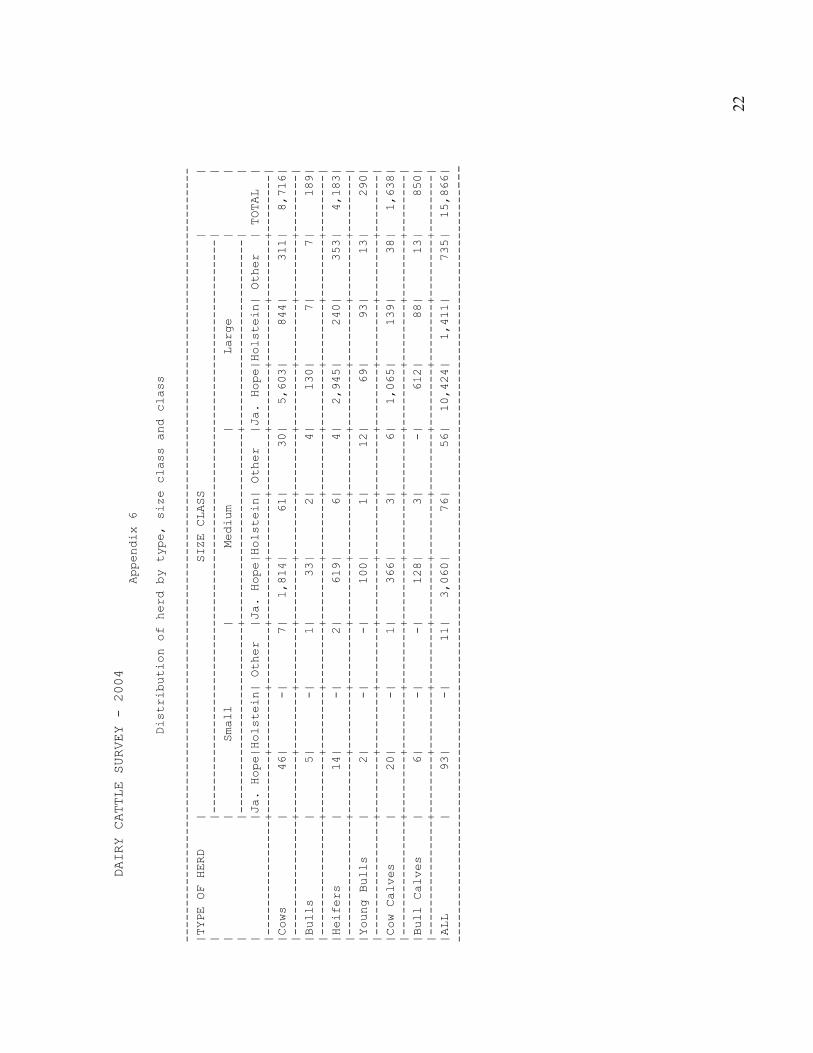
4.3 Herd Profile
Total Dairy Cattle Herd: Appendix 6 shows the structure of the dairy herd owned by respondent
farmers. Table 7 sets out the estimated population of breeding females by size group. The
7
survey data was adjusted for the actual numbers of small farmers as well as including 30 per cent
of heifers in the breeding herd.
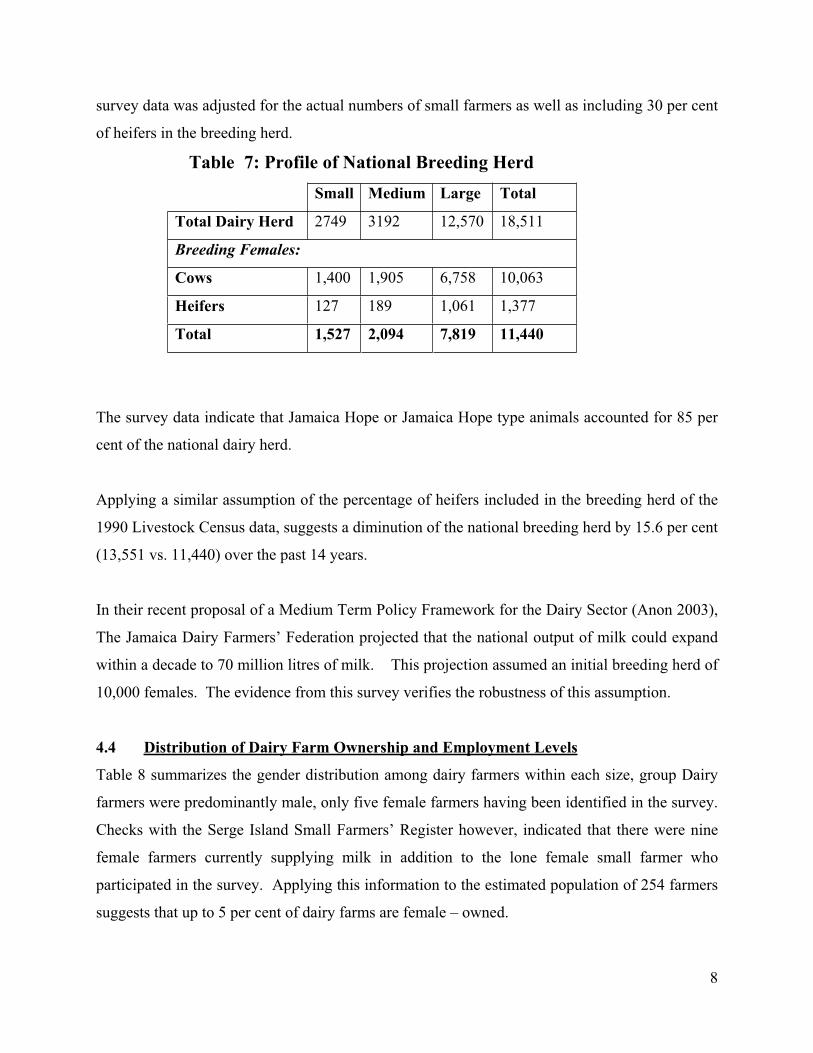
Table 7: Profile of National Breeding Herd
Small Medium Large Total
Total Dairy Herd 2749 3192 12,570 18,511
Breeding Females:
Cows 1,400 1,905 6,758 10,063
Heifers 127 189 1,061 1,377
Total 1,527 2,094 7,819 11,440
The survey data indicate that Jamaica Hope or Jamaica Hope type animals accounted for 85 per
cent of the national dairy herd.
Applying a similar assumption of the percentage of heifers included in the breeding herd of the
1990 Livestock Census data, suggests a diminution of the national breeding herd by 15.6 per cent
(13,551 vs. 11,440) over the past 14 years.
In their recent proposal of a Medium Term Policy Framework for the Dairy Sector (Anon 2003),
The Jamaica Dairy Farmers’ Federation projected that the national output of milk could expand
within a decade to 70 million litres of milk. This projection assumed an initial breeding herd of
10,000 females. The evidence from this survey verifies the robustness of this assumption.
4.4 Distribution of Dairy Farm Ownership and Employment Levels
Table 8 summarizes the gender distribution among dairy farmers within each size, group Dairy
farmers were predominantly male, only five female farmers having been identified in the survey.
Checks with the Serge Island Small Farmers’ Register however, indicated that there were nine
female farmers currently supplying milk in addition to the lone female small farmer who
participated in the survey. Applying this information to the estimated population of 254 farmers
suggests that up to 5 per cent of dairy farms are female – owned.
8
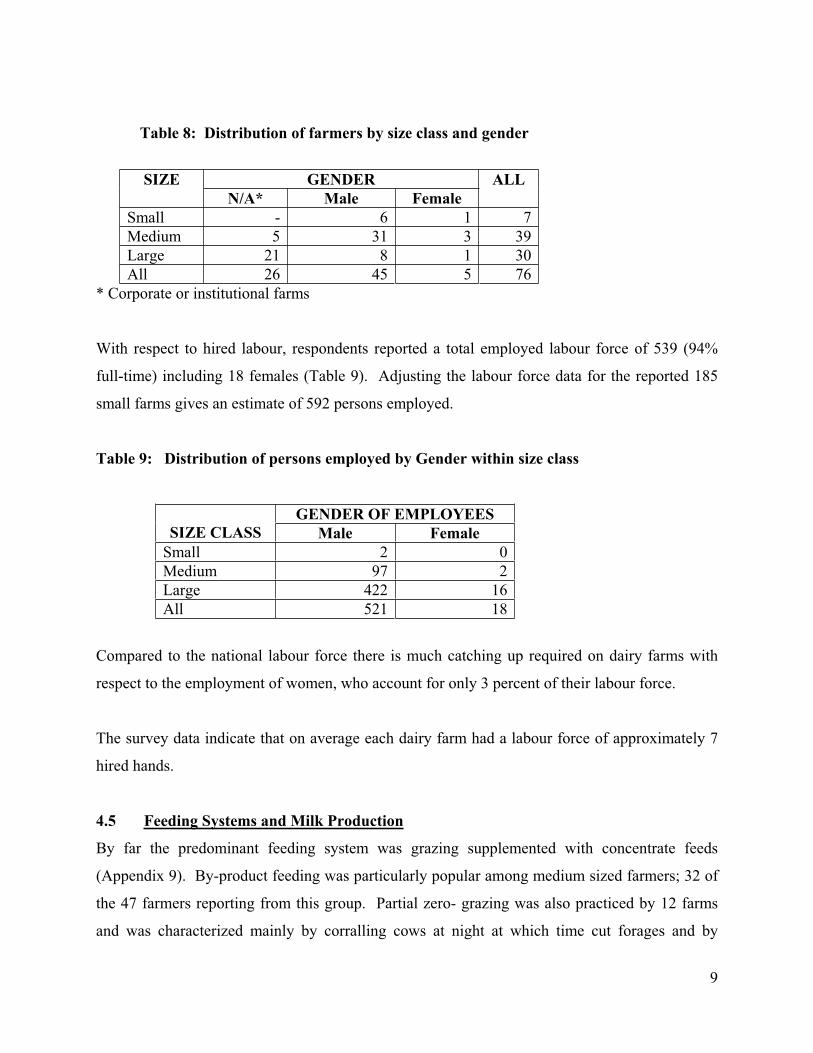
Table 8: Distribution of farmers by size class and gender
GENDERSIZE
N/A* Male Female
ALL
Small - 6 1 7
Medium 5 31 3 39
Large 21 8 1 30
All 26 45 5 76
* Corporate or institutional farms
With respect to hired labour, respondents reported a total employed labour force of 539 (94%
full-time) including 18 females (Table 9). Adjusting the labour force data for the reported 185
small farms gives an estimate of 592 persons employed.
Table 9: Distribution of persons employed by Gender within size class
GENDER OF EMPLOYEES
SIZE CLASS Male Female
Small 2 0
Medium 97 2
Large 422 16
All 521 18
Compared to the national labour force there is much catching up required on dairy farms with
respect to the employment of women, who account for only 3 percent of their labour force.
The survey data indicate that on average each dairy farm had a labour force of approximately 7
hired hands.
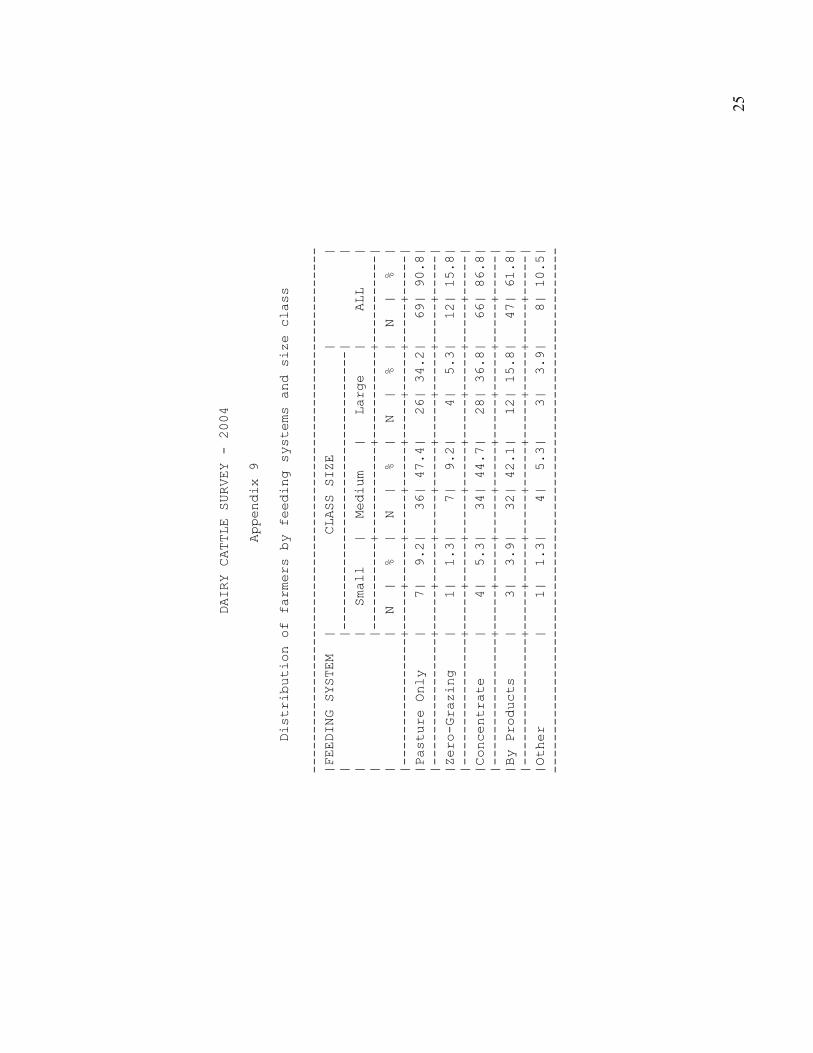
4.5 Feeding Systems and Milk Production
By far the predominant feeding system was grazing supplemented with concentrate feeds
(Appendix 9). By-product feeding was particularly popular among medium sized farmers; 32 of
the 47 farmers reporting from this group. Partial zero- grazing was also practiced by 12 farms
and was characterized mainly by corralling cows at night at which time cut forages and by
9
products are offered. This might be viewed mainly as a security measure as the clear evidence
from research is that far greater use of pasture is made from over-night grazing, suggesting that
the cows’ nutrition might be optimized by mitigating the high day-time temperatures by
corralling under shade and maximizing grazing intake at night, under tropical conditions.
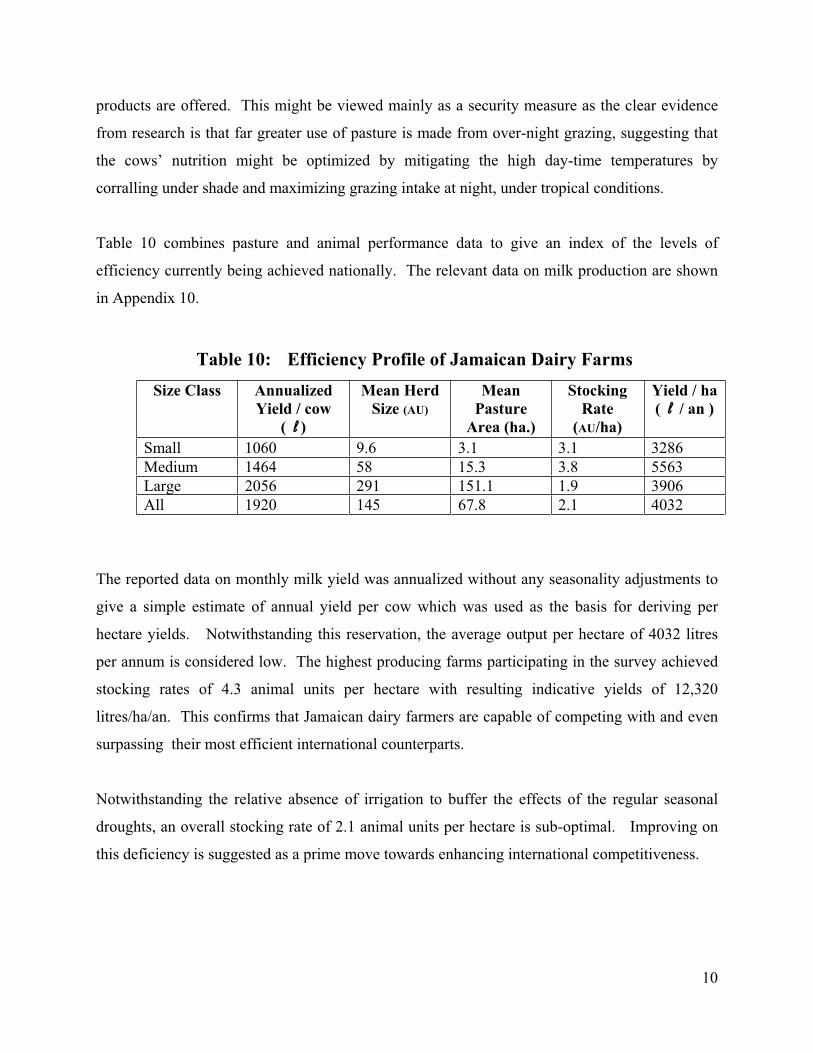
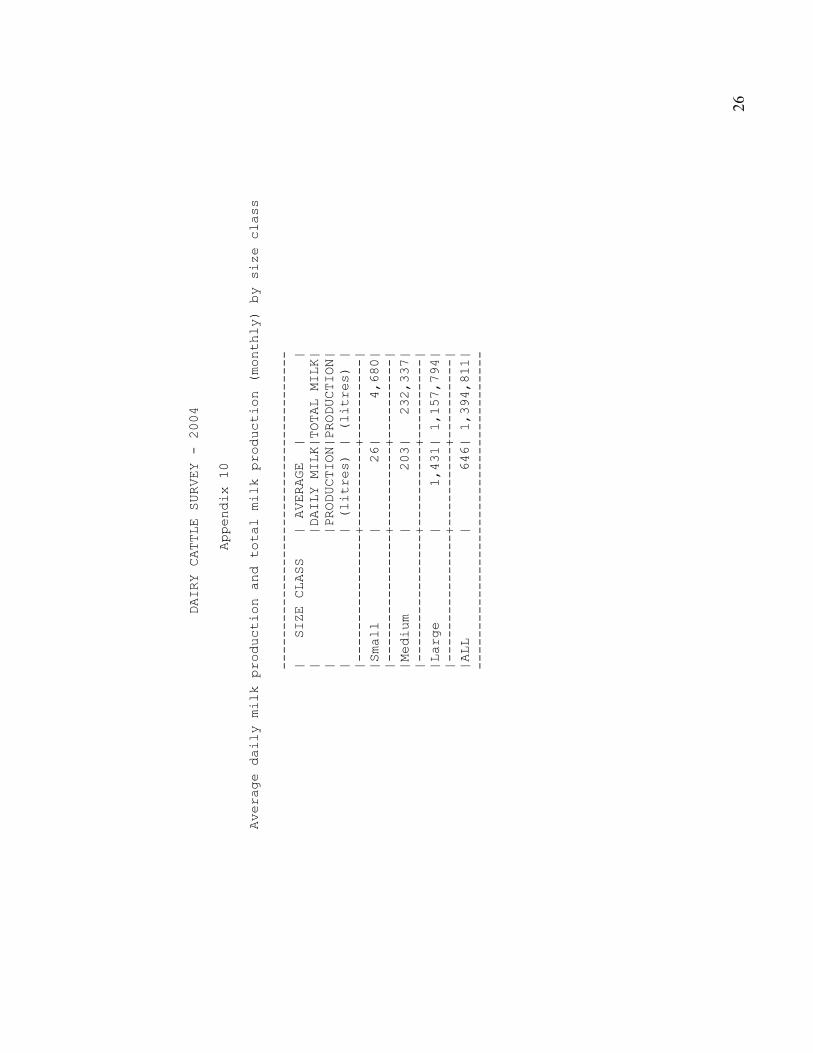
Table 10 combines pasture and animal performance data to give an index of the levels of
efficiency currently being achieved nationally. The relevant data on milk production are shown
in Appendix 10.
Table 10: Efficiency Profile of Jamaican Dairy Farms
Size Class Annualized
Yield / cow
( l )
Mean Herd
Size (AU)
Mean
Pasture
Area (ha.)
Stocking
Rate
(AU/ha)
Yield / ha
( l / an )
Small 1060 9.6 3.1 3.1 3286
Medium 1464 58 15.3 3.8 5563
Large 2056 291 151.1 1.9 3906
All 1920 145 67.8 2.1 4032
The reported data on monthly milk yield was annualized without any seasonality adjustments to
give a simple estimate of annual yield per cow which was used as the basis for deriving per
hectare yields. Notwithstanding this reservation, the average output per hectare of 4032 litres
per annum is considered low. The highest producing farms participating in the survey achieved
stocking rates of 4.3 animal units per hectare with resulting indicative yields of 12,320
litres/ha/an. This confirms that Jamaican dairy farmers are capable of competing with and even
surpassing their most efficient international counterparts.
Notwithstanding the relative absence of irrigation to buffer the effects of the regular seasonal
droughts, an overall stocking rate of 2.1 animal units per hectare is sub-optimal. Improving on
this deficiency is suggested as a prime move towards enhancing international competitiveness.
10

4.6 Level of Mechanization on Dairy Farms
The survey indicates that 80 per cent of reporting farms employed milking machines. All small
farmers surveyed milked by hand which was also the method of milk extraction of 6 medium
sized farms and 2 large farms. The latter were educational institutions which retained hand-
milking as the method of instruction. Table 11 summarizes the data with regard to milking
system.
Table 11: Distribution of farmers by size class and milking system
MILKING SYSTEM
Not Stated Bucket Type Milking
Parlour
Hand ALLSIZE
N % N % N % N % N %
Small - - - - - - 7 9.2 7 9.2
Medium - - 24 31.6 9 11.8 6 7.9 39 51.3
Large 1 1.3 3 3.9 24 31.6 2 2.6 30 39.5
All 1 1.3 27 35.5 33 43.4 15 19.7 76 100.0
Bucket-type milking equipment remains the system of choice of the medium sized farmer (63%)
while 80 percent of large farms milked in parlours.
The data with respect to other equipment employed are summarized in Appendices 15 - 18. It is
significant that only four farms reported owning hay or silage making equipment, indicating the
relative absence of on-farm fodder conservation as a strategy to overcome the seasonality in
herbage availability common to all the geographical areas in which dairy farming is practiced.
5. ESTIMATED LEVELS OF INVESTMENT
The survey data on the physical assets employed in dairy farming have been used to compute a
crude estimate of the level of investment in dairy farming on a replacement cost basis. With
respect to the value of equipment employed, suppliers were canvassed to determine current costs
of the relevant items.
11

Our estimate of the current value of the physical assets employed in the dairy-farming sector is
summarized in Table 12. On the basis of current costs the survey data indicate that the level of
investment in physical assets in the dairy-farming sector is approximately J$1.8 billion; the
individual components of greatest value being milking facilities and related equipment (35.3%)
and land (46.7%).
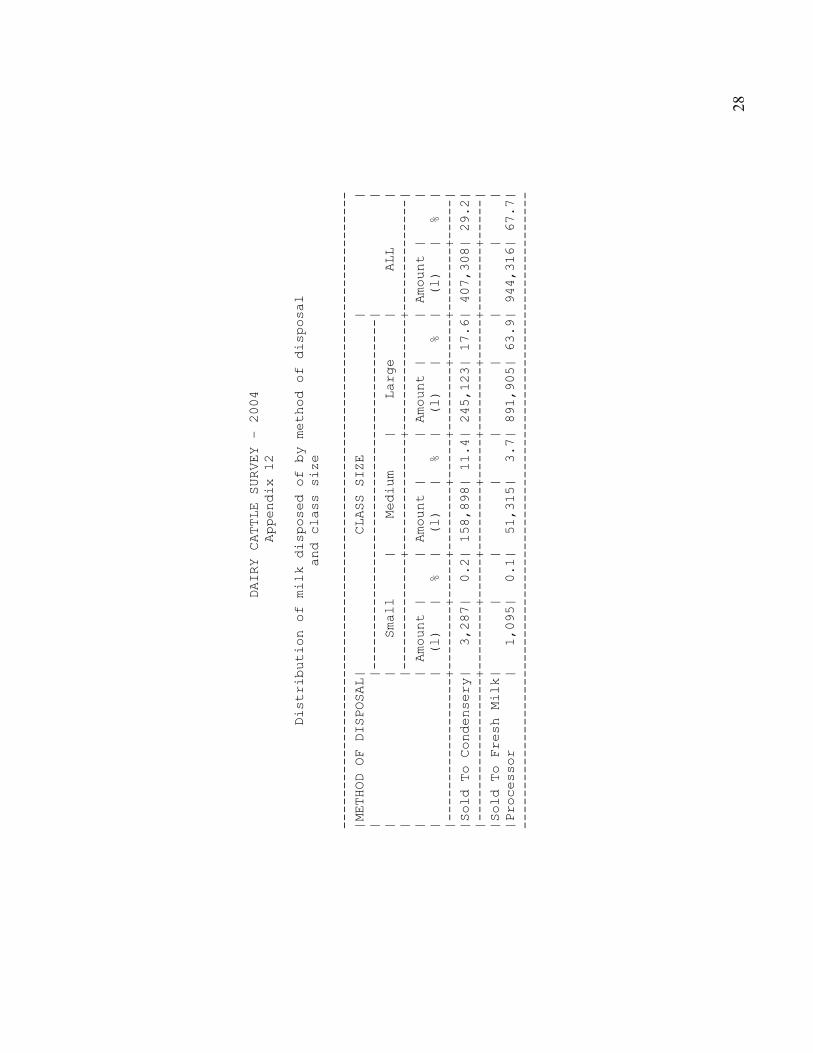
Milk production in 2003 totaled 18.4 billion litres. At the prices prevailing in 2003 ($17.84 per
litre - weighted average) milk revenues at farm gate represented an annual gross return on assets
employed of approximately 18.2 per cent.
An immediate challenge to farmers must therefore be the adoption of management strategies
aimed at improving this coefficient.
Table 12: Value of Physical Assets
UNIT COST (J$)
ASSET Large Farm Medium Farm
ESTIMATED
VALUE FOR
ALL FARMS (J$)
1. Milking Facilities & Equipmenta. Buildings/ holding yardsb. Milking Machinesc. Bulk Coolers Sub Total
4.0m 2.8m7.0m 3.0m3.0m 1.8m13.0m (33)* 7.6m (27) 634m
2. Stand by Generators (32) 800,000 25.6m
3. Tractors & Tillage Implements (33) 2.1m 69.30m
4. Hay/Silage Milking Equipment (4) 2.7m 10.8m
5. Spray Races & Equipment (15) 750,000 11.25m
6. Sprinkler System (1760 ac) 40,000/ac 70.40m
7.. Cattle Cows – 10,000 Heifers – 12,000
86.00m49.30m
8. Land Value Improved Pasture - 70,000/ac Unimproved “ - 50,000/ac
768.00m70.20m
Estimated Value of Assets 1.795 Billion
*number of respondents
Amelioration of the policy environment will be critical in the short to medium term to the
farmer’s decision to invest in the adoption of technologies to procure these improvements. In
spite of the substantial reduction in numbers over the past decade the level of investment is
12

substantial and virtually dictates that the sector be accorded greater priority for support in
Government’s Agricultural Policy.
ACKNOWLEDGEMENTS
The conduct of the 2004 survey would not have been possible without the assistance of Nestle
Jamaica Limited who assisted in the distribution of questionnaires and canvassing of farmers.
We therefore wish to record our appreciation to Nestle as well as to all the farmers who
participated. The invaluable assistance of Mr. Philip Ashman, Data Bank and Evaluation
Division, Ministry of Agriculture, in the compiling and analysis of the data is also
acknowledged.
13

REFERENCES
1. Anon (1990) Livestock Census 1990. Data Bank and Evaluation Division, Ministry of
Agriculture, May, 1990.
2. Anon (1999) Census of Agriculture 1996. Statistical Institute of Jamaica
3. Anon (2003) A Medium Term Policy Framework for the Dairy Sector : A Proposal forthe Restoration of the Dairy Farming Sector. Jamaica Dairy Farmers’ Federation, Jamaica Dairy Development Board, July2003.
4. Jennings, P.G and Wellington, K.E. (1992) Case Studies on the Dairy Situation in theCaribbean: The Jamaican Industry. Paper presented at CARDI/CTA/IDFSeminar – Dairy Development in the Caribbean Region. Ocho Rios, Jamaica,Nov. 30 –Dec. 03, 1992
5. Miller, R.C., Ffrench, D.L. and Jennings, P.G (2003). Cost of Producing Grass under Commercial Conditions in Jamaica. Paper presented at SRC 17th AnnualConference on Science and Technology. Kingston, Jamaica, Nov19-22, 2003.
14

APPENDICES
15

16

DAIRY CATTLE SURVEY - 2004
Appendix 1
Farm size (ac) by size class
--------------------------------------------
| SIZE CLASS | TOTAL FARM | MEAN FARM |
| | SIZE (ac) | SIZE (ac) |
|----------------+------------+------------|
|Small | 54.50| 7.79|
|----------------+------------+------------|
|Medium | 1,631.90| 41.84|
|----------------+------------+------------|
|Large | 15,141.00| 504.70|
|----------------+------------+------------|
|ALL | 16,827.40| 221.41|
--------------------------------------------
SIZE CLASS (FARM)
-----------------
Small: 0 - 10 ac
Medium: 11 - 100 ac
Large: > 100 ac
17

DAIRY CATTLE SURVEY - 2004
Appendix 2
Acreage in pasture by parish and size class
--------------------------------------------------------------
| PARISH | SIZE CLASS | |
| |--------------------------------| |
| | Small | Medium | Large | ALL |
|----------------+----------+----------+----------+----------|
|St. Thomas | 20.80| 96.00| 1,418.00| 1,534.80|
|----------------+----------+----------+----------+----------|
|Portland | -| -| 20.00| 20.00|
|----------------+----------+----------+----------+----------|
|St. Mary | 10.00| -| -| 10.00|
|----------------+----------+----------+----------+----------|
|St Ann | 23.00| 121.00| 2,440.00| 2,584.00|
|----------------+----------+----------+----------+----------|
|Hanover | -| -| 597.00| 597.00|
|----------------+----------+----------+----------+----------|
|Westmoreland | -| 56.00| 500.00| 556.00|
|----------------+----------+----------+----------+----------|
|St. Elizabeth | -| 552.00| 1,083.00| 1,635.00|
|----------------+----------+----------+----------+----------|
|Manchester | -| -| 2,050.00| 2,050.00|
|----------------+----------+----------+----------+----------|
|Clarendon | -| 565.00| 1,015.00| 1,580.00|
|----------------+----------+----------+----------+----------|
|St. Catherine | -| 63.00| 1,740.00| 1,803.00|
|----------------+----------+----------+----------+----------|
|ALL | 53.80| 1,453.00| 10,863.00| 12,369.80|
--------------------------------------------------------------
18
DAIRY CATTLE SURVEY - 2004
Appendix 3
Acreage in improved pasture by size class
--------------------------------------------
| SIZE CLASS | TOTAL | |
| | ACREAGE IN |MEAN ACREAGE|
| | IMPROVED |IN IMPROVED |
| | PASTURE | PASTURE |
|----------------+------------+------------|
|Small | 53.80| 7.69|
|----------------+------------+------------|
|Medium | 1,256.00| 36.94|
|----------------+------------+------------|
|Large | 9,657.00| 386.28|
|----------------+------------+------------|
|ALL | 10,966.80| 166.16|
--------------------------------------------
19
DAIRY CATTLE SURVEY - 2004
Appendix 4
Mean acreage in improved pasture by type of pasture and size
class
------------------------------------------------------
|TYPE OF PASTURE | SIZE CLASS | |
| |--------------------------| |
| | Small | Medium | Large | ALL |
|----------------+--------+--------+--------+--------|
|African Star | 6.75| 28.82| 317.72| 143.07|
|----------------+--------+--------+--------+--------|
|Pangola | -| 18.17| 50.00| 28.78|
|----------------+--------+--------+--------+--------|
|Guinea | 4.00| 10.00| 107.60| 70.25|
|----------------+--------+--------+--------+--------|
|Tifton | -| -| 60.00| 60.00|
|----------------+--------+--------+--------+--------|
|Bracharia | 2.00| 29.00| 76.67| 48.33|
|----------------+--------+--------+--------+--------|
|King Grass | 3.15| 6.30| 6.17| 5.85|
|----------------+--------+--------+--------+--------|
|Other | 1.00| 23.64| 97.71| 62.65|
------------------------------------------------------
20

DAIRY CATTLE SURVEY - 2004
Appendix 5
Distribution of irrigated farms by parish and size class
---------------------------------------------------
| PARISH | SIZE CLASS | |
| |---------------------| |
| | Medium | Large | ALL |
|----------------+----------+----------+----------|
|St. Thomas | 1| 1| 2|
|----------------+----------+----------+----------|
|Clarendon | 11| 1| 12|
|----------------+----------+----------+----------|
|St. Catherine | -| 2| 2|
|----------------+----------+----------+----------|
|ALL | 12| 4| 16|
---------------------------------------------------
21
DAIRY CATTLE SURVEY - 2004
Appendix 6
Distribution of herd by type, size class and class
------------------------------------------------------------------------------------------------------------
|TYPE OF HERD | SIZE CLASS | |
| |--------------------------------------------------------------------------------| |
| | Small | Medium | Large | |
| |--------------------------+--------------------------+--------------------------| |
| |Ja. Hope|Holstein| Other |Ja. Hope|Holstein| Other |Ja. Hope|Holstein| Other | TOTAL |
|----------------+--------+--------+--------+--------+--------+--------+--------+--------+--------+--------|
|Cows | 46| -| 7| 1,814| 61| 30| 5,603| 844| 311| 8,716|
|----------------+--------+--------+--------+--------+--------+--------+--------+--------+--------+--------|
|Bulls | 5| -| 1| 33| 2| 4| 130| 7| 7| 189|
|----------------+--------+--------+--------+--------+--------+--------+--------+--------+--------+--------|
|Heifers | 14| -| 2| 619| 6| 4| 2,945| 240| 353| 4,183|
|----------------+--------+--------+--------+--------+--------+--------+--------+--------+--------+--------|
|Young Bulls | 2| -| -| 100| 1| 12| 69| 93| 13| 290|
|----------------+--------+--------+--------+--------+--------+--------+--------+--------+--------+--------|
|Cow Calves | 20| -| 1| 366| 3| 6| 1,065| 139| 38| 1,638|
|----------------+--------+--------+--------+--------+--------+--------+--------+--------+--------+--------|
|Bull Calves | 6| -| -| 128| 3| -| 612| 88| 13| 850|
|----------------+--------+--------+--------+--------+--------+--------+--------+--------+--------+--------|
|ALL | 93| -| 11| 3,060| 76| 56| 10,424| 1,411| 735| 15,866|
------------------------------------------------------------------------------------------------------------
22

DAIRY CATTLE SURVEY - 2004
Appendix 7
Distribution of cows by parish and size class
------------------------------------------------------------------------------------
| PARISH | SIZE CLASS |
| |-----------------------------------------------------------------|
| | Small | Medium | Large |
| |---------------------+---------------------+---------------------|
| | N | MEAN | N | MEAN | N | MEAN |
|----------------+----------+----------+----------+----------+----------+----------|
|St. Thomas | 27| 9| 85| 21| 1858| 929|
|----------------+----------+----------+----------+----------+----------+----------|
|Portland | -| -| -| -| 20| 20|
|----------------+----------+----------+----------+----------+----------+----------|
|St. Mary | 7| 7| -| -| -| -|
|----------------+----------+----------+----------+----------+----------+----------|
|St Ann | 19| 6| 115| 23| 1420| 355|
|----------------+----------+----------+----------+----------+----------+----------|
|Hanover | -| -| -| -| 472| 118|
|----------------+----------+----------+----------+----------+----------+----------|
|Westmoreland | -| -| 90| 45| 165| 165|
|----------------+----------+----------+----------+----------+----------+----------|
|St. Elizabeth | -| -| 654| 47| 524| 131|
|----------------+----------+----------+----------+----------+----------+----------|
|Manchester | -| -| -| -| 1067| 1067|
|----------------+----------+----------+----------+----------+----------+----------|
|Clarendon | -| -| 905| 70| 263| 66|
|----------------+----------+----------+----------+----------+----------+----------|
|St. Catherine | -| -| 56| 56| 969| 121|
|----------------+----------+----------+----------+----------+----------+----------|
|ALL | 53| 8| 1905| 49| 6758| 233|
------------------------------------------------------------------------------------
23

DAIRY CATTLE SURVEY - 2004
Appendix 8
Distribution of Heifers by size class
----------------------------------------
| SIZE CLASS | TOTAL | MEAN |
| |NUMBER OF |NUMBER OF |
| | HEIFERS | HEIFERS |
|----------------+----------+----------|
|Small | 16| 3|
|----------------+----------+----------|
|Medium | 629| 19|
|----------------+----------+----------|
|Large | 3538| 131|
|----------------+----------+----------|
|ALL | 4183| 62|
----------------------------------------
24
DAIRY CATTLE SURVEY - 2004
Appendix 9
Distribution of farmers by feeding systems and size class
------------------------------------------------------------------
|FEEDING SYSTEM | CLASS SIZE | |
| |-----------------------------------| |
| | Small | Medium | Large | ALL |
| |-----------+-----------+-----------+-----------|
| | N | % | N | % | N | % | N | % |
|----------------+-----+-----+-----+-----+-----+-----+-----+-----|
|Pasture Only | 7| 9.2| 36| 47.4| 26| 34.2| 69| 90.8|
|----------------+-----+-----+-----+-----+-----+-----+-----+-----|
|Zero-Grazing | 1| 1.3| 7| 9.2| 4| 5.3| 12| 15.8|
|----------------+-----+-----+-----+-----+-----+-----+-----+-----|
|Concentrate | 4| 5.3| 34| 44.7| 28| 36.8| 66| 86.8|
|----------------+-----+-----+-----+-----+-----+-----+-----+-----|
|By Products | 3| 3.9| 32| 42.1| 12| 15.8| 47| 61.8|
|----------------+-----+-----+-----+-----+-----+-----+-----+-----|
|Other | 1| 1.3| 4| 5.3| 3| 3.9| 8| 10.5|
------------------------------------------------------------------
25
DAIRY CATTLE SURVEY - 2004
Appendix 10
Average daily milk production and total milk production (monthly) by size class
----------------------------------------
| SIZE CLASS | AVERAGE | |
| |DAILY MILK|TOTAL MILK|
| |PRODUCTION|PRODUCTION|
| | (litres) | (litres) |
|----------------+----------+----------|
|Small | 26| 4,680|
|----------------+----------+----------|
|Medium | 203| 232,337|
|----------------+----------+----------|
|Large | 1,431| 1,157,794|
|----------------+----------+----------|
|ALL | 646| 1,394,811|
----------------------------------------
26

DAIRY CATTLE SURVEY - 2004
Appendix 11
Milk production (monthly) by parish and size class
----------------------------------------------------------------------
| PARISH | SIZE CLASS | |
| |--------------------------------------| |
| | Small | Medium | Large | ALL |
|----------------+------------+------------+------------+------------|
|St. Thomas | 1,153| 2,769| 427,428| 431,349|
|----------------+------------+------------+------------+------------|
|Portland | -| -| -| -|
|----------------+------------+------------+------------+------------|
|St. Mary | 1,650| -| -| 1,650|
|----------------+------------+------------+------------+------------|
|St Ann | 1,877| 13,730| 103,191| 118,798|
|----------------+------------+------------+------------+------------|
|Hanover | -| -| 67,153| 67,153|
|----------------+------------+------------+------------+------------|
|Westmoreland | -| 14,500| 19,000| 33,500|
|----------------+------------+------------+------------+------------|
|St. Elizabeth | -| 90,400| 53,859| 144,259|
|----------------+------------+------------+------------+------------|
|Manchester | -| -| 334,083| 334,083|
|----------------+------------+------------+------------+------------|
|Clarendon | -| 100,596| 39,883| 140,479|
|----------------+------------+------------+------------+------------|
|St. Catherine | -| 10,342| 113,197| 123,539|
|----------------+------------+------------+------------+------------|
|ALL | 4,680| 232,337| 1,157,794| 1,394,811|
----------------------------------------------------------------------
27
DAIRY CATTLE SURVEY – 2004
Appendix 12
Distribution of milk disposed of by method of disposal
and class size
--------------------------------------------------------------------------------
|METHOD OF DISPOSAL| CLASS SIZE | |
| |--------------------------------------------| |
| | Small | Medium | Large | ALL |
| |--------------+--------------+--------------+--------------|
| | Amount | | Amount | | Amount | | Amount | |
| | (l) | % | (l) | % | (l) | % | (l) | % |
|------------------+--------+-----+--------+-----+--------+-----+--------+-----|
|Sold To Condensery| 3,287| 0.2| 158,898| 11.4| 245,123| 17.6| 407,308| 29.2|
|------------------+--------+-----+--------+-----+--------+-----+--------+-----|
|Sold To Fresh Milk| | | | | | | | |
|Processor | 1,095| 0.1| 51,315| 3.7| 891,905| 63.9| 944,316| 67.7|
--------------------------------------------------------------------------------
28

DAIRY CATTLE SURVEY - 2004
Appendix 13
Distribution of farmers by method of milk disposal
and class size
-------------------------------------------------------------------------
|METHOD OF DISPOSAL | CLASS SIZE | |
| |-----------------------------------| |
| | Small | Medium | Large | ALL |
| |-----------+-----------+-----------+-----------|
| | N | % | N | % | N | % | N | % |
|-----------------------+-----+-----+-----+-----+-----+-----+-----+-----|
|Sold To Condensery | 4| 5.3| 29| 38.2| 19| 25.0| 52| 68.4|
|-----------------------+-----+-----+-----+-----+-----+-----+-----+-----|
|Sold To Fresh Milk | | | | | | | | |
|Processor | 3| 3.9| 11| 14.5| 13| 17.1| 27| 35.5|
-------------------------------------------------------------------------
29

DAIRY CATTLE SURVEY - 2004
Appendix 14
Distribution of cattle disposed of by method of disposal,
class size and type of cattle
----------------------------------------------------------------------------------------------
|METHOD OF | CLASS SIZE | |
|DISPOSAL |-----------------------------------------------------------| |
| | Small | Medium | Large | ALL |
| |-------------------+-------------------+-------------------+-------------------|
| | Cow | Heifer | Cow | Heifer | Cow | Heifer | Cow | Heifer |
| |---------+---------+---------+---------+---------+---------+---------+---------|
| |Amt | % |Amt | % |Amt | % |Amt | % |Amt | % |Amt | % |Amt | % |Amt | % |
|------------+----+----+----+----+----+----+----+----+----+----+----+----+----+----+----+----|
|Sold to | | | | | | | | | | | | | | | | |
|Butcher | 6| 86| 3| 100| 277| 100| 21| 54| 773| 89| 49| 82|1056| 91| 73| 72|
|------------+----+----+----+----+----+----+----+----+----+----+----+----+----+----+----+----|
|Sold as | | | | | | | | | | | | | | | | |
|Breeding | | | | | | | | | | | | | | | | |
|Stock | 1| 14| -| -| -| -| 18| 46| -| -| 11| 18| 1| 0| 29| 28|
|------------+----+----+----+----+----+----+----+----+----+----+----+----+----+----+----+----|
|Other | -| -| -| -| -| -| -| -| 100| 11| -| -| 100| 9| -| -|
|------------+----+----+----+----+----+----+----+----+----+----+----+----+----+----+----+----|
|ALL | 7| 100| 3| 100| 277| 100| 39| 100| 873| 100| 60| 100|1157| 100| 102| 100|
----------------------------------------------------------------------------------------------
30

DAIRY CATTLE SURVEY - 2004
Appendix 15
Distribution of farmers by equipment employed and
class size
----------------------------------------------------------------------
|EQUIPMENT EMPLOYED | CLASS SIZE | |
| |-----------------------------------| |
| | Small | Medium | Large | ALL |
| |-----------+-----------+-----------+-----------|
| | N | % | N | % | N | % | N | % |
|--------------------+-----+-----+-----+-----+-----+-----+-----+-----|
|Bulk Cooler | -| -| 31| 40.8| 28| 36.8| 59| 77.6|
|--------------------+-----+-----+-----+-----+-----+-----+-----+-----|
|Feed Silo | -| -| 2| 2.6| 12| 15.8| 14| 18.4|
|--------------------+-----+-----+-----+-----+-----+-----+-----+-----|
|Standby Generator | -| -| 11| 14.5| 22| 28.9| 33| 43.4|
|--------------------+-----+-----+-----+-----+-----+-----+-----+-----|
|Tractor for Tillage | -| -| 9| 11.8| 24| 31.6| 33| 43.4|
|--------------------+-----+-----+-----+-----+-----+-----+-----+-----|
|Hay/Silage making | | | | | | | | |
|equipment | -| -| 1| 1.3| 3| 3.9| 4| 5.3|
----------------------------------------------------------------------
31
DAIRY CATTLE SURVEY - 2004
Appendix 16
Distribution of farmers by irrigation source and
class size
----------------------------------------------------------------------
|IRRIGATION SOURCE | CLASS SIZE | |
| |-----------------------------------| |
| | Small | Medium | Large | ALL |
| |-----------+-----------+-----------+-----------|
| | N | % | N | % | N | % | N | % |
|--------------------+-----+-----+-----+-----+-----+-----+-----+-----|
|Own Well | -| -| 5| 6.6| 4| 5.3| 9| 11.8|
|--------------------+-----+-----+-----+-----+-----+-----+-----+-----|
|NIC | -| -| 12| 15.8| 3| 3.9| 15| 19.7|
|--------------------+-----+-----+-----+-----+-----+-----+-----+-----|
|River | -| -| 1| 1.3| -| -| 1| 1.3|
|--------------------+-----+-----+-----+-----+-----+-----+-----+-----|
|Pond | -| -| 1| 1.3| -| -| 1| 1.3|
----------------------------------------------------------------------
32

DAIRY CATTLE SURVEY - 2004
Appendix 17
Distribution of farmers by type of spraying equipment and
class size
----------------------------------------------------------------------
|SPRAYING EQUIPMENT | CLASS SIZE | |
| |-----------------------------------| |
| | Small | Medium | Large | ALL |
| |-----------+-----------+-----------+-----------|
| | N | % | N | % | N | % | N | % |
|--------------------+-----+-----+-----+-----+-----+-----+-----+-----|
|Spray Race | -| -| 4| 5.3| 11| 14.5| 15| 19.7|
|--------------------+-----+-----+-----+-----+-----+-----+-----+-----|
|Dip | -| -| -| -| 1| 1.3| 1| 1.3|
|--------------------+-----+-----+-----+-----+-----+-----+-----+-----|
|Mist Blower | -| -| 4| 5.3| 4| 5.3| 8| 10.5|
|--------------------+-----+-----+-----+-----+-----+-----+-----+-----|
|Hand | 7| 9.2| 34| 44.7| 14| 18.4| 55| 72.4|
----------------------------------------------------------------------
33

DAIRY CATTLE SURVEY - 2004
Appendix 18
Distribution of farmers by irrigation method and
class size
----------------------------------------------------------------------
|IRRIGATION METHOD | CLASS SIZE | |
| |-----------------------------------| |
| | Small | Medium | Large | ALL |
| |-----------+-----------+-----------+-----------|
| | N | % | N | % | N | % | N | % |
|--------------------+-----+-----+-----+-----+-----+-----+-----+-----|
|Sprinkler System | -| -| 13| 17.1| 3| 3.9| 16| 21.1|
|--------------------+-----+-----+-----+-----+-----+-----+-----+-----|
|Flood | -| -| 3| 3.9| 2| 2.6| 5| 6.6|
|--------------------+-----+-----+-----+-----+-----+-----+-----+-----|
|Relift Pump | -| -| 5| 6.6| -| -| 5| 6.6|
|--------------------+-----+-----+-----+-----+-----+-----+-----+-----|
|Pressured Water | -| -| 6| 7.9| 2| 2.6| 8| 10.5|
|--------------------+-----+-----+-----+-----+-----+-----+-----+-----|
|Other | -| -| -| -| -| -| -| -|
----------------------------------------------------------------------
34

35

36