curis.ku.dkcuris.ku.dk/ws/files/40905533/journal.pone.0031645.pdf · Københavns Universitet...
12
university of copenhagen Københavns Universitet Transcriptome and network changes in climbers at extreme altitudes Chen, Fang; Zhang, Wei; Liang, Yu; Huang, Jialiang; Li, Kui; Green, Christopher D.; Liu, Jiancheng; Zhang, Guojie; Zhou, Bing; Yi, Xin; Wang, Wei; Liu, Hang; Xu, Xiaohong; Shen, Feng; Qu, Ning; Wang, Yading; Gao, Guoyi; San, A.; JiangBai, LuoSang; Sang, Hua; Fang, Xiangdong; Kristiansen, Karsten; Yang, Huanming; Wang, Jun; Han, Jing-Dong J.; Wang, Jian Published in: P L o S One DOI: 10.1371/journal.pone.0031645 Publication date: 2012 Document Version Publisher's PDF, also known as Version of record Citation for published version (APA): Chen, F., Zhang, W., Liang, Y., Huang, J., Li, K., Green, C. D., ... Wang, J. (2012). Transcriptome and network changes in climbers at extreme altitudes. DOI: 10.1371/journal.pone.0031645 Download date: 01. Aug. 2018
Transcript of curis.ku.dkcuris.ku.dk/ws/files/40905533/journal.pone.0031645.pdf · Københavns Universitet...

u n i ve r s i t y o f co pe n h ag e n
Københavns Universitet
Transcriptome and network changes in climbers at extreme altitudes
Chen, Fang; Zhang, Wei; Liang, Yu; Huang, Jialiang; Li, Kui; Green, Christopher D.; Liu,Jiancheng; Zhang, Guojie; Zhou, Bing; Yi, Xin; Wang, Wei; Liu, Hang; Xu, Xiaohong; Shen,Feng; Qu, Ning; Wang, Yading; Gao, Guoyi; San, A.; JiangBai, LuoSang; Sang, Hua; Fang,Xiangdong; Kristiansen, Karsten; Yang, Huanming; Wang, Jun; Han, Jing-Dong J.; Wang,JianPublished in:P L o S One
DOI:10.1371/journal.pone.0031645
Publication date:2012
Document VersionPublisher's PDF, also known as Version of record
Citation for published version (APA):Chen, F., Zhang, W., Liang, Y., Huang, J., Li, K., Green, C. D., ... Wang, J. (2012). Transcriptome and networkchanges in climbers at extreme altitudes. DOI: 10.1371/journal.pone.0031645
Download date: 01. Aug. 2018
Transcriptome and Network Changes in Climbers atExtreme AltitudesFang Chen1,3,5., Wei Zhang2,4,5., Yu Liang3,5., Jialiang Huang2,4,5., Kui Li3,5., Christopher D. Green2.,
Jiancheng Liu2,4,5., Guojie Zhang1, Bing Zhou2,4,5, Xin Yi1,3,5, Wei Wang1, Hang Liu1, Xiaohong Xu1, Feng
Shen1, Ning Qu1, Yading Wang1, Guoyi Gao6, A San1,3,5, LuoSang JiangBai1, Hua Sang1, Xiangdong
Fang3, Karsten Kristiansen7, Huanming Yang1, Jun Wang1,7*, Jing-Dong J. Han2*, Jian Wang1*
1 BGI Shenzhen, Shenzhen, China, 2 Chinese Academy of Sciences Key Laboratory of Computational Biology, CAS-MPG Partner Institute for Computational Biology,
Chinese Academy of Sciences, Shanghai, China, 3 Beijing Institute of Genomics, Chinese Academy of Sciences, Beijing, China, 4 Center for Molecular Systems Biology,
Institute of Genetics and Developmental Biology, Chinese Academy of Sciences, Beijing, China, 5 The Graduate University of Chinese Academy of Sciences, Beijing, China,
6 The Hospital of XiShuangBanNa Dai Nationalities Autonomous, Jinghong, China, 7 Department of Biology, University of Copenhagen, Copenhagen, Denmark
Abstract
Extreme altitude can induce a range of cellular and systemic responses. Although it is known that hypoxia underlies themajor changes and that the physiological responses include hemodynamic changes and erythropoiesis, the molecularmechanisms and signaling pathways mediating such changes are largely unknown. To obtain a more complete picture ofthe transcriptional regulatory landscape and networks involved in extreme altitude response, we followed four climbers onan expedition up Mount Xixiabangma (8,012 m), and collected blood samples at four stages during the climb for mRNA andmiRNA expression assays. By analyzing dynamic changes of gene networks in response to extreme altitudes, we uncovereda highly modular network with 7 modules of various functions that changed in response to extreme altitudes. Theerythrocyte differentiation module is the most prominently up-regulated, reflecting increased erythrocyte differentiationfrom hematopoietic stem cells, probably at the expense of differentiation into other cell lineages. These changes areaccompanied by coordinated down-regulation of general translation. Network topology and flow analyses also uncoveredregulators known to modulate hypoxia responses and erythrocyte development, as well as unknown regulators, such as theOCT4 gene, an important regulator in stem cells and assumed to only function in stem cells. We predicted computationallyand validated experimentally that increased OCT4 expression at extreme altitude can directly elevate the expression ofhemoglobin genes. Our approach established a new framework for analyzing the transcriptional regulatory network from avery limited number of samples.
Citation: Chen F, Zhang W, Liang Y, Huang J, Li K, et al. (2012) Transcriptome and Network Changes in Climbers at Extreme Altitudes. PLoS ONE 7(2): e31645.doi:10.1371/journal.pone.0031645
Editor: Christos A. Ouzounis, The Centre for Research and Technology, Hellas, Greece
Received July 5, 2011; Accepted January 11, 2012; Published February 29, 2012
Copyright: � 2012 Chen et al. This is an open-access article distributed under the terms of the Creative Commons Attribution License, which permitsunrestricted use, distribution, and reproduction in any medium, provided the original author and source are credited.
Funding: This work was supported by grants from the China National Science Foundation (Grant # 30890033, #30588001 and #30620120433), Chinese Ministryof Science and Technology (973 program, Grant #2006CB910700, #2006CB504103) and Chinese Academy of Sciences (#KSCX1-YW-R-40, #KSCX2-YW-R-76),Science and Technology Plan of the Tibet Autonomous Region (#2007-2-18). The funders had no role in study design, data collection and analysis, decision topublish, or preparation of the manuscript.
Competing Interests: The authors have declared that no competing interests exist.
* E-mail: [email protected] (JW); [email protected] (JDJH); [email protected] (JW)
. These authors contributed equally to this work.
Introduction
At extreme altitudes (.5500 m above sea level) the partial
pressure of oxygen is less than a half of the sea level. At these
conditions, humans experience hypobaric hypoxia, which can
induce a range of normal or adverse responses at cellular and
systemic levels. At the cellular level, there is increased expression of
genes that participate in anaerobic energy supply and decreased
expression of those involved in ATP consumption processes [1]. At
the systems level, the major physiological responses include
increased heart and ventilation rate and rapid erythrocyte
expansion [2,3]. Normally, symptoms of increased heart rate and
hyperventilation would appear within the first few hours when
ascending to high-altitude, which is due to stimulation of the
peripheral chemoreceptors by hypoxia. In the following days,
increased hemoglobin concentration and erythrocyte numbers
would be observed in the blood, which is more likely to be a
gene-level regulation of the body. These signs together with other
response of different systems of the body comprised altitude
acclimatization. When maladapted, a person can develop high
altitude illnesses that range from mild, acute mountain sickness
(AMS), which occurs in 50–90% of the populations, to fatal high-
altitude cerebral edema (HACE) and high-altitude pulmonary
edema (HAPE), which have much lower frequencies [4,5]. Field
studies on these physiological aspects have generated a great deal of
valuable data for understanding these processes, including ECG
measurements [6,7], arterial blood gases, and oxygen content [8].
The molecular mechanisms of hypoxia and high altitude acclima-
tization are more limited and primarily include information about
hypoxia-induced factors (HIFs) and the role of erythropoietin in the
high altitude response [1,2,3]. The signaling pathways and
molecular functions that mediate such responses (especially those
that modulate or are independent of HIFs and erythropoietin) are
largely unknown.
PLoS ONE | www.plosone.org 1 February 2012 | Volume 7 | Issue 2 | e31645
To obtain a more complete picture of the transcriptional
regulatory landscape and networks involved in extreme altitude
response, we accompanied four individuals on a climbing
expedition and measured the transcriptome (mRNA and miRNA
expression levels) using RNA-seq from blood samples taken before,
during, and a month after climbing Mount Xixiabangma
(Figure 1A). To the best of our knowledge there has been so far
no study on genome-wide expression changes in human high-
altitude response and that ours is the first one and is therefore
important in shedding lights on this very important human
acclimation process and prevention of the pathological effects
associated with it.
We chose to collect blood samples mainly because of its easy
accessibility, which is extremely important if gene expression
changes revealed were to be used as biomarkers for diagnosing
maladaptation and pathological response in the future. Mean-
while, we can monitor the transcriptome changes in both
nucleated erythrocytes and white blood cells by measuring the
blood samples, which is very important as both the increased
erythropoiesis and inflammatory response are known to have a
close link with hypoxia [2,3,9,10,11].
Due to the large individual variations and the limited sample size,
we developed a novel network-based analysis approach to identify
the differentially expressed network modules and important
regulators in response to extreme altitude. By doing so, we
uncovered a highly modular network with seven modules of various
functions, with the erythrocyte differentiation module being the
most prominently up-regulated, indicative of shifted differentiation
of hematopoietic stem cells to increase erythrocyte fate at the
expense of other alternative cell fates. The network modules also
revealed a coordinated down-regulation of genes involved in
translation elongation at extreme altitudes. Network topology and
flow analyses further uncovered both known and novel regulators of
hypoxia responses and erythrocyte development.
Results
Climbers’ informationFour climbers participated in this study, including two ,55-
year-old males (A and B, A is a frequent climber of Mount
Xixiabangma), a 44-year-old, well-trained male mountaineer (C),
and a 33-year-old female (D). The four individuals did not travel
above 3,000 m in the past six month, and they did not suffer from
any severe altitude sicknesses after they arrived in Lhasa and
during the mountain-climbing. Blood samples were taken at Lhasa
(LS, 3,650 m above sea level) during the ascent and the base camp
(ABC, .5600 m), at Dingri (DR, 4,400 m), during the descent,
and at Shenzhen (SZ, 100 m) a month later (Figure 1A, Methods).
General profiles of transcriptome in response to extremealtitudes
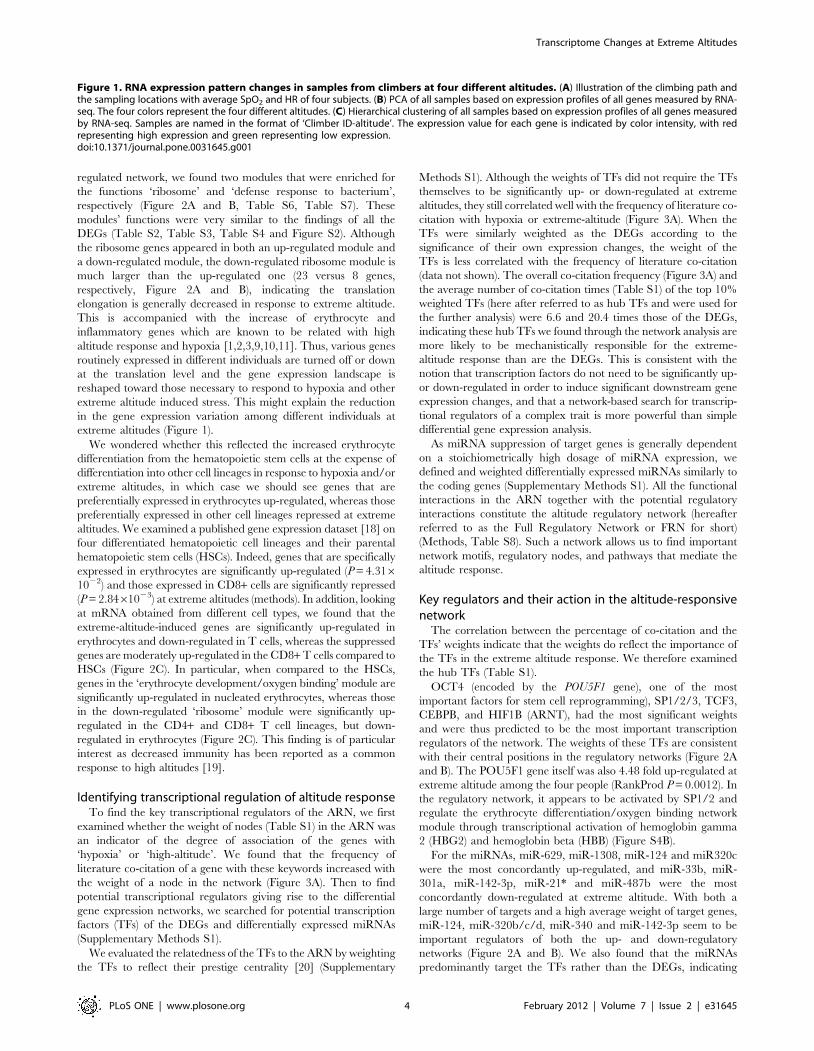
Principal Component Analysis (PCA) of the data showed there
was large variance within the expression profiles of different
individuals at lower altitudes (100 m and 3,650 m), especially for
the older individuals, but at higher altitudes (5,600 m and
4,400 m) the expression profiles of different individuals look quite
similar (Figure 1B). Hierarchical clustering of the samples clearly
separated the profiles into two major clusters according to the high
(4,400 m and 5,600 m) and low altitudes (100 m and 3,650 m)
(Figure 1C, Figure S1A), indicating extreme altitude induces a
common transcriptional regulatory program. Moreover, within
the 100 m and 3650 m sample cluster, the expression profiles
grouped by individual rather than by altitude, whereas those at
extreme altitudes were more uniform, indicative of decreased
individual variances at extreme altitudes (Figure 1C). Climber C as
a well-trained mountain climber had low-altitude profiles that
were closest to the clustering seen in the extreme-altitude profiles
(Figure 1B).
Although .3000 m is typically defined as being of high altitude,
the expression profiles we obtained at 3,650 m from the climbers
were more similar to those at 100 m than those at 4,400 m and
5,600 m. These profiles, however, do not necessarily indicate the
environmental factors of the 3,650 m are more similar to the sea
level (100 m) than those of the two higher altitudes (4,400 m and
5,600 m). In fact, it may be very likely due to the climbers’ lack of
acclimatization time at 3,650 m (1 day) compared with 5,600 m
and 4,400 m which have more than 15 days exposure at high
altitude (Figure 1A), and/or due to the climbers’ intense physical
activities (climbing) at 4,400 m and 5,600 m compared with
100 m or 3,650 m.
It should also be noticed that the observed differential gene
expression might not be merely caused by the environmental factors
at different altitudes, e.g. the partial pressure of oxygen, the amount
of exposure to the ultraviolet light, the temperature, etc. It could also
be caused by other factors of the climbers, e.g. different food, intense
physical activities, dehydration, etc. Due to the limitation of our not
fully controlled experiment design, which is difficult to achieve given
the extreme nature of the environment studied, we could not
exclude the possibility of other factors and suggest the high altitude
alone has a causal role for the differential expression.
We performed the RankProd package [12] to identify
differentially expressed genes (DEGs). In total, 723 DEGs
including 380 up- and 343 down-regulated genes were found in
response to extreme altitudes (Methods, Table S1). Then we
identified the enriched Gene Ontology (GO) terms [13] and Kyoto
Encyclopedia of Genes and Genomes (KEGG) pathways [14] in
response to extreme altitude using the Fisher’s exact test and Gene
Set Enrichment Analysis (GSEA) [15] (Methods). We found that
the most significantly up-regulated gene sets are ‘‘hemoglobin
complex’’, ‘‘inflammatory response’’, ‘‘cytoskeleton’’, ‘‘myeloid
cell differentiation’’, and ‘‘oxidoreductase activity’’, whereas the
most significantly down-regulated ones are ‘‘ribosome’’, ‘‘platelet
alpha granule lumen’’, and ‘‘killing of cells of another organism’’
(Table S2, Table S3, Table S4 and Figure S2).
Modular network responsive to extreme altitudesTo obtain robust analysis results, we based our analysis at the level
of functional interactions, which are defined as the union of the
interactions from 3 sources: KEGG [14], STRING [16] and
IntNetDB [17] (Supplementary Methods S1). First, we constructed
an altitude-responsive network (hereafter referred to as the ARN for
short) that includes 310 genes among the 723 DEGs (Methods,
Table S1, Figure S3A). To further distinguish the functions that are
up- or down-regulated, we separated the ARN into 172 up-regulated
genes with 341 edges and 89 down-regulated genes with 250 edges in
the up- and down-regulated networks, respectively (Figure S3B).
Visualization of the up- and down-regulated networks revealed
the obvious existence of network modules (clusters of tightly
connected subnetworks) in each of the networks (Figure S3B,
Table S5). Due to the high density of interactions in ARN, the
modules could hardly be manually separated. However, they could
be clearly delineated using a Markov Clustering algorithm
(Methods, Figure 2A and B).
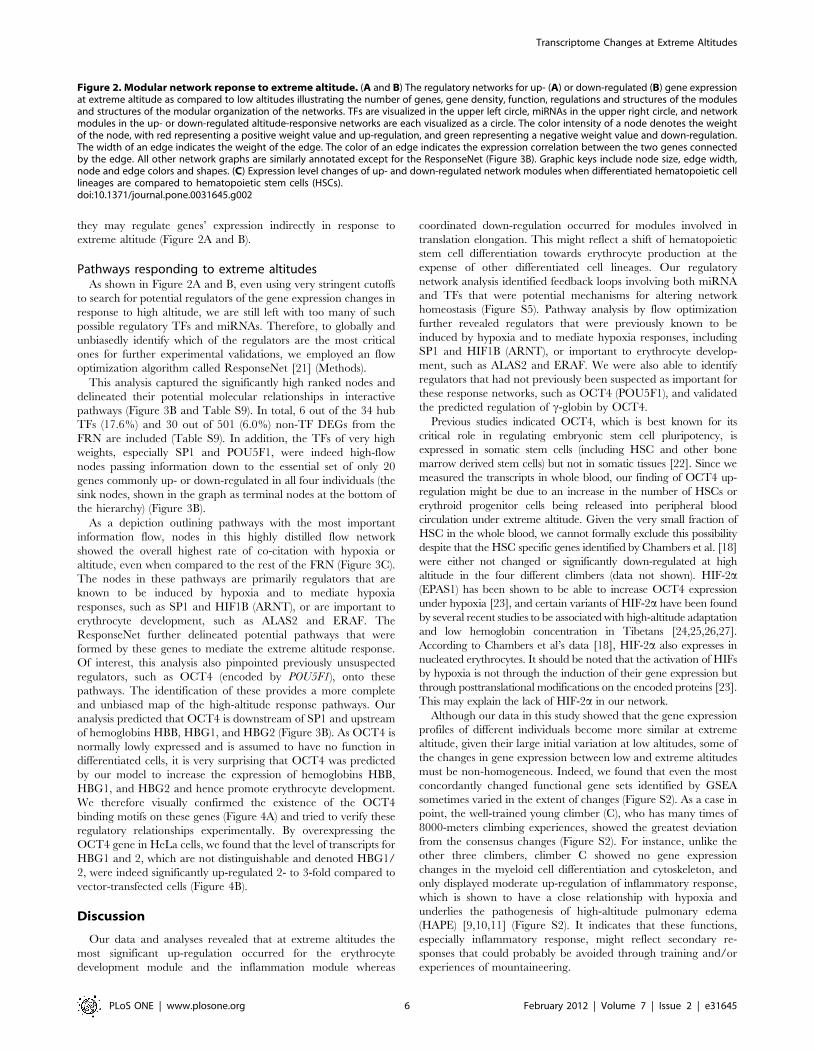
By examining enriched GO terms and KEGG pathways using
the Fisher’s exact test, we found that the up-regulated network
contained five modules corresponding to the functions ‘inflamma-
tion’, ‘erythrocyte development/oxygen binding’, ‘ribosome’,
‘cytoskeleton’, and ‘oxdoreductase’, respectively. In the down-
Transcriptome Changes at Extreme Altitudes
PLoS ONE | www.plosone.org 2 February 2012 | Volume 7 | Issue 2 | e31645

Transcriptome Changes at Extreme Altitudes
PLoS ONE | www.plosone.org 3 February 2012 | Volume 7 | Issue 2 | e31645
regulated network, we found two modules that were enriched for
the functions ‘ribosome’ and ‘defense response to bacterium’,
respectively (Figure 2A and B, Table S6, Table S7). These
modules’ functions were very similar to the findings of all the
DEGs (Table S2, Table S3, Table S4 and Figure S2). Although
the ribosome genes appeared in both an up-regulated module and
a down-regulated module, the down-regulated ribosome module is
much larger than the up-regulated one (23 versus 8 genes,
respectively, Figure 2A and B), indicating the translation
elongation is generally decreased in response to extreme altitude.
This is accompanied with the increase of erythrocyte and
inflammatory genes which are known to be related with high
altitude response and hypoxia [1,2,3,9,10,11]. Thus, various genes
routinely expressed in different individuals are turned off or down
at the translation level and the gene expression landscape is
reshaped toward those necessary to respond to hypoxia and other
extreme altitude induced stress. This might explain the reduction
in the gene expression variation among different individuals at
extreme altitudes (Figure 1).
We wondered whether this reflected the increased erythrocyte
differentiation from the hematopoietic stem cells at the expense of
differentiation into other cell lineages in response to hypoxia and/or
extreme altitudes, in which case we should see genes that are
preferentially expressed in erythrocytes up-regulated, whereas those
preferentially expressed in other cell lineages repressed at extreme
altitudes. We examined a published gene expression dataset [18] on
four differentiated hematopoietic cell lineages and their parental
hematopoietic stem cells (HSCs). Indeed, genes that are specifically
expressed in erythrocytes are significantly up-regulated (P = 4.3161022) and those expressed in CD8+ cells are significantly repressed
(P = 2.8461023) at extreme altitudes (methods). In addition, looking
at mRNA obtained from different cell types, we found that the
extreme-altitude-induced genes are significantly up-regulated in
erythrocytes and down-regulated in T cells, whereas the suppressed
genes are moderately up-regulated in the CD8+ T cells compared to
HSCs (Figure 2C). In particular, when compared to the HSCs,
genes in the ‘erythrocyte development/oxygen binding’ module are
significantly up-regulated in nucleated erythrocytes, whereas those
in the down-regulated ‘ribosome’ module were significantly up-
regulated in the CD4+ and CD8+ T cell lineages, but down-
regulated in erythrocytes (Figure 2C). This finding is of particular
interest as decreased immunity has been reported as a common
response to high altitudes [19].
Identifying transcriptional regulation of altitude responseTo find the key transcriptional regulators of the ARN, we first
examined whether the weight of nodes (Table S1) in the ARN was
an indicator of the degree of association of the genes with
‘hypoxia’ or ‘high-altitude’. We found that the frequency of
literature co-citation of a gene with these keywords increased with
the weight of a node in the network (Figure 3A). Then to find
potential transcriptional regulators giving rise to the differential
gene expression networks, we searched for potential transcription
factors (TFs) of the DEGs and differentially expressed miRNAs
(Supplementary Methods S1).
We evaluated the relatedness of the TFs to the ARN by weighting
the TFs to reflect their prestige centrality [20] (Supplementary
Methods S1). Although the weights of TFs did not require the TFs
themselves to be significantly up- or down-regulated at extreme
altitudes, they still correlated well with the frequency of literature co-
citation with hypoxia or extreme-altitude (Figure 3A). When the
TFs were similarly weighted as the DEGs according to the
significance of their own expression changes, the weight of the
TFs is less correlated with the frequency of literature co-citation
(data not shown). The overall co-citation frequency (Figure 3A) and
the average number of co-citation times (Table S1) of the top 10%
weighted TFs (here after referred to as hub TFs and were used for
the further analysis) were 6.6 and 20.4 times those of the DEGs,
indicating these hub TFs we found through the network analysis are
more likely to be mechanistically responsible for the extreme-
altitude response than are the DEGs. This is consistent with the
notion that transcription factors do not need to be significantly up-
or down-regulated in order to induce significant downstream gene
expression changes, and that a network-based search for transcrip-
tional regulators of a complex trait is more powerful than simple
differential gene expression analysis.
As miRNA suppression of target genes is generally dependent
on a stoichiometrically high dosage of miRNA expression, we
defined and weighted differentially expressed miRNAs similarly to
the coding genes (Supplementary Methods S1). All the functional
interactions in the ARN together with the potential regulatory
interactions constitute the altitude regulatory network (hereafter
referred to as the Full Regulatory Network or FRN for short)
(Methods, Table S8). Such a network allows us to find important
network motifs, regulatory nodes, and pathways that mediate the
altitude response.
Key regulators and their action in the altitude-responsivenetwork
The correlation between the percentage of co-citation and the
TFs’ weights indicate that the weights do reflect the importance of
the TFs in the extreme altitude response. We therefore examined
the hub TFs (Table S1).
OCT4 (encoded by the POU5F1 gene), one of the most
important factors for stem cell reprogramming), SP1/2/3, TCF3,
CEBPB, and HIF1B (ARNT), had the most significant weights
and were thus predicted to be the most important transcription
regulators of the network. The weights of these TFs are consistent
with their central positions in the regulatory networks (Figure 2A
and B). The POU5F1 gene itself was also 4.48 fold up-regulated at
extreme altitude among the four people (RankProd P = 0.0012). In
the regulatory network, it appears to be activated by SP1/2 and
regulate the erythrocyte differentiation/oxygen binding network
module through transcriptional activation of hemoglobin gamma
2 (HBG2) and hemoglobin beta (HBB) (Figure S4B).
For the miRNAs, miR-629, miR-1308, miR-124 and miR320c
were the most concordantly up-regulated, and miR-33b, miR-
301a, miR-142-3p, miR-21* and miR-487b were the most
concordantly down-regulated at extreme altitude. With both a
large number of targets and a high average weight of target genes,
miR-124, miR-320b/c/d, miR-340 and miR-142-3p seem to be
important regulators of both the up- and down-regulatory
networks (Figure 2A and B). We also found that the miRNAs
predominantly target the TFs rather than the DEGs, indicating
Figure 1. RNA expression pattern changes in samples from climbers at four different altitudes. (A) Illustration of the climbing path andthe sampling locations with average SpO2 and HR of four subjects. (B) PCA of all samples based on expression profiles of all genes measured by RNA-seq. The four colors represent the four different altitudes. (C) Hierarchical clustering of all samples based on expression profiles of all genes measuredby RNA-seq. Samples are named in the format of ‘Climber ID-altitude’. The expression value for each gene is indicated by color intensity, with redrepresenting high expression and green representing low expression.doi:10.1371/journal.pone.0031645.g001
Transcriptome Changes at Extreme Altitudes
PLoS ONE | www.plosone.org 4 February 2012 | Volume 7 | Issue 2 | e31645

Transcriptome Changes at Extreme Altitudes
PLoS ONE | www.plosone.org 5 February 2012 | Volume 7 | Issue 2 | e31645
they may regulate genes’ expression indirectly in response to
extreme altitude (Figure 2A and B).
Pathways responding to extreme altitudesAs shown in Figure 2A and B, even using very stringent cutoffs
to search for potential regulators of the gene expression changes in
response to high altitude, we are still left with too many of such
possible regulatory TFs and miRNAs. Therefore, to globally and
unbiasedly identify which of the regulators are the most critical
ones for further experimental validations, we employed an flow
optimization algorithm called ResponseNet [21] (Methods).
This analysis captured the significantly high ranked nodes and
delineated their potential molecular relationships in interactive
pathways (Figure 3B and Table S9). In total, 6 out of the 34 hub
TFs (17.6%) and 30 out of 501 (6.0%) non-TF DEGs from the
FRN are included (Table S9). In addition, the TFs of very high
weights, especially SP1 and POU5F1, were indeed high-flow
nodes passing information down to the essential set of only 20
genes commonly up- or down-regulated in all four individuals (the
sink nodes, shown in the graph as terminal nodes at the bottom of
the hierarchy) (Figure 3B).
As a depiction outlining pathways with the most important
information flow, nodes in this highly distilled flow network
showed the overall highest rate of co-citation with hypoxia or
altitude, even when compared to the rest of the FRN (Figure 3C).
The nodes in these pathways are primarily regulators that are
known to be induced by hypoxia and to mediate hypoxia
responses, such as SP1 and HIF1B (ARNT), or are important to
erythrocyte development, such as ALAS2 and ERAF. The
ResponseNet further delineated potential pathways that were
formed by these genes to mediate the extreme altitude response.
Of interest, this analysis also pinpointed previously unsuspected
regulators, such as OCT4 (encoded by POU5F1), onto these
pathways. The identification of these provides a more complete
and unbiased map of the high-altitude response pathways. Our
analysis predicted that OCT4 is downstream of SP1 and upstream
of hemoglobins HBB, HBG1, and HBG2 (Figure 3B). As OCT4 is
normally lowly expressed and is assumed to have no function in
differentiated cells, it is very surprising that OCT4 was predicted
by our model to increase the expression of hemoglobins HBB,
HBG1, and HBG2 and hence promote erythrocyte development.
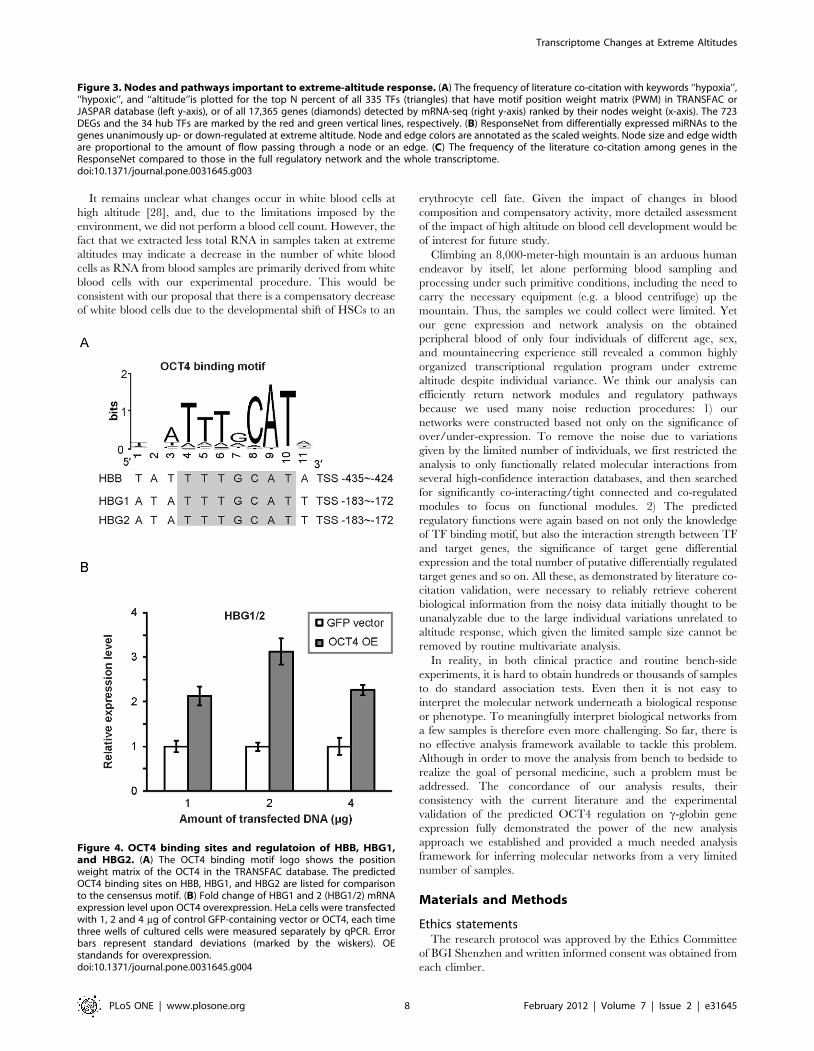
We therefore visually confirmed the existence of the OCT4
binding motifs on these genes (Figure 4A) and tried to verify these
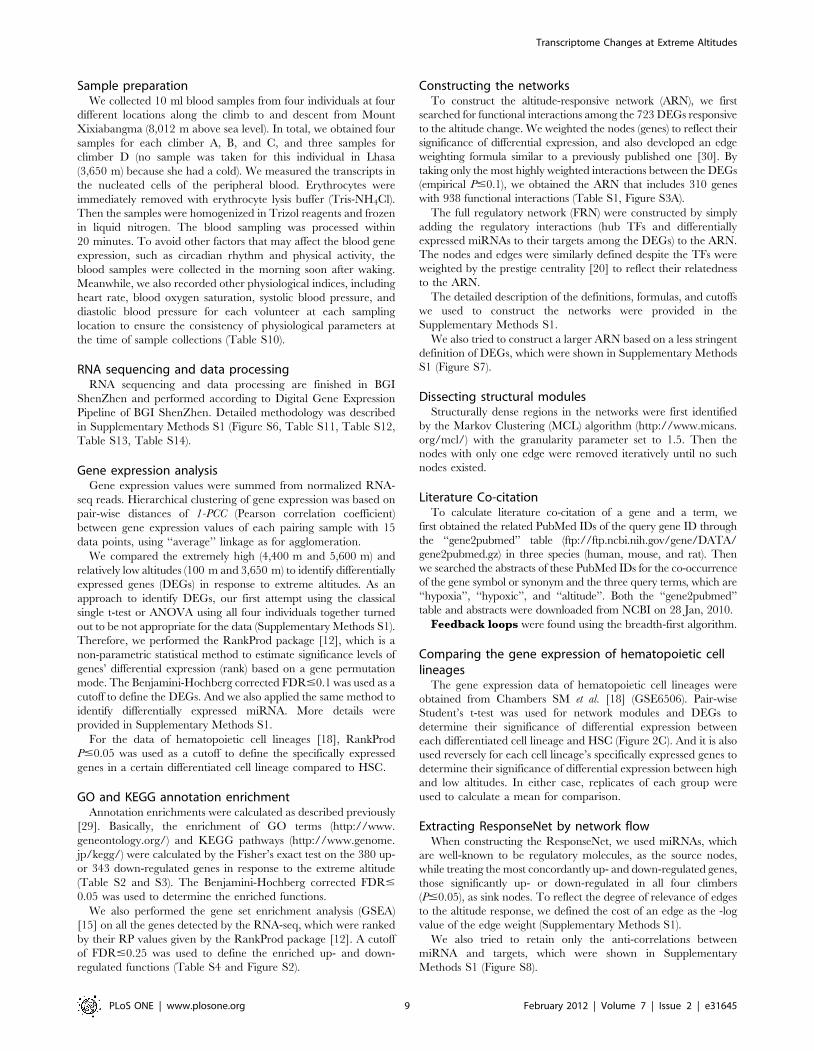
regulatory relationships experimentally. By overexpressing the
OCT4 gene in HeLa cells, we found that the level of transcripts for
HBG1 and 2, which are not distinguishable and denoted HBG1/
2, were indeed significantly up-regulated 2- to 3-fold compared to
vector-transfected cells (Figure 4B).
Discussion
Our data and analyses revealed that at extreme altitudes the
most significant up-regulation occurred for the erythrocyte
development module and the inflammation module whereas
coordinated down-regulation occurred for modules involved in
translation elongation. This might reflect a shift of hematopoietic
stem cell differentiation towards erythrocyte production at the
expense of other differentiated cell lineages. Our regulatory
network analysis identified feedback loops involving both miRNA
and TFs that were potential mechanisms for altering network
homeostasis (Figure S5). Pathway analysis by flow optimization
further revealed regulators that were previously known to be
induced by hypoxia and to mediate hypoxia responses, including
SP1 and HIF1B (ARNT), or important to erythrocyte develop-
ment, such as ALAS2 and ERAF. We were also able to identify
regulators that had not previously been suspected as important for
these response networks, such as OCT4 (POU5F1), and validated
the predicted regulation of c-globin by OCT4.
Previous studies indicated OCT4, which is best known for its
critical role in regulating embryonic stem cell pluripotency, is
expressed in somatic stem cells (including HSC and other bone
marrow derived stem cells) but not in somatic tissues [22]. Since we
measured the transcripts in whole blood, our finding of OCT4 up-
regulation might be due to an increase in the number of HSCs or
erythroid progenitor cells being released into peripheral blood
circulation under extreme altitude. Given the very small fraction of
HSC in the whole blood, we cannot formally exclude this possibility
despite that the HSC specific genes identified by Chambers et al. [18]
were either not changed or significantly down-regulated at high
altitude in the four different climbers (data not shown). HIF-2a(EPAS1) has been shown to be able to increase OCT4 expression
under hypoxia [23], and certain variants of HIF-2a have been found
by several recent studies to be associated with high-altitude adaptation
and low hemoglobin concentration in Tibetans [24,25,26,27].
According to Chambers et al’s data [18], HIF-2a also expresses in
nucleated erythrocytes. It should be noted that the activation of HIFs
by hypoxia is not through the induction of their gene expression but
through posttranslational modifications on the encoded proteins [23].
This may explain the lack of HIF-2a in our network.
Although our data in this study showed that the gene expression
profiles of different individuals become more similar at extreme
altitude, given their large initial variation at low altitudes, some of
the changes in gene expression between low and extreme altitudes
must be non-homogeneous. Indeed, we found that even the most
concordantly changed functional gene sets identified by GSEA
sometimes varied in the extent of changes (Figure S2). As a case in
point, the well-trained young climber (C), who has many times of
8000-meters climbing experiences, showed the greatest deviation
from the consensus changes (Figure S2). For instance, unlike the
other three climbers, climber C showed no gene expression
changes in the myeloid cell differentiation and cytoskeleton, and
only displayed moderate up-regulation of inflammatory response,
which is shown to have a close relationship with hypoxia and
underlies the pathogenesis of high-altitude pulmonary edema
(HAPE) [9,10,11] (Figure S2). It indicates that these functions,
especially inflammatory response, might reflect secondary re-
sponses that could probably be avoided through training and/or
experiences of mountaineering.
Figure 2. Modular network reponse to extreme altitude. (A and B) The regulatory networks for up- (A) or down-regulated (B) gene expressionat extreme altitude as compared to low altitudes illustrating the number of genes, gene density, function, regulations and structures of the modulesand structures of the modular organization of the networks. TFs are visualized in the upper left circle, miRNAs in the upper right circle, and networkmodules in the up- or down-regulated altitude-responsive networks are each visualized as a circle. The color intensity of a node denotes the weightof the node, with red representing a positive weight value and up-regulation, and green representing a negative weight value and down-regulation.The width of an edge indicates the weight of the edge. The color of an edge indicates the expression correlation between the two genes connectedby the edge. All other network graphs are similarly annotated except for the ResponseNet (Figure 3B). Graphic keys include node size, edge width,node and edge colors and shapes. (C) Expression level changes of up- and down-regulated network modules when differentiated hematopoietic celllineages are compared to hematopoietic stem cells (HSCs).doi:10.1371/journal.pone.0031645.g002
Transcriptome Changes at Extreme Altitudes
PLoS ONE | www.plosone.org 6 February 2012 | Volume 7 | Issue 2 | e31645

Transcriptome Changes at Extreme Altitudes
PLoS ONE | www.plosone.org 7 February 2012 | Volume 7 | Issue 2 | e31645
It remains unclear what changes occur in white blood cells at
high altitude [28], and, due to the limitations imposed by the
environment, we did not perform a blood cell count. However, the
fact that we extracted less total RNA in samples taken at extreme
altitudes may indicate a decrease in the number of white blood
cells as RNA from blood samples are primarily derived from white
blood cells with our experimental procedure. This would be
consistent with our proposal that there is a compensatory decrease
of white blood cells due to the developmental shift of HSCs to an
erythrocyte cell fate. Given the impact of changes in blood
composition and compensatory activity, more detailed assessment
of the impact of high altitude on blood cell development would be
of interest for future study.
Climbing an 8,000-meter-high mountain is an arduous human
endeavor by itself, let alone performing blood sampling and
processing under such primitive conditions, including the need to
carry the necessary equipment (e.g. a blood centrifuge) up the
mountain. Thus, the samples we could collect were limited. Yet
our gene expression and network analysis on the obtained
peripheral blood of only four individuals of different age, sex,
and mountaineering experience still revealed a common highly
organized transcriptional regulation program under extreme
altitude despite individual variance. We think our analysis can
efficiently return network modules and regulatory pathways
because we used many noise reduction procedures: 1) our
networks were constructed based not only on the significance of
over/under-expression. To remove the noise due to variations
given by the limited number of individuals, we first restricted the
analysis to only functionally related molecular interactions from
several high-confidence interaction databases, and then searched
for significantly co-interacting/tight connected and co-regulated
modules to focus on functional modules. 2) The predicted
regulatory functions were again based on not only the knowledge
of TF binding motif, but also the interaction strength between TF
and target genes, the significance of target gene differential
expression and the total number of putative differentially regulated
target genes and so on. All these, as demonstrated by literature co-
citation validation, were necessary to reliably retrieve coherent
biological information from the noisy data initially thought to be
unanalyzable due to the large individual variations unrelated to
altitude response, which given the limited sample size cannot be
removed by routine multivariate analysis.
In reality, in both clinical practice and routine bench-side
experiments, it is hard to obtain hundreds or thousands of samples
to do standard association tests. Even then it is not easy to
interpret the molecular network underneath a biological response
or phenotype. To meaningfully interpret biological networks from
a few samples is therefore even more challenging. So far, there is
no effective analysis framework available to tackle this problem.
Although in order to move the analysis from bench to bedside to
realize the goal of personal medicine, such a problem must be
addressed. The concordance of our analysis results, their
consistency with the current literature and the experimental
validation of the predicted OCT4 regulation on c-globin gene
expression fully demonstrated the power of the new analysis
approach we established and provided a much needed analysis
framework for inferring molecular networks from a very limited
number of samples.
Materials and Methods
Ethics statementsThe research protocol was approved by the Ethics Committee
of BGI Shenzhen and written informed consent was obtained from
each climber.
Figure 3. Nodes and pathways important to extreme-altitude response. (A) The frequency of literature co-citation with keywords ‘‘hypoxia’’,‘‘hypoxic’’, and ‘‘altitude’’is plotted for the top N percent of all 335 TFs (triangles) that have motif position weight matrix (PWM) in TRANSFAC orJASPAR database (left y-axis), or of all 17,365 genes (diamonds) detected by mRNA-seq (right y-axis) ranked by their nodes weight (x-axis). The 723DEGs and the 34 hub TFs are marked by the red and green vertical lines, respectively. (B) ResponseNet from differentially expressed miRNAs to thegenes unanimously up- or down-regulated at extreme altitude. Node and edge colors are annotated as the scaled weights. Node size and edge widthare proportional to the amount of flow passing through a node or an edge. (C) The frequency of the literature co-citation among genes in theResponseNet compared to those in the full regulatory network and the whole transcriptome.doi:10.1371/journal.pone.0031645.g003
Figure 4. OCT4 binding sites and regulatoion of HBB, HBG1,and HBG2. (A) The OCT4 binding motif logo shows the positionweight matrix of the OCT4 in the TRANSFAC database. The predictedOCT4 binding sites on HBB, HBG1, and HBG2 are listed for comparisonto the censensus motif. (B) Fold change of HBG1 and 2 (HBG1/2) mRNAexpression level upon OCT4 overexpression. HeLa cells were transfectedwith 1, 2 and 4 mg of control GFP-containing vector or OCT4, each timethree wells of cultured cells were measured separately by qPCR. Errorbars represent standard deviations (marked by the wiskers). OEstandands for overexpression.doi:10.1371/journal.pone.0031645.g004
Transcriptome Changes at Extreme Altitudes
PLoS ONE | www.plosone.org 8 February 2012 | Volume 7 | Issue 2 | e31645
Sample preparationWe collected 10 ml blood samples from four individuals at four
different locations along the climb to and descent from Mount
Xixiabangma (8,012 m above sea level). In total, we obtained four
samples for each climber A, B, and C, and three samples for
climber D (no sample was taken for this individual in Lhasa
(3,650 m) because she had a cold). We measured the transcripts in
the nucleated cells of the peripheral blood. Erythrocytes were
immediately removed with erythrocyte lysis buffer (Tris-NH4Cl).
Then the samples were homogenized in Trizol reagents and frozen
in liquid nitrogen. The blood sampling was processed within
20 minutes. To avoid other factors that may affect the blood gene
expression, such as circadian rhythm and physical activity, the
blood samples were collected in the morning soon after waking.
Meanwhile, we also recorded other physiological indices, including
heart rate, blood oxygen saturation, systolic blood pressure, and
diastolic blood pressure for each volunteer at each sampling
location to ensure the consistency of physiological parameters at
the time of sample collections (Table S10).
RNA sequencing and data processingRNA sequencing and data processing are finished in BGI
ShenZhen and performed according to Digital Gene Expression
Pipeline of BGI ShenZhen. Detailed methodology was described
in Supplementary Methods S1 (Figure S6, Table S11, Table S12,
Table S13, Table S14).
Gene expression analysisGene expression values were summed from normalized RNA-
seq reads. Hierarchical clustering of gene expression was based on
pair-wise distances of 1-PCC (Pearson correlation coefficient)
between gene expression values of each pairing sample with 15
data points, using ‘‘average’’ linkage as for agglomeration.
We compared the extremely high (4,400 m and 5,600 m) and
relatively low altitudes (100 m and 3,650 m) to identify differentially
expressed genes (DEGs) in response to extreme altitudes. As an
approach to identify DEGs, our first attempt using the classical
single t-test or ANOVA using all four individuals together turned
out to be not appropriate for the data (Supplementary Methods S1).
Therefore, we performed the RankProd package [12], which is a
non-parametric statistical method to estimate significance levels of
genes’ differential expression (rank) based on a gene permutation
mode. The Benjamini-Hochberg corrected FDR#0.1 was used as a
cutoff to define the DEGs. And we also applied the same method to
identify differentially expressed miRNA. More details were
provided in Supplementary Methods S1.
For the data of hematopoietic cell lineages [18], RankProd
P#0.05 was used as a cutoff to define the specifically expressed
genes in a certain differentiated cell lineage compared to HSC.
GO and KEGG annotation enrichmentAnnotation enrichments were calculated as described previously
[29]. Basically, the enrichment of GO terms (http://www.
geneontology.org/) and KEGG pathways (http://www.genome.
jp/kegg/) were calculated by the Fisher’s exact test on the 380 up-
or 343 down-regulated genes in response to the extreme altitude
(Table S2 and S3). The Benjamini-Hochberg corrected FDR#
0.05 was used to determine the enriched functions.
We also performed the gene set enrichment analysis (GSEA)
[15] on all the genes detected by the RNA-seq, which were ranked
by their RP values given by the RankProd package [12]. A cutoff
of FDR#0.25 was used to define the enriched up- and down-
regulated functions (Table S4 and Figure S2).
Constructing the networksTo construct the altitude-responsive network (ARN), we first
searched for functional interactions among the 723 DEGs responsive
to the altitude change. We weighted the nodes (genes) to reflect their
significance of differential expression, and also developed an edge
weighting formula similar to a previously published one [30]. By
taking only the most highly weighted interactions between the DEGs
(empirical P#0.1), we obtained the ARN that includes 310 genes
with 938 functional interactions (Table S1, Figure S3A).
The full regulatory network (FRN) were constructed by simply
adding the regulatory interactions (hub TFs and differentially
expressed miRNAs to their targets among the DEGs) to the ARN.
The nodes and edges were similarly defined despite the TFs were
weighted by the prestige centrality [20] to reflect their relatedness
to the ARN.
The detailed description of the definitions, formulas, and cutoffs
we used to construct the networks were provided in the
Supplementary Methods S1.
We also tried to construct a larger ARN based on a less stringent
definition of DEGs, which were shown in Supplementary Methods
S1 (Figure S7).
Dissecting structural modulesStructurally dense regions in the networks were first identified
by the Markov Clustering (MCL) algorithm (http://www.micans.
org/mcl/) with the granularity parameter set to 1.5. Then the
nodes with only one edge were removed iteratively until no such
nodes existed.
Literature Co-citationTo calculate literature co-citation of a gene and a term, we
first obtained the related PubMed IDs of the query gene ID through
the ‘‘gene2pubmed’’ table (ftp://ftp.ncbi.nih.gov/gene/DATA/
gene2pubmed.gz) in three species (human, mouse, and rat). Then
we searched the abstracts of these PubMed IDs for the co-occurrence
of the gene symbol or synonym and the three query terms, which are
‘‘hypoxia’’, ‘‘hypoxic’’, and ‘‘altitude’’. Both the ‘‘gene2pubmed’’
table and abstracts were downloaded from NCBI on 28 Jan, 2010.
Feedback loops were found using the breadth-first algorithm.
Comparing the gene expression of hematopoietic celllineages
The gene expression data of hematopoietic cell lineages were
obtained from Chambers SM et al. [18] (GSE6506). Pair-wise
Student’s t-test was used for network modules and DEGs to
determine their significance of differential expression between
each differentiated cell lineage and HSC (Figure 2C). And it is also
used reversely for each cell lineage’s specifically expressed genes to
determine their significance of differential expression between high
and low altitudes. In either case, replicates of each group were
used to calculate a mean for comparison.
Extracting ResponseNet by network flowWhen constructing the ResponseNet, we used miRNAs, which
are well-known to be regulatory molecules, as the source nodes,
while treating the most concordantly up- and down-regulated genes,
those significantly up- or down-regulated in all four climbers
(P#0.05), as sink nodes. To reflect the degree of relevance of edges
to the altitude response, we defined the cost of an edge as the -log
value of the edge weight (Supplementary Methods S1).
We also tried to retain only the anti-correlations between
miRNA and targets, which were shown in Supplementary
Methods S1 (Figure S8).
Transcriptome Changes at Extreme Altitudes
PLoS ONE | www.plosone.org 9 February 2012 | Volume 7 | Issue 2 | e31645
Cell culture and transfectionHeLa cells, obtained from American Type Culture Collection
(ATCC), were grown in DMEM with 10% fetal bovine serum (FBS)
and seeded in 6-well plates at a concentration of 16106 cells/well
the day before transfection. The OCT4 overexpression plasmid
(DpQCXIN-OCT4A-360) and control plasmid (pQCXIN-GFP)
used for transfection were kindly provided by Dr. Jianwu Dai [31].
Cells were transfected with 1, 2 or 4 mg of plasmid DNA using
Lipofectamine 2000 (Invitrogen) and RNA was extracted 48 hours
after transfection. The transfection efficiency was detected by
checking the GFP signal through a fluorescence microscope.
Total RNA extraction and quantitative real-time PCRTotal RNA was extracted from cells using Trizol (Invitrogen)
reagent. Reverse transcription was carried out using First Strand
cDNA Synthesis Kit (TOYOBO), and then synthesized cDNA was
analyzed by real-time quantitative PCR (qPCR) using SYBR Green
and a Mx3000P qPCR system (Stratagene). The relative expression
changes of the genes were analyzed using the 22DDCT method [32].
Sequences of primers used for qPCR were the following:
OCT4 forward - CGTGAAGCTGGAGAAGGAGAAGCTG,
OCT4 reverse - CAAGGGCCGCAGCTTACACATGTTC;
HBG1/2 forward - CCCAGAGGTTCTTTGACAGC,
HBG1/2 reverse - TTCTCAGGATCCACATGCAG;
GAPDH forward - ACCACAGTCCATGCCATCAC,
GAPDH reverse - TCCACCACCCTGTTGCTGTA. GAPDH
was used as internal control.
Supporting Information
Figure S1 Hierarchical clustering of each individual based on
expression profiles of all genes measured by RNA-seq (A). Or the
Hierarchical clustering of all samples based on expression profiles
of differentially expressed genes (DEGs) selected by comparing
100 m vs. 4,400 m and 100 m vs. 5,600 m (B), or comparing
3,650 m vs. 4,400 m and 5,600 m (C). Samples are named in the
format of ‘Climber ID-altitude’. The expression value for each
gene is indicated by color intensity, with red representing high
expression and green representing low expression.
(TIF)
Figure S2 Gene set enrichment analysis (GSEA) summary of
seven up- or down- regulated gene sets (A). The expression value
represented by -log10(Nominal p-val) for each gene set is indicated
by color intensity, with red representing high expression and green
representing low expression. And enrichment plots of these gene sets
in four climbers are provided as a combination or individually (B).
(TIF)
Figure S3 The altitude-responsive network (ARN) (A) as well as
the up- or down-regulated sub-network of the ARN (B).
(TIF)
Figure S4 Regulatory networks of the up- or down-regulated
network modules. Only the one-step regulatory interactions were
included in each module.
(TIF)
Figure S5 Feedback loops of #5 steps found in the full
regulatory network.
(TIF)
Figure S6 Saturation curves of the samples at the obtained
sequencing depth.
(TIF)
Figure S7 The regulatory modular network for up- (A) or down-
regulated (B) genes defined by a less stringent criteria, which is the
intersection of at least 2 people with RankProd P-value #0.05,
and the ResponseNet based on this set of DEGs (C).
(TIF)
Figure S8 The ResponseNet of retaining only the anti-
correlations between miRNAs and targets. All the other settings
are exactly the same as Figure 3B.
(TIF)
Table S1 The full list of differentially expressed genes, TFs, and
miRNAs.
(XLS)
Table S2 GO/KEGG enriched in up-regulated genes
(FDR, = 0.1, 380 genes).
(XLS)
Table S3 GO/KEGG enriched in down-regulated genes
(FDR, = 0.1, 343 genes).
(XLS)
Table S4 Gene Set Enrichment Analysis (GSEA) results
(FDR, = 0.25).
(XLS)
Table S5 Topological analysis of the altitude-responsive network
(ARN).
(XLS)
Table S6 GO/KEGG enriched in up-regulated modules.
(XLS)
Table S7 GO/KEGG enriched in down-regulated modules.
(XLS)
Table S8 All the functional and regulatory interactions in the
Full Regulatory Network.
(XLS)
Table S9 The amount of flows on the nodes in ResponseNet.
(XLS)
Table S10 Physiological indexes for each sample at each
sampling location.
(XLS)
Table S11 Data summary of RNA-seq.
(XLS)
Table S12 DGE proflie for each gene.
(XLS)
Table S13 Data summary of miRNA-seq.
(XLS)
Table S14 Expression profiles of microRNA genes.
(XLS)
Methods S1
(DOC)
Acknowledgments
We would like to express our sincere appreciation for Wang Shi, Zhang
Liang and Wang Jing for their help on sample collection, and Prof.
Michael Levine (UC Berkeley) for invaluable suggestions.
Author Contributions
Conceived and designed the experiments: JW JW XF JDJH. Performed the
experiments: FC YL GZ XY WW XX FS LSJB AS GG KL YW HS KK
JL CG. Analyzed the data: YZ HL NQ AS WZ JH BZ. Contributed
reagents/materials/analysis tools: FC YL GZ YZ HL YW XF. Wrote the
paper: JDJH WZ JL YL GZ HY.
Transcriptome Changes at Extreme Altitudes
PLoS ONE | www.plosone.org 10 February 2012 | Volume 7 | Issue 2 | e31645

References
1. Clerici C, Planes C (2009) Gene regulation in the adaptive process to hypoxia inlung epithelial cells. Am J Physiol Lung Cell Mol Physiol 296: L267–274.
2. Berglund B (1992) High-altitude training. Aspects of haematological adaptation.Sports Med 14: 289–303.
3. Hochachka PW, Rupert JL (2003) Fine tuning the HIF-1 ‘global’ O2 sensor forhypobaric hypoxia in Andean high-altitude natives. Bioessays 25: 515–519.
4. Basnyat B, Murdoch DR (2003) High-altitude illness. Lancet 361: 1967–1974.
5. Hackett PH, Roach RC (2001) High-altitude illness. N Engl J Med 345:107–114.
6. Sutton JR, Reeves JT, Wagner PD, Groves BM, Cymerman A, et al. (1988)Operation Everest II: oxygen transport during exercise at extreme simulated
altitude. J Appl Physiol 64: 1309–1321.
7. Richalet JP, Robach P, Jarrot S, Schneider JC, Mason NP, et al. (1999)Operation Everest III (COMEX ’97). Effects of prolonged and progressive
hypoxia on humans during a simulated ascent to 8,848 M in a hypobaricchamber. Adv Exp Med Biol 474: 297–317.
8. Grocott MP, Martin DS, Levett DZ, McMorrow R, Windsor J, et al. (2009)
Arterial blood gases and oxygen content in climbers on Mount Everest.N Engl J Med 360: 140–149.
9. Eltzschig HK, Carmeliet P (2011) Hypoxia and inflammation. N Engl J Med364: 656–665.
10. Koeppen M, Eckle T, Eltzschig HK (2011) The hypoxia-inflammation link andpotential drug targets. Curr Opin Anaesthesiol 24: 363–369.
11. Hartmann G, Tschop M, Fischer R, Bidlingmaier C, Riepl R, et al. (2000) High
altitude increases circulating interleukin-6, interleukin-1 receptor antagonist andC-reactive protein. Cytokine 12: 246–252.
12. Hong F, Breitling R, McEntee CW, Wittner BS, Nemhauser JL, et al. (2006)RankProd: a bioconductor package for detecting differentially expressed genes in
meta-analysis. Bioinformatics 22: 2825–2827.
13. Ashburner M, Ball CA, Blake JA, Botstein D, Butler H, et al. (2000) Geneontology: tool for the unification of biology. The Gene Ontology Consortium.
Nat Genet 25: 25–29.14. Kanehisa M, Goto S, Furumichi M, Tanabe M, Hirakawa M (2010) KEGG for
representation and analysis of molecular networks involving diseases and drugs.Nucleic Acids Res 38: D355–360.
15. Subramanian A, Tamayo P, Mootha VK, Mukherjee S, Ebert BL, et al. (2005)
Gene set enrichment analysis: a knowledge-based approach for interpretinggenome-wide expression profiles. Proc Natl Acad Sci U S A 102: 15545–15550.
16. Jensen LJ, Kuhn M, Stark M, Chaffron S, Creevey C, et al. (2009) STRING 8–aglobal view on proteins and their functional interactions in 630 organisms.
Nucleic Acids Res 37: D412–416.
17. Xia K, Dong D, Han JD (2006) IntNetDB v1.0: an integrated protein-proteininteraction network database generated by a probabilistic model. BMC
Bioinformatics 7: 508.18. Chambers SM, Boles NC, Lin KY, Tierney MP, Bowman TV, et al. (2007)
Hematopoietic fingerprints: an expression database of stem cells and theirprogeny. Cell Stem Cell 1: 578–591.
19. Meehan RT (1987) Immune suppression at high altitude. Ann Emerg Med 16:
974–979.20. Torkamani A, Schork NJ (2009) Prestige centrality-based functional outlier
detection in gene expression analysis. Bioinformatics 25: 2222–2228.21. Yeger-Lotem E, Riva L, Su LJ, Gitler AD, Cashikar AG, et al. (2009) Bridging
high-throughput genetic and transcriptional data reveals cellular responses to
alpha-synuclein toxicity. Nat Genet 41: 316–323.22. Lengner CJ, Welstead GG, Jaenisch R (2008) The pluripotency regulator Oct4:
a role in somatic stem cells? Cell Cycle 7: 725–728.23. Keith B, Simon MC (2007) Hypoxia-inducible factors, stem cells, and cancer.
Cell 129: 465–472.
24. Yi X, Liang Y, Huerta-Sanchez E, Jin X, Cuo ZX, et al. (2010) Sequencing of50 human exomes reveals adaptation to high altitude. Science 329: 75–78.
25. Xu S, Li S, Yang Y, Tan J, Lou H, et al. (2011) A genome-wide search forsignals of high-altitude adaptation in Tibetans. Mol Biol Evol 28: 1003–1011.
26. Peng Y, Yang Z, Zhang H, Cui C, Qi X, et al. (2011) Genetic variations inTibetan populations and high-altitude adaptation at the Himalayas. Mol Biol
Evol 28: 1075–1081.
27. Beall CM, Cavalleri GL, Deng L, Elston RC, Gao Y, et al. (2010) Naturalselection on EPAS1 (HIF2alpha) associated with low hemoglobin concentration
in Tibetan highlanders. Proc Natl Acad Sci U S A 107: 11459–11464.28. Michael P, Ward JSM, John B. West (2000) High Altitude Medicine and
Physiology 3rd Edition. London Arnold. 106 p.
29. Xia K, Xue H, Dong D, Zhu S, Wang J, et al. (2006) Identification of theproliferation/differentiation switch in the cellular network of multicellular
organisms. PLoS Comput Biol 2: e145.30. Reverter A, Hudson NJ, Nagaraj SH, Perez-Enciso M, Dalrymple BP (2010)
Regulatory impact factors: unraveling the transcriptional regulation of complextraits from expression data. Bioinformatics 26: 896–904.
31. Wang X, Zhao Y, Xiao Z, Chen B, Wei Z, et al. (2009) Alternative translation of
OCT4 by an internal ribosome entry site and its novel function in stressresponse. Stem Cells 27: 1265–1275.
32. Livak KJ, Schmittgen TD (2001) Analysis of relative gene expression data usingreal-time quantitative PCR and the 2(-Delta Delta C(T)) Method. Methods 25:
402–408.
Transcriptome Changes at Extreme Altitudes
PLoS ONE | www.plosone.org 11 February 2012 | Volume 7 | Issue 2 | e31645