Antibiotics Cure Anthrax in Animal Models - Antimicrobial Agents

Cure Models
Silvia FrancisciSilvia FrancisciSilvia FrancisciSilvia Francisci
Cure Models
Silvia FrancisciSilvia FrancisciSilvia FrancisciSilvia FrancisciSilvia FrancisciSilvia FrancisciSilvia FrancisciSilvia Francisci
Istituto Superiore di SanitàIstituto Superiore di SanitàIstituto Superiore di SanitàIstituto Superiore di Sanità
Ispra - January 23, 2014
Silvia FrancisciSilvia FrancisciSilvia FrancisciSilvia Francisci
Istituto Superiore di SanitàIstituto Superiore di SanitàIstituto Superiore di SanitàIstituto Superiore di Sanità
Ispra - January 23, 2014
OUTLINE
�The concept of cure in the relative survival framework
�Modelling the cure of cancer
�Mixture models
�Non mixture models
�Direct/Indirect use of cure models�Direct/Indirect use of cure models
�Eurocare-4 application
�Advantages and drawbacks of cure models
� Software availability
�Open questions
Cure Cure Cure Cure ModelsModelsModelsModels Silvia Francisci Silvia Francisci Silvia Francisci Silvia Francisci –––– ISSISSISSISS outlineoutlineoutlineoutline

THE CONCEPT OF CURE IN THE
RELATIVE SURVIVAL FRAMEWORK
• Attainment and maintenance of an interval specific relative survival of 1 (corresponding to a flattening of the cumulative relative survival curve) indicates that there is no excess mortality due to cancer and the patients are assumed to be ‘statistically cured’patients are assumed to be ‘statistically cured’
• It is a definition from a population perspective, it does not provide any information on individuals, therefore it does not necessarily imply that all patients are medically cured (no longer display of disease symptoms)
Cure Cure Cure Cure ModelsModelsModelsModels Silvia Francisci Silvia Francisci Silvia Francisci Silvia Francisci –––– ISSISSISSISS PagPagPagPag 1/161/161/161/16

STOMACH CANCER
0
0,1
0,2
0,3
0,4
0,5
0,6
CU
MU
LAT
IVE
RE
LAT
IVE
SU
RV
IVA
L (%
)
Relative Survival (Cum)
0
0,2
0,4
0,6
0,8
1
1,2
INT
ER
VA
L R
ELA
TIV
E S
UR
VIV
AL
(%)
Relative Survival (Interval)
For many cancers, the pattern of excess mortality shows high
excess mortality soon after diagnosis and statistical cure reached
after approximately 6–8 years (as is the case for stomach, colon …
cancers)
Data Source: SEER 9 data, cohort 1981- 88, 20 years of follow-up
Cure Cure Cure Cure ModelsModelsModelsModels Silvia Francisci Silvia Francisci Silvia Francisci Silvia Francisci –––– ISSISSISSISS PagPagPagPag 2/162/162/162/16
0
CU
MU
LAT
IVE
RE
LAT
IVE
SU
RV
IVA
L (%
)
YEARS OF FOLLOW-UP
0
YEARS OF FOLLOW-UP
BREAST CANCER
0,4
0,5
0,6
0,7
0,8
0,9
1
1,1
INT
ER
VA
L R
ELA
TIV
E S
UR
VIV
AL
(%)
Relative Survival (Interval)
0,4
0,5
0,6
0,7
0,8
0,9
1
1,1
CU
MU
LAT
IVE
RE
LAT
IVE
SU
RV
IVA
L (%
)
Relative Survival (Cum)
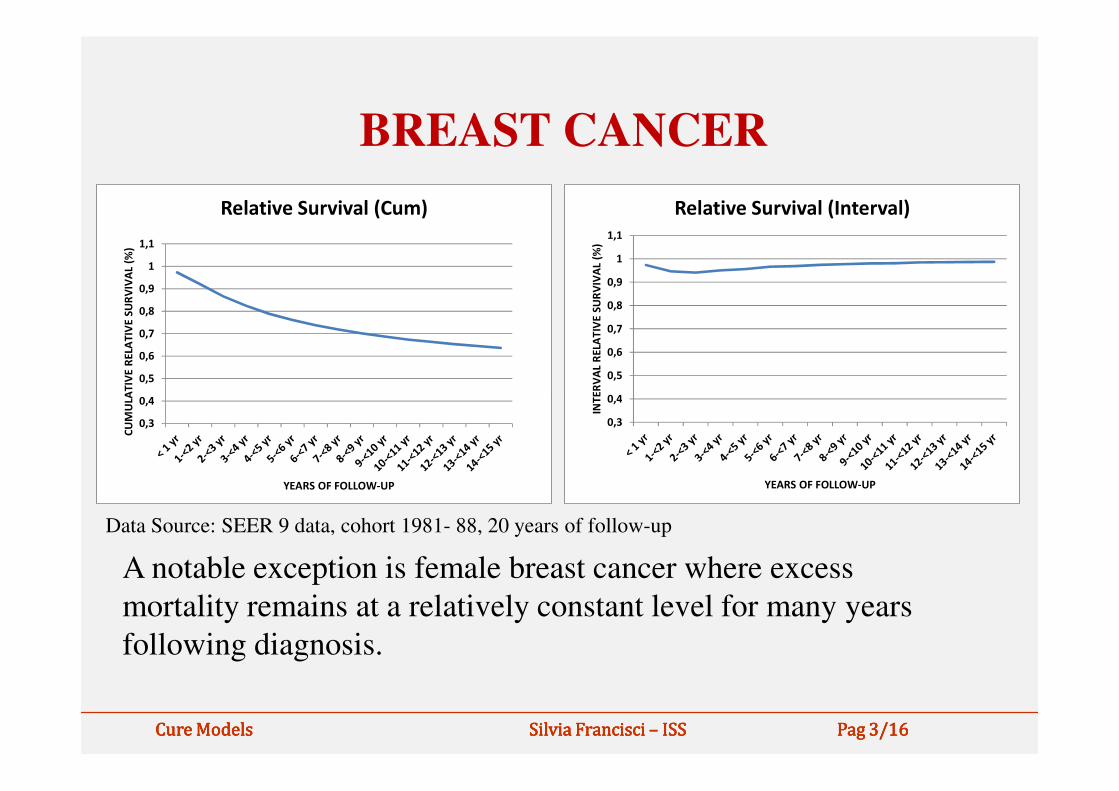
A notable exception is female breast cancer where excess
mortality remains at a relatively constant level for many years
following diagnosis.
Cure Cure Cure Cure ModelsModelsModelsModels Silvia Francisci Silvia Francisci Silvia Francisci Silvia Francisci –––– ISSISSISSISS PagPagPagPag 3/163/163/163/16
0,3
0,4
INT
ER
VA
L R
ELA
TIV
E S
UR
VIV
AL
(%)
YEARS OF FOLLOW-UP
0,3
0,4
CU
MU
LAT
IVE
RE
LAT
IVE
SU
RV
IVA
L (%
)
YEARS OF FOLLOW-UP
Data Source: SEER 9 data, cohort 1981- 88, 20 years of follow-up

MODELLING THE CURE OF CANCER
• When the assumption of cure for a proportion of patients is reasonable, it may be appropriate to fit models that explicitly allow the estimation of a cure fraction
• There are two main types of cure fraction • There are two main types of cure fraction models based on the same two assumptions:
1. a proportion of cancer patients is cured
2. survival time of uncured patients can be described by a chosen parametric distribution
Cure Cure Cure Cure ModelsModelsModelsModels Silvia Francisci Silvia Francisci Silvia Francisci Silvia Francisci –––– ISSISSISSISS PagPagPagPag 4/164/164/164/16
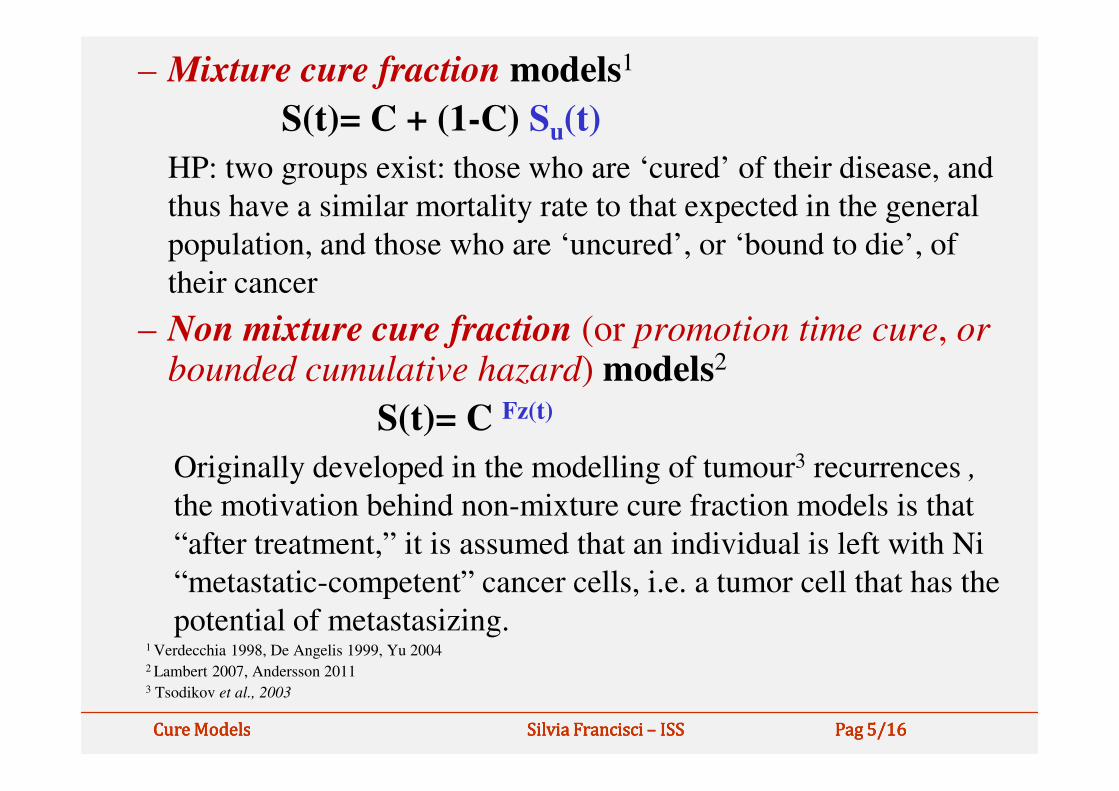
– Mixture cure fraction models1
S(t)= C + (1-C) Su(t)
HP: two groups exist: those who are ‘cured’ of their disease, and
thus have a similar mortality rate to that expected in the general
population, and those who are ‘uncured’, or ‘bound to die’, of
their cancer
– Non mixture cure fraction (or promotion time cure, orbounded cumulative hazard) models2
S(t)= C Fz(t)
Originally developed in the modelling of tumour3 recurrences ,
the motivation behind non-mixture cure fraction models is that
“after treatment,” it is assumed that an individual is left with Ni
“metastatic-competent” cancer cells, i.e. a tumor cell that has the
potential of metastasizing.1 Verdecchia 1998, De Angelis 1999, Yu 20042 Lambert 2007, Andersson 2011 3 Tsodikov et al., 2003
Cure Cure Cure Cure ModelsModelsModelsModels Silvia Francisci Silvia Francisci Silvia Francisci Silvia Francisci –––– ISSISSISSISS PagPagPagPag 5/165/165/165/16

MODEL SPECIFICATIONS
A key point for the model specification is the choice of the
survival distribution for uncured patients:
– Mixture cure models use standard parametric survival curve functions (Weibull, exponential are the most frequently used, but also lognormal , log-logistic, Gompertz)Gompertz)
– flexible parametric survival model is as special case of non-mixture cure models where restricted cubic splines are used to estimate the cumulative excess hazard
Structure of input data: aggregated versus individual data
Cure Cure Cure Cure ModelsModelsModelsModels Silvia Francisci Silvia Francisci Silvia Francisci Silvia Francisci –––– ISSISSISSISS PagPagPagPag 6/166/166/166/16
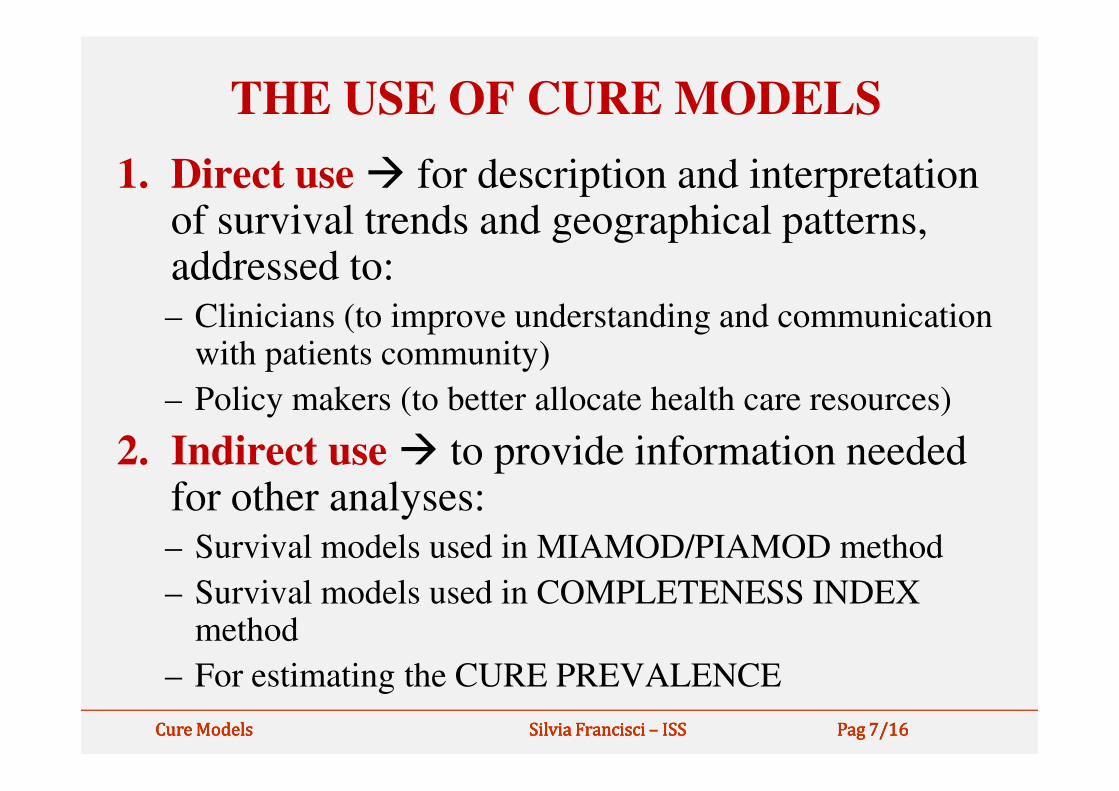
THE USE OF CURE MODELS
1. Direct use � for description and interpretation of survival trends and geographical patterns, addressed to:– Clinicians (to improve understanding and communication
with patients community)
– Policy makers (to better allocate health care resources)– Policy makers (to better allocate health care resources)
2. Indirect use � to provide information needed for other analyses:– Survival models used in MIAMOD/PIAMOD method
– Survival models used in COMPLETENESS INDEX method
– For estimating the CURE PREVALENCE
Cure Cure Cure Cure ModelsModelsModelsModels Silvia Francisci Silvia Francisci Silvia Francisci Silvia Francisci –––– ISSISSISSISS PagPagPagPag 7/167/167/167/16

Cure model parameters plan:
framework for results intepretation
Time to
Diagnostic anticipation
Proportion of cured
Time to
death a
d
c
b
Increasing survival
Improvement of
cure
Selective improvement
Cure Cure Cure Cure ModelsModelsModelsModels Silvia Francisci Silvia Francisci Silvia Francisci Silvia Francisci –––– ISSISSISSISS PagPagPagPag 8/168/168/168/16

THE EUROCARE EXPERIENCE:
CURE PROPORTION IN EUROPEAN
COUNTRIES
• Aim: description and interpretation of cancer survival in 18 European countries, for major cancer sites, over the period 1988-1999
• Input data: stratified by age class and period of diagnosis • Input data: stratified by age class and period of diagnosis (source: EUROCARE-4 study data base), six-months follow-up intervals
• Analysis: lung, stomach, colon-rectum, breast, prostate, all cancer combined
• Mixture cure survival models, with Weibull distribution for uncured patients,
Cure Cure Cure Cure ModelsModelsModelsModels Silvia Francisci Silvia Francisci Silvia Francisci Silvia Francisci –––– ISSISSISSISS PagPagPagPag 9/169/169/169/16

Geographical patterns: lung and
colon-rectum cancer
2
3
4
T
Lung
CZ
PL
A
DK
UK
FIN
F
D
ICE
I
NL
N
SCO
SLOE
S
CH
WAL2
3
4
T
Colon-Rectum
Time
to
A = AUSTRIA CZ = CZECH REP. D = GERMANY DK = DENMARK E = SPAIN F = FRANCE
FIN = FINLAND I = ITALY ICE = ICELAND N = NORWAY NL = NETHERLAND PL = POLAND
S = SWEDEN SCO = SCOTLAND SLO = SLOVENIA CH = SWITZERLAND UK = ENGLAND WAL = WALES
A
CZ
DK
UK
F
D
ICEI NL
NPL
SCO
SLOES
CH
WAL
FIN
0
1
0 0.05 0.1 0.15 0.2
P
PL
0
1
0 0.1 0.2 0.3 0.4 0.5 0.6
P
Cure Cure Cure Cure ModelsModelsModelsModels Silvia Francisci Silvia Francisci Silvia Francisci Silvia Francisci –––– ISSISSISSISS PagPagPagPag 10/1610/1610/1610/16
Proportion of cured
to
death

15-44
55-64
45-544
5
All CancersFemales
Age (all cancers in women) and period
trends (colon and rectum, men and
women combined)
1997-99
2.3
2.5
Colon-Rectum
Time 55-64
65-74
75-99
0
1
2
3
0.20 0.30 0.40 0.50 0.60 0.70 0.80
P
T
1988-90
1991-93
1994-96
1997-99
1.5
1.7
1.9
2.1
0.40 0.42 0.44 0.46 0.48 0.50
P
T
Cure Cure Cure Cure ModelsModelsModelsModels Silvia Francisci Silvia Francisci Silvia Francisci Silvia Francisci –––– ISSISSISSISS PagPagPagPag 11/1611/1611/1611/16
Proportion of cured
Time
to
death

COMPARISON OF DIFFERENT MODELS
X.Q.Yu (Cancer Epidemiology, 2013) compares different modelling approaches using three different examples (breast female, ovary, colon) in order to give some practical advise to model users.
Cure Cure Cure Cure ModelsModelsModelsModels Silvia Francisci Silvia Francisci Silvia Francisci Silvia Francisci –––– ISSISSISSISS PagPagPagPag 12/1612/1612/1612/16

CRITICISMS OF USING CURE MODELSA crucial issue with the cure models is the
identifiability of the cure fraction and parameters of
latency distribution and the length of follow-up time- First scenario (breast cancer any age group)� cure assumption is not
reasonable … just producing an estimate does not mean the approach is sensible
- Second and third scenarios � cure is reasonable - Second and third scenarios � cure is reasonable
�(colon, ovary, two younger age groups <60, 60-74) uncured survival distribution is appropriate, all models fit and produce similar estimates
�(colon, ovary, 75+) distributional assumption is not appropriate, results widely vary according to the uncured survival distribution and the structure of input data, … the use of grouped data with annual fup intervals, averages out the high excess mortality in the first few months since diagnosis.
Cure Cure Cure Cure ModelsModelsModelsModels Silvia Francisci Silvia Francisci Silvia Francisci Silvia Francisci –––– ISSISSISSISS PagPagPagPag 13/1613/1613/1613/16
SOME ADVICE FOR USERS- test the reasonability of cure assumption� visual
examination of relative survival life tables estimates by key prognostic factors to determine whether or not survival curves tend to level off after a certain period of follow-up
- test the uncured survival distribution� compare results from models with different survival results from models with different survival distributions (Weibull vs flexible) and/or using different data input (aggregated versus individual, yearly versus monthly follow-up intervals)
- Input data prerequisites� large samples, long follow-up, individual versus grouped data
Cure Cure Cure Cure ModelsModelsModelsModels Silvia Francisci Silvia Francisci Silvia Francisci Silvia Francisci –––– ISSISSISSISS PagPagPagPag 14/1614/1614/1614/16

Software availability• Stata commands (http://www.stata-journal.com/):
Lambert Stata J 2007: strsmix, strsnmix allow to estimate the cure
fraction in population-based cancer studies; Lambert- Andersson Stata
J 2012: have updated the stpm2 command for flexible parametric
models to enable cure modeling.
• SAS routine, mixture-grouped data (available on request
http://www.eurocare.it/MiamodPiamod/tabid/60/Default.asphttp://www.eurocare.it/MiamodPiamod/tabid/60/Default.asp
x#software)
• CANSURV is a statistical software to analyze population-based
survival data. For grouped survival data, it can fit both the standard
survival models and the mixture cure survival models
(http://surveillance.cancer.gov/cansurv/)
Cure Cure Cure Cure ModelsModelsModelsModels Silvia Francisci Silvia Francisci Silvia Francisci Silvia Francisci –––– ISSISSISSISS PagPagPagPag 15/1615/1615/1615/16
OPEN QUESTIONS• Is the assumption of cure reasonable for all
cancers/age groups? How much levelling is sufficient to allow the application of cure models?
• How do we choose the appropriate models features (survival distribution features (survival distribution weibull/flexible, grouped/individual data)?
• Is there any caution we should take according to the specific purpose of our estimate (either description/interpretation or information for other analyses)?
Cure Cure Cure Cure ModelsModelsModelsModels Silvia Francisci Silvia Francisci Silvia Francisci Silvia Francisci –––– ISSISSISSISS PagPagPagPag 16/16/16/16/16161616