Cumulative Impacts of High Penetration of Electric...
27
i Public Interest Energy Research (PIER) Program FINAL PROJECT REPORT Cumulative Impacts of High Penetration of Electric Vehicle Charging and Photovoltaic Generation on Distribution Circuits Prepared for: California Energy Commission Prepared by: William V. Torre, UC San Diego, Ryan Hanna, UC San Diego Center for Energy Research March 2015 University of California, San Diego
-
Upload
dangnguyet -
Category
Documents
-
view
214 -
download
0
Transcript of Cumulative Impacts of High Penetration of Electric...
i
P u b l i c I n t e r e s t E n e r g y R e s e a r c h ( P I E R ) P r o g r a m
F I N A L P R O J E C T R E P O R T
Cumulative Impacts of High Penetration of Electric Vehicle Charging and Photovoltaic Generation on Distribution Circuits
Prepared for: California Energy Commission
Prepared by: William V. Torre, UC San Diego, Ryan Hanna, UC San Diego
Center for Energy Research March 2015
University of California, San Diego
i
Prepared by: Primary Author(s): William V. Torre Ryan Hanna Jan Kleissl Center for Energy Research Department of Electrical and Computer Engineering University of California, San Diego. 9500 Gilman Dr. La Jolla, CA, 92093 [email protected] Contract Number: 500-10-043 Prepared for: California Energy Commission Consuelo Sichon Contract Manager
Linda Spiegel Office Manager Energy Generation Research
Laurie ten Hope Deputy Director Energy Research & Development
Robert Oglesby Executive Director
DISCLAIMER
This report was prepared as the result of work sponsored by the California Energy Commission. It does not necessarily represent the views of the Energy Commission, its employees or the State of California. The Energy Commission, the State of California, its employees, contractors and subcontractors make no warrant, express or implied, and assume no legal liability for the information in this report; nor does any party represent that the uses of this information will not infringe upon privately owned rights. This report has not been approved or disapproved by the California Energy Commission nor has the California Energy Commission passed upon the accuracy or adequacy of the information in this report.

ii
ACKNOWLEDGEMENTS
We would like to thank Kevin Norris, and Bob Caldwell for their support on providing the data for this report. We also acknowledge and appreciate the work of Dr. Jan Kleissl and Oytun Babacan.

iii

iv
PREFACE
The California Energy Commission Public Interest Energy Research (PIER) Program supports public interest energy research and development that will help improve the quality of life in California by bringing environmentally safe, affordable, and reliable energy services and products to the marketplace.
The PIER Program conducts public interest research, development, and demonstration (RD&D) projects to benefit California.
The PIER Program strives to conduct the most promising public interest energy research by partnering with RD&D entities, including individuals, businesses, utilities, and public or private research institutions.
PIER funding efforts are focused on the following RD&D program areas:
Buildings End-Use Energy Efficiency
Energy Innovations Small Grants
Energy-Related Environmental Research
Energy Systems Integration
Environmentally Preferred Advanced Generation
Industrial/Agricultural/Water End-Use Energy Efficiency
Renewable Energy Technologies
Transportation
Cumulative Impacts of High Penetrations of EVs and PVs on Distribution Circuits is a deliverable for the California Energy Commission contract number 500-10-043 conducted by the University of California, San Diego. The information from this project contributes to PIER’s Renewable Energy Technologies Program.
For more information about the PIER Program, please visit the Energy Commission’s website at www.energy.ca.gov/research/ or contact the Energy Commission at 916-654-4878.
v
ABSTRACT
Electric Vehicles (EV) charged with renewable generation is the ultimate in clean transportation. The University of California San Diego (UCSD) has been working with EV charging manufacturers and automobile manufacturers to develop and test new forms of EV charging and utilization of renewable generation. UCSD has installed 17 Blink level II EV charging stations, 10 RWE level II smart charging stations, and three DC fast charging stations on campus, a total of 30 EV charging stations. Additional RWE EV smart charging stations are planned to be installed, along with make ready stations by NRG. This report summarizes the results of evaluation of the impacts of EV charging on distribution circuits with high levels of photovoltaic (PV) generation, based on data that has been collected. This report is a deliverable under task 5.2 of the CEC contract 500-10-043 and has been developed to describe the results of this collaborative effort.
vi
TABLE OF CONTENTS
Acknowledgements ................................................................................................................................. ii
PREFACE .................................................................................................................................................... iv
ABSTRACT ................................................................................................................................................... v
TABLE OF CONTENTS .............................................................................................................................. vi
EXECUTIVE SUMMARY .............................................................................................................................. 1
CHAPTER 1 INTRODUCTION ................................................................................................................... 3
CHAPTER 2: EVALUATION OF EV CHARGING AND HIGH PV PENETRATION ON ELECTRIC DISTRIBUTION CIRCUITS ......................................................................................................................... 4
2.1 Data Source Identification and Collection ....................................................................................... 4
2.2 Correlation of EV Charging and Voltage Deviation ......................................................................... 9
2.3 PV Power Production and Distribution Impacts ……………………..………………………………………..13
2.4 Potential Benefits of Energy Storage To Mitigate Impacts……………………………………………….…15
CHAPTER 3: SUMMARY AND CONCLUSIONS ....................................................................................... 18
1
EXECUTIVE SUMMARY
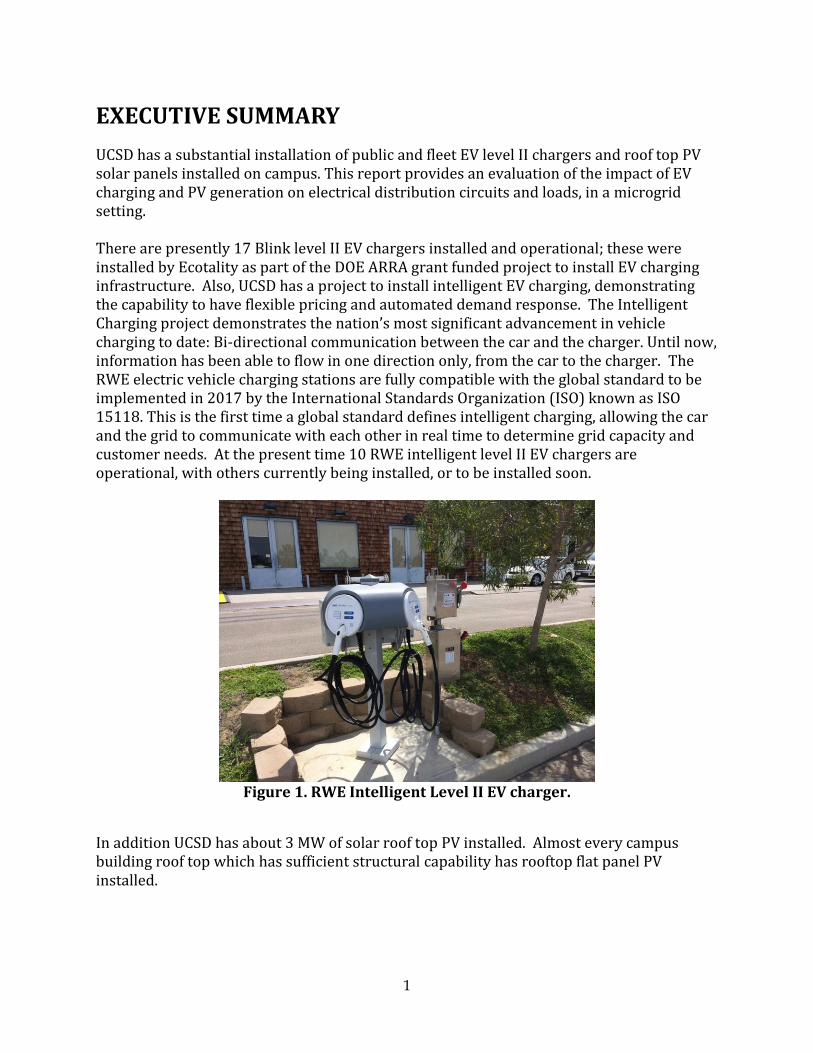
UCSD has a substantial installation of public and fleet EV level II chargers and roof top PV solar panels installed on campus. This report provides an evaluation of the impact of EV charging and PV generation on electrical distribution circuits and loads, in a microgrid setting. There are presently 17 Blink level II EV chargers installed and operational; these were installed by Ecotality as part of the DOE ARRA grant funded project to install EV charging infrastructure. Also, UCSD has a project to install intelligent EV charging, demonstrating the capability to have flexible pricing and automated demand response. The Intelligent Charging project demonstrates the nation’s most significant advancement in vehicle charging to date: Bi-directional communication between the car and the charger. Until now, information has been able to flow in one direction only, from the car to the charger. The RWE electric vehicle charging stations are fully compatible with the global standard to be implemented in 2017 by the International Standards Organization (ISO) known as ISO 15118. This is the first time a global standard defines intelligent charging, allowing the car and the grid to communicate with each other in real time to determine grid capacity and customer needs. At the present time 10 RWE intelligent level II EV chargers are operational, with others currently being installed, or to be installed soon.
Figure 1. RWE Intelligent Level II EV charger.
In addition UCSD has about 3 MW of solar roof top PV installed. Almost every campus building roof top which has sufficient structural capability has rooftop flat panel PV installed.
2
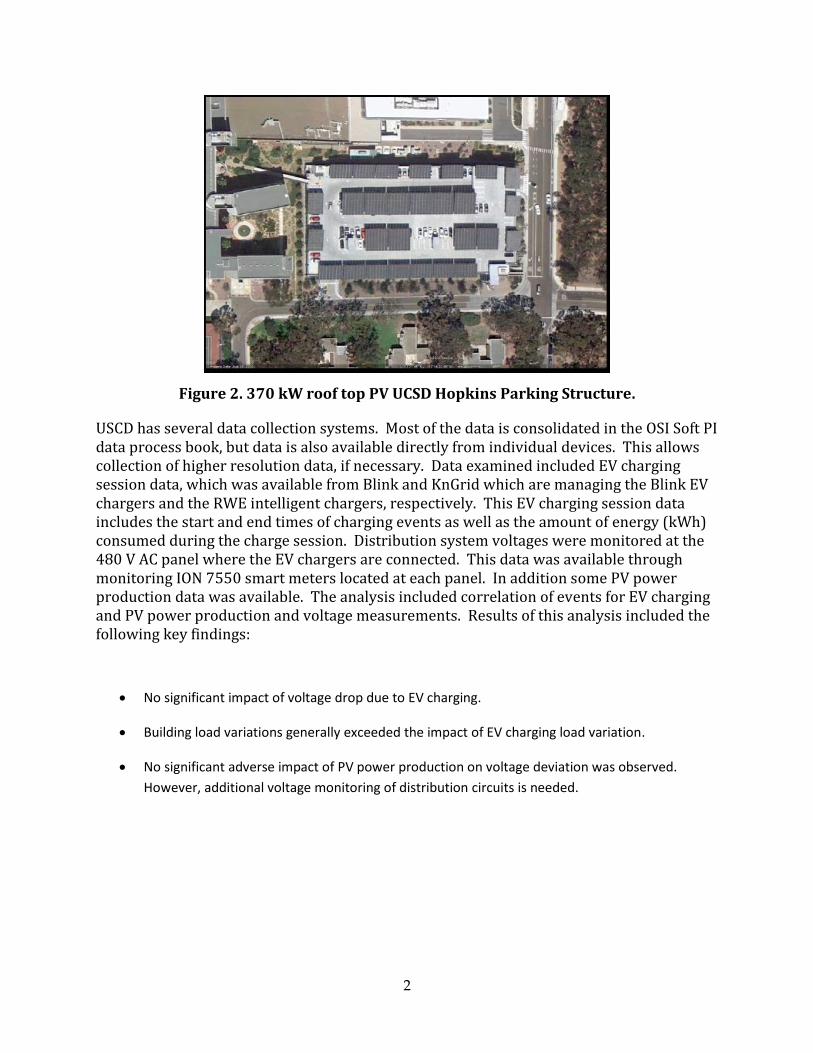
Figure 2. 370 kW roof top PV UCSD Hopkins Parking Structure.
USCD has several data collection systems. Most of the data is consolidated in the OSI Soft PI data process book, but data is also available directly from individual devices. This allows collection of higher resolution data, if necessary. Data examined included EV charging session data, which was available from Blink and KnGrid which are managing the Blink EV chargers and the RWE intelligent chargers, respectively. This EV charging session data includes the start and end times of charging events as well as the amount of energy (kWh) consumed during the charge session. Distribution system voltages were monitored at the 480 V AC panel where the EV chargers are connected. This data was available through monitoring ION 7550 smart meters located at each panel. In addition some PV power production data was available. The analysis included correlation of events for EV charging and PV power production and voltage measurements. Results of this analysis included the following key findings:
No significant impact of voltage drop due to EV charging.
Building load variations generally exceeded the impact of EV charging load variation.
No significant adverse impact of PV power production on voltage deviation was observed.
However, additional voltage monitoring of distribution circuits is needed.
3
CHAPTER 1 INTRODUCTION
As electric vehicle use increases and more EV charging infrastructure is installed a concern regarding the impact on voltage regulation and power quality has been raised. Likewise the impact of the intermittency of PV power production and increased density and penetration has similarly raised concerns on the impact to distribution system voltage regulation and power quality. The UCSD microgrid offers a good venue to evaluate this concern due to its high concentration of EV charging, and PV installations, and because of its good data acquisition system. This report review provides a summary of the analysis of the data of EV charging use and solar PV power production that was collected over the January, 2012 – December, 2014 time frame.
4
CHAPTER 2: Evaluation of EV Charging and High PV Penetration on Electric Distribution Circuits
2.1 Data Source Identification and Collection
UC San Diego consists of a large campus with over 179 buildings, 42 MW of peak load, and covers over 1,200 acres. The electrical power delivery system is owned and operated by UC San Diego, and consists of three main 12 kV power distribution circuits and five substations. The campus is 100 % self-sustaining, providing its own generation to meet its campus load requirements most of the time. The campus has three control monitoring systems consisting of Johnson Controls, Schneider Controls, and OSI I Soft PI process book. All of the campus building loads are controlled by the Johnson Controls system. The Schneider system includes the ION smart meters which are located at each building collecting and monitoring building loads. These ION meters also collect voltages for each electrical phase of the local 480 volt panels. This ION meter data is also deposited in the OSI PI database but a lower resolution rate. The ION meter data was used as a source of data to determine the impact of EV charging and PV power production on local distribution voltages. Electrically, EV charging stations are connected at the building-level, that is, at 480 volts. As such, an EV charging station is one of many building loads that contribute to an aggregate power consumption. PV modules are similarly connected at 480 volts.
System Connectivity
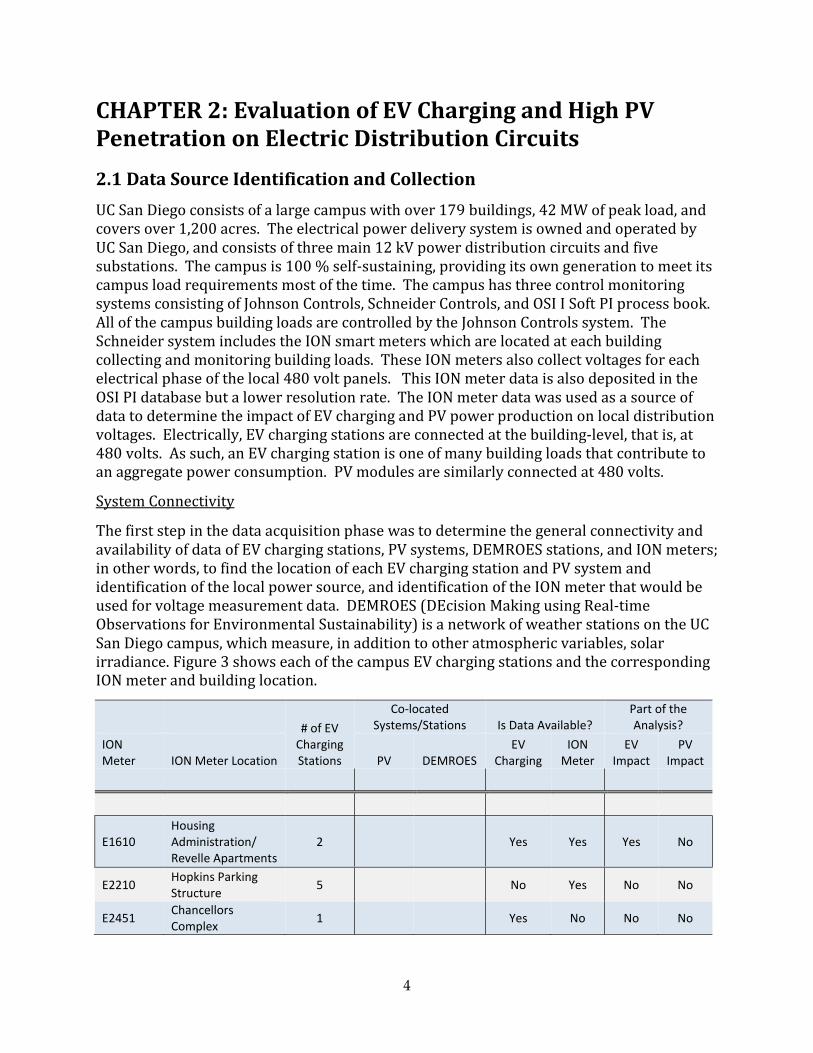
The first step in the data acquisition phase was to determine the general connectivity and availability of data of EV charging stations, PV systems, DEMROES stations, and ION meters; in other words, to find the location of each EV charging station and PV system and identification of the local power source, and identification of the ION meter that would be used for voltage measurement data. DEMROES (DEcision Making using Real-time Observations for Environmental Sustainability) is a network of weather stations on the UC San Diego campus, which measure, in addition to other atmospheric variables, solar irradiance. Figure 3 shows each of the campus EV charging stations and the corresponding ION meter and building location.
# of EV Charging Stations
Co-located Systems/Stations Is Data Available?
Part of the Analysis?
ION Meter ION Meter Location PV DEMROES
EV Charging
ION Meter
EV Impact
PV Impact
E1610 Housing Administration/ Revelle Apartments
2 Yes Yes Yes No
E2210 Hopkins Parking Structure
5 No Yes No No
E2451 Chancellors Complex
1 Yes No No No
5
E2705 Gilman Parking Structure
4 UCSD
Gilman Parking
EBU2 Yes Yes Yes Yes
E3210
Structures Materials Engineering Laboratory
2 Yes No No No
E3710 Pangea Parking Structure
3 Yes No No No
E4711 Ritter Hall 1 Yes No No No
E5501 Birch Aquarium 1 UCSD Birch
HUBB Yes Yes Yes Yes
E7120 East Campus Parking Structure
8 Yes No No No
Figure 3. Availability of ION meters and EV charging stations. Meters E1610, E2705, and E5501 were used in the EV impact analysis, and E2705 and E5501 were used in the PV impact analysis. The other meters did not have the requisite combination of
ION meter data and/or EV charging data.
Database for EV Charging
Individual EV charge events from 33 EV charging stations were recorded in an EV charging database, with such information stored as charging station, connection time, disconnect time, and energy consumption, among others. Data was pulled from this database for the time period 2012 – 2014 and consists of 6,550 charge events in total. The database does not store electrical information at the EV station, such as voltage, current, or instantaneous power. However, an estimate for average power was back-calculated by dividing energy consumption by the session duration.
Though extensive, the database was truncated for the purpose of this analysis. Many charge events in the database consumed less than 1 kWh of energy and/or lasted less than 15 minutes, which may be due to first-time users interacting with a nascent technology. These events constitute 11.7 percent of the total events in the database and were omitted from the analysis.
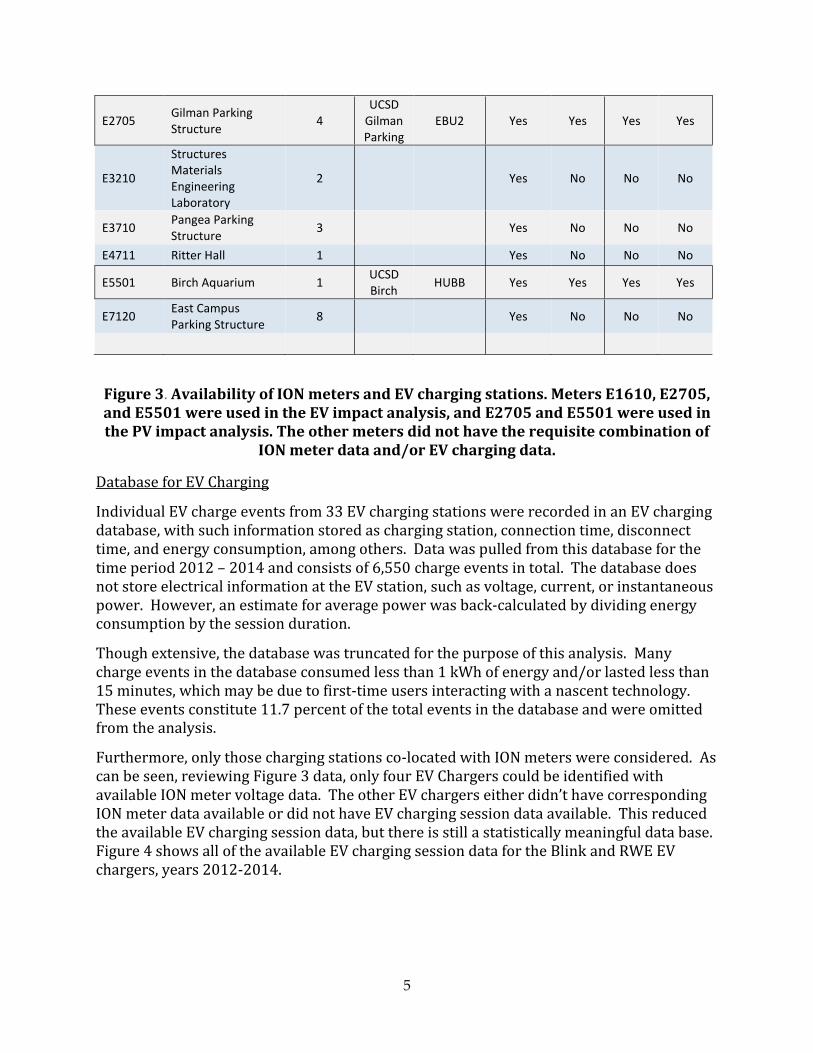
Furthermore, only those charging stations co-located with ION meters were considered. As can be seen, reviewing Figure 3 data, only four EV Chargers could be identified with available ION meter voltage data. The other EV chargers either didn’t have corresponding ION meter data available or did not have EV charging session data available. This reduced the available EV charging session data, but there is still a statistically meaningful data base. Figure 4 shows all of the available EV charging session data for the Blink and RWE EV chargers, years 2012-2014.
6
Figure 4. All EV charging session data plotted as average power consumption against time.
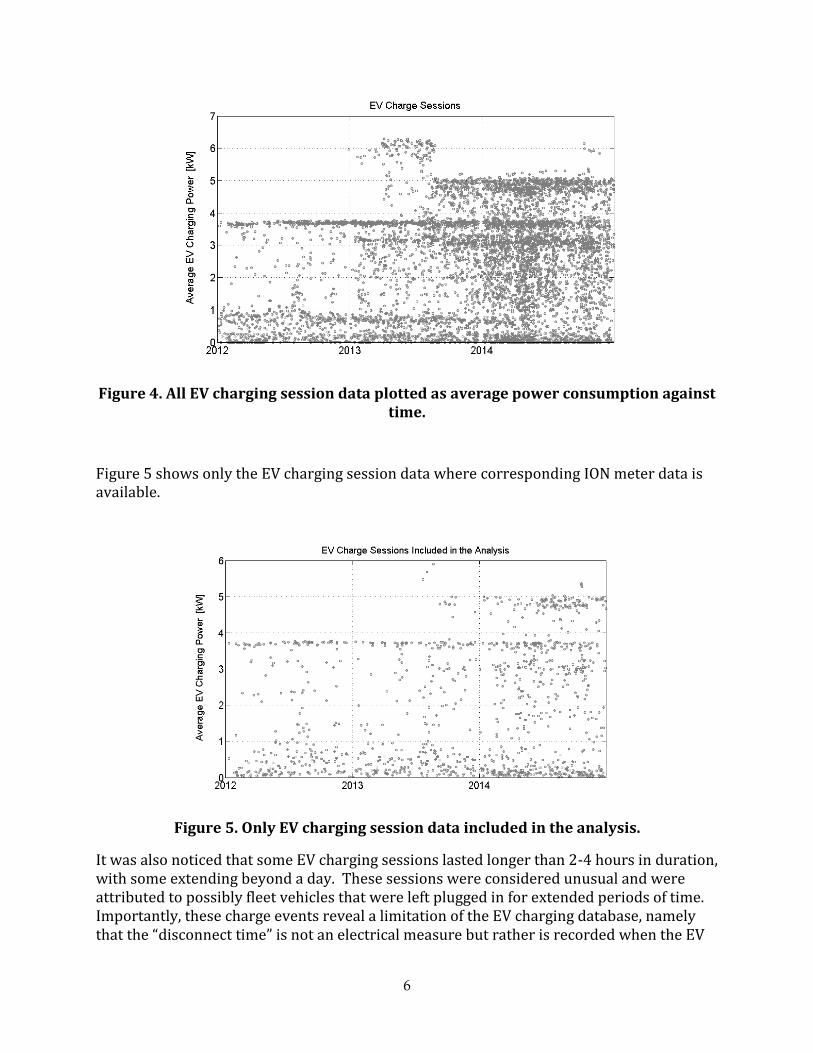
Figure 5 shows only the EV charging session data where corresponding ION meter data is available.
Figure 5. Only EV charging session data included in the analysis.
It was also noticed that some EV charging sessions lasted longer than 2-4 hours in duration, with some extending beyond a day. These sessions were considered unusual and were attributed to possibly fleet vehicles that were left plugged in for extended periods of time. Importantly, these charge events reveal a limitation of the EV charging database, namely that the “disconnect time” is not an electrical measure but rather is recorded when the EV
7
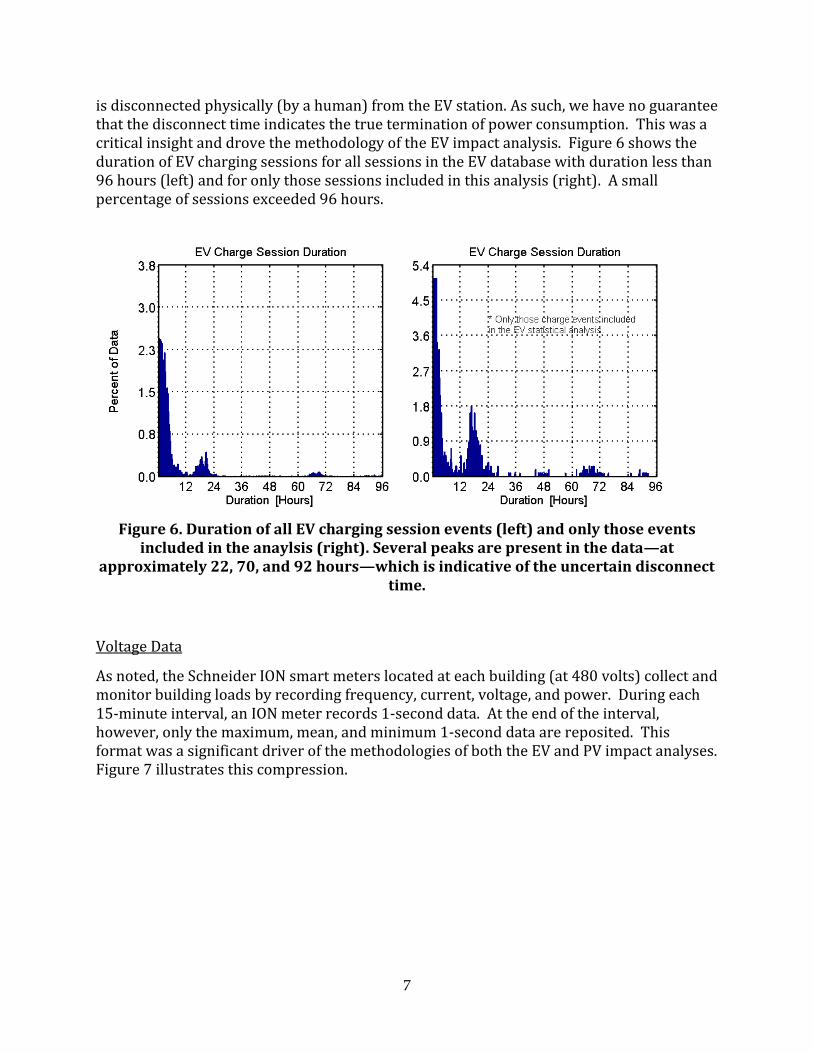
is disconnected physically (by a human) from the EV station. As such, we have no guarantee that the disconnect time indicates the true termination of power consumption. This was a critical insight and drove the methodology of the EV impact analysis. Figure 6 shows the duration of EV charging sessions for all sessions in the EV database with duration less than 96 hours (left) and for only those sessions included in this analysis (right). A small percentage of sessions exceeded 96 hours.
Figure 6. Duration of all EV charging session events (left) and only those events included in the anaylsis (right). Several peaks are present in the data—at
approximately 22, 70, and 92 hours—which is indicative of the uncertain disconnect time.
Voltage Data
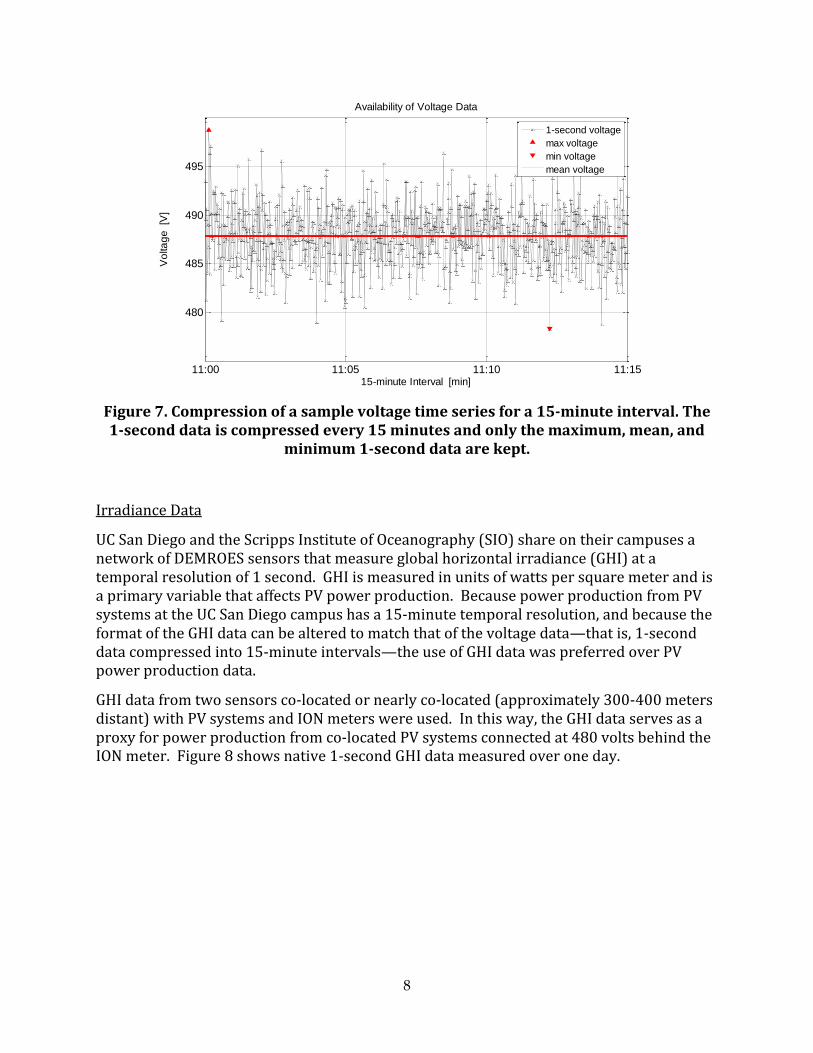
As noted, the Schneider ION smart meters located at each building (at 480 volts) collect and monitor building loads by recording frequency, current, voltage, and power. During each 15-minute interval, an ION meter records 1-second data. At the end of the interval, however, only the maximum, mean, and minimum 1-second data are reposited. This format was a significant driver of the methodologies of both the EV and PV impact analyses. Figure 7 illustrates this compression.
8
Figure 7. Compression of a sample voltage time series for a 15-minute interval. The 1-second data is compressed every 15 minutes and only the maximum, mean, and
minimum 1-second data are kept.
Irradiance Data
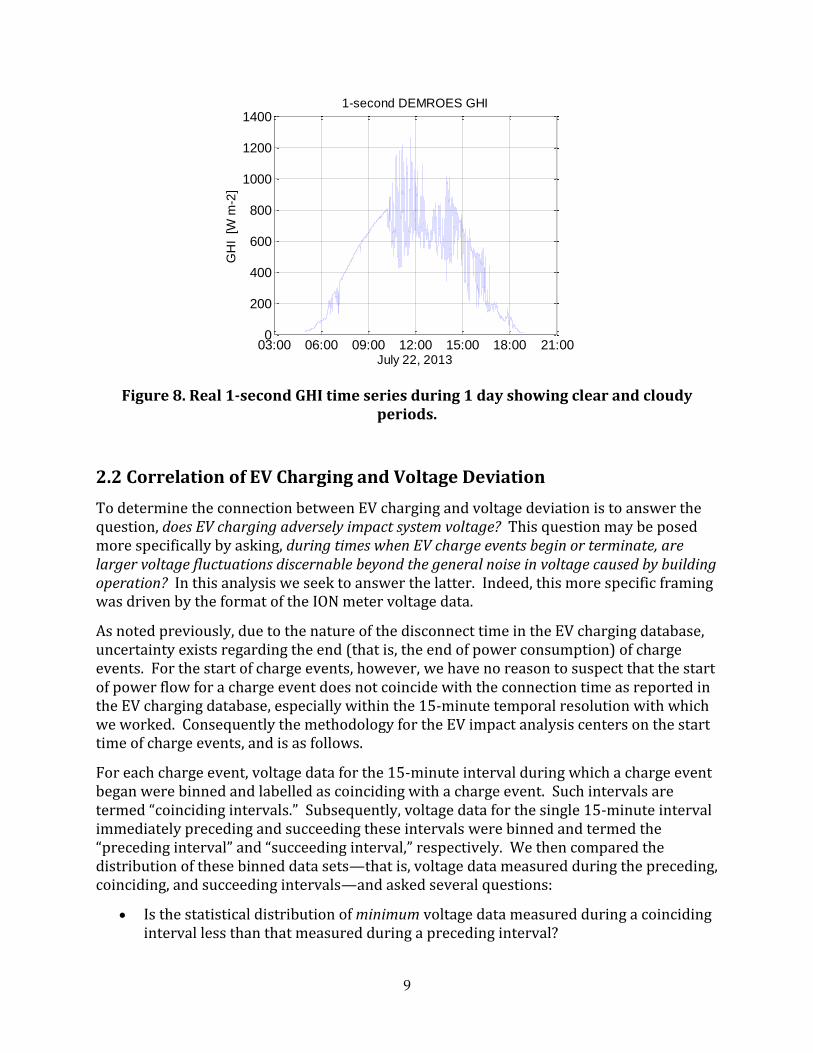
UC San Diego and the Scripps Institute of Oceanography (SIO) share on their campuses a network of DEMROES sensors that measure global horizontal irradiance (GHI) at a temporal resolution of 1 second. GHI is measured in units of watts per square meter and is a primary variable that affects PV power production. Because power production from PV systems at the UC San Diego campus has a 15-minute temporal resolution, and because the format of the GHI data can be altered to match that of the voltage data—that is, 1-second data compressed into 15-minute intervals—the use of GHI data was preferred over PV power production data.
GHI data from two sensors co-located or nearly co-located (approximately 300-400 meters distant) with PV systems and ION meters were used. In this way, the GHI data serves as a proxy for power production from co-located PV systems connected at 480 volts behind the ION meter. Figure 8 shows native 1-second GHI data measured over one day.
11:00 11:05 11:10 11:15
480
485
490
495
Availability of Voltage Data
15-minute Interval [min]
Vo
lta
ge
[V
]
1-second voltage
max voltage
min voltage
mean voltage
9
Figure 8. Real 1-second GHI time series during 1 day showing clear and cloudy periods.
2.2 Correlation of EV Charging and Voltage Deviation
To determine the connection between EV charging and voltage deviation is to answer the question, does EV charging adversely impact system voltage? This question may be posed more specifically by asking, during times when EV charge events begin or terminate, are larger voltage fluctuations discernable beyond the general noise in voltage caused by building operation? In this analysis we seek to answer the latter. Indeed, this more specific framing was driven by the format of the ION meter voltage data.
As noted previously, due to the nature of the disconnect time in the EV charging database, uncertainty exists regarding the end (that is, the end of power consumption) of charge events. For the start of charge events, however, we have no reason to suspect that the start of power flow for a charge event does not coincide with the connection time as reported in the EV charging database, especially within the 15-minute temporal resolution with which we worked. Consequently the methodology for the EV impact analysis centers on the start time of charge events, and is as follows.
For each charge event, voltage data for the 15-minute interval during which a charge event began were binned and labelled as coinciding with a charge event. Such intervals are termed “coinciding intervals.” Subsequently, voltage data for the single 15-minute interval immediately preceding and succeeding these intervals were binned and termed the “preceding interval” and “succeeding interval,” respectively. We then compared the distribution of these binned data sets—that is, voltage data measured during the preceding, coinciding, and succeeding intervals—and asked several questions:
Is the statistical distribution of minimum voltage data measured during a coinciding interval less than that measured during a preceding interval?
03:00 06:00 09:00 12:00 15:00 18:00 21:000
200
400
600
800
1000
1200
1400
July 22, 2013
GH
I [W
m-2
]
1-second DEMROES GHI
10
Is the statistical distribution of mean voltage data measured during a preceding interval less than that measured during the succeeding interval?
Is the statistical distribution of mean voltage data measured during the two preceding intervals less than that measured during the coinciding and succeeding intervals?
All other things being equal, if the EV load is significant relative to the total load behind the meter and the distribution system is simultaneously relatively stable, then we expect to see a drop in voltage at the meter when the charge event begins. If the EV load is not significant, then the drop in voltage will likely be lost in the general noise of voltage fluctuations caused by fluctuating building loads, which constantly ramp up or down and/or turn on or off.
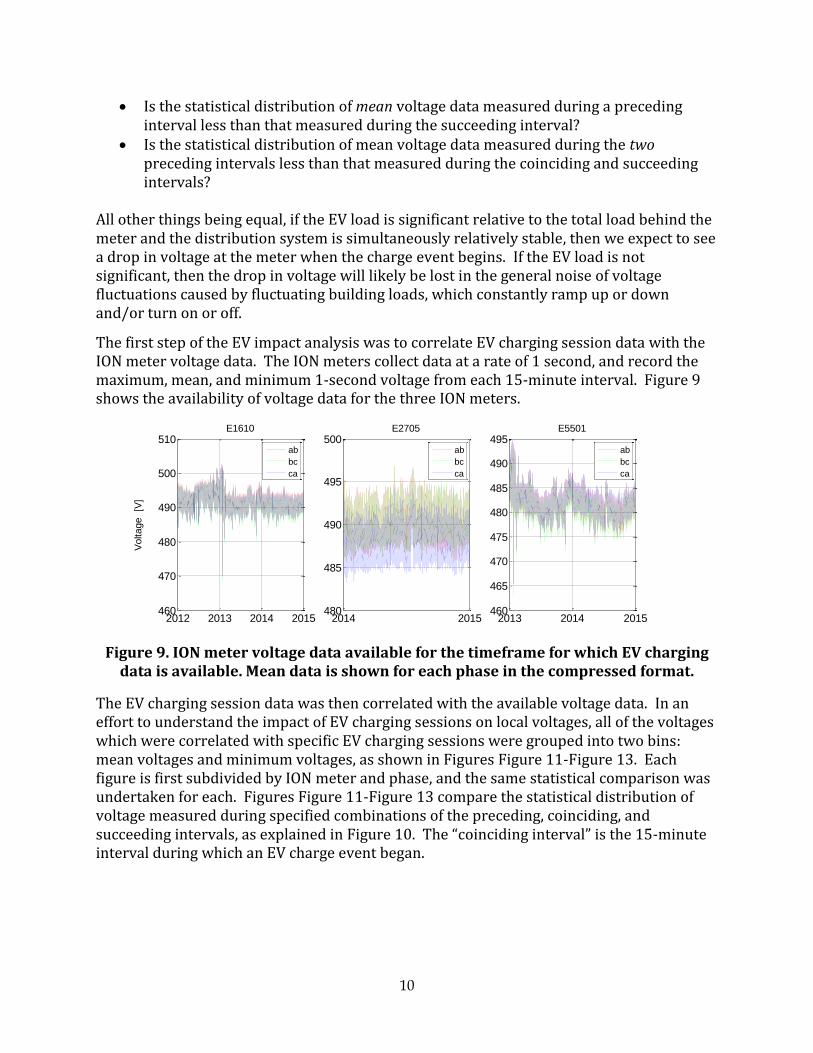
The first step of the EV impact analysis was to correlate EV charging session data with the ION meter voltage data. The ION meters collect data at a rate of 1 second, and record the maximum, mean, and minimum 1-second voltage from each 15-minute interval. Figure 9 shows the availability of voltage data for the three ION meters.
Figure 9. ION meter voltage data available for the timeframe for which EV charging data is available. Mean data is shown for each phase in the compressed format.
The EV charging session data was then correlated with the available voltage data. In an effort to understand the impact of EV charging sessions on local voltages, all of the voltages which were correlated with specific EV charging sessions were grouped into two bins: mean voltages and minimum voltages, as shown in Figures Figure 11-Figure 13. Each figure is first subdivided by ION meter and phase, and the same statistical comparison was undertaken for each. Figures Figure 11-Figure 13 compare the statistical distribution of voltage measured during specified combinations of the preceding, coinciding, and succeeding intervals, as explained in Figure 10. The “coinciding interval” is the 15-minute interval during which an EV charge event began.
2012 2013 2014 2015460
470
480
490
500
510
Voltage
[V]
E1610
ab
bc
ca
2014 2015480
485
490
495
500E2705
ab
bc
ca
2013 2014 2015460
465
470
475
480
485
490
495E5501
ab
bc
ca
11
Interval t0-2 t0-1 t0 t0+1
Interval Name
“Preceding interval”
“Coinciding interval”
“Succeeding interval”
Figure 11 Minimum voltage
Minimum voltage
Figure 12 Mean voltage
Mean voltage
Figure 13 Minimum voltage
Minimum voltage
Minimum voltage
Minimum voltage
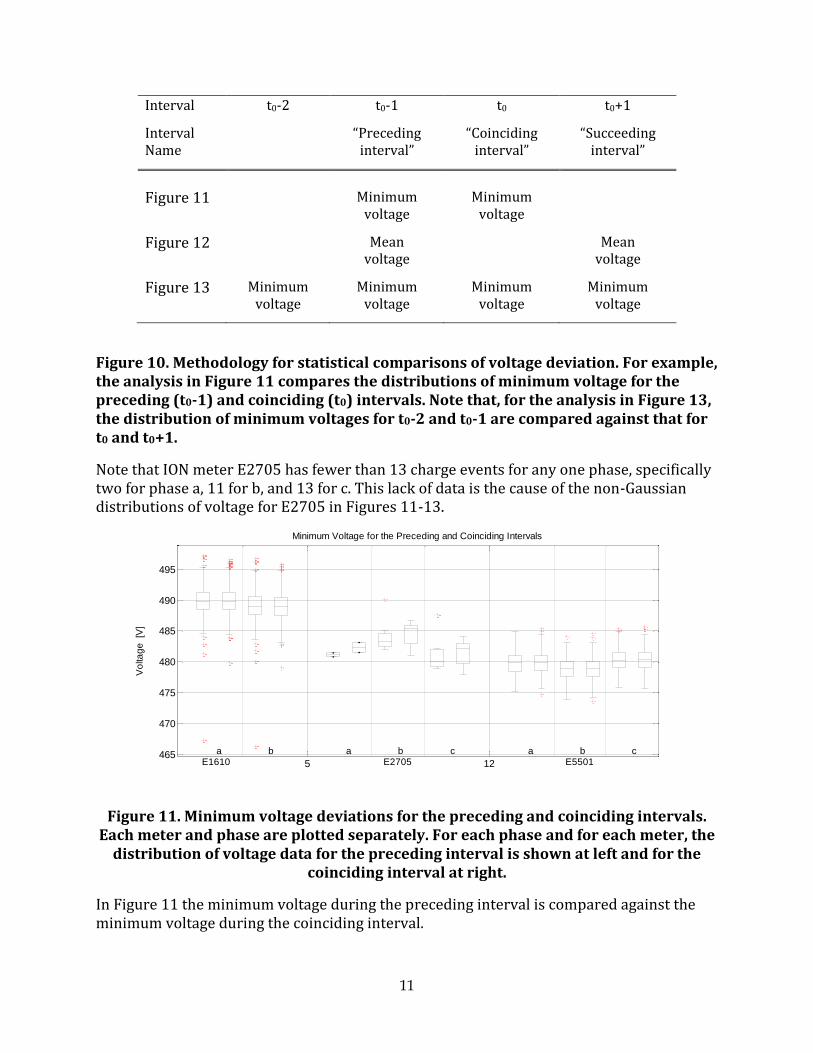
Figure 10. Methodology for statistical comparisons of voltage deviation. For example, the analysis in Figure 11 compares the distributions of minimum voltage for the preceding (t0-1) and coinciding (t0) intervals. Note that, for the analysis in Figure 13, the distribution of minimum voltages for t0-2 and t0-1 are compared against that for t0 and t0+1.
Note that ION meter E2705 has fewer than 13 charge events for any one phase, specifically two for phase a, 11 for b, and 13 for c. This lack of data is the cause of the non-Gaussian distributions of voltage for E2705 in Figures 11-13.
Figure 11. Minimum voltage deviations for the preceding and coinciding intervals. Each meter and phase are plotted separately. For each phase and for each meter, the
distribution of voltage data for the preceding interval is shown at left and for the coinciding interval at right.
In Figure 11 the minimum voltage during the preceding interval is compared against the minimum voltage during the coinciding interval.
5 12465
470
475
480
485
490
495
Minimum Voltage for the Preceding and Coinciding Intervals
Vo
lta
ge
[V
]
E1610 E2705 E5501a b a b c a b c
12
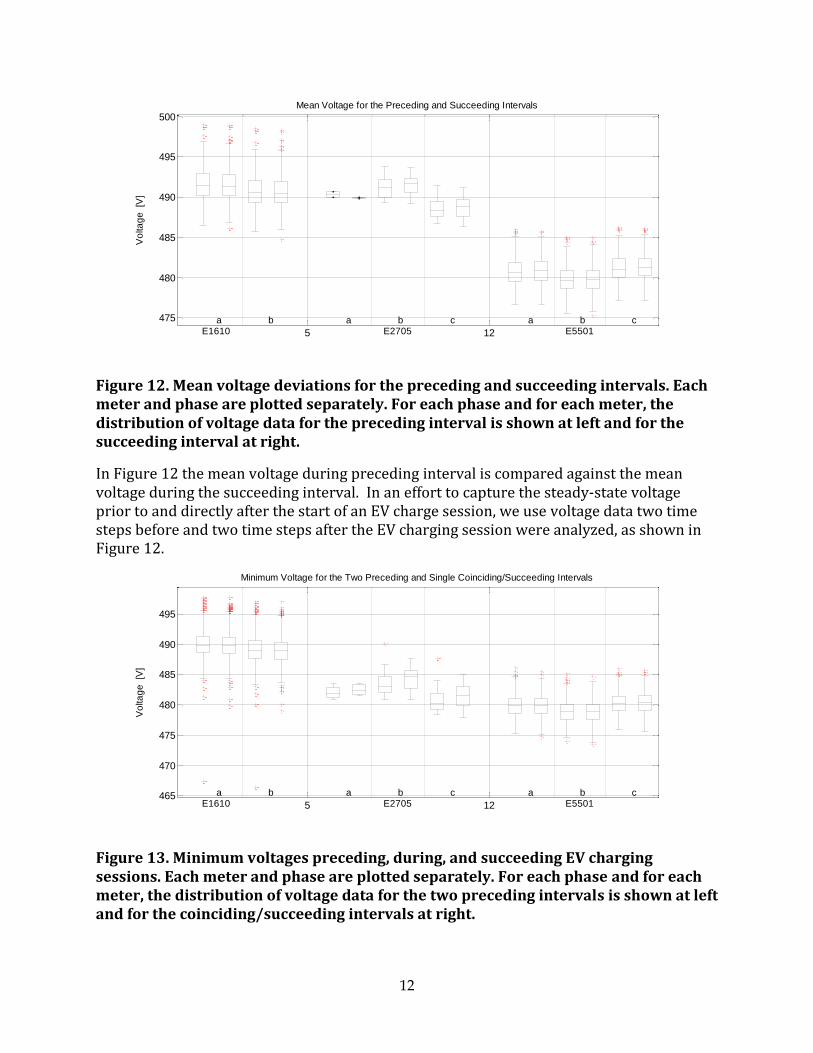
Figure 12. Mean voltage deviations for the preceding and succeeding intervals. Each meter and phase are plotted separately. For each phase and for each meter, the distribution of voltage data for the preceding interval is shown at left and for the succeeding interval at right.
In Figure 12 the mean voltage during preceding interval is compared against the mean voltage during the succeeding interval. In an effort to capture the steady-state voltage prior to and directly after the start of an EV charge session, we use voltage data two time steps before and two time steps after the EV charging session were analyzed, as shown in Figure 12.
Figure 13. Minimum voltages preceding, during, and succeeding EV charging sessions. Each meter and phase are plotted separately. For each phase and for each meter, the distribution of voltage data for the two preceding intervals is shown at left and for the coinciding/succeeding intervals at right.
5 12
475
480
485
490
495
500
Mean Voltage for the Preceding and Succeeding Intervals
Vo
lta
ge
[V
]
E1610 E2705 E5501a b a b c a b c
5 12465
470
475
480
485
490
495
Minimum Voltage for the Two Preceding and Single Coinciding/Succeeding Intervals
Vo
lta
ge
[V
]
E1610 E2705 E5501a b a b c a b c
13
In Figure 13the minimum voltage for the two preceding intervals is compared against the minimum voltage for the coinciding interval and succeeding interval.
If an EV charging session were to have an adverse effect on distribution voltages, one would expect to observe a voltage drop during the EV charging session as compared before the EV charging session. Examination of these graphs indicate that there is no significant voltage drop occurred for any of these EV charging sessions during this three year time frame.
2.3 PV Power Production and Distribution Impacts Similar to the EV impact analysis, to determine the connection between PV power production and voltage deviation is to answer the question, during periods of high variability in PV power production (that is, cloudy conditions), are voltage fluctuations discernable that are larger than fluctuations observed during periods of low variability (that is, clear conditions)? During clear periods, we expect that variability in building consumption behind the meter or in loads upstream of the meter drive fluctuations measured at the meter. During cloudy periods, on the other hand, if PV power production is large relative to building load, then we expect to see larger voltage fluctuations. As with the EV impact analysis, the framing of this analysis is driven by the format of available voltage data.
As noted previously, 1-second GHI data was compressed to match the format of the voltage data. Two GHI sensors co-located or nearly co-located (approximately 300-400 meters distant) with PV systems were used, and thus fluctuations in GHI are representative of fluctuations in PV power production. The PV systems are connected to the 480 volt line to which the EV charging stations are similarly connected.
A vast amount of GHI data is available and, for the purpose of this analysis, was truncated in several ways. Data was obtained only for Fall Quarter 2014 (Sep–Dec); for weekend days within that quarter; and at peak solar times within those days (10:00-13:00). The data was truncated in this way to “normalize” building operation, in other words to choose periods where building operation is expected to be consistent. The selection of solar peak periods on weekends during the same university quarter normalizes such operation to some extent. Furthermore, variation in building consumption is in general less on weekends relative to weekdays, and consequently variation in PV power production relative to variation in building consumption is more pronounced on weekends. This truncated GHI data set was then used for the PV impact analysis, the methodology for which is as follows.
Certain 15-minute intervals in the truncated data set were classified as either “clear” (low variability in GHI) or “cloudy” (high variability in GHI). Clear periods were defined as having a difference in maximum GHI and minimum GHI of less than 30 W m-2 and a mean GHI greater than 300 W m-2, and cloudy periods as having a difference in maximum GHI and minimum GHI of more than 200 W m-2 and a mean GHI greater than 300 W m-2. The requirement on mean GHI for both classifications effectively precludes overcast periods,
14
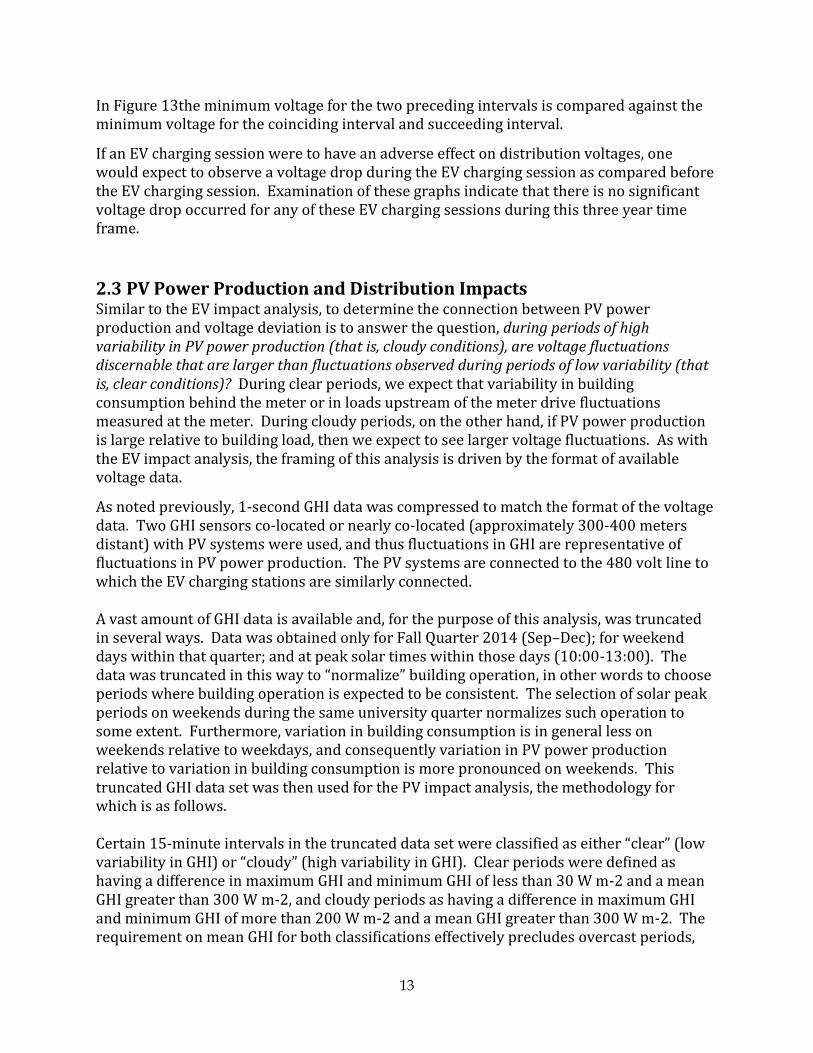
for which both minimal variability in GHI and minimal PV power production may exist. Figure 14 shows representative 15-minute GHI variability (condensed as discussed previously) for a consecutive Saturday and Sunday. All 15-minute periods for which GHI was recorded are shown; periods of peak solar (10:00-13:00) are shown in black; and selected clear and cloudy periods used in the analysis are shown in green and red, respectively. The difference in variability between clear and cloudy periods is significant and marked.
Figure 14. Classification of clear and cloudy 15-minute intervals. All intervals are plotted in gray, peak solar intervals in black, clear intervals in green, and cloudy intervals in red.
To assess the impact of PV variability on system voltage, the distributions of maximum and minimum voltage for cloudy and clear periods were then compared; see Figure 15.
All other things being equal, if fluctuations in PV power production caused by fluctuations in GHI are significant relative to the total load behind the meter, then we expect to see voltage deviations greater than those caused by general building noise. On the other hand, if the power fluctuations of the PV system are not significant, then voltage deviations caused by PV power fluctuations will likely be lost in the general noise of voltage fluctuations caused by building loads, which constantly ramp up or down and/or turn on or off.
To identify these potential larger fluctuations, we compared clear periods with cloudy periods. During clear periods when GHI is not variable, general operation of building loads on either side of the meter is the dominant driver of voltage variability; as such, voltage during these periods can be used as a reference or baseline, against which voltage during cloudy periods can be compared. Figure 15 shows this comparison. For each phase at each
06 12 18 00 06 12 180
200
400
600
800
Clear and Cloudy Intervals for 15-minute DEMROES GHI
Nov 28-29, 2014
GH
I [W
m-2
]
15
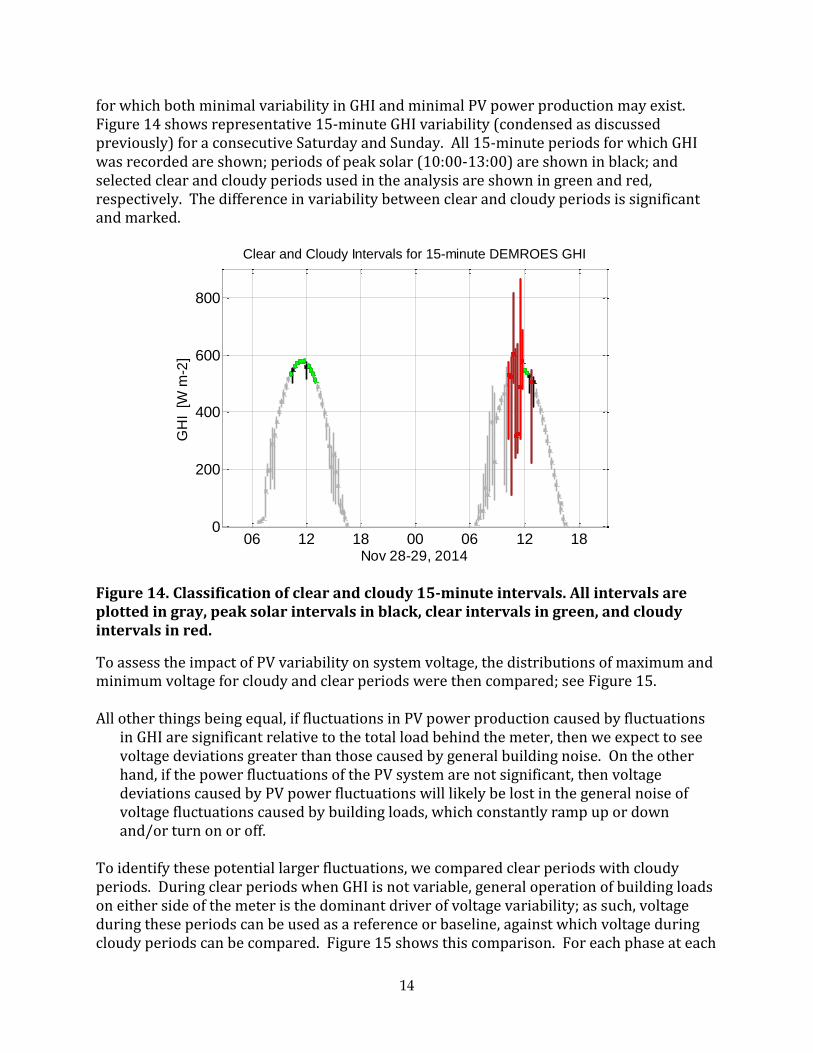
meter, the distribution of maximum and minimum voltages (each set of two distributions) is compared for clear (left) and cloudy (right) periods.
Figure 15. Voltage deviations during clear and cloudy intervals. The distribution of high and low voltages for the two meters and each phase are plotted separately. The distribution of voltage data for clear intervals is shown at left and for cloudy intervals at right.
We observe no adverse impacts on system voltage caused by fluctuations in PV power production. During cloudy intervals, GHI both increases above and decreases below the clear sky irradiance level (see Figure 14). The former is due to cloud enhancement, in which additional photons are scattered toward the sensor from nearby clouds; the latter to photon absorption when clouds cover the sensor. As such, if impacts were significant we should observe a wider distribution of voltages during cloudy intervals; in other words, the highest voltage measurements should be greater and the lowest voltage measurements lower, due to the wider range of GHI.
2.4 Potential Benefits of Energy Storage To Mitigate Impacts UCSD installed an energy storage system rated at 30 kW / 30 kWh which was coupled with 30 kW of PV solar. This system installation was sponsored by Sanyo/Panasonic and the control system was designed to mitigate the impacts of intermittency of PV solar. This system was one of the first distributed energy storage systems (DESS) integrated with PV solar and installed in California, in fact at the time this was one of the first DESS installed in the US, and thus has been in operation collecting the most data for DESS. The impact of high levels of PV penetration on the distribution system has become a concern to utility operations and customer power quality. One of the major concerns is the potential impact of the rapid fluctuations of distribution voltages and line loading caused by the intermittency of PV due to the passing of clouds.
5 10 15470
475
480
485
490
495
500Meter: E2705
Vo
lta
ge
[V
]
a b c
Clear
Cloudy
5 10 15470
475
480
485
490
495
500Meter: E5501
a b c
Clear
Cloudy
16
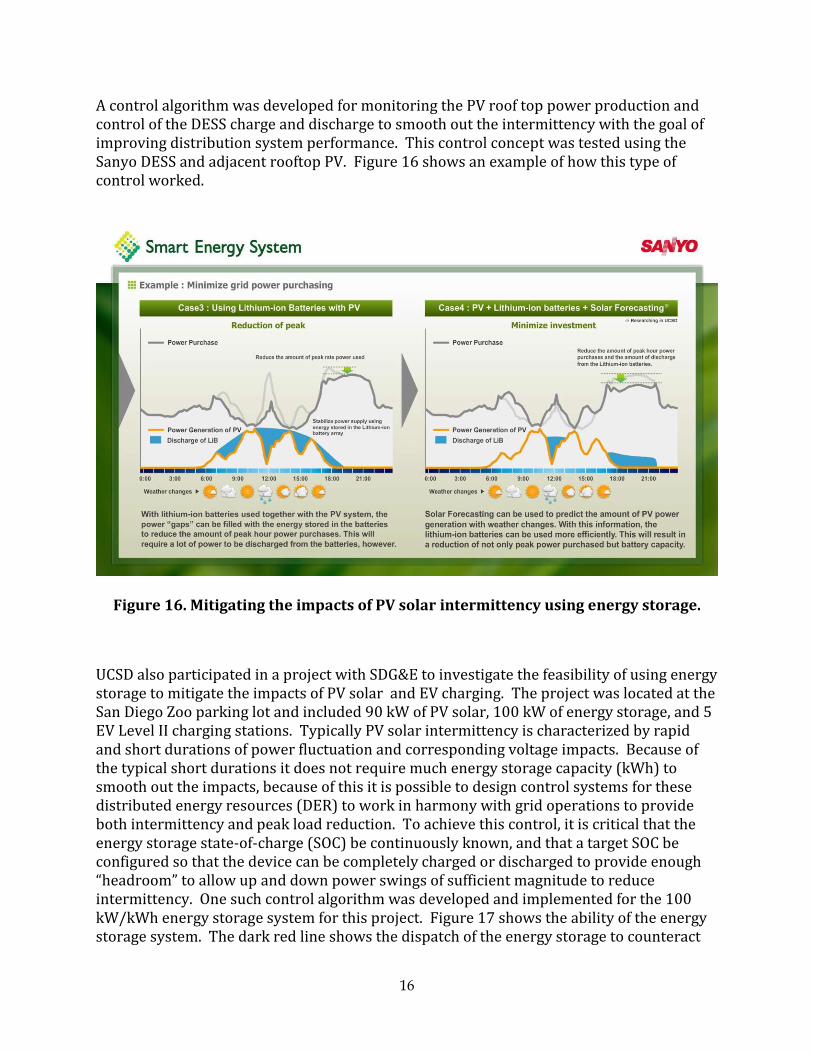
A control algorithm was developed for monitoring the PV roof top power production and control of the DESS charge and discharge to smooth out the intermittency with the goal of improving distribution system performance. This control concept was tested using the Sanyo DESS and adjacent rooftop PV. Figure 16 shows an example of how this type of control worked.
Figure 16. Mitigating the impacts of PV solar intermittency using energy storage.
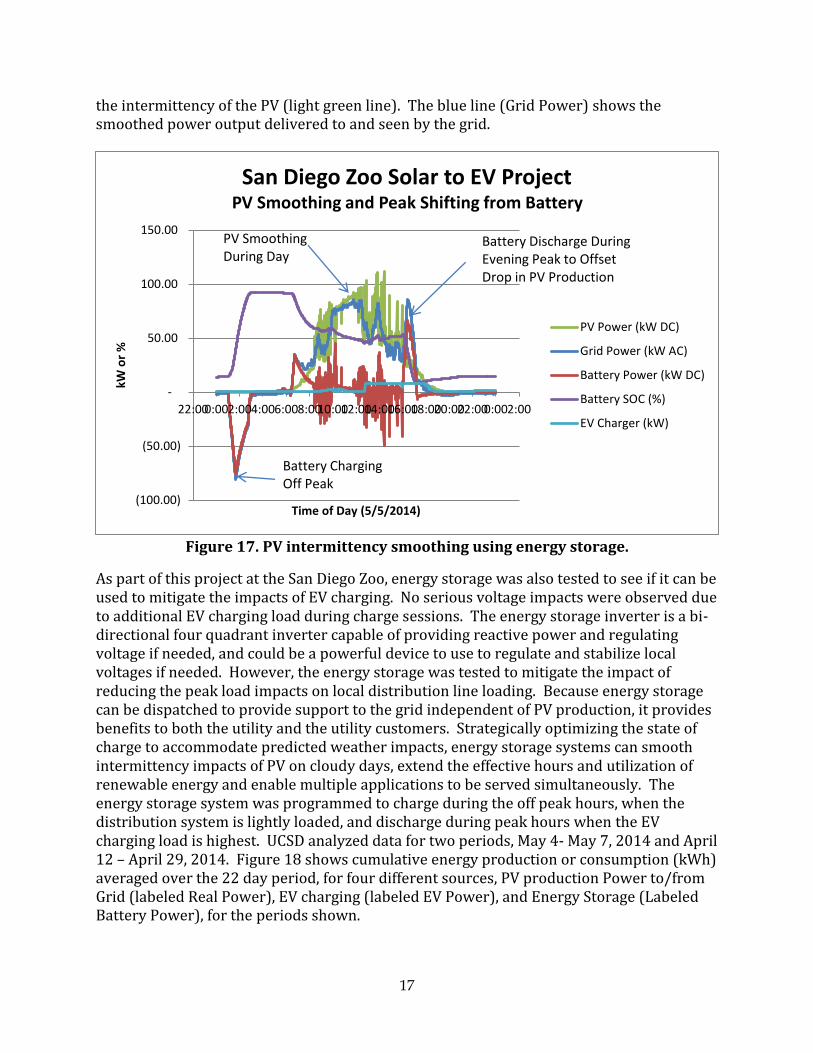
UCSD also participated in a project with SDG&E to investigate the feasibility of using energy storage to mitigate the impacts of PV solar and EV charging. The project was located at the San Diego Zoo parking lot and included 90 kW of PV solar, 100 kW of energy storage, and 5 EV Level II charging stations. Typically PV solar intermittency is characterized by rapid and short durations of power fluctuation and corresponding voltage impacts. Because of the typical short durations it does not require much energy storage capacity (kWh) to smooth out the impacts, because of this it is possible to design control systems for these distributed energy resources (DER) to work in harmony with grid operations to provide both intermittency and peak load reduction. To achieve this control, it is critical that the energy storage state-of-charge (SOC) be continuously known, and that a target SOC be configured so that the device can be completely charged or discharged to provide enough “headroom” to allow up and down power swings of sufficient magnitude to reduce intermittency. One such control algorithm was developed and implemented for the 100 kW/kWh energy storage system for this project. Figure 17 shows the ability of the energy storage system. The dark red line shows the dispatch of the energy storage to counteract
17
the intermittency of the PV (light green line). The blue line (Grid Power) shows the smoothed power output delivered to and seen by the grid.
Figure 17. PV intermittency smoothing using energy storage.
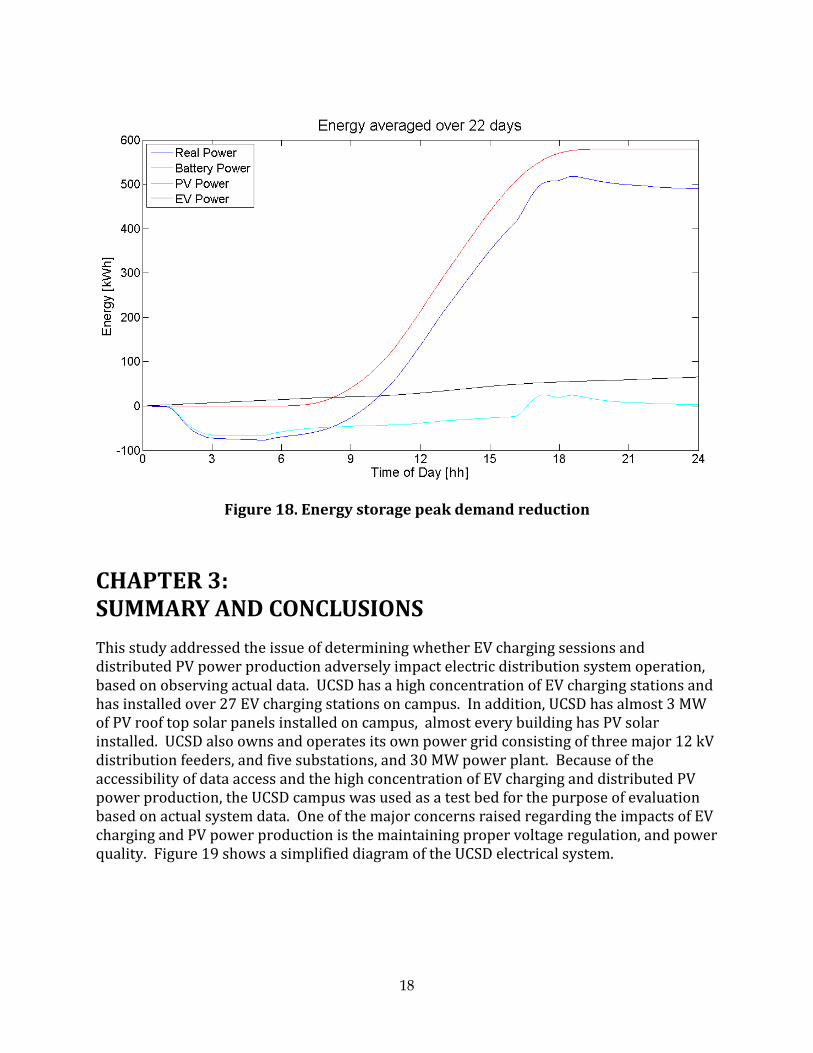
As part of this project at the San Diego Zoo, energy storage was also tested to see if it can be used to mitigate the impacts of EV charging. No serious voltage impacts were observed due to additional EV charging load during charge sessions. The energy storage inverter is a bi-directional four quadrant inverter capable of providing reactive power and regulating voltage if needed, and could be a powerful device to use to regulate and stabilize local voltages if needed. However, the energy storage was tested to mitigate the impact of reducing the peak load impacts on local distribution line loading. Because energy storage can be dispatched to provide support to the grid independent of PV production, it provides benefits to both the utility and the utility customers. Strategically optimizing the state of charge to accommodate predicted weather impacts, energy storage systems can smooth intermittency impacts of PV on cloudy days, extend the effective hours and utilization of renewable energy and enable multiple applications to be served simultaneously. The energy storage system was programmed to charge during the off peak hours, when the distribution system is lightly loaded, and discharge during peak hours when the EV charging load is highest. UCSD analyzed data for two periods, May 4- May 7, 2014 and April 12 – April 29, 2014. Figure 18 shows cumulative energy production or consumption (kWh) averaged over the 22 day period, for four different sources, PV production Power to/from Grid (labeled Real Power), EV charging (labeled EV Power), and Energy Storage (Labeled Battery Power), for the periods shown.
(100.00)
(50.00)
-
50.00
100.00
150.00
22:000:002:004:006:008:0010:0012:0014:0016:0018:0020:0022:000:002:00
kW o
r %
Time of Day (5/5/2014)
San Diego Zoo Solar to EV ProjectPV Smoothing and Peak Shifting from Battery
PV Power (kW DC)
Grid Power (kW AC)
Battery Power (kW DC)
Battery SOC (%)
EV Charger (kW)
Battery Charging Off Peak
PV Smoothing During Day
Battery Discharge During Evening Peak to Offset Drop in PV Production
18
Figure 18. Energy storage peak demand reduction
CHAPTER 3: SUMMARY AND CONCLUSIONS
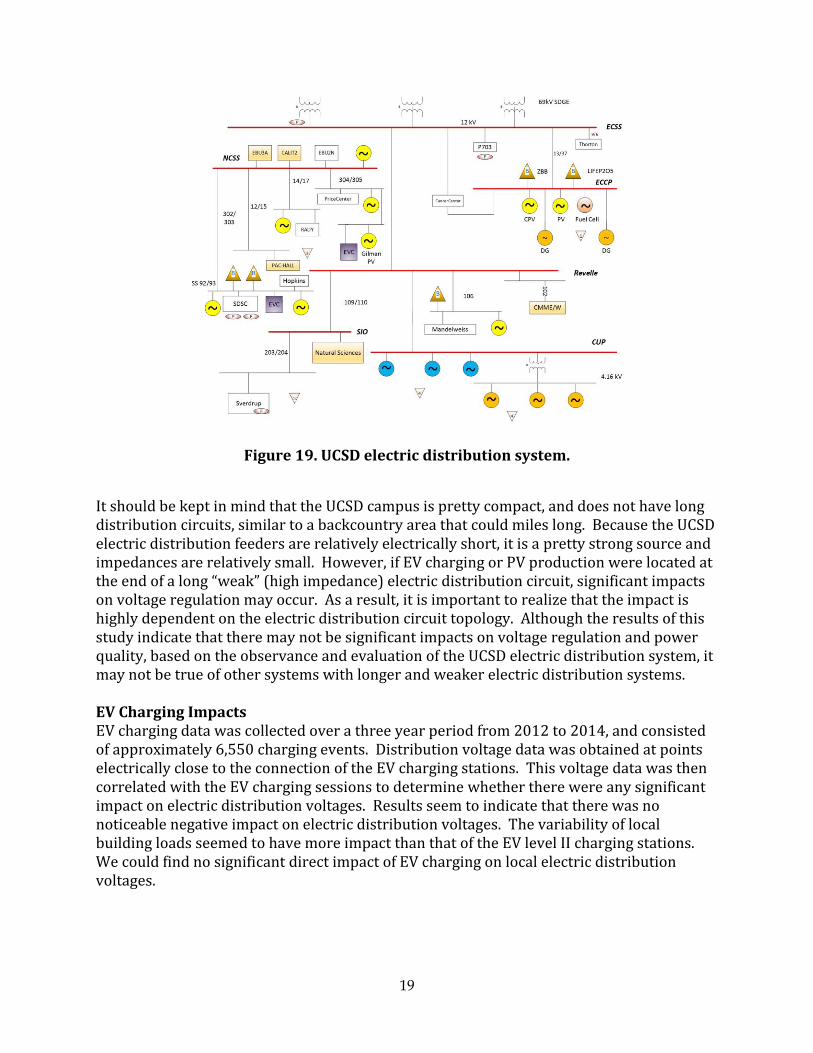
This study addressed the issue of determining whether EV charging sessions and distributed PV power production adversely impact electric distribution system operation, based on observing actual data. UCSD has a high concentration of EV charging stations and has installed over 27 EV charging stations on campus. In addition, UCSD has almost 3 MW of PV roof top solar panels installed on campus, almost every building has PV solar installed. UCSD also owns and operates its own power grid consisting of three major 12 kV distribution feeders, and five substations, and 30 MW power plant. Because of the accessibility of data access and the high concentration of EV charging and distributed PV power production, the UCSD campus was used as a test bed for the purpose of evaluation based on actual system data. One of the major concerns raised regarding the impacts of EV charging and PV power production is the maintaining proper voltage regulation, and power quality. Figure 19 shows a simplified diagram of the UCSD electrical system.
19
Figure 19. UCSD electric distribution system.
It should be kept in mind that the UCSD campus is pretty compact, and does not have long distribution circuits, similar to a backcountry area that could miles long. Because the UCSD electric distribution feeders are relatively electrically short, it is a pretty strong source and impedances are relatively small. However, if EV charging or PV production were located at the end of a long “weak” (high impedance) electric distribution circuit, significant impacts on voltage regulation may occur. As a result, it is important to realize that the impact is highly dependent on the electric distribution circuit topology. Although the results of this study indicate that there may not be significant impacts on voltage regulation and power quality, based on the observance and evaluation of the UCSD electric distribution system, it may not be true of other systems with longer and weaker electric distribution systems. EV Charging Impacts EV charging data was collected over a three year period from 2012 to 2014, and consisted of approximately 6,550 charging events. Distribution voltage data was obtained at points electrically close to the connection of the EV charging stations. This voltage data was then correlated with the EV charging sessions to determine whether there were any significant impact on electric distribution voltages. Results seem to indicate that there was no noticeable negative impact on electric distribution voltages. The variability of local building loads seemed to have more impact than that of the EV level II charging stations. We could find no significant direct impact of EV charging on local electric distribution voltages.
20
PV Power Production Impacts UCSD has over 110 roof top PV panel installations on campus. UCSD also has a network of sensors that can measure solar irradiance. The PV power production is directly proportional to the level of irradiance. Similar to the EV impact analysis the irradiance data was correlated with the voltage deviation data collected near PV systems. Based on evaluation of this data no adverse impacts on system voltage were caused by fluctuations in PV power production.
Energy Storage Mitigation of Impacts Energy storage can be very effective for improving the performance of the electrical grid. Inverters have fast response capability, can provide both real and reactive power, and can be exploited through various control schemes to provide superior performance and mitigate the impacts of high PV penetration and large swings in load such as EV charging stations. UCSD has conducted demonstration projects which directly coupled PV and energy storage and evaluated control schemes to mitigate the impacts of PV intermittency. Also UCSD has collaborated with the local utility SDG&E, to investigate the feasibility of using energy storage to mitigate the impacts of EV charging and PV solar on local electric distribution circuit loadings, and found it to be effective.
Recommendations As mentioned, the results of this analysis cannot be applied generally to all electric distribution circuits, since results are highly dependent on the topology (length, proximity to strong generation sources, types and locations of loads, etc.) of the electric distribution circuit. However, it is recommended that additional data be collected from other electric distribution circuits with high concentration of EV charging stations and distributed PV generation, perhaps on other California electric utility distribution circuits.