Cumulative exposure to styrene and visual functions
10
AMERICAN JOURNAL OF INDUSTRIAL MEDICINE 39:351–360 (2001) Cumulative Exposure to Styrene and Visual Functions Laura Castillo, MD, MSc, 1,2 Mary Baldwin, MSc, SM, 1 Marie-Pascale Sassine, MSc, 1 and Donna Mergler, PhD 1 Background Results from a 1990–1992 longitudinal study of several reinforced plastics plants showed that for those workers whose styrene exposure had decreased, color vision (CV) improved; while near visual contrast sensitivity (CS) was poorer. Methods In 1999, we retested these visual functions in 18 workers with good visual acuity. A cumulative exposure index (CEI), corrected for respirator use, was calculated for each worker. Results Intra-individual comparison of mandelic acid (MA) showed a significant decrease over time (Friedman; P 0:015), but current values were not related to CEI. For CV, no significant differencewas observed between 1992 and 1999; present results were not related to MA or CEI. The CS profile decreased over time, with significant differences at 3 cpd (Friedman; P < 0:05). CS did not vary with MA levels, but was significantly depressed at the intermediate frequencies among those in the upper CEI category (Kruskal–Wallis; P < 0:05). Conclusions These findings suggest that CS loss increases with long-term cumulative exposure, reflecting chronic damage to the neuro-optic pathways. Am. J. Ind. Med. 39:351–360, 2001. ß 2001 Wiley-Liss, Inc. KEY WORDS: vision; contrast sensitivity; styrene; cumulative exposure; color vision; mandelic acid; reinforced plastics; workers INTRODUCTION Several studies have shown that styrene has ophthal- motoxic properties (Gobba et al., 1991; Fallas et al., 1992; Chia et al., 1994; Campagna et al., 1995; Eguchi et al., 1995; Mergler et al., 1996). Most of this research focused on acquired dyschromatopsia, which has been observed at relatively low levels of exposure (< 125 mg/m 3 ) [Chia et al., 1994; Eguchi et al., 1995; Campagna et al., 1996]. It has been suggested that styrene-related color vision loss may be reversible over a period of more than 1 month, but less than 2 years [Gobba et al., 1991; Mergler et al., 1996]. Near visual contrast sensitivity loss, which has been observed among workers exposed to organic solvent mixtures [Frenette et al., 1991; Donoghue et al. 1995], has also been reported for styrene-exposed workers in reinforced plastics manufacturing plants [Campagna et al., 1995; Mergler et al., 1996]. In 1990 and 1992, our research group conducted a longitudinal study of several reinforced plastics plants in Que ´bec. This study was carried out in cooperation with joint union–management occupational health and safety commit- tees, and occupational health professionals from the Department of Community Health and the Center for Local Community Services (CLSC). In the 1990 study, the rela- tionship between internal and external parameters of styrene exposure and the visual functions of chromatic discrimina- tion and near visual contrast sensitivity were examined. It was shown that workers with higher end-shift, end of work- week urinary mandelic acid (MA) had poorer color vision 1 Centre d’ etude des interactions biologiques entre la sant e et l’environnement (CINBIOSE), Universit e du Qu ebec a Montr eal, Montr eal, Qu ebec, Canada 2 Centro de estudios de la salud de los trabajadores (CEST), Universidad de Carabobo Contract grant sponsor: Conf ederation des syndicaux nationaux Correspondence to: Dr. Donna Mergler, CINBIOSE, Universit e du Qu ebec a Montr eal, CP 8888, succ. Centreville, Montr eal, Qu ebec, Canada H3C 3P8 E-mail: mergler.donna@uqam.ca Accepted12 November 2000 ß 2001 Wiley-Liss, Inc.
-
Upload
laura-castillo -
Category
Documents
-
view
212 -
download
0
Transcript of Cumulative exposure to styrene and visual functions

AMERICAN JOURNAL OF INDUSTRIAL MEDICINE 39:351±360 (2001)
Cumulative Exposure to Styreneand Visual Functions
Laura Castillo, MD, MSc,1,2 Mary Baldwin, MSc, SM,1 Marie-Pascale Sassine, MSc,1
and Donna Mergler, PhD1�
Background Results from a 1990±1992 longitudinal study of several reinforced plasticsplants showed that for those workers whose styrene exposure had decreased, color vision(CV) improved; while near visual contrast sensitivity (CS) was poorer.Methods In 1999, we retested these visual functions in 18 workers with good visualacuity. A cumulative exposure index (CEI), corrected for respirator use, was calculatedfor each worker.Results Intra-individual comparison of mandelic acid (MA) showed a signi®cantdecrease over time (Friedman; P � 0:015), but current values were not related to CEI.For CV, no signi®cant difference was observed between 1992 and 1999; present resultswere not related to MA or CEI. The CS pro®le decreased over time, with signi®cantdifferences at 3 cpd (Friedman; P < 0:05). CS did not vary with MA levels, but wassigni®cantly depressed at the intermediate frequencies among those in the upper CEIcategory (Kruskal±Wallis; P < 0:05).Conclusions These ®ndings suggest that CS loss increases with long-term cumulativeexposure, re¯ecting chronic damage to the neuro-optic pathways. Am. J. Ind. Med.39:351±360, 2001. ß 2001 Wiley-Liss, Inc.
KEY WORDS: vision; contrast sensitivity; styrene; cumulative exposure; colorvision; mandelic acid; reinforced plastics; workers
INTRODUCTION
Several studies have shown that styrene has ophthal-
motoxic properties (Gobba et al., 1991; Fallas et al., 1992;
Chia et al., 1994; Campagna et al., 1995; Eguchi et al., 1995;
Mergler et al., 1996). Most of this research focused on
acquired dyschromatopsia, which has been observed at
relatively low levels of exposure (< 125 mg/m3) [Chia et al.,
1994; Eguchi et al., 1995; Campagna et al., 1996]. It has
been suggested that styrene-related color vision loss may be
reversible over a period of more than 1 month, but less than
2 years [Gobba et al., 1991; Mergler et al., 1996]. Near
visual contrast sensitivity loss, which has been observed
among workers exposed to organic solvent mixtures
[Frenette et al., 1991; Donoghue et al. 1995], has also been
reported for styrene-exposed workers in reinforced plastics
manufacturing plants [Campagna et al., 1995; Mergler et al.,
1996].
In 1990 and 1992, our research group conducted a
longitudinal study of several reinforced plastics plants in
QueÂbec. This study was carried out in cooperation with joint
union±management occupational health and safety commit-
tees, and occupational health professionals from the
Department of Community Health and the Center for Local
Community Services (CLSC). In the 1990 study, the rela-
tionship between internal and external parameters of styrene
exposure and the visual functions of chromatic discrimina-
tion and near visual contrast sensitivity were examined. It
was shown that workers with higher end-shift, end of work-
week urinary mandelic acid (MA) had poorer color vision
1Centre d'�etude des interactions biologiques entre la sant�e et l'environnement (CINBIOSE),Universit�e du Qu�ebec�a Montr�eal, Montr�eal, Qu�ebec, Canada
2Centro de estudios de la salud de los trabajadores (CEST), Universidad de CaraboboContract grant sponsor: Conf�ederation des syndicaux nationaux�Correspondence to: Dr. Donna Mergler, CINBIOSE, Universit�e du Qu�ebec �a Montr�eal,
CP 8888, succ. Centreville, Montr�eal, Qu�ebec, Canada H3C 3P8E-mail: [email protected]
Accepted12 November 2000
ß 2001Wiley-Liss, Inc.
and depressed contrast vision sensitivity in the intermediate
and higher frequencies (12 and 18 cycles � degreesÿ1)
[Campagna et al., 1995]. Immediately following the 1990
study, recommendations were made to the joint health and
safety committees to decrease styrene exposure levels. A
follow-up study was carried out in 1992, after one plant had
made changes in work practices and ventilation improve-
ments. For those workers whose exposure had decreased,
performance on several neurobehavioral tests and color
vision improved; however, near visual contrast sensitivity
was poorer [Mergler et al., 1996].
In 1999, we re-tested visual function in a subset of the
original cohort located at the plant which had changed work
practices in 1991, in order to explore changes in visual
function in relation to longer term exposure and to examine
chronicity. Our hypothesis was that cumulative styrene
exposure contributes to the degradation of near visual
contrast sensitivity, while color vision would re¯ect current
exposure. Thus, one objective was to construct styrene
exposure pro®les for these workers in order to create a
measure of cumulative exposure. The second objective was
to examine visual functions in relation to current and
cumulative styrene exposure.
MATERIALS AND METHODS
Participants
The participants in the 1999 study were recruited from
those who had participated in both the 1990 and 1992 study
and were still employed at the plant where changes had been
made. Of the 32 male workers who had participated in the
two previous surveys, 30 were still working at the plant and
24 (80%) participated in the present study. Consent forms
were signed by all participants. Since the group of workers
was relatively small, rather than adjusting for near visual
acuity loss, those with poor visual acuity (minimal reso-
lution of 1 min of arc at 0.37 m) in each eye with use of the
National Optical Visual Chart (n� 6) were excluded to
maintain homogeneity. Thus, the present analyses comprise
18 persons.
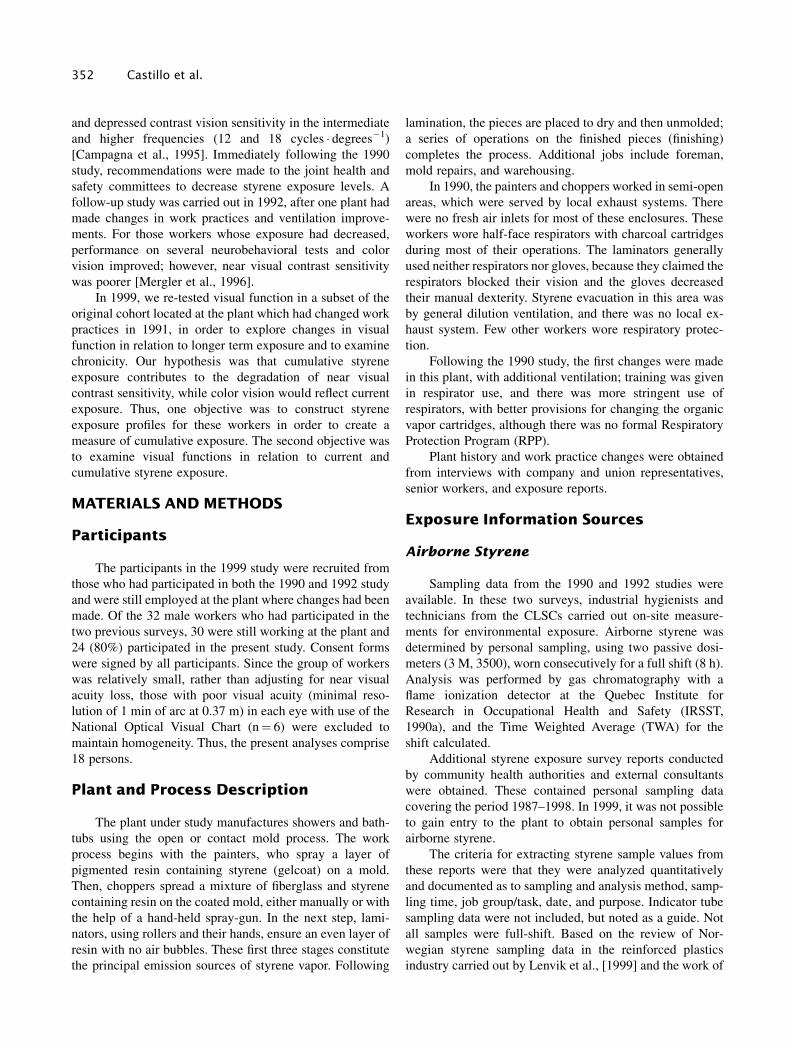
Plant and Process Description
The plant under study manufactures showers and bath-
tubs using the open or contact mold process. The work
process begins with the painters, who spray a layer of
pigmented resin containing styrene (gelcoat) on a mold.
Then, choppers spread a mixture of ®berglass and styrene
containing resin on the coated mold, either manually or with
the help of a hand-held spray-gun. In the next step, lami-
nators, using rollers and their hands, ensure an even layer of
resin with no air bubbles. These ®rst three stages constitute
the principal emission sources of styrene vapor. Following
lamination, the pieces are placed to dry and then unmolded;
a series of operations on the ®nished pieces (®nishing)
completes the process. Additional jobs include foreman,
mold repairs, and warehousing.
In 1990, the painters and choppers worked in semi-open
areas, which were served by local exhaust systems. There
were no fresh air inlets for most of these enclosures. These
workers wore half-face respirators with charcoal cartridges
during most of their operations. The laminators generally
used neither respirators nor gloves, because they claimed the
respirators blocked their vision and the gloves decreased
their manual dexterity. Styrene evacuation in this area was
by general dilution ventilation, and there was no local ex-
haust system. Few other workers wore respiratory protec-
tion.
Following the 1990 study, the ®rst changes were made
in this plant, with additional ventilation; training was given
in respirator use, and there was more stringent use of
respirators, with better provisions for changing the organic
vapor cartridges, although there was no formal Respiratory
Protection Program (RPP).
Plant history and work practice changes were obtained
from interviews with company and union representatives,
senior workers, and exposure reports.
Exposure Information Sources
Airborne Styrene
Sampling data from the 1990 and 1992 studies were
available. In these two surveys, industrial hygienists and
technicians from the CLSCs carried out on-site measure-
ments for environmental exposure. Airborne styrene was
determined by personal sampling, using two passive dosi-
meters (3 M, 3500), worn consecutively for a full shift (8 h).
Analysis was performed by gas chromatography with a
¯ame ionization detector at the Quebec Institute for
Research in Occupational Health and Safety (IRSST,
1990a), and the Time Weighted Average (TWA) for the
shift calculated.
Additional styrene exposure survey reports conducted
by community health authorities and external consultants
were obtained. These contained personal sampling data
covering the period 1987±1998. In 1999, it was not possible
to gain entry to the plant to obtain personal samples for
airborne styrene.
The criteria for extracting styrene sample values from
these reports were that they were analyzed quantitatively
and documented as to sampling and analysis method, samp-
ling time, job group/task, date, and purpose. Indicator tube
sampling data were not included, but noted as a guide. Not
all samples were full-shift. Based on the review of Nor-
wegian styrene sampling data in the reinforced plastics
industry carried out by Lenvik et al., [1999] and the work of
352 Castillo et al.

Severi et al., [1994] on half-shift sampling, and preliminary
examination of the data, the few short-term samples of less
than 1-h duration were excluded. All samples of 1 h or more
were included as integrated exposures representative of the
workday for the tasks of the various job groups in the plant.
It is noteworthy that all styrene analyses had been carried
out at the IRSST, which ensured analytical quality control.
The ®nal styrene exposure database contained 286 personal
sampling results from identi®ed job groups.
Biological Indicator of Exposure
End-shift, end of work-week urinary mandelic acid
(MA) data were available from the 1990 and 1992 studies.
In these two studies, end-shift urine samples were collected
on the same day as personal environmental monitoring took
place. In 1999, end-shift, end of work-week urinary samples
were collected, and analyzed for MA. Urinary samples in all
these three studies were analyzed at the IRSST for MA
using high-pressure liquid chromatography with a UV
detector [IRSST, 1990b], the results being corrected for
urinary creatinine [IRSST, 1989]. No other reports contain-
ing MA values were located.
Treatment of Exposure Data
The environmental styrene exposure data were log
normally distributed. The 1990 study, which had identi®ed
various job groupings: choppers, laminators, painters, all of
whom were highly exposed, and unmolders, ®nishers, and a
mixed group of low exposure jobs [Truchon et al., 1992]
formed the basis for the present classi®cation. Data from
within each year were examined by analysis of variance
(ANOVA), and where there was no signi®cant difference
between job groups, data for the year were combined to
describe larger groupings. Although there was often no
signi®cant difference between ®nishers and the mixed low
exposure group in a given year, ®nishers were maintained as
a separate well-de®ned group for the following reasons:
there were considerable data for this group; their work was
in well-de®ned locations; they represented a stable group to
monitor general plant conditions over time.
Job groups were then examined between years to
determine whether signi®cant change had occurred, and
again combined when there was no signi®cant difference
between years on the log transformed data. Decisions for
points of change, and years with no data were made taking
into account information on plant history. The arithmetic
mean of the data for a job grouping and period was then used
as the exposure value for the period concerned, as the
arithmetic mean is considered preferable when cumulative
exposure is being estimated [Seixas et al., 1988]. The ratio
between job groups for some highly exposed groups
(painters, choppers, laminators) for an appropriate year
with complete data was used to estimate missing values in
years where data existed for at least one of the three groups,
according to the method outlined by Stewart et al. [1996].
The worker with most seniority commenced in 1983.
For the period prior to 1987 where there were no reports, the
1987 values were back-extrapolated on the assumption that
conditions were unlikely to have been better in the past. This
is a conservative assumption and is supported by the survey
of Lemasters et al. [1985] of U.S. data from government
sources of plants in the reinforced plastics industry. That
survey included three plants in tub and shower manufactur-
ing, where laminators showed a mean styrene exposure
value of 239 mg/m3 styrene. The assumption is also sup-
ported by exposure data from a mortality study of the
European reinforced plastics industries [Welp et al.,1996].
Correction for Use of Respirators
In the 1990 study it was noted that both painters and
choppers wore masks much of the time and laminators
rarely; however, there was no formal RPP in place at that
time, and cartridges were not regularly changed. Lamina-
tors, choppers, and painters in many years had similar
magnitude styrene exposure levels from environmental data.
To account for the modifying effect of respirator usage on
the styrene absorption of these three heavily exposed groups,
correction factors were developed on a job-group basis.
One approach to correction for respirator use would
have been to consider the percentage of time wearing res-
pirators. While questionnaire data for the percentage of time
using a respirator was collected in the 1990 study, this did
not account satisfactorily for the MA values of those using
half-face organic vapor cartridge respirators. The effective-
ness of respiratory protection was variable, and did not
apply uniformly across job groups as a simple percentage of
time wearing respirator [Truchon et al., 1992].
The correction for respirator use in the present study
was derived from the data from the 1990 study of three
plants (including the current plant), which showed a strong
linear relationship between end-shift, end of work-week
MA, and environmental styrene values from same-day per-
sonal sampling for those workers who did not use a chemical
cartridge mask on the day of assessment. The following
equation, provided by Campagna et al. [1995], describes this
relation:
y � 0:0024 X� 0:0114; r s � 0:95 �P < 0:001�N � 68 �1�
where
y�mandelic acid (mmol/mmol creatinineÿ1)
x� styrene concentration (mg/mÿ3)
Cumulative Exposure to Styrene and Visual Functions 353
It should be noted that all of the participants in the
present study were included in the dataset used to generate
Equation (1).
For each job group using respirators (e.g., painters), the
styrene value corresponding to the mean of end-shift, end of
work-week urinary MA values for all painters in 1990 was
calculated using Equation (1). This calculated value was
then compared with the mean airborne styrene value for
painters in 1990 obtained from the personal sampling data.
The ratio of the calculated styrene to the measured styrene
expressed as a percentage was used as the factor to correct
for reduction in exposure due to the use of respirators. The
year 1990 was considered representative of conditions prior
to changes implemented in this plant, and the 1990 factors
were applied to earlier data. A similar procedure was app-
lied to the 1992 data, using Equation (1), to develop a
second set of correction factors. Changes were implemented
in 1991, and in 1992 there was some training in respirator
use, and fresh cartridges were provided, but there was still
no formal RPP in place until the end of 1998. The factors
derived from the 1992 data were applied from 1991 to 1998.
Work History Information Sources
Work history information was available from self-
administered questionnaires from the 1990 study and the
1992 follow-up. An update questionnaire was given during
the 1999 study, followed by a brief individual interview for
clari®cation. Veri®cation points for the job histories were
obtained from several of the environmental styrene exposure
survey reports where speci®c workers sampled were identi-
®ed by name as well as job position.
Construction of CumulativeExposure Index
Work histories of individual workers from 1983 to 1999
were combined with styrene exposure values estimated for
each job group and year using appropriate correction factors
by job group and year for use of masks. The cumulative
exposure index (CEI) was calculated for each worker in the
study, using the styrene exposure for the job-group year as
calculated from sampling data modi®ed by the appropriate
mask correction factor, summed over the individual's
speci®c years of work history. These calculations were
carried out blinded to and independent of the analyses of the
data from the visual function tests.
Visual Function Assessment
The protocol for visual function assessment was iden-
tical for the three testing periods: 1990, 1992, and 1999. In
1999 visual functions were assessed on Saturday morning,
at least 12 h after the last exposure to styrene. All visual
functions, including near acuity, were examined mono-
cularly in a darkened room, under standardized illumination
provided by a `̀ daylight'' 1150-lux ¯uorescent lamp posi-
tioned 0.3 m above the target. Participants with a pre-
scription for eye glasses wore their own untinted eyeglasses
or contact lenses.
Color vision was assessed with the Lanthony D-15 hue
desaturated panel (Luneau Ophthalmique, Paris, France), as
described for the previous studies [Campagna et al., 1995;
Mergler et al., 1996]. The results of the test were expressed
as the Color Confusion Score (CCS), calculated using a
program developed by Huie [1984]. The mean value for the
two eyes was used in the present analyses.
Near visual contrast sensitivity was evaluated using the
Vistech 6000 card system according to methods described
for the earlier studies [Campagna et al., 1995; Mergler et al.,
1996]. The same cards were used for the three studies. Near
visual contrast sensitivity threshold was determined for each
eye at spatial frequencies of 1.5, 3.0, 6.0, 12.0, and 18.0
cycles per degree (cpd) and mean values for both eyes were
calculated.
Statistical Analyses
Both styrene exposure data and MA data were log
normally distributed and analyses were performed on the
transformed data. Analysis of variance (ANOVA) was used
for within-year comparisons of job grouping exposures,
comparison of means was done using Student's t-test. Non-
parametric statistics were used to compare repeated meas-
ures over time (Friedman's Test) or differences in group
categories (Kruskall±Wallis). The signi®cance threshold of
0.05 was used throughout. Analyses were performed using
Statview 5.0 (SAS Institute Inc.).
RESULTS
Table I describes the socio-demographic characteristics
of the workers who participated in this study.
The distribution of the monitoring information for each
year where data existed and over job groups at the time of
sampling is shown in Table II. It was possible to validate 64
points in time for correspondence between work histories as
provided by the self-administered questionnaires ®lled out
by the workers and the information for particular individuals
derived from the exposure reports. There was concordance
for 60 speci®c jobs (94%); the remaining four were in
closely related jobs.
Based on the job histories, the following job groupings
were examined to create the CEI: painter, chopper, lami-
nator, ®nisher, and other (low exposure). Figure 1 shows the
pro®le of mean airborne styrene levels for these job groups
over the period 1987±1998. The increase in exposure levels
354 Castillo et al.

TABLE I. Socio-Demographic Characteristics of the18Workers From a Reinforced Plastics Plant, Canada
Mean SD Median Range
Age (years) 38.3 7.6 35 27^51Education (years) 11.3 1.8 11.0 7^15Alcohol intake (g/week) 155 250 41 0^994Seniority (years) 13.3 2.4 13.0 10^20
TABLE II. Exposure Information Data by Job and Year in a Reinforced Plastics Plant
Year
Job 1987 1988 1989 1990 1991 1992 1995 1998 Total
Paint/laminator 9 23 14 ö ö ö ö ö 46Laminator ö ö ö 17 ö 10 6 ö 33Chopper ö ö ö 9 ö 8 6 ö 23Laminator/chopper ö ö ö ö ö ö ö 12 12Paint/unmolder ö ö ö 10 ö 4 7 9 30Paint/lamin/chopper ö ö ö ö 12 ö 7 ö 19Unmolder ö ö ö 3 ö 2 4 ö 9Finisher 3 7 4 31 ö 12 7 3 67Other (lowexposure) ö ö ö 25 ö 10 9 3 47
Total 12 30 18 95 12 46 46 27 286
FIGURE1. Mean styrene concentrations for job categories from1987 to1998.
Cumulative Exposure to Styrene and Visual Functions 355
following 1987 was associated with increase in production.
For example, for 1989, painters and laminators did not differ
and the measured exposure levels ranged from 528 to 1035
mg/m3 (n� 14); the geometric standard deviation (GSD) for
that year was 1.21. Exposure for laminators remained
relatively constant from 1992 until the most recent survey in
1998, with values ranging from 209 to 458 mg/m3 (n� 34);
the GSD for this period ranged from 1.23 to 1.30. Finishers'
exposure has decreased slightly over time, with the highest
mean value in 1989 (61 mg/m3), ranging from 50 to 84 mg/
m3 (n� 4) and the lowest values in 1998 (mean: 12 mg/m3),
ranging from 10 to 15 mg/m3 (n� 3).
The low exposure levels observed for all groups in 1991
were the combined effect of reduced production due to
economic conditions (many workers were laid off) and
the introduction of ventilation and work practice changes.
Exposures remained stable over the 1992±1994 period for
all groups. In late 1994, the Quebec TWAEV was lowered
from 420 to 215 mg/m3 [Editeur, of®ciel du QueÂbec, 1987,
1995], and further changes in ventilation and work practices
decreased airborne exposure levels of choppers and
painters; however, laminators' airborne exposure level did
not change.
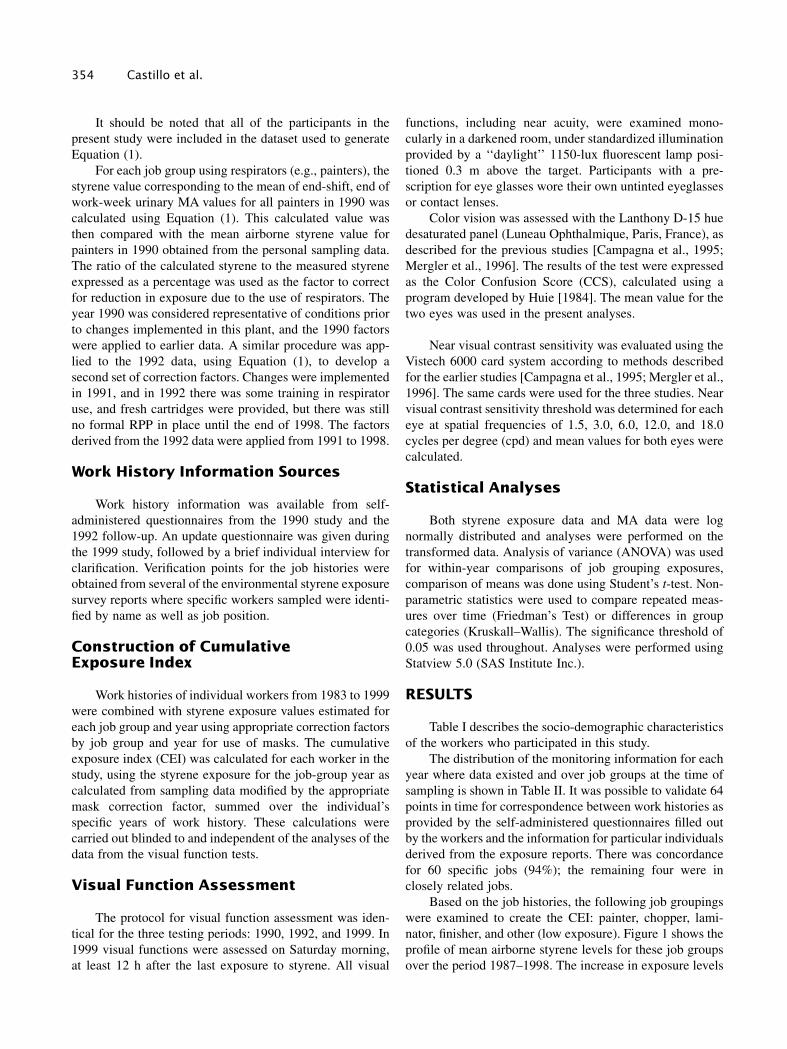
The distribution of urinary MA for the workers in the
present study is shown in Figure 2 for 1990, 1992, and 1999.
Comparison of each worker to his previous values showed
that there was a decrease in exposure over time (Friedman
Rank; w2� 8.4; df� 2; P � 0:015). The most important
decreases were for the job categories with the highest MA
levels. Current MA levels for the different job categories are
presented in Table III; laminators and choppers now rotate
jobs throughout the day and are grouped into one category.
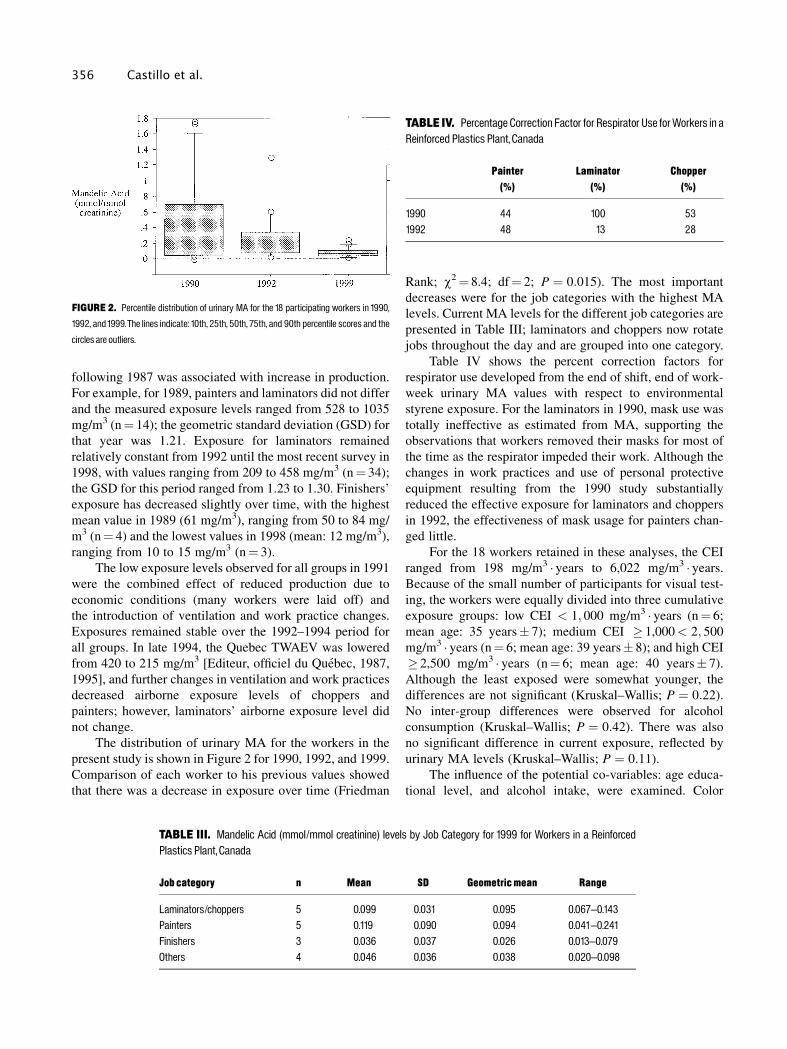
Table IV shows the percent correction factors for
respirator use developed from the end of shift, end of work-
week urinary MA values with respect to environmental
styrene exposure. For the laminators in 1990, mask use was
totally ineffective as estimated from MA, supporting the
observations that workers removed their masks for most of
the time as the respirator impeded their work. Although the
changes in work practices and use of personal protective
equipment resulting from the 1990 study substantially
reduced the effective exposure for laminators and choppers
in 1992, the effectiveness of mask usage for painters chan-
ged little.
For the 18 workers retained in these analyses, the CEI
ranged from 198 mg/m3 � years to 6,022 mg/m3 � years.
Because of the small number of participants for visual test-
ing, the workers were equally divided into three cumulative
exposure groups: low CEI < 1; 000 mg/m3 � years (n� 6;
mean age: 35 years� 7); medium CEI � 1,000< 2; 500
mg/m3 � years (n� 6; mean age: 39 years� 8); and high CEI
� 2,500 mg/m3 � years (n� 6; mean age: 40 years� 7).
Although the least exposed were somewhat younger, the
differences are not signi®cant (Kruskal±Wallis; P � 0:22).
No inter-group differences were observed for alcohol
consumption (Kruskal±Wallis; P � 0:42). There was also
no signi®cant difference in current exposure, re¯ected by
urinary MA levels (Kruskal±Wallis; P � 0:11).
The in¯uence of the potential co-variables: age educa-
tional level, and alcohol intake, were examined. Color
FIGURE 2. Percentile distribution of urinary MA for the 18 participating workers in 1990,
1992, and1999.The lines indicate: 10th, 25th, 50th, 75th, and 90th percentile scores and the
circles are outliers.
TABLE III. Mandelic Acid (mmol/mmol creatinine) levels by Job Category for 1999 for Workers in a ReinforcedPlastics Plant, Canada
Job category n Mean SD Geometric mean Range
Laminators/choppers 5 0.099 0.031 0.095 0.067^0.143Painters 5 0.119 0.090 0.094 0.041^0.241Finishers 3 0.036 0.037 0.026 0.013^0.079Others 4 0.046 0.036 0.038 0.020^0.098
TABLE IV. Percentage Correction Factor for Respirator Use forWorkers in aReinforced Plastics Plant, Canada
Painter Laminator Chopper(%) (%) (%)
1990 44 100 531992 48 13 28
356 Castillo et al.

confusion scores and the higher spatial frequencies of the
near-visual contrast sensitivity were associated with age,
but not educational level or alcohol intake. The scores were
adjusted for age for each measurement year using the
method of co-variance.
The distribution of the age-adjusted color confusion
scores 1990, 1992, and 1999 are shown in Figure 3. Paired
analyses showed that color vision improved between 1990
and 1992 (Wilcoxon; P < 0:05), re¯ecting the results shown
with the larger group, reported by Mergler et al. [1996]. No
signi®cant difference was observed for the period between
1992 and 1999. The 1999 results were not related to cur-
rent exposure, evaluated by MA levels, or the cumulative
exposure groups.
The mean age-adjusted near visual contrast sensitivity
pro®le for 1990, 1992, and 1999 showed a tendency to
decrease over time, with signi®cant intra-individual differ-
ences at 3 cpd (Friedman; P < 0:05) (Fig. 4). The 1999
pro®le did not vary with MA levels. When examined with
respect to the CEI, the mean age-adjusted contrast sensi-
tivity pro®le was depressed among the group with the
highest CEI, and signi®cantly lower (P < 0:05) at the spatial
frequencies 3, 6, and 12 cpd (Fig. 5). This same pattern was
observed using the continuous variable CEI with age-
adjusted near visual contrast sensitivity scores. The relations
were signi®cant at 3 cpd (r2� 0.41; P < 0:004) and 6 cpd
(r2� 0.30; P < 0:02), while at 12 cpd, the relation was just
above the signi®cance level (r2� 0.18; P � 0:08); for 1.5
and 18 cpd, the relations were not signi®cant (P � 0:13 and
0.10, respectively).
DISCUSSION
The results from our previous 2-year follow-up study of
workers in a reinforced plastics plant showed that reduction
of styrene exposure was associated with improvement on
some neurofunctional tests, notably color vision [Mergler
et al., 1996]. On the other hand, near visual contrast sensi-
tivity decreased during this interval in spite of overall
reduction in exposure levels. This raised the question of the
possible effects of cumulative exposure, which we were able
to investigate in a subset of the same workers, 6 years later.
A primary concern in using historical measurement
data to estimate cumulative exposure is the question of the
representativeness of the data to the true long-term exposure
[Stewart et al., 1996]. Here, individual work histories were
combined with group data considered representative of the
exposure at a particular job category over time. The 1990
study, for which there are the most measurements, was not
designed to evaluate speci®c job groupings, and each parti-
cipating worker was sampled once. The distribution of
measurements re¯ects the workforce distribution of parti-
cipants during a period of high production, which accounts
for the larger number of samples on ®nishers, a low ex-
FIGURE 3. Percentile distribution of age-adjusted Color Confusion Score (n�17) in1990,1992, and1999.The lines indicate: 10th, 25th, 50th, 75th, and 90th percentile scores and the
circles are outliers.
FIGURE4. Age-adjustednear visual contrastsensitivityprofiles for the18workers in1990,
1992, and1999.The asterisk indicates a significant decrease at P < 0:05; Friedman's Rank
Test.
FIGURE 5. Age-adjusted near visual contrast sensitivity profiles with respect to cumula-
tive exposure index (low, n� 6), medium (n� 6), and high (n� 6).The asterisk indicates a
significant decrease at P < 0:05; Friedman's RankTest.
Cumulative Exposure to Styrene and Visual Functions 357

posure group, relative to the number of samples in each of
the three high exposure groups.
The 1992 study, which sampled a subset of the initial
group, was a follow-up study to evaluate the effect of
de®ned changes in ventilation and use of respirators. Again,
each worker was sampled once, and the distribution re¯ects
the ongoing workforce which participated in the follow-up.
There had been substantial attrition of the workforce due to
economic conditions. In both the 1990 and 1992 studies,
personal sampling and biological monitoring were con-
ducted on the same day, on the ®nal full workday of the
work-week, and are considered representative.
Sampling carried out by the community health organi-
zation and consultants was more frequently for compliance
evaluation purposes, and tended to include fewer samples of
less exposed job groups. The 1995 survey data followed the
reduction in the Quebec TWAEV for styrene in late 1994
from 420 to 215 mg/m3 [Editeur, of®ciel du QueÂbec, 1987,
1995].
The pro®le of external styrene levels for laminators in
this plant is not dissimilar to that shown for a large group of
European laminators [Welp et al., 1996], although exposure
levels in the Quebec plant are higher. The results here are
similar to those reported in a 1999 study in the New England
boat-building industry, where lapel sampling showed mean
values of 294 and 299 mg/m3 for spray gun operators and
400 and 434 mg/m3 for roller operators [Malek et al., 1999],
jobs similar to choppers and laminators.
The current styrene levels in this Quebec plant are also
comparable to those observed in a recent study by Gobba
et al. [2000] in a small Italian plant manufacturing rein-
forced plastics products, where half-shift monitoring over a
2-week period of a group of seven hand-rollers and sprayers
gave mean styrene exposure levels ranging from 169.2 to
335.7mg/m3.
The process used in the present study for the correction
of environmental styrene exposure for respirator use is
similar to that used by Gobba et al. [2000] to evaluate the
effectiveness of respirator use during a complete half-shift,
using urinary styrene (StU) as the biomarker. These authors
found wide inter- and intra-individual variability, with a
mean 50±60% decrease in StU and a progressive reduction
in the effectiveness of the respirators as the week progressed.
As our estimates were based on the ®nal full work-day of the
work-week, they are conservative estimates of the protec-
tion afforded various work groups. No formal RPP was in
place until late 1998, and it is likely that the effectiveness of
respirators decreased over the work-week. LoÈf et al. [1993]
in an evaluation of respirator use in Swedish boat-building
operations, found that use of respirators for 52% of the time,
which corresponded to times when workers were exposed to
high concentrations of styrene during spraying, laminating,
and painting operations, reduced styrene exposure during
the entire workday by 56±92%, with a mean of 76%. The
respirators used in the Swedish study included both half-
facepiece air-purifying respirators with charcoal ®lters, used
during laminating, or full-face air-supplied respirators with
positive pressure used during spraying. In neither of these
two studies were measures identi®ed more closely with
speci®c operations.
The correction factors by job group used in the present
study provide a similar range of styrene reduction to those
reported by LoÈf et al. [1993], when respirators were worn,
but take into account work practices and conditions within
the three highly exposed job groups, and demonstrate the
effect of changes in work practice introduced in the plant.
For the laminators in our 1990 study, mask use was totally
ineffective as estimated from the MA values, con®rming the
observations made at that time about work practices and
supporting the use of the bioindicator to correct for res-
pirator usage. The level of reduction for choppers improved
from 47 to 72%, and the effectiveness of respirator usage for
painters did not change. Using urinary MA as a bioindicator
of effective exposure showed that respiratory protection in
this plant has been only moderately successful in controlling
styrene exposure.
Although control of environmental levels of styrene in
this plant has improved as a result of changes to meet more
stringent regulatory standards, the jobs of chopper, painter,
and laminator in this type of operation remain highly
exposed. The situation in this Quebec plant is probably
typical of many other small plants in the reinforced plastics
industry.
To constitute the cumulative exposure index, job
histories retrospectively reported by the workers were used.
The question of recall and the accuracy of workers' reports
is always a key issue and a potential source for misclassi-
®cation. For this study, questionnaires on job history were
completed in 1990, with updates in 1992 and 1999, and a
brief interview to clarify. The lapsed time for recall, and
number and duration of assignments, which have been
found to affect recall in job histories [Bond et al., 1988] was
thus divided into three shorter periods. Although company
records were not available in 1999, we were able to verify
the workers' self-reported histories at several points in time.
All jobs of all the workers participating in the 1999 study
were identi®ed in the sampling that took place in 1990 and
in 1992, and other sampling reports contained additional
veri®cation points. Cross-checking of workers' names and
speci®c jobs indicated in the sampling records with
workers' retrospective reporting showed agreement for
94%. The few that were not in complete agreement were
in jobs with similar exposure levels. These results are
similar to those obtained by Bourbonnais et al. [1988], who
found 89% concordance for job title between workers' self-
reporting and administrative records in a single plant, while
Bond et al. [1988] found from interviews that workers were
able to recall their usual work area assigment 70.8% of the
358 Castillo et al.

time. The history of changes in the plant which could affect
exposure levels was established through multiple sources
documentation in the reports, focus group meetings and the
interviews with the participants, and company and union
representatives.
Most studies of color vision among workers exposed to
styrene have demonstrated dose-dependant loss with current
exposure [Gobba et al, 1991; Fallas et al., 1992; Chia et al.
1994; Campagna et al; 1995]. Some authors have suggested
that the threshold for color vision impairment is very low
(< 30 ppm) [Chia et al., 1994; Campagna et al. 1996] and
may be reversible over time [Mergler et al., 1996]. In the
present study, MA levels were all inferior to 0.25 mmol/
mmol creatinine, which corresponds to the approximate
equivalent of 25 ppm (103 mg/m3) of styrene. These low
levels of actual exposure probably account for the absence
of a dose-dependant relation between color vision loss and
exposure.
Near contrast sensitivity was lowest in the group with
the highest cumulative exposure, with signi®cant loss in the
intermediate spatial frequencies (3±12 cpd). All workers
had good visual acuity, as was the case for the subset of
former microelectronics workers with a history of exposure
to a mixture of organic solvents who likewise presented
depressed near visual contrast sensitivity pro®les in the
intermediate spatial frequencies [Frenette et al., 1991]. A
similar contrast sensitivity loss among microelectronics
workers was con®rmed by Broadwell et al. [1995].
Donoghue et al. [1995] reported decreased far visual
contrast sensitivity in the same frequency range (3±12
cpd) in 16 patients diagnosed with occupational organic
solvent-induced chronic toxic encephalopathy. The group
included two styrene boat builders with 6 and 8 years
exposure.
It is interesting that in the present study there was no
relation between bioindicators of current exposure and
contrast sensitivity loss. This would suggest that contrast
sensitivity loss re¯ects long-term cumulative exposure and
chronic damage to the neuro-optic pathways. There is no
evidence of reversibility in this follow-up study or in any
previous studies which examined visual contrast sensitivity.
Further follow-up studies are needed of workers with org-
anic solvent-induced contrast sensitivity loss to con®rm
irreversibility, and to examine the progression and implica-
tions of the loss of visual functions.
Although it would have been interesting to follow a
reference group over the same period, this was not possible
here. Further follow-up studies should strive to include a
control group that could be assessed parallel to the exposed
workers.
The strengths of this study lie in the extensive data that
were available to construct a cumulative index of exposure.
Earlier studies by our research group, coupled with the work
of the local occupational health professionals and con-
sultants in this industry, where over-exposure to styrene has
been an important issue as the permissible levels have
decreased over time, provided valid measures over the past
12 years. The weakness lies in the small number of workers
in the study. It is noteworthy that even with these small
numbers, the relation between cumulative exposure and
near visual contrast sensitivity loss is signi®cant and
consistent with previous studies as well as the mechanistic
hypothesis that loss in the intermediate range, which re¯ects
the functioning of the neuro-optic pathways would be
affected by styrene exposure, while the higher frequencies,
which represent visual acuity, remain intact.
The effects seen for near visual contrast sensitivity
represent long-term chronic exposure at high levels, as all
the workers had a minimum of 6 months exposure in the
plant at the time of the 1990 study.
ACKNOWLEDGMENTS
We are grateful for the collaboration and participation
of the workers at this plant. The authors acknowledge the
support of Dr. Ginette Truchon of the QueÂbec Institute for
Research in Occupational Health and Safety (IRSST) in the
laboratory analyses, as well as Ms. Marie-Ludivine ChaÃteau-
Degat for her assistance with ®eldwork. We are particularly
appreciative of the support of Johanne Leduc and Sylvie
Champoux. We thank the Association of Universities and
Colleges of Canada and the Canadian International Devel-
opment Agency for their ®nancial support for Dr. Laura
Castillo.
REFERENCES
Bond GG, Boner KM, Sobel W, Shellenberger RJ, Flores GH. 1988.Validation of work histories obtained from interviews. Am J Epidemiol128:343±351.
Bourbonnais R, Meyer F, TheÂriault G. 1988. Validity of self reportedwork history. Br J Ind Med 45:29±32.
Broadwell DK, Darcey DJ, Hudnell HK, Otto DA, Boyes WK. 1995.Work-site clinical and neurobehavioral assessment of solvent-exposedmicroelectronics workers. Am J Ind Med 27:677±98.
Campagna D, Gobba F, Mergler D, Moreau T, Galassi C, Cavalleri A,Huel G. 1996. Colour vision loss among styrene exposed workers:neurotoxicological threshold assessment. Neurotoxicology 17:367±374.
Campagna D, Mergler D, Huel G, BeÂlanger S, Truchon G, Ostiguy C,Drolet D. 1995. Visual dysfunction among styrene-exposed workers.Scand J Work Environ Health 21:382±390.
Chia SE, Jeyaratnam J, Ong CN, Ng TP, Lee HS. 1994. Impairment ofcolour vision among workers exposed to low concentrations of styrene.Am J Ind Med 26: 481±488.
Donoghue AM, Dryson EW, Wynn-Williams G. 1995. Contrastsensitivity in organic-solvent-induced chronic toxic encephalopathy.J Occup Environ Med 37:1357±1375.
Editeur of®ciel du QueÂbec. 1995. ReÁglement sur la qualite du milieu dutravail, S-2.1, r.15, QueÂbec.
Cumulative Exposure to Styrene and Visual Functions 359

Editeur of®ciel du QueÂbec. 1987. ReÁglement sur la qualite du milieu dutravail, S-2.1, r.15, QueÂbec.
Eguchi T, Kishi R, Harabuchi I, Yuasa J, Arata Y, Katakura Y, Miyake H.1995. Impaired colour discrimination among workers exposed to styrene:relevance of a urinary metabolite. Occup Environ Med 52:534±538.
Fallas C, Fallas J, Maslard P, Dally S. 1992. Subclinical impairment ofcolour vision among workers exposed to styrene. Br J Ind Med 49:679±682.
Frenette B, Mergler D, Bowler R. 1991. Contrast sensitivity loss in agroup of former microelectronics workers with normal visual acuity.Optom Vis Sci 68:556±560.
Gobba F, Galassi C, Imbriani M, Ghittori S, Candela S, Cavalleri A.1991. Acquired dyschromatopsia among styrene-exposed workers. JOccup Med 33:761±765.
Gobba F, Ghittori S, Imbriani M, Cavalleri A. 2000. Evaluation of half-mask respirator protection in styrene-exposed workers. Int Arch OccupEnviron Health 73:56±60.
Huie K. 1984. Color discrimination in eye disease. Invest Ophth VisSci (Suppl) 25:178.
Institut de recherche en sante et en seÂcurite du travail du QueÂbec(IRSST). 1990a. Analyse du styreÁne dans l'air: meÂthode analytique 31-1. MontreÂal:IRSST.
Institut de recherche en sante et en seÂcurite du travail du QueÂbec(IRSST). 1990b. DeÂtermination de l'acide mandeÂlique dans l'urine:meÂthode analytique 106-1. MontreÂal:IRSST.
Institut de recherche en santeÂet en seÂcurite du travail du QueÂbec(IRSST). 1989. DeÂtermination de la creÂatinine urinaire:: meÂthodeanalytique 163-1. MontreÂal:IRSST.
Lemasters GK, Carson A, Samuels SJ. 1985. Occupational styreneexposure for twelve product categories in the reinforced-plasticsindustry. Am Ind Hyg Assoc J 46:434±441.
Lenvik K, Osvoll PO, Woldbaek T. 1999. Occupational exposure tostyrene in Norway 1972±96. App Occup Environ Hyg 14:165±170.
LoÈf A, Brohede C, Gullstrand E, LindstroÈm K, Sollenberg J,Wrangskog K, Hagberg M, Hedman BK. 1993. The effectiveness ofrespirators measured during styrene exposure in a plastic boat factory.Int Arch Occup Environ Health 65:29±34.
Malek RF, Daisy JM, Cohen BS. 1999. Breathing zone concentra-tion variations in the reinforced plastics industry: ®eld measure-ments in a boat manufacturing plant. App Occup Environ Hyg 14:777±784.
Mergler D, Huel G, BeÂlanger S, Bowler RM, Truchon G, Drolet D,Ostiguy C. 1996. Surveillance of early neurotoxic dysfunction.NeuroToxicology 17:803±812.
Seixas NS, Robins TG, Moulton LH. 1988. The use of geometric andarithmetic mean exposures in occupational epidemiology. Am J IndMed 14:465±477.
Severi M, Pauwels W, Van Hummelen P, Roosels D, Kirsch-Volders M,Veulemans H. 1994. Urinary mandelic acid and hemoglobin adducts in®breglass-reinforced plastics workers exposed to styrene. Scand JWork Environ Health 20:451±458.
Stewart PA, Lees PS, Francis M. 1996. Quanti®cation of historicalexposures in occupational cohort studies. Scand J Work Environ Health22:405±414.
Truchon G, Ostiguy C, Drolet D, Mergler D, Campagna D, BeÂlanger S,Larribe F, Huel G. 1992. Surveillance of neurotoxic effects associatedwith styrene exposure in the workplace. I. Environmental assessmentand biological monitoring. (Surveillance des effets neurotoxiques del'exposition au styreÁne en milieu de travail. I. Evaluation environne-mentale et surveillance biologique de l'exposition.) Travail et SanteÂ8(2):S11±S14.
Welp E, Kogevinas M, Andersen A, Bellander T, Biocca M, Coggon D,Esteve J, Gennaro V Kolstad H, Lundberg I, Lynge E, Partanen T,Spence A, Boffetta P, Ferro G, Saracci R. 1996. Exposure to styreneand mortality from nervous system diseases and mental disorders. AmJ Epidemiol 144:623±633.
360 Castillo et al.