
Culvert Risk Assessment Guideline Training Notes€¦ · the Risk Assessment Application (RAA)...
77
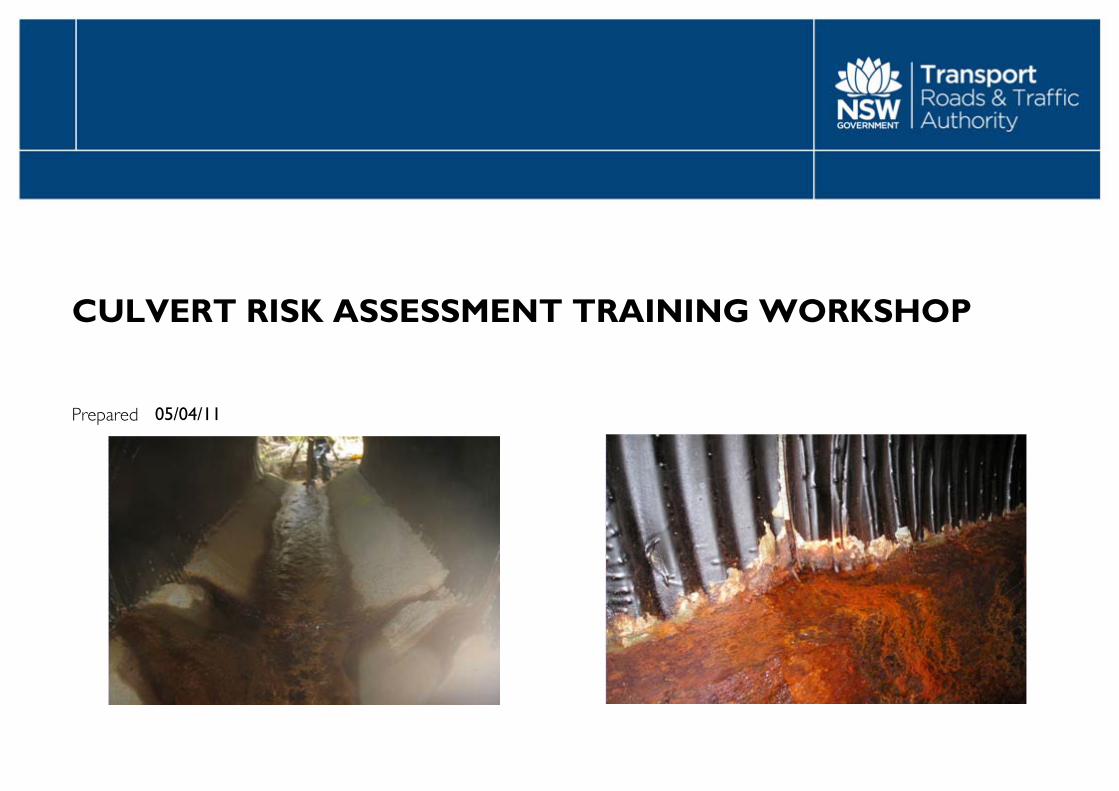
CULVERT RISK ASSESSMENT TRAINING WORKSHOP Prepared 05/04/11
Transcript of Culvert Risk Assessment Guideline Training Notes€¦ · the Risk Assessment Application (RAA)...
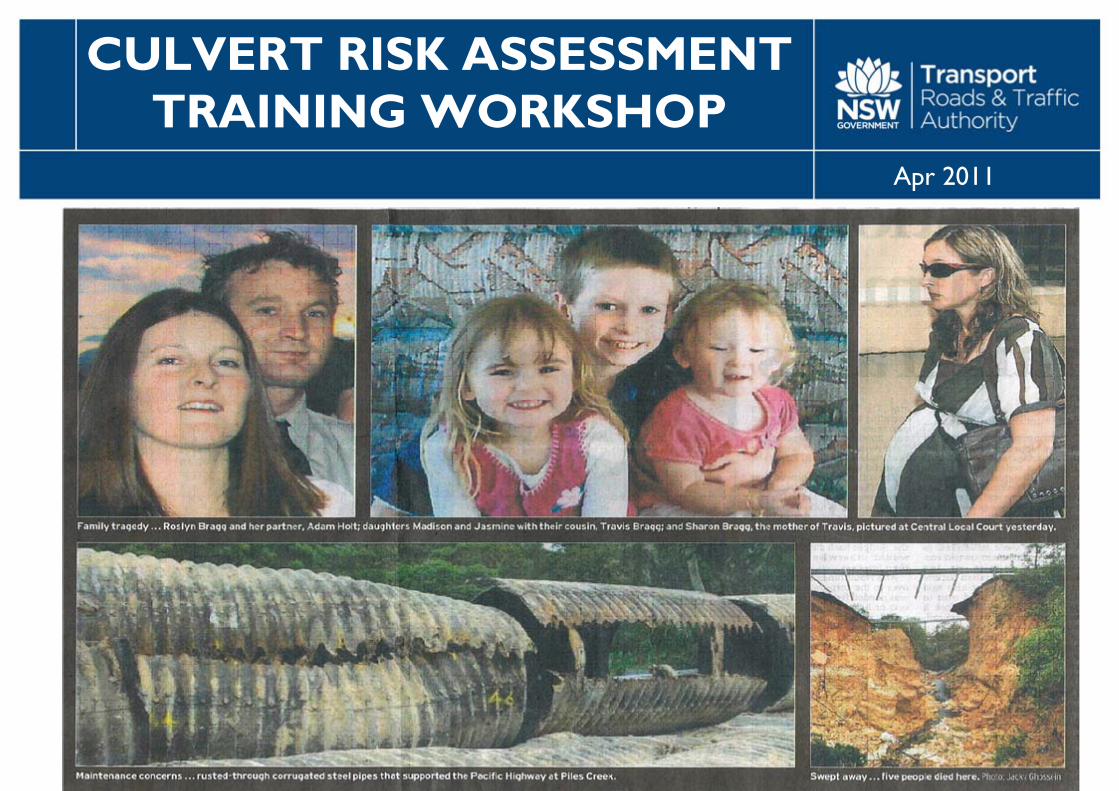
CULVERT RISK ASSESSMENT TRAINING WORKSHOP
Prepared 05/04/11
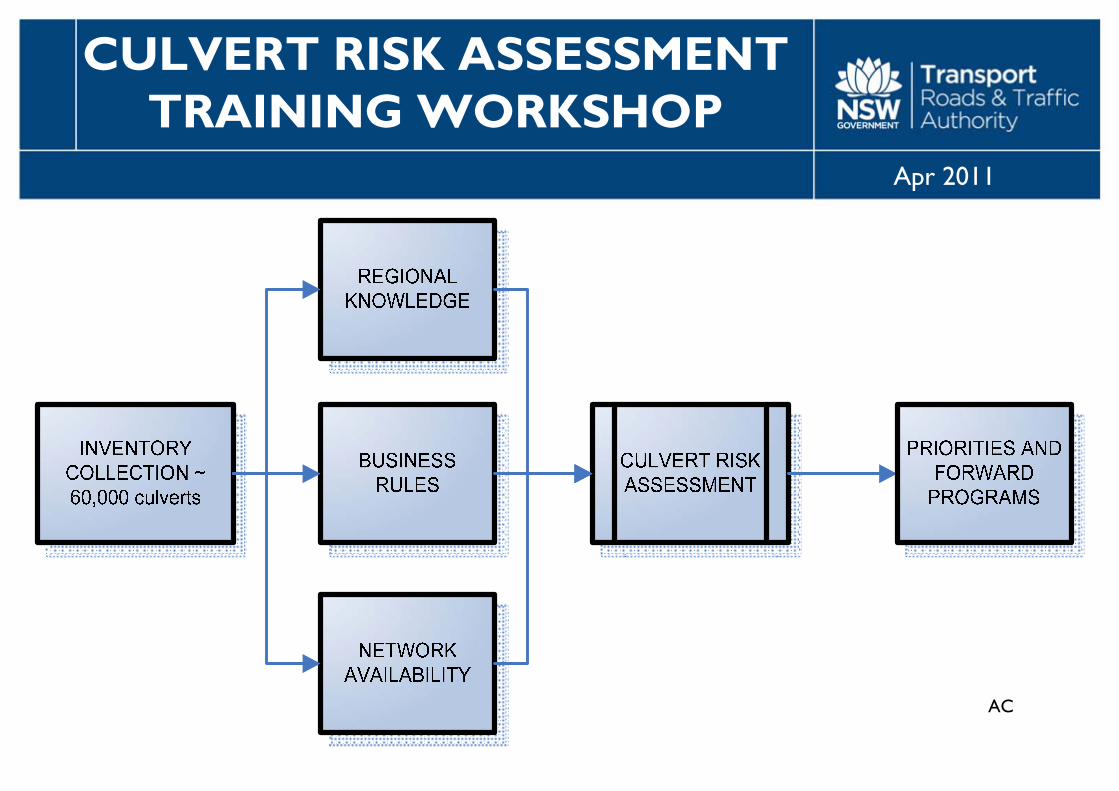
AC
TITLE
This image is a sample only.
To change click on image , delete and add your approved image
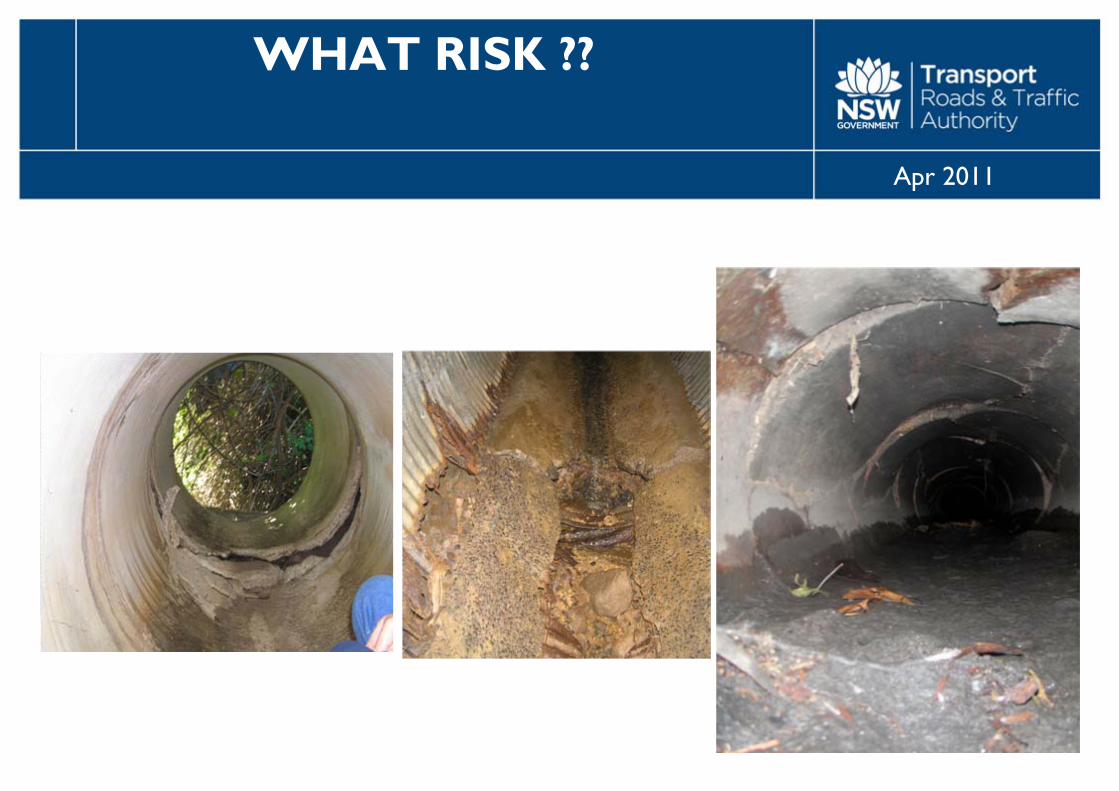
WHAT RISK ??
Apr 2011
AC
TITLE
This image is a sample only.
To change click on image , delete and add your approved image
CULVERT RISK ASSESSMENT TRAINING WORKSHOP
Apr 2011
Are we at risk?

AC
TITLE
This image is a sample only.
To change click on image , delete and add your approved image
Apr 2011
LEARNING OUTCOMES
1. Understand the current RTA culvert management process
2. Learn how to analyse inventory data and identify asset defects
3. Learn how to undertake risk assessments of culverts using the Risk Assessment Application (RAA) software to derive ASSESSED RISK LEVEL (ARL)
AC
TITLE
Prepared DD/MM/YYYY
This image is a sample only.
To change click on image , delete and add your approved image
CULVERT RISK ASSESSMENT TRAINING WORKSHOP
Apr 2011
AC
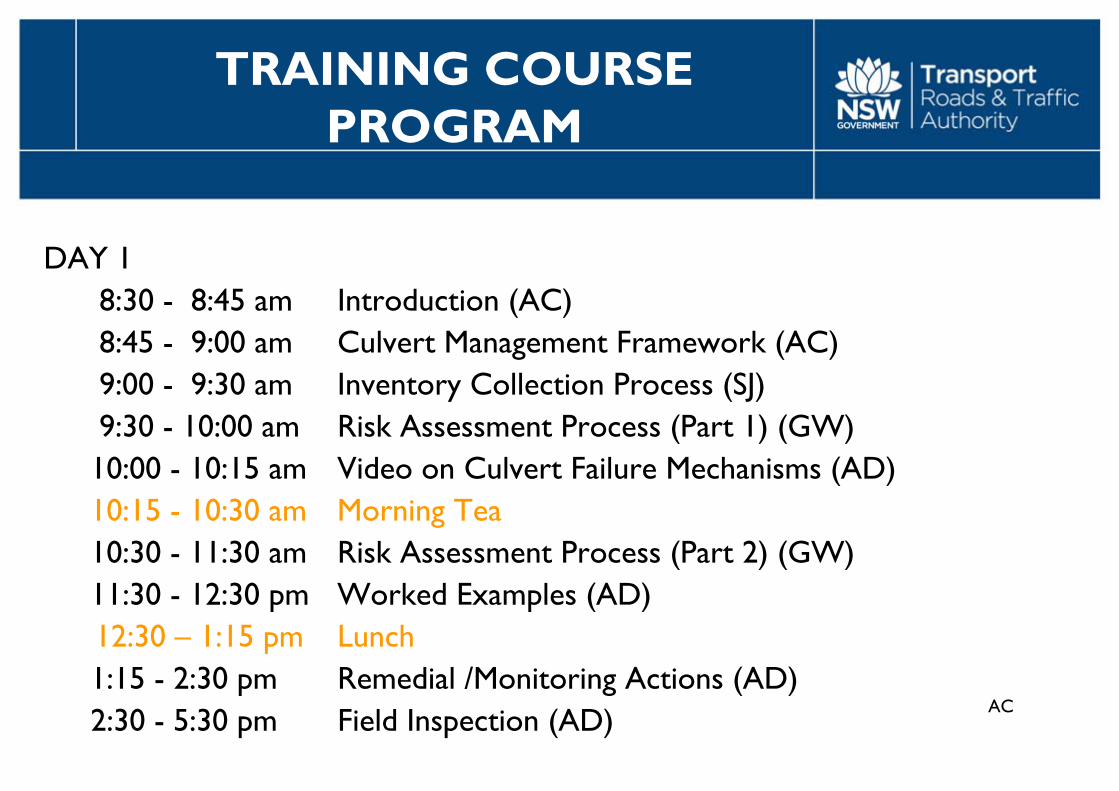
DAY 18:30 - 8:45 am Introduction (AC)8:45 - 9:00 am Culvert Management Framework (AC)9:00 - 9:30 am Inventory Collection Process (SJ)9:30 - 10:00 am Risk Assessment Process (Part 1) (GW)10:00 - 10:15 am Video on Culvert Failure Mechanisms (AD)10:15 - 10:30 am Morning Tea10:30 - 11:30 am Risk Assessment Process (Part 2) (GW)11:30 - 12:30 pm Worked Examples (AD)12:30 – 1:15 pm Lunch1:15 - 2:30 pm Remedial /Monitoring Actions (AD) 2:30 - 5:30 pm Field Inspection (AD)
TRAINING COURSE PROGRAM
AC
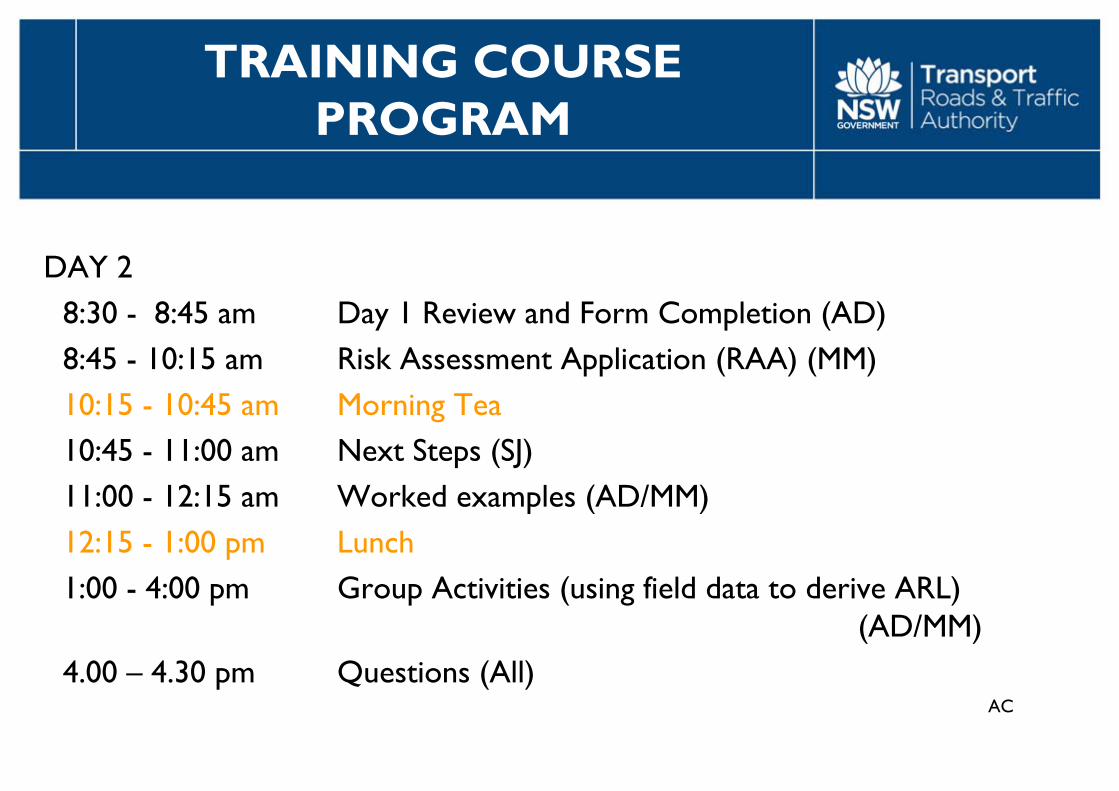
DAY 28:30 - 8:45 am Day 1 Review and Form Completion (AD)8:45 - 10:15 am Risk Assessment Application (RAA) (MM)10:15 - 10:45 am Morning Tea10:45 - 11:00 am Next Steps (SJ)11:00 - 12:15 am Worked examples (AD/MM)12:15 - 1:00 pm Lunch1:00 - 4:00 pm Group Activities (using field data to derive ARL)
(AD/MM)4.00 – 4.30 pm Questions (All)
TRAINING COURSE PROGRAM
AC
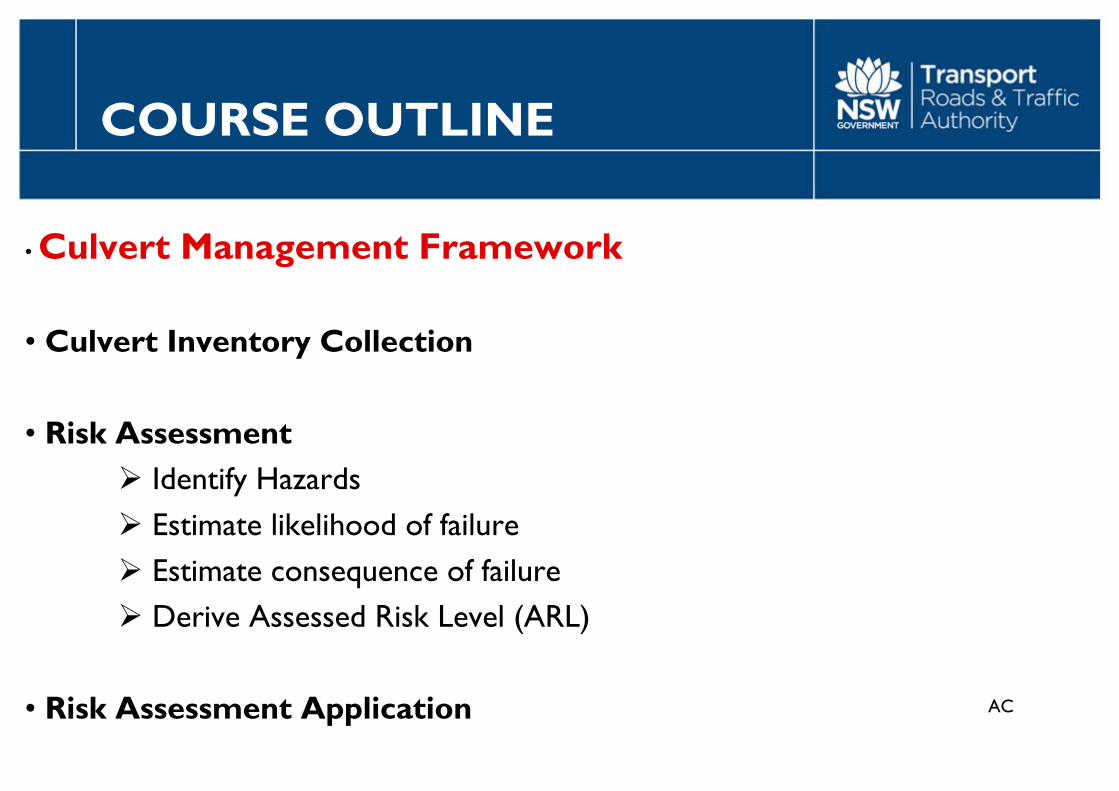
COURSE OUTLINE
• Culvert Management Framework
• Culvert Inventory Collection
• Risk Assessment Identify Hazards Estimate likelihood of failure Estimate consequence of failure Derive Assessed Risk Level (ARL)
• Risk Assessment Application
AC
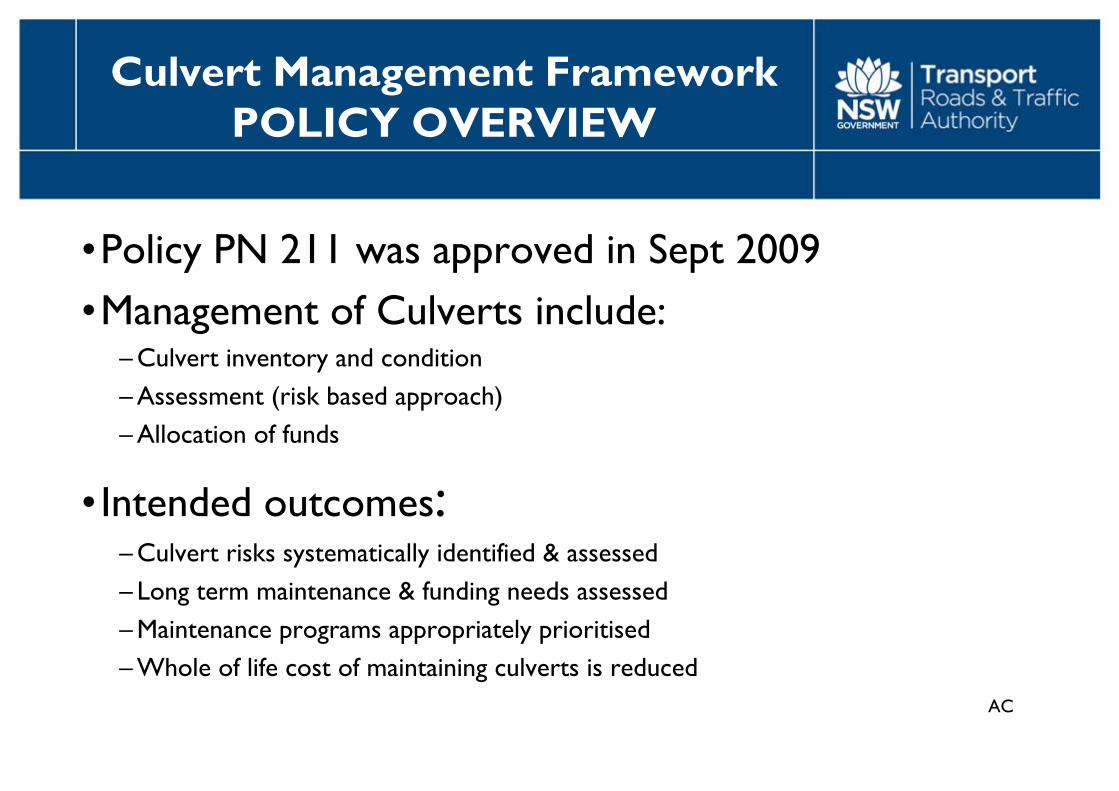
•Policy PN 211 was approved in Sept 2009•Management of Culverts include:
– Culvert inventory and condition– Assessment (risk based approach)– Allocation of funds
• Intended outcomes:– Culvert risks systematically identified & assessed– Long term maintenance & funding needs assessed– Maintenance programs appropriately prioritised– Whole of life cost of maintaining culverts is reduced
Culvert Management Framework POLICY OVERVIEW

AC
•Culvert Inventory Collection Guideline– Available on RTA internet site
•Culvert Risk Assessment Guideline•Rehabilitation Guideline
Culvert inventory and risk assessment to be managed in central RTA database within RAMS
Culvert Management Framework ASSOCIATED DOCUMENTS

AC
COURSE OUTLINE
• Culvert Management Framework
• Culvert Inventory Collection
• Risk Assessment Identify Hazards Estimate likelihood of failure Estimate consequence of failure Derive Assessed Risk Level (ARL)
• Risk Assessment Application
NN
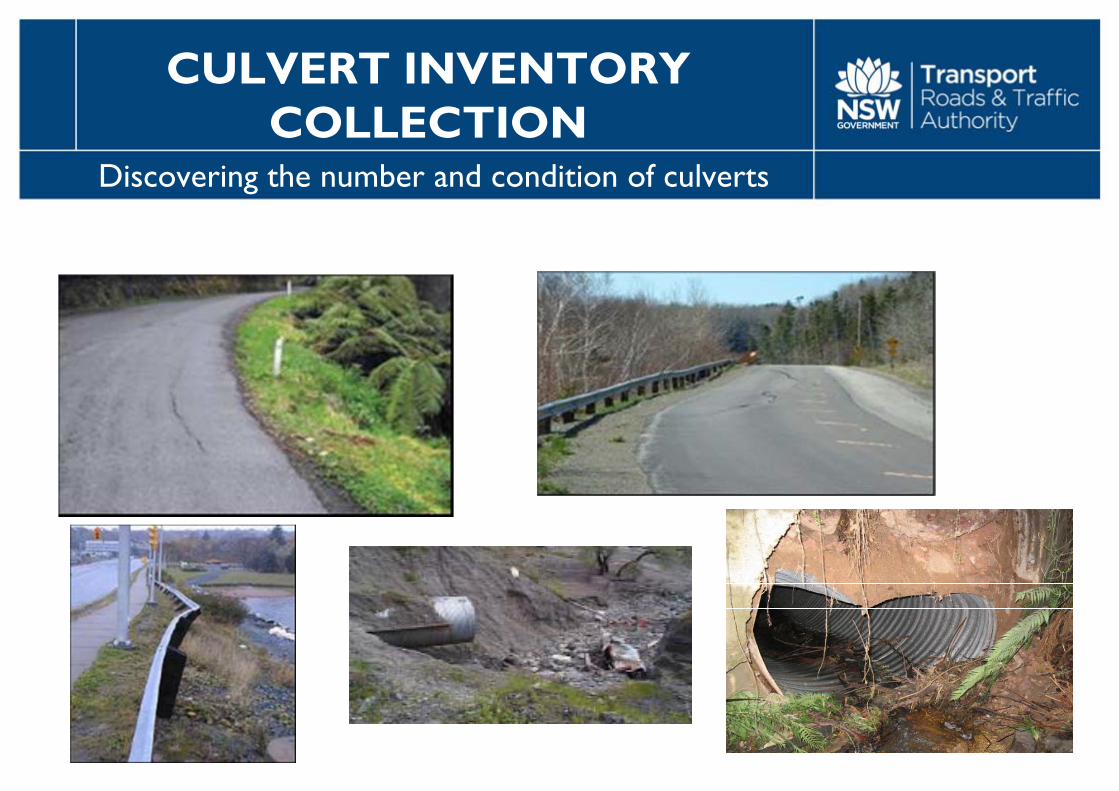
CULVERT INVENTORY COLLECTION
Discovering the number and condition of culverts

Culvert Inventory Collection Guideline

Culvert Inventory Collection
Culvert Data Collection Form
•Identification•Culvert Location•Design Data•Culvert Details
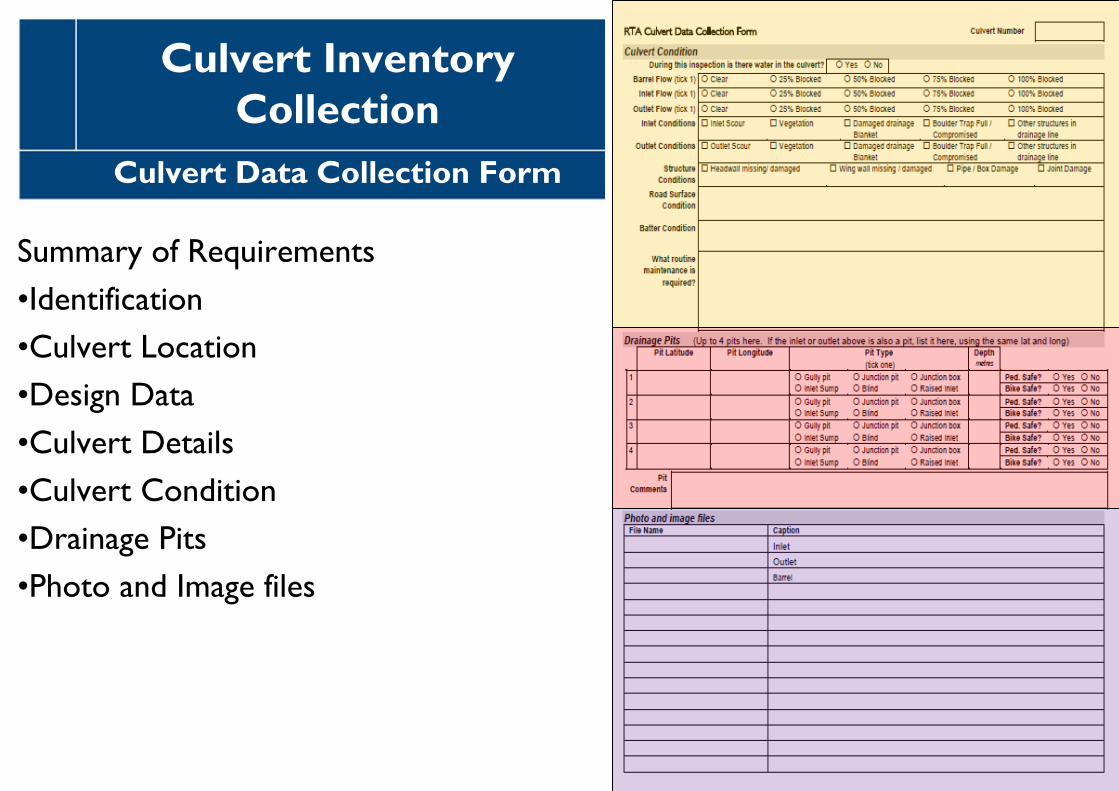
Summary of Requirements•Identification•Culvert Location•Design Data•Culvert Details•Culvert Condition•Drainage Pits•Photo and Image files
Culvert Inventory Collection
Culvert Data Collection Form
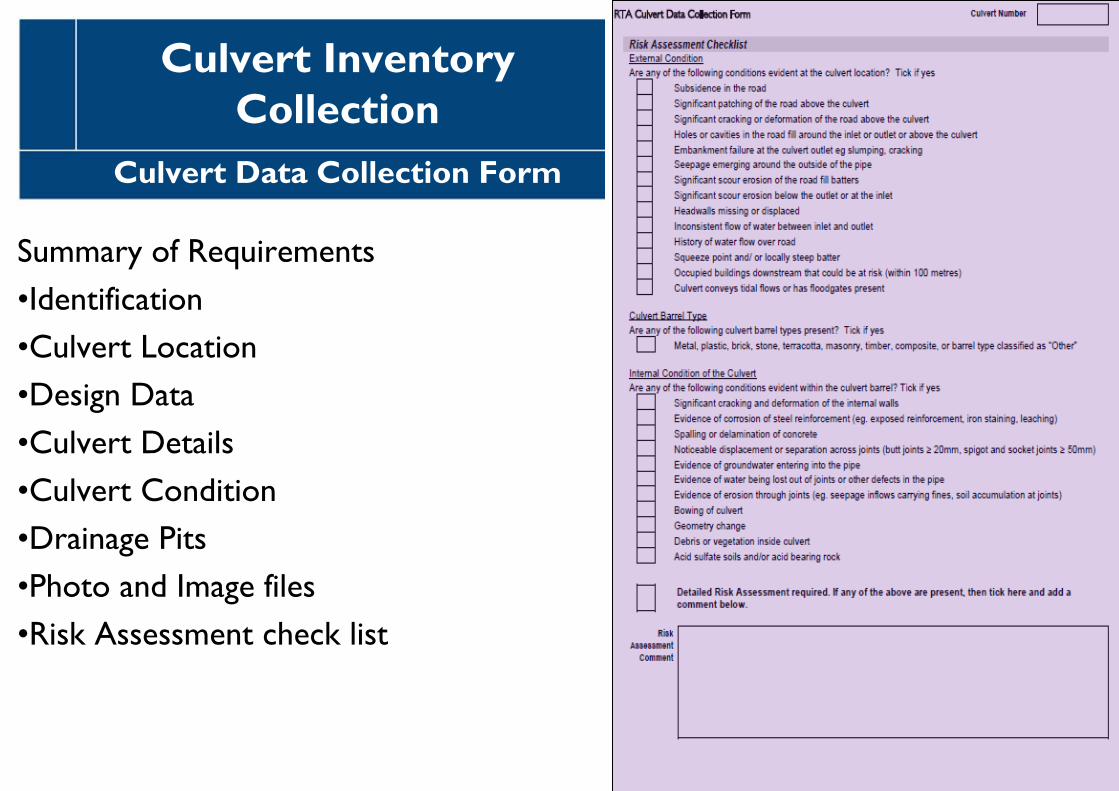
Summary of Requirements•Identification•Culvert Location•Design Data•Culvert Details•Culvert Condition•Drainage Pits•Photo and Image files•Risk Assessment check list
Culvert Inventory Collection
Culvert Data Collection Form
AC
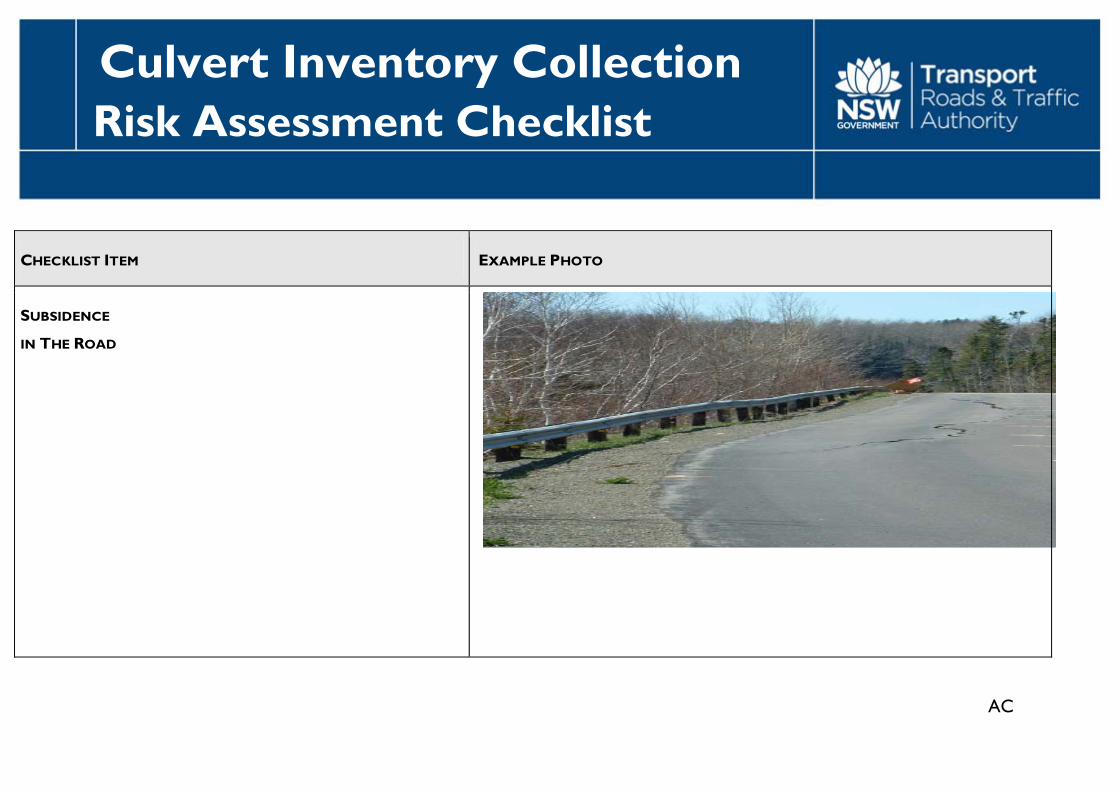
Risk Assessment Checklist
CHECKLIST ITEM EXAMPLE PHOTO
SUBSIDENCE
IN THE ROAD
Culvert Inventory Collection
AC
Risk Assessment Checklist
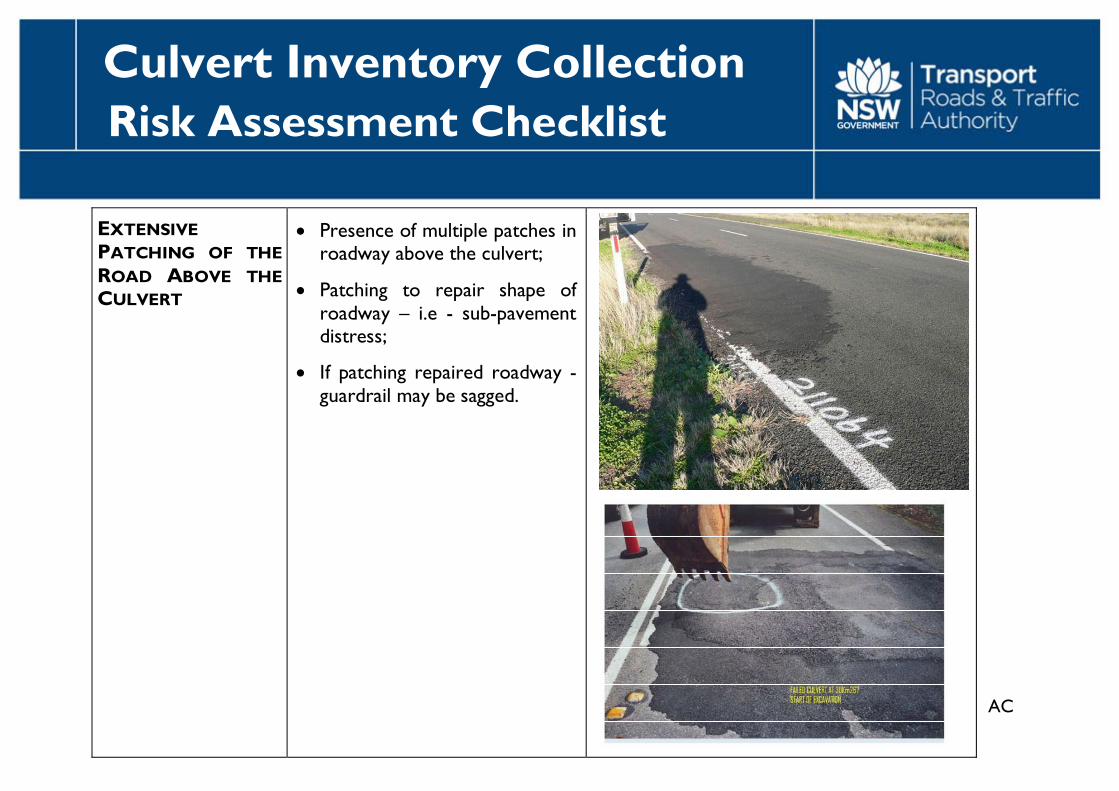
EXTENSIVE PATCHING OF THE ROAD ABOVE THE CULVERT
Presence of multiple patches in roadway above the culvert;
Patching to repair shape of roadway – i.e - sub-pavement distress;
If patching repaired roadway - guardrail may be sagged.
Culvert Inventory Collection
AC
Risk Assessment Checklist
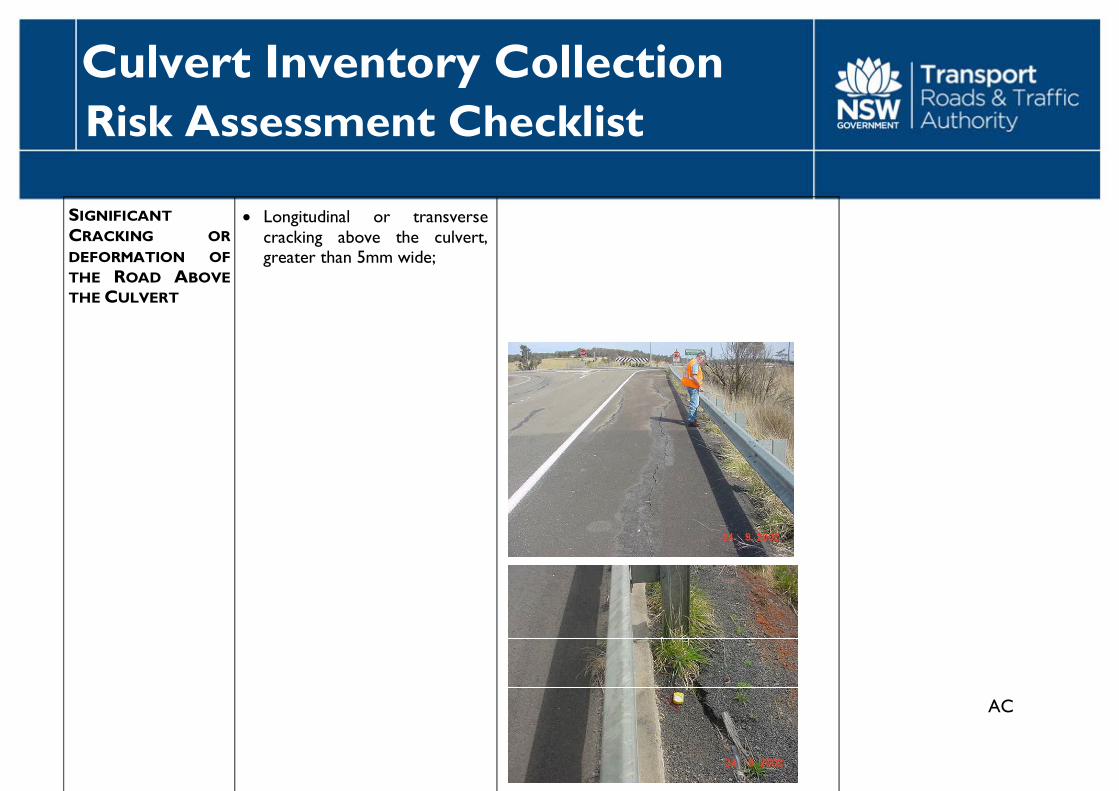
SIGNIFICANT CRACKING OR DEFORMATION OF THE ROAD ABOVE THE CULVERT
Longitudinal or transverse cracking above the culvert, greater than 5mm wide;
Culvert Inventory Collection
AC
Risk Assessment Checklist
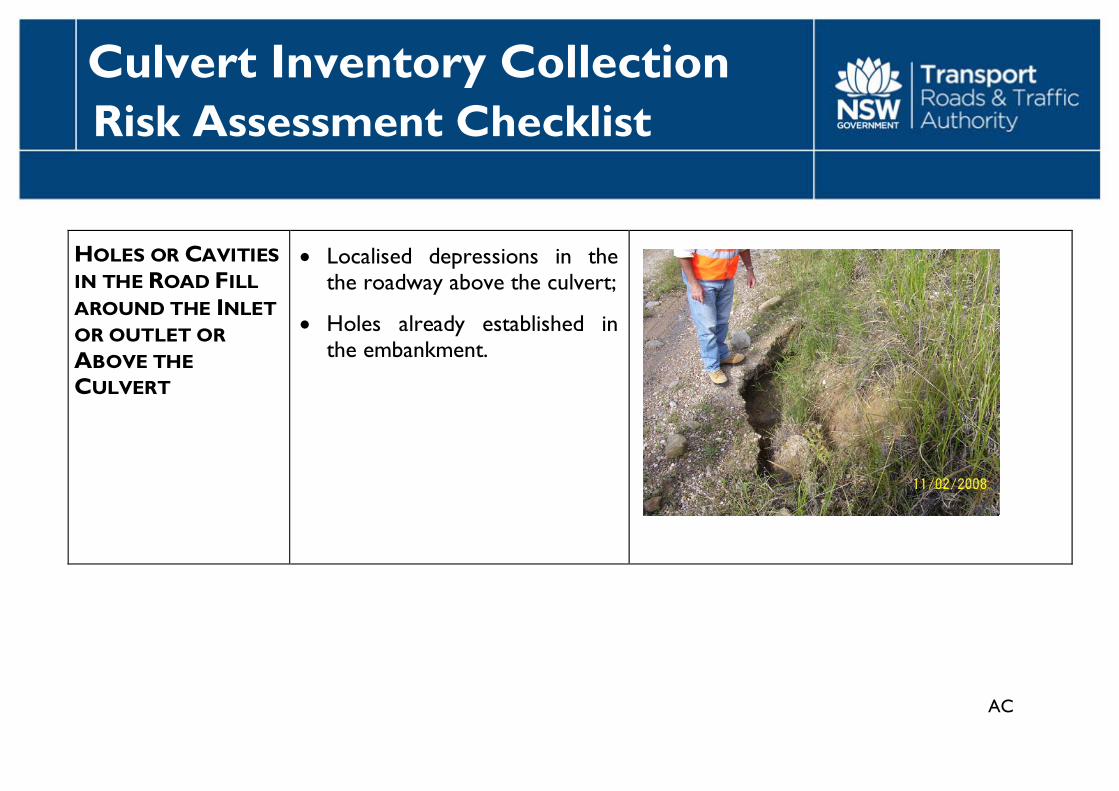
HOLES OR CAVITIES IN THE ROAD FILL AROUND THE INLET OR OUTLET OR ABOVE THE CULVERT
Localised depressions in the the roadway above the culvert;
Holes already established in the embankment.
Culvert Inventory Collection
AC
Risk Assessment Checklist
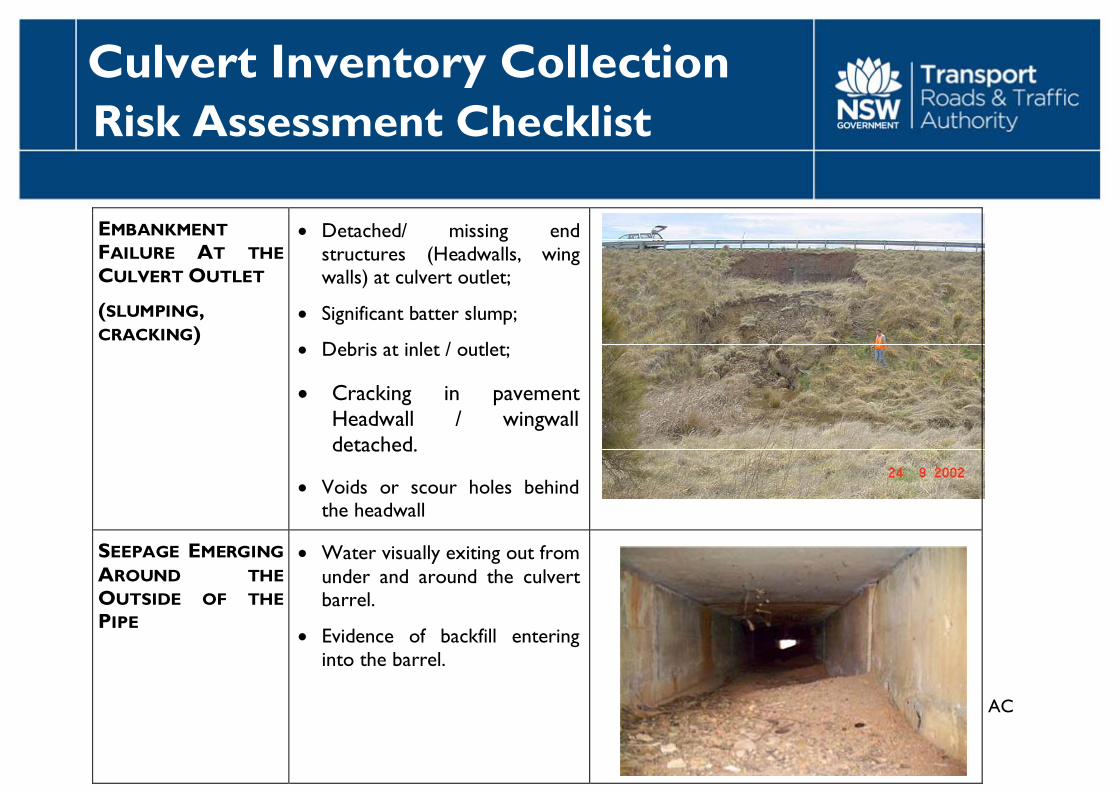
EMBANKMENT FAILURE AT THE CULVERT OUTLET
(SLUMPING, CRACKING)
Detached/ missing end structures (Headwalls, wing walls) at culvert outlet;
Significant batter slump;
Debris at inlet / outlet;
Cracking in pavement Headwall / wingwall detached.
Voids or scour holes behind the headwall
SEEPAGE EMERGING AROUND THE OUTSIDE OF THE PIPE
Water visually exiting out from under and around the culvert barrel.
Evidence of backfill entering into the barrel.
Culvert Inventory Collection
AC
Risk Assessment Checklist
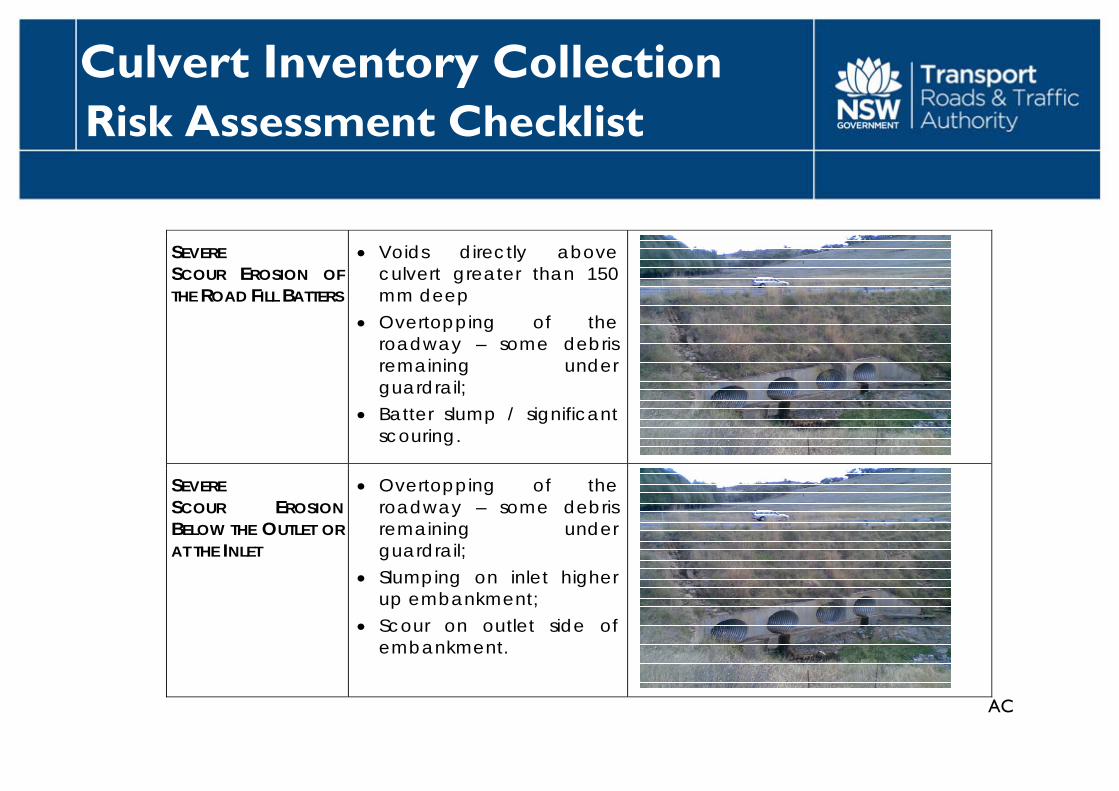
SEVERE SCOUR EROSION OF THE ROAD FILL BATTERS
Voids directly above culvert greater than 150 mm deep
Overtopping of the roadway – some debris remaining under guardrail;
Batter slump / significant scouring.
SEVERE SCOUR EROSION BELOW THE OUTLET OR AT THE INLET
Overtopping of the roadway – some debris remaining under guardrail;
Slumping on inlet higher up embankment;
Scour on outlet side of embankment.
Culvert Inventory Collection
AC
Risk Assessment Checklist
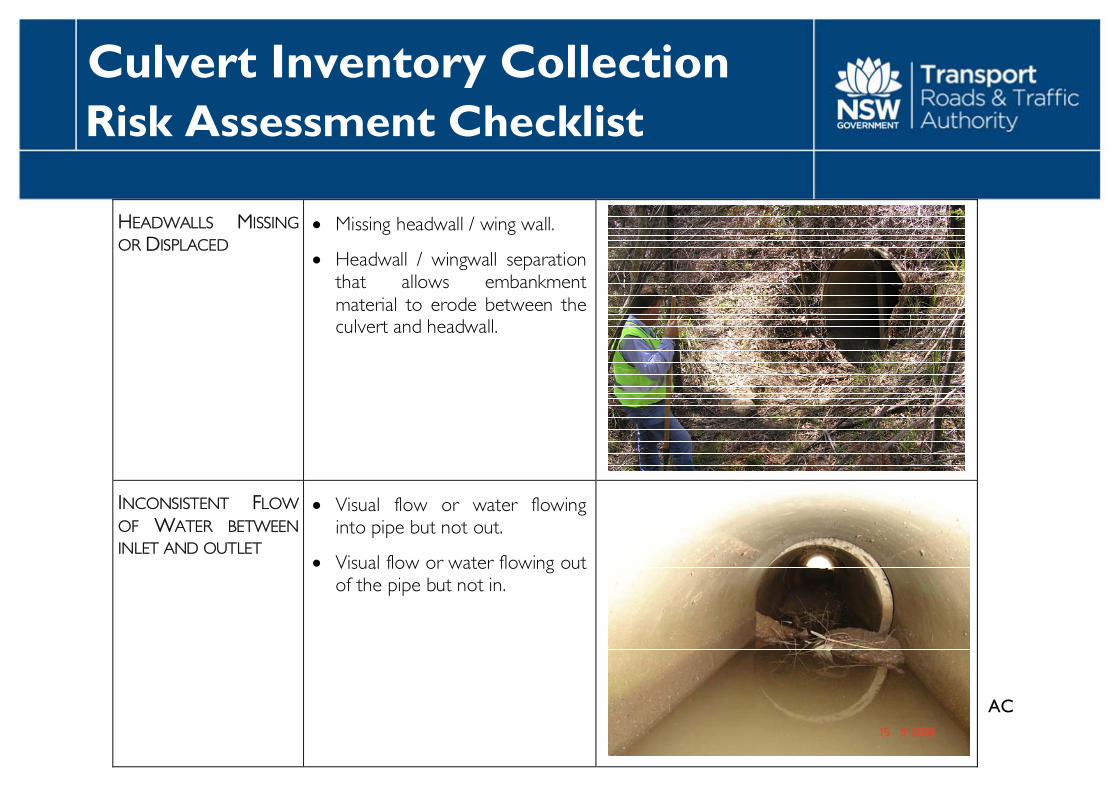
HEADWALLS MISSING OR DISPLACED
Missing headwall / wing wall.
Headwall / wingwall separation that allows embankment material to erode between the culvert and headwall.
INCONSISTENT FLOW OF WATER BETWEEN INLET AND OUTLET
Visual flow or water flowing into pipe but not out.
Visual flow or water flowing out of the pipe but not in.
Culvert Inventory Collection

AC
Risk Assessment Checklist
SQUEEZE POINT AND/OR LOCALLY STEEP BATTER
Noticeable hinge points in embankment due to road widening but not culvert lengthening;
Batter slope steeper than 1:1.
Culvert Inventory Collection
AC
Risk Assessment Checklist
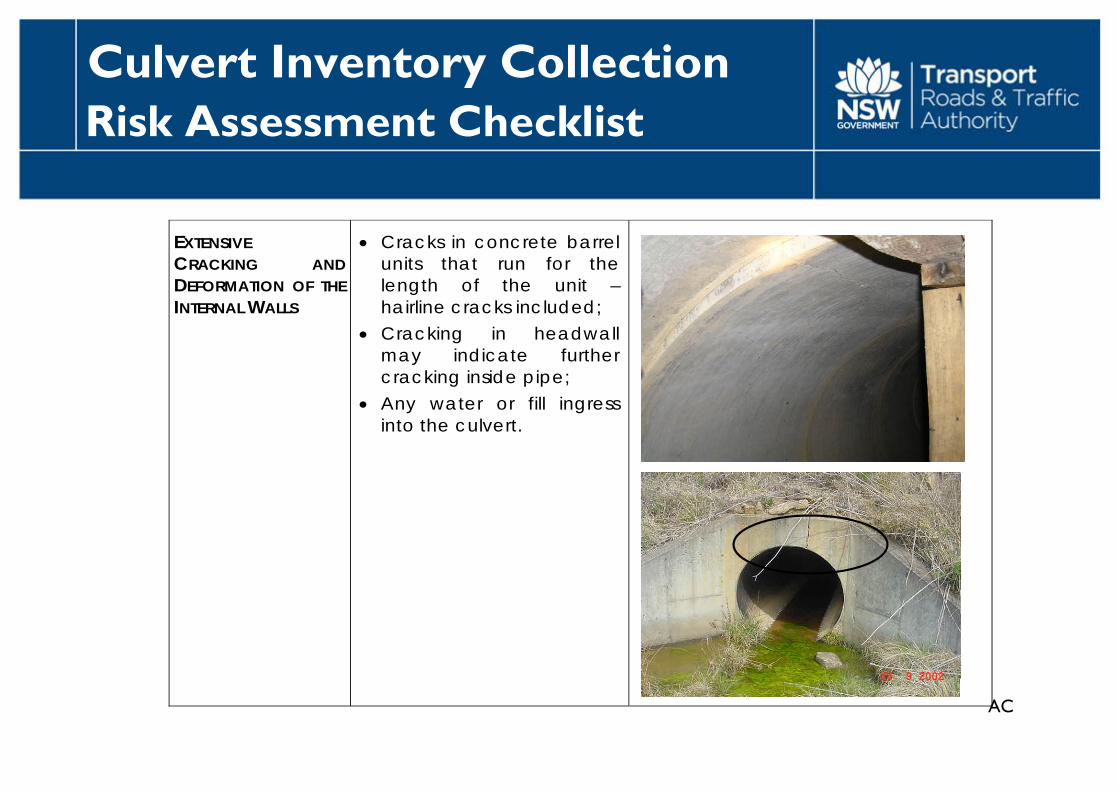
EXTENSIVE CRACKING AND DEFORMATION OF THE INTERNAL WALLS
Cracks in concrete barrel units that run for the length of the unit – hairline cracks included;
Cracking in headwall may indicate further cracking inside pipe;
Any water or fill ingress into the culvert.
Culvert Inventory Collection
AC
Risk Assessment Checklist
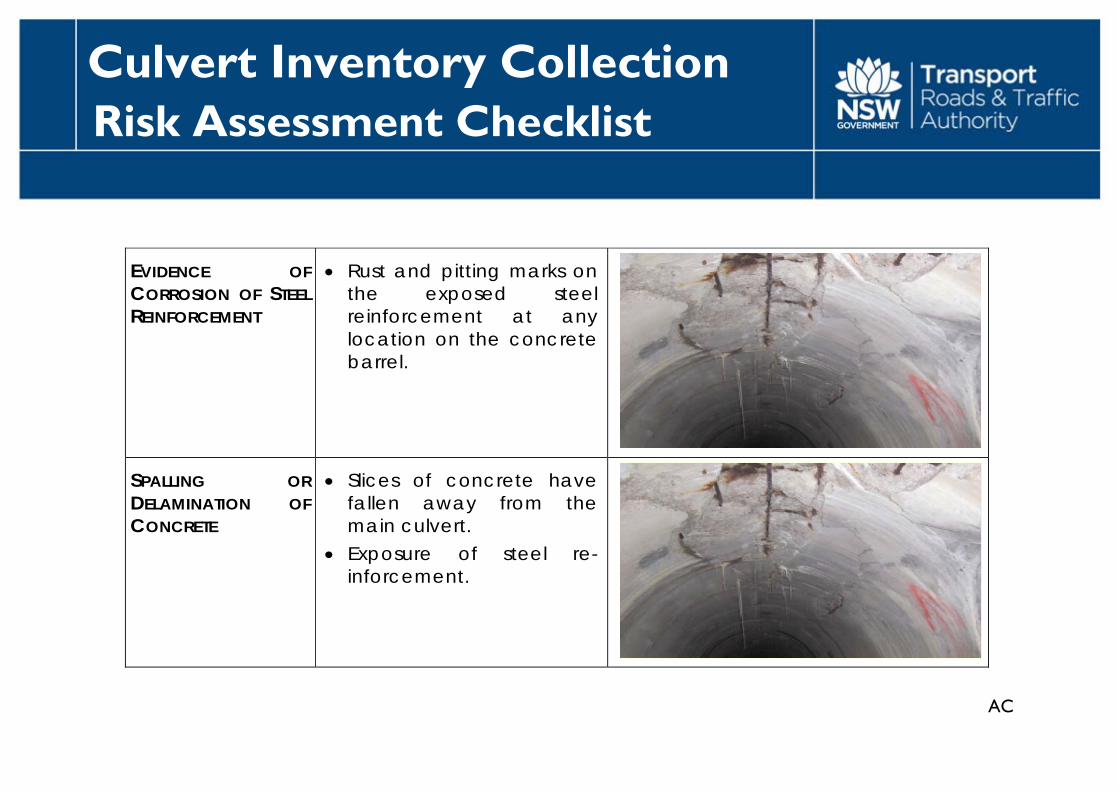
EVIDENCE OF CORROSION OF STEEL REINFORCEMENT
Rust and pitting marks on the exposed steel reinforcement at any location on the concrete barrel.
SPALLING OR DELAMINATION OF CONCRETE
Slices of concrete have fallen away from the main culvert.
Exposure of steel re-inforcement.
Culvert Inventory Collection

AC
Risk Assessment Checklist
NOTICEABLE DISPLACEMENT OR SEPARATION ACROSS JOINTS
Evidence of water or embankment entering the pipe through cracks or through joints.
Visible vertical displacement in butt joints.
EVIDENCE OF GROUNDWATER ENTERING INTO THE PIPE
Deposits of soil backfill in the culvert invert that has entered through cracks (i.e. not debris that has flowed through the pipe).
Water flowing out of pipe not flowing into inlet.
Water coming through the culvert joints.
Culvert Inventory Collection

AC
Risk Assessment Checklist
EVIDENCE OF EROSION THROUGH JOINTS
Deposits of soil in the culvert invert.
Scour holes and voids around the culvert barrel.
Depressions and sags on the roadway above the culvert.
Seepage inflows carrying fines, soil accumulation at joints).
BOWING OF CULVERT Ponding of water in the centre of the culvert.
Visually the centre of the culvert appears lower than the outlet.
NOTE here the sideways diversion of the waterflow indicating a bending of the culvert base
Culvert Inventory Collection
AC
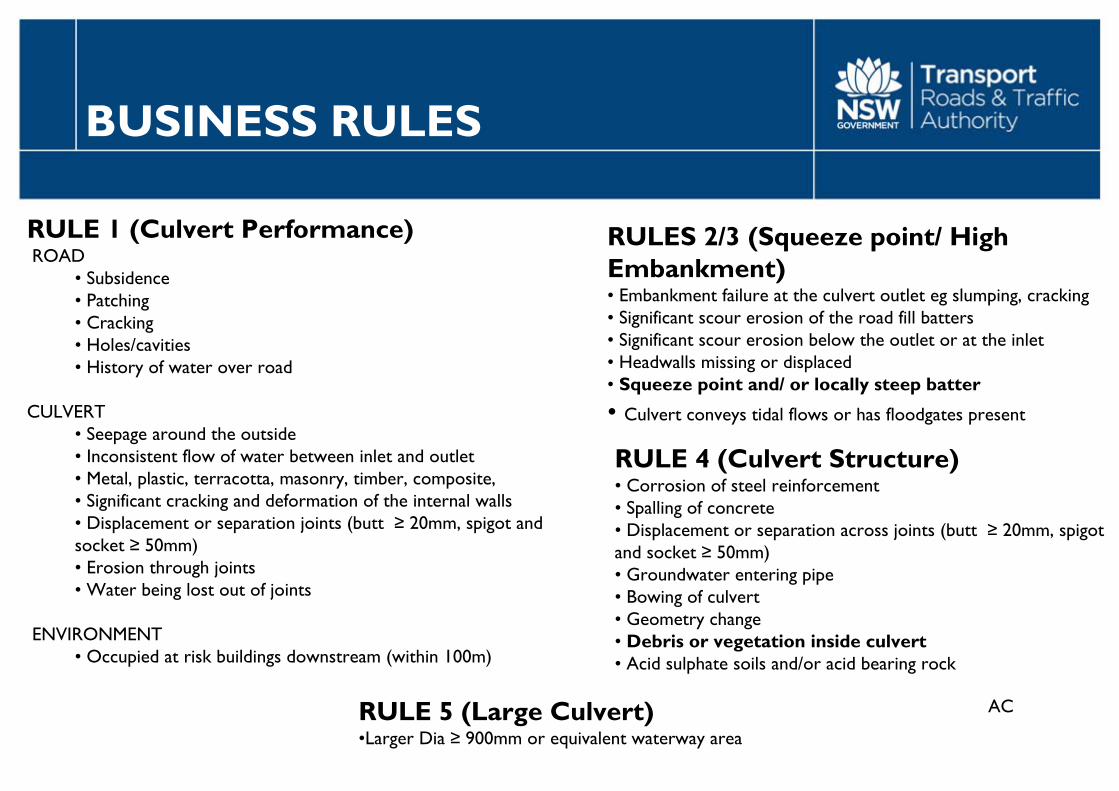
BUSINESS RULES
RULE 1 (Culvert Performance)ROAD
• Subsidence• Patching• Cracking • Holes/cavities • History of water over road
CULVERT• Seepage around the outside• Inconsistent flow of water between inlet and outlet• Metal, plastic, terracotta, masonry, timber, composite, • Significant cracking and deformation of the internal walls• Displacement or separation joints (butt ≥ 20mm, spigot and socket ≥ 50mm)• Erosion through joints • Water being lost out of joints
ENVIRONMENT• Occupied at risk buildings downstream (within 100m)
RULES 2/3 (Squeeze point/ High Embankment)• Embankment failure at the culvert outlet eg slumping, cracking• Significant scour erosion of the road fill batters• Significant scour erosion below the outlet or at the inlet• Headwalls missing or displaced• Squeeze point and/ or locally steep batter
• Culvert conveys tidal flows or has floodgates present
RULE 4 (Culvert Structure)• Corrosion of steel reinforcement • Spalling of concrete• Displacement or separation across joints (butt ≥ 20mm, spigot and socket ≥ 50mm)• Groundwater entering pipe• Bowing of culvert• Geometry change• Debris or vegetation inside culvert• Acid sulphate soils and/or acid bearing rock
RULE 5 (Large Culvert)•Larger Dia ≥ 900mm or equivalent waterway area
AC
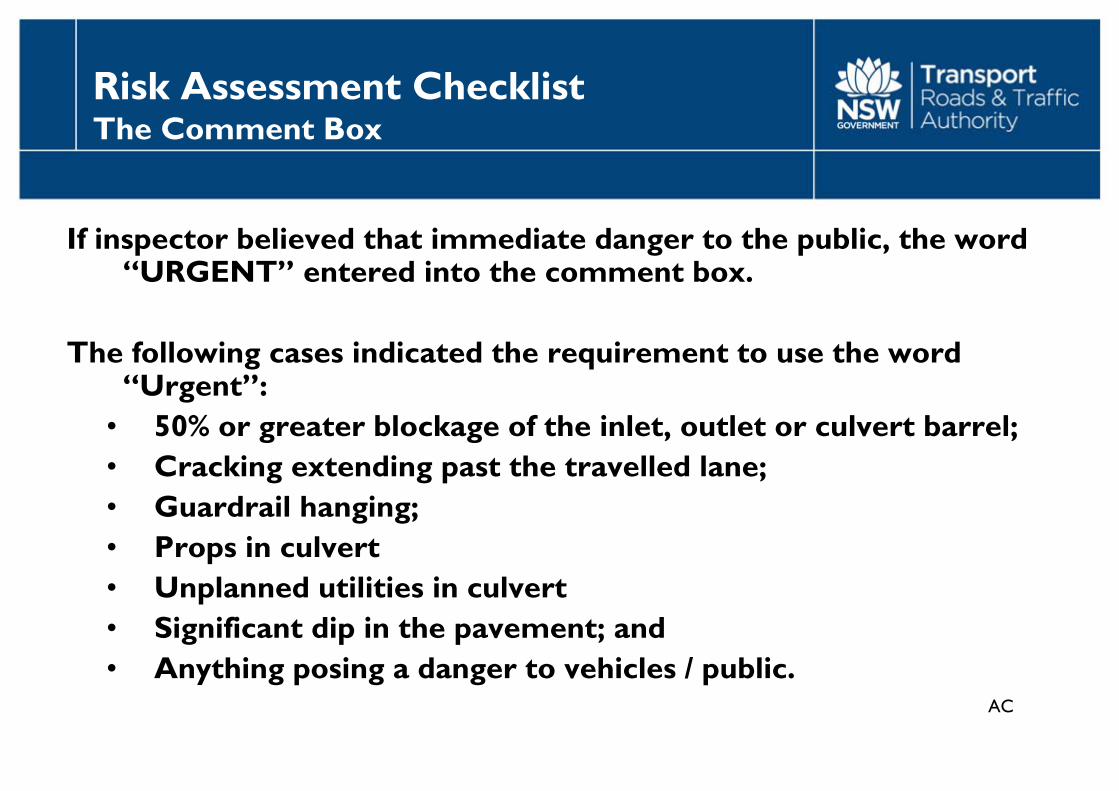
Risk Assessment Checklist The Comment Box
If inspector believed that immediate danger to the public, the word “URGENT” entered into the comment box.
The following cases indicated the requirement to use the word “Urgent”:
• 50% or greater blockage of the inlet, outlet or culvert barrel;• Cracking extending past the travelled lane;• Guardrail hanging;• Props in culvert• Unplanned utilities in culvert• Significant dip in the pavement; and• Anything posing a danger to vehicles / public.

GW
CULVERT RISK ASSESSMENT COURSE OUTLINE
•Culvert Management Framework•Culvert Inventory Collection
• Risk Assessment Identify Hazards Estimate likelihood of failure Estimate consequence of failure Derive Assessed Risk Level (ARL)
• Risk Assessment Application
GW
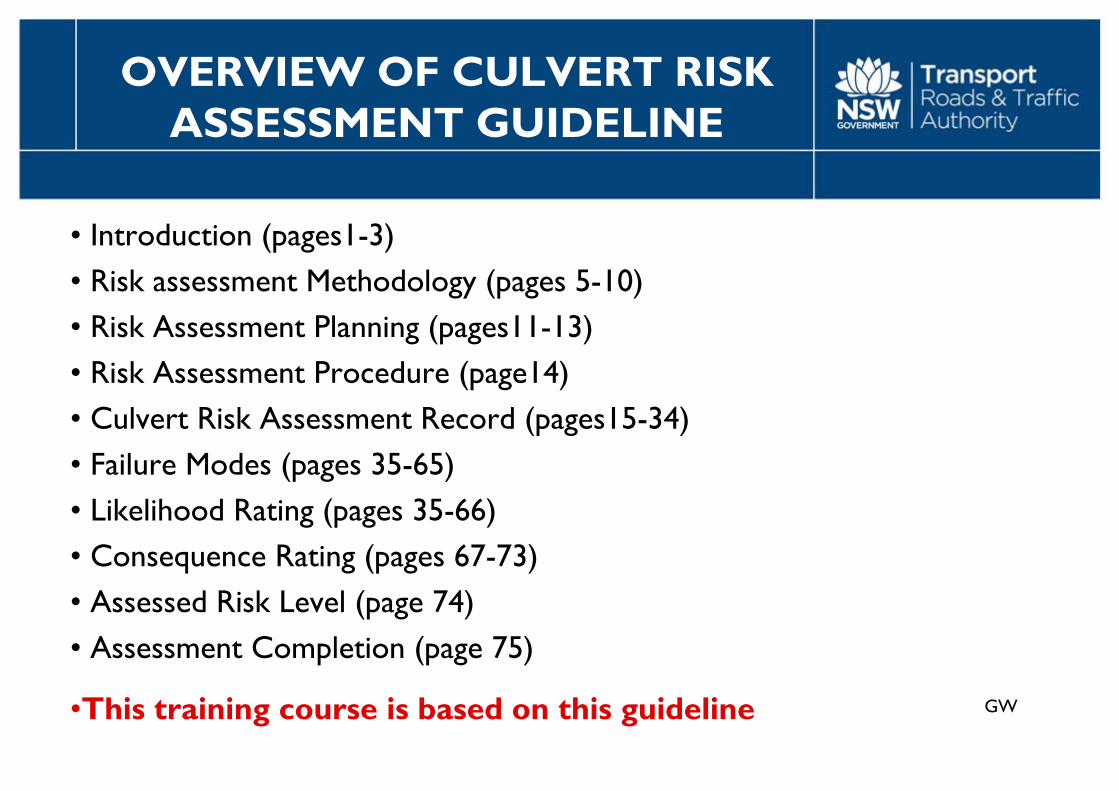
OVERVIEW OF CULVERT RISK ASSESSMENT GUIDELINE
• Introduction (pages1-3)• Risk assessment Methodology (pages 5-10)• Risk Assessment Planning (pages11-13)• Risk Assessment Procedure (page14)• Culvert Risk Assessment Record (pages15-34)• Failure Modes (pages 35-65)• Likelihood Rating (pages 35-66)• Consequence Rating (pages 67-73)• Assessed Risk Level (page 74)• Assessment Completion (page 75)
•This training course is based on this guideline
AD
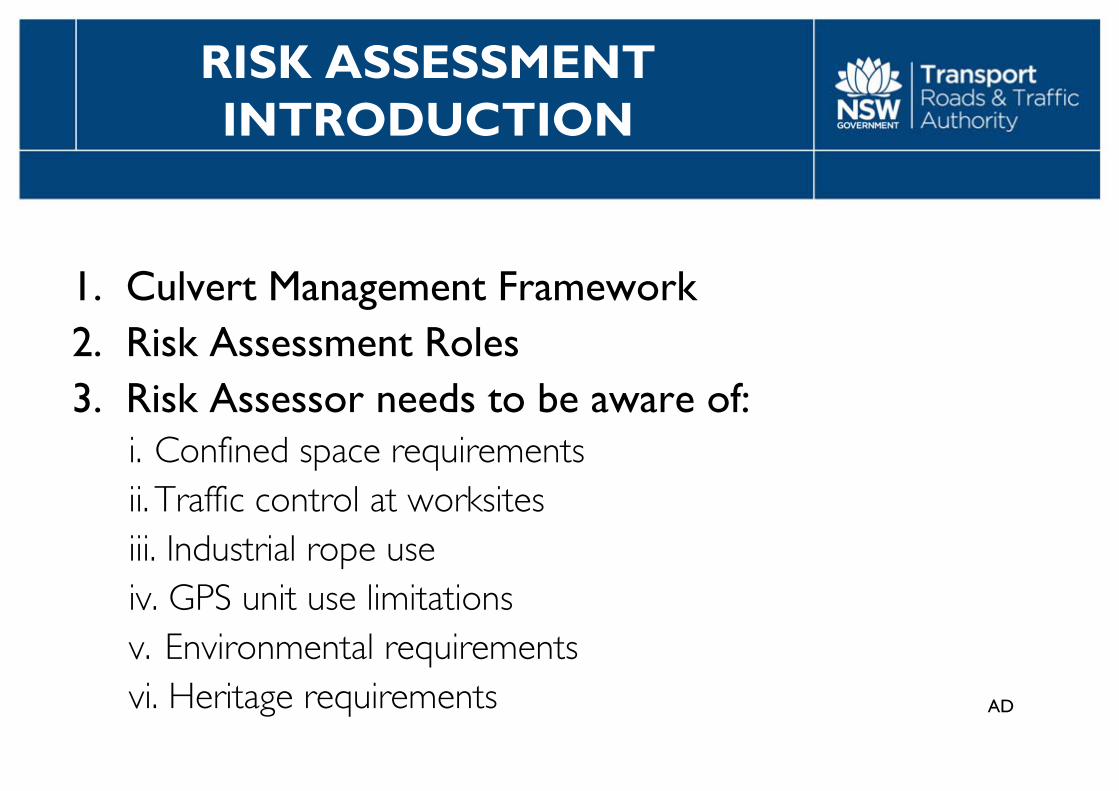
RISK ASSESSMENT INTRODUCTION
1. Culvert Management Framework2. Risk Assessment Roles3. Risk Assessor needs to be aware of:
i. Confined space requirementsii. Traffic control at worksitesiii. Industrial rope useiv. GPS unit use limitationsv. Environmental requirementsvi. Heritage requirements
GW
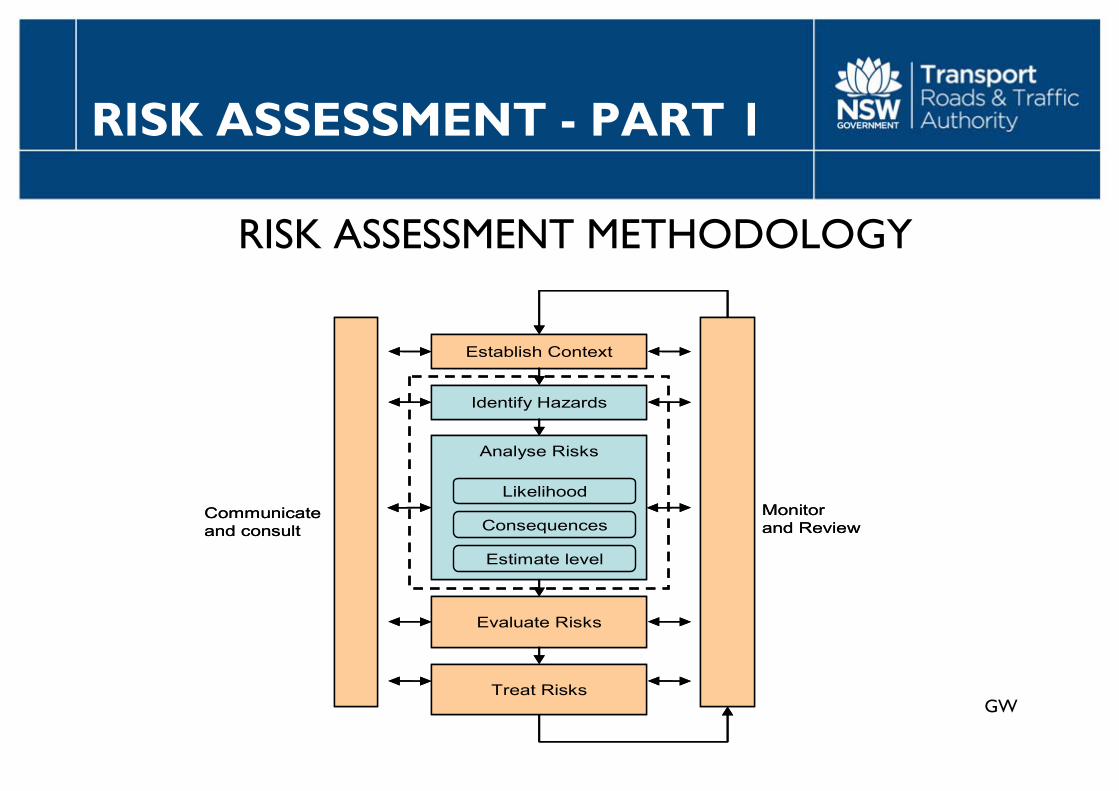
RISK ASSESSMENT - PART 1
RISK ASSESSMENT METHODOLOGY
Establish Context
Identify Hazards
Analyse Risks
Evaluate Risks
Treat Risks
Likelihood
Consequences
Estimate level
Communicateand consult
Monitorand Review
Establish Context
Identify Hazards
Analyse Risks
Evaluate Risks
Treat Risks
Likelihood
Consequences
Estimate level
Communicateand consult
Monitorand Review
GW
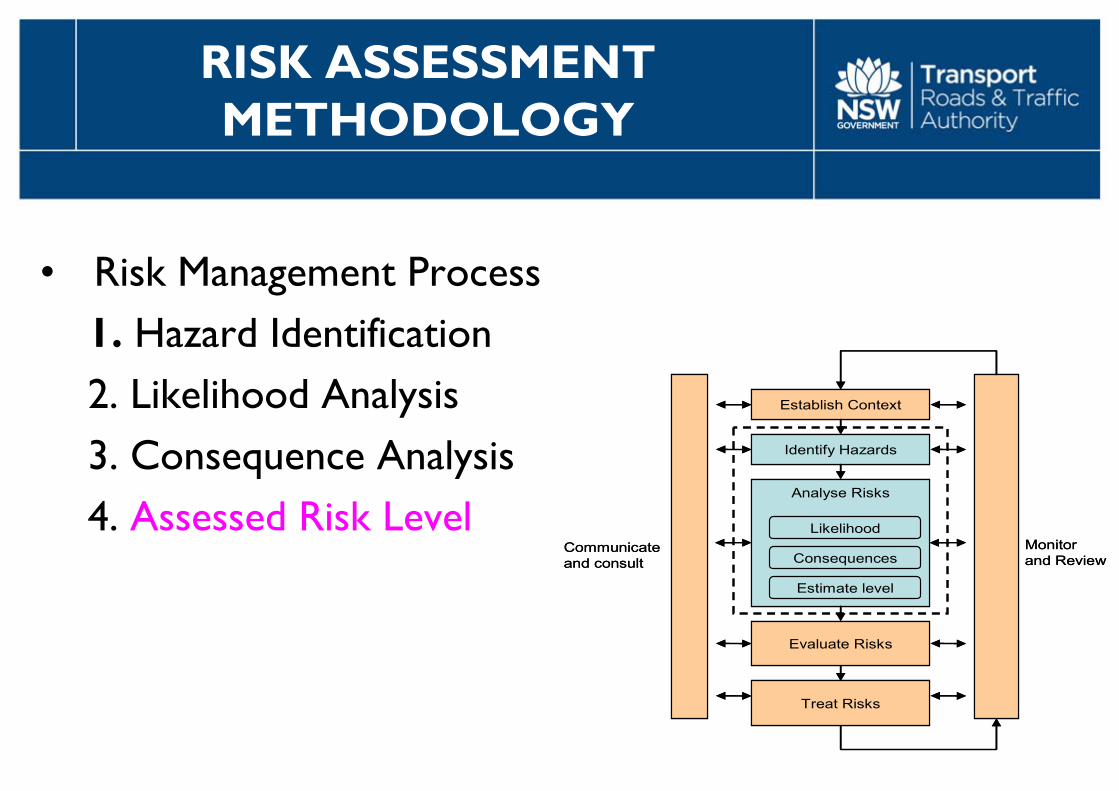
RISK ASSESSMENT METHODOLOGY
• Risk Management Process 1. Hazard Identification2. Likelihood Analysis3. Consequence Analysis4. Assessed Risk Level
Establish Context
Identify Hazards
Analyse Risks
Evaluate Risks
Treat Risks
Likelihood
Consequences
Estimate level
Communicateand consult
Monitorand Review
Establish Context
Identify Hazards
Analyse Risks
Evaluate Risks
Treat Risks
Likelihood
Consequences
Estimate level
Communicateand consult
Monitorand Review

GW
HAZARD IDENTIFICATION (pp35-65)
Kinds of Hazards – Ten possible kinds of culvert failure mechanisms have been defined under four broad modes
SC Structural Collapse SC-1 Structural collapse of the barrel
SI Slope InstabilitySI-1 Slope Instability Caused by AffluxSI-2 Slope Instability Caused by Leakage out of the BarrelSI-3 Slope Instability Caused by Headwall CollapseSI-4 Slope Instability Caused by Undermining at the Inlet or Outlet

GW
HAZARD IDENTIFICATION (pp35-65)
PI Piping PI-1 Piping into the CulvertPI-2 Piping on the Outside of Culvert due to AffluxPI-3 Piping on the Outside of Culvert due to Leakage out of the
HF Hydraulic FlowHF-1 Erosion by Overtopping FlowsHF-2 Cross-Catchment Flooding
GW
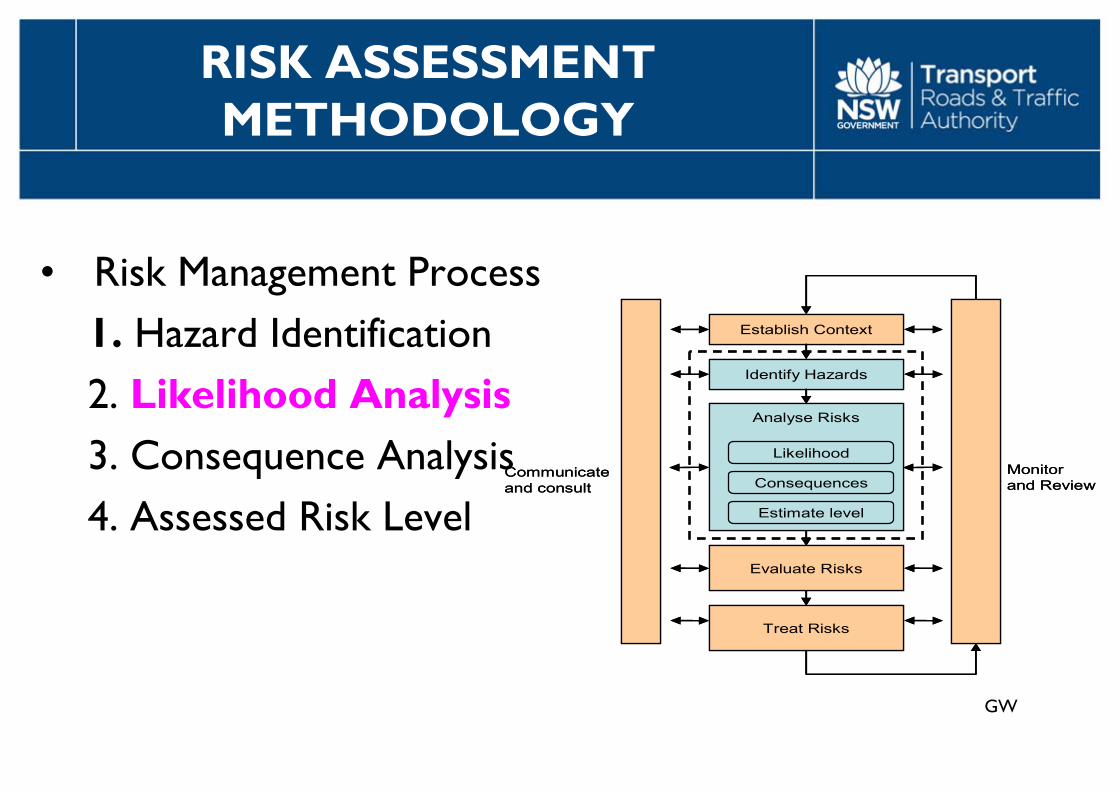
RISK ASSESSMENT METHODOLOGY
• Risk Management Process 1. Hazard Identification2. Likelihood Analysis3. Consequence Analysis4. Assessed Risk Level
Establish Context
Identify Hazards
Analyse Risks
Evaluate Risks
Treat Risks
Likelihood
Consequences
Estimate level
Communicateand consult
Monitorand Review
Establish Context
Identify Hazards
Analyse Risks
Evaluate Risks
Treat Risks
Likelihood
Consequences
Estimate level
Communicateand consult
Monitorand Review
GW
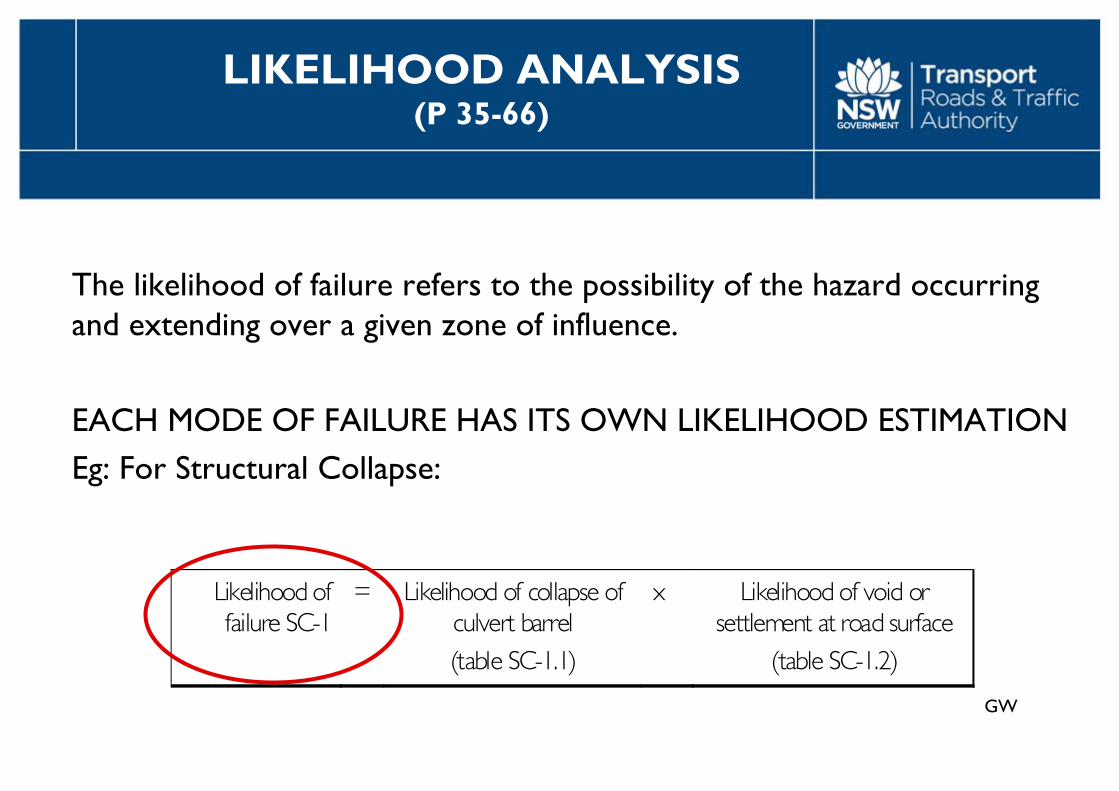
LIKELIHOOD ANALYSIS (P 35-66)
The likelihood of failure refers to the possibility of the hazard occurring and extending over a given zone of influence.
EACH MODE OF FAILURE HAS ITS OWN LIKELIHOOD ESTIMATION Eg: For Structural Collapse:
Likelihood of failure SC-1
= Likelihood of collapse of culvert barrel (table SC-1.1)
x Likelihood of void or settlement at road surface
(table SC-1.2)
AD
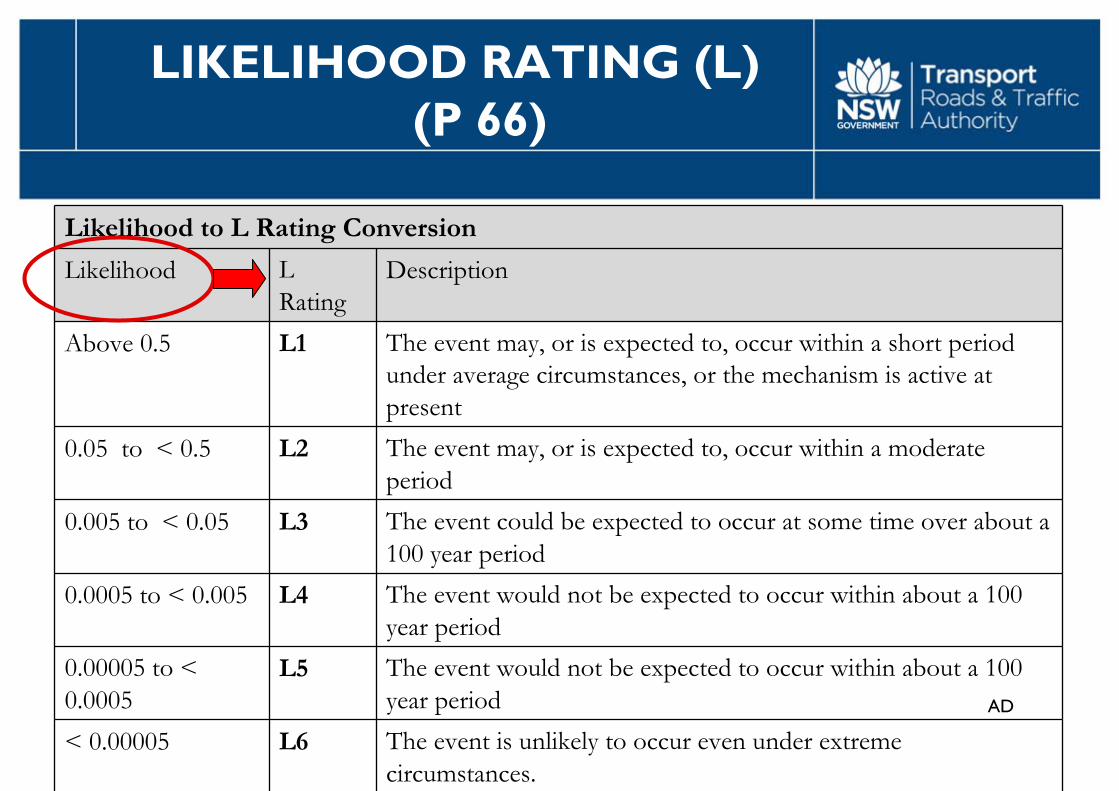
LIKELIHOOD RATING (L) (P 66)
Likelihood to L Rating Conversion
Likelihood L Rating
Description
Above 0.5 L1 The event may, or is expected to, occur within a short period under average circumstances, or the mechanism is active at present
0.05 to < 0.5 L2 The event may, or is expected to, occur within a moderate period
0.005 to < 0.05 L3 The event could be expected to occur at some time over about a 100 year period
0.0005 to < 0.005 L4 The event would not be expected to occur within about a 100 year period
0.00005 to < 0.0005
L5 The event would not be expected to occur within about a 100 year period
< 0.00005 L6 The event is unlikely to occur even under extreme circumstances.
AD
RISK ASSESSMENT METHODOLOGY
• Risk Management Process 1. Hazard Identification2. Likelihood Analysis3. Consequence Analysis4. Assessed Risk Level
Establish Context
Identify Hazards
Analyse Risks
Evaluate Risks
Treat Risks
Likelihood
Consequences
Estimate level
Communicateand consult
Monitorand Review
Establish Context
Identify Hazards
Analyse Risks
Evaluate Risks
Treat Risks
Likelihood
Consequences
Estimate level
Communicateand consult
Monitorand Review

GW
CONSEQUENCE ANALYSIS (P 67-73)
Purpose is to identify the effects of the hazards on the elements at risk
Elements at risk include:• Road users • Infrastructure (eg. railways);• Buildings (occupied and unoccupied) • Structures• Pedestrians • Services (eg. water supply, power poles); • Road and furnishings • Other property.• Vehicles
Potential consequences (effects):• Loss of life (C to be derived from temporal/vulnerability)• Damage to property and consequential effects (refer example)
• Road closure • Infrastructure or property damage and consequential costs • Repair costs
GW
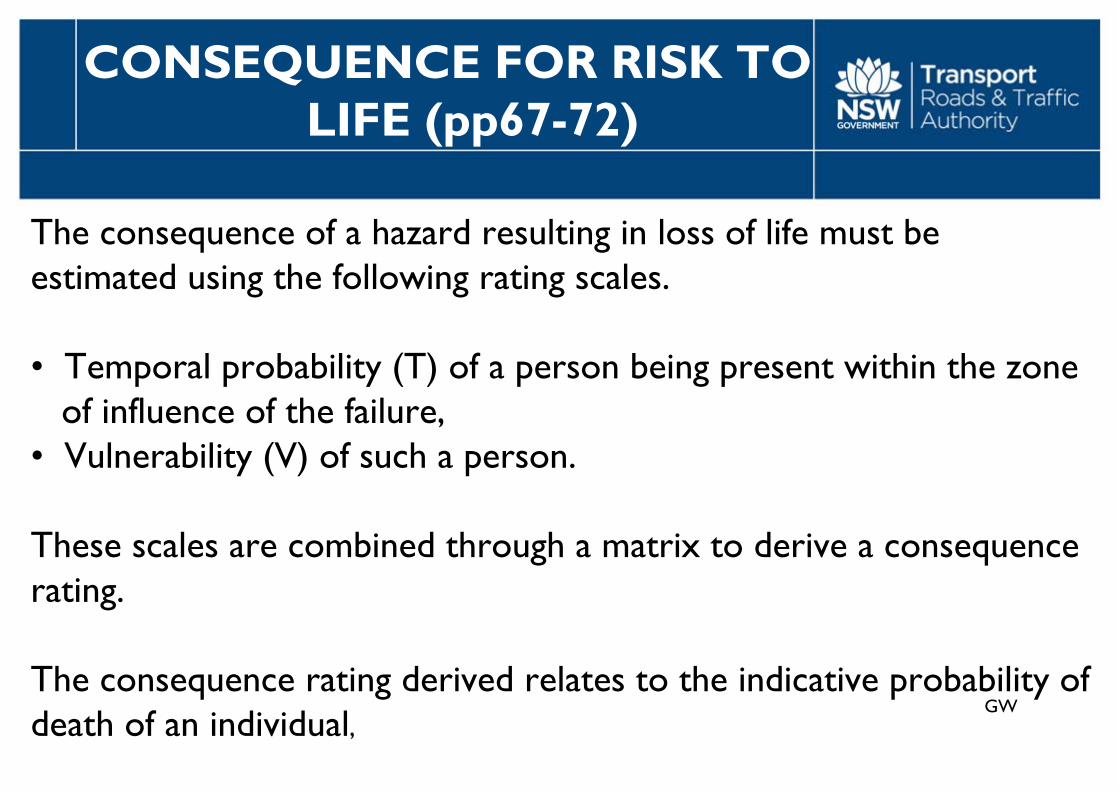
CONSEQUENCE FOR RISK TO LIFE (pp67-72)
The consequence of a hazard resulting in loss of life must be estimated using the following rating scales.
• Temporal probability (T) of a person being present within the zone of influence of the failure,
• Vulnerability (V) of such a person.
These scales are combined through a matrix to derive a consequence rating.
The consequence rating derived relates to the indicative probability of death of an individual,
GW
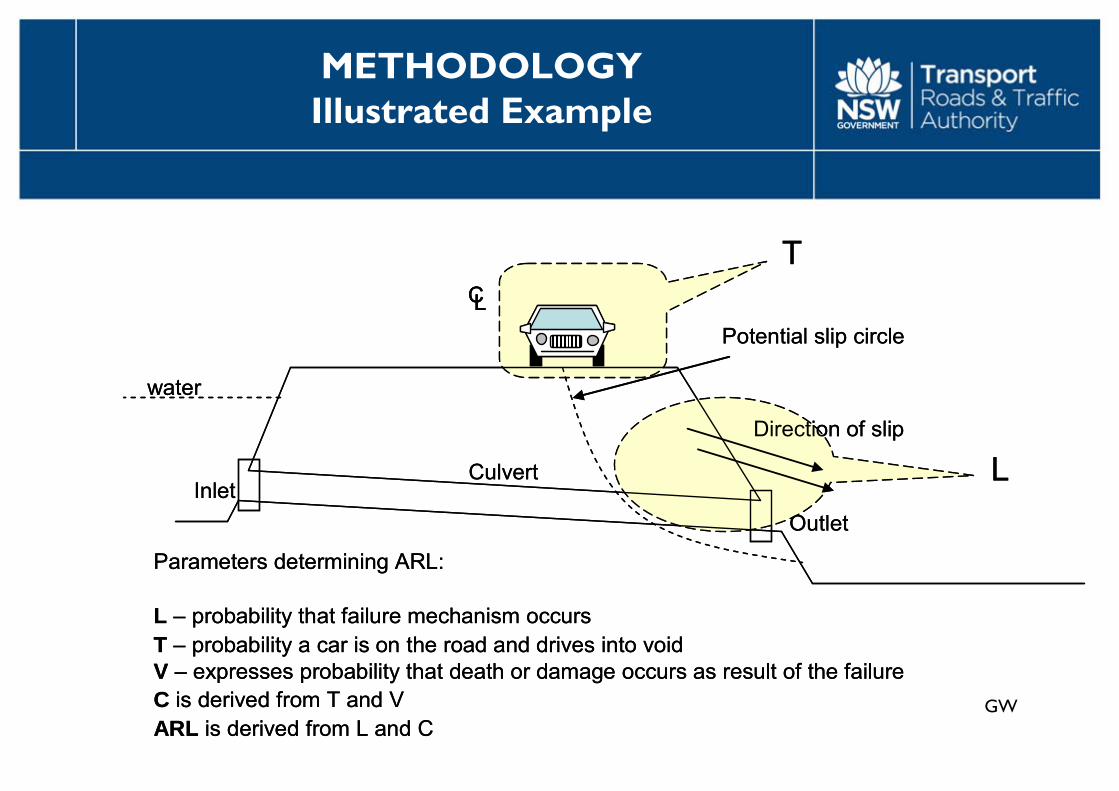
METHODOLOGY Illustrated Example
InletOutlet
Potential slip circle
Culvert
Direction of slip
water
CL
Parameters determining ARL:
L – probability that failure mechanism occursT – probability a car is on the road and drives into voidV – expresses probability that death or damage occurs as result of the failureC is derived from T and VARL is derived from L and C
T
LInlet
Outlet
Potential slip circle
Culvert
Direction of slip
water
CLCL
Parameters determining ARL:
L – probability that failure mechanism occursT – probability a car is on the road and drives into voidV – expresses probability that death or damage occurs as result of the failureC is derived from T and VARL is derived from L and C
T
L
GW
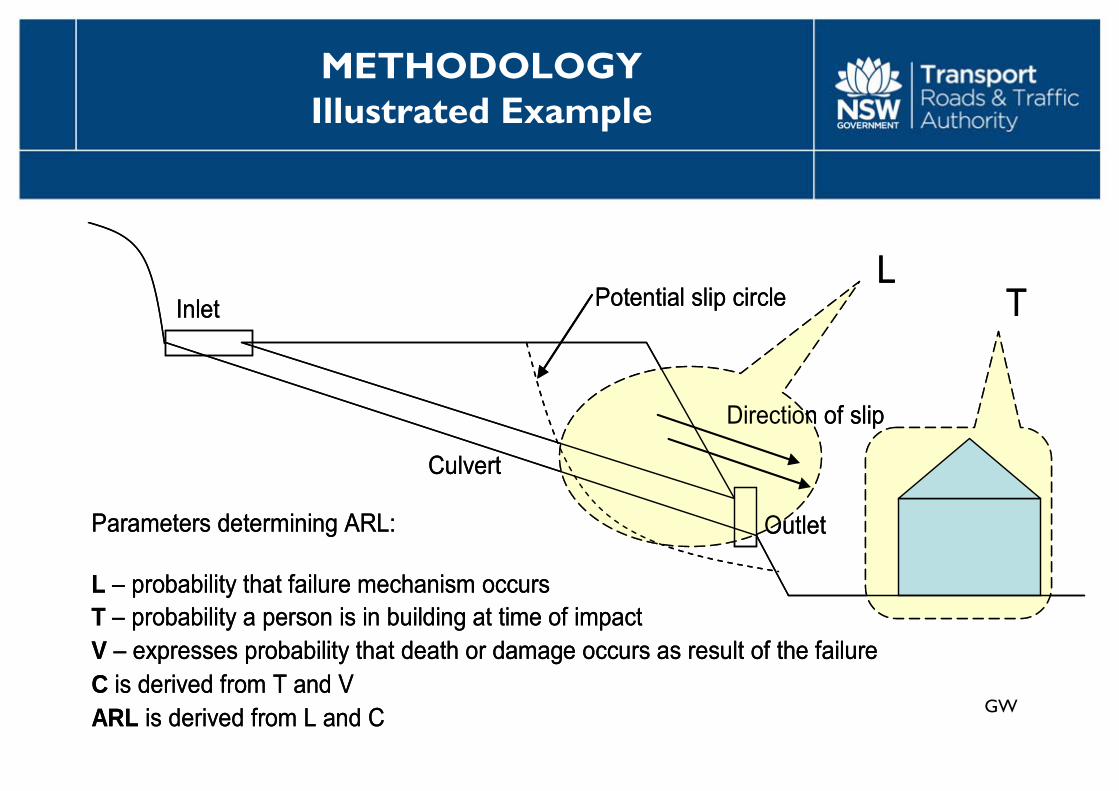
METHODOLOGY Illustrated Example
Inlet
Outlet
Potential slip circle
Culvert
Direction of slip
Parameters determining ARL:
L – probability that failure mechanism occursT – probability a person is in building at time of impactV – expresses probability that death or damage occurs as result of the failureC is derived from T and VARL is derived from L and C
LTInlet
Outlet
Potential slip circle
Culvert
Direction of slip
Parameters determining ARL:
L – probability that failure mechanism occursT – probability a person is in building at time of impactV – expresses probability that death or damage occurs as result of the failureC is derived from T and VARL is derived from L and C
LT
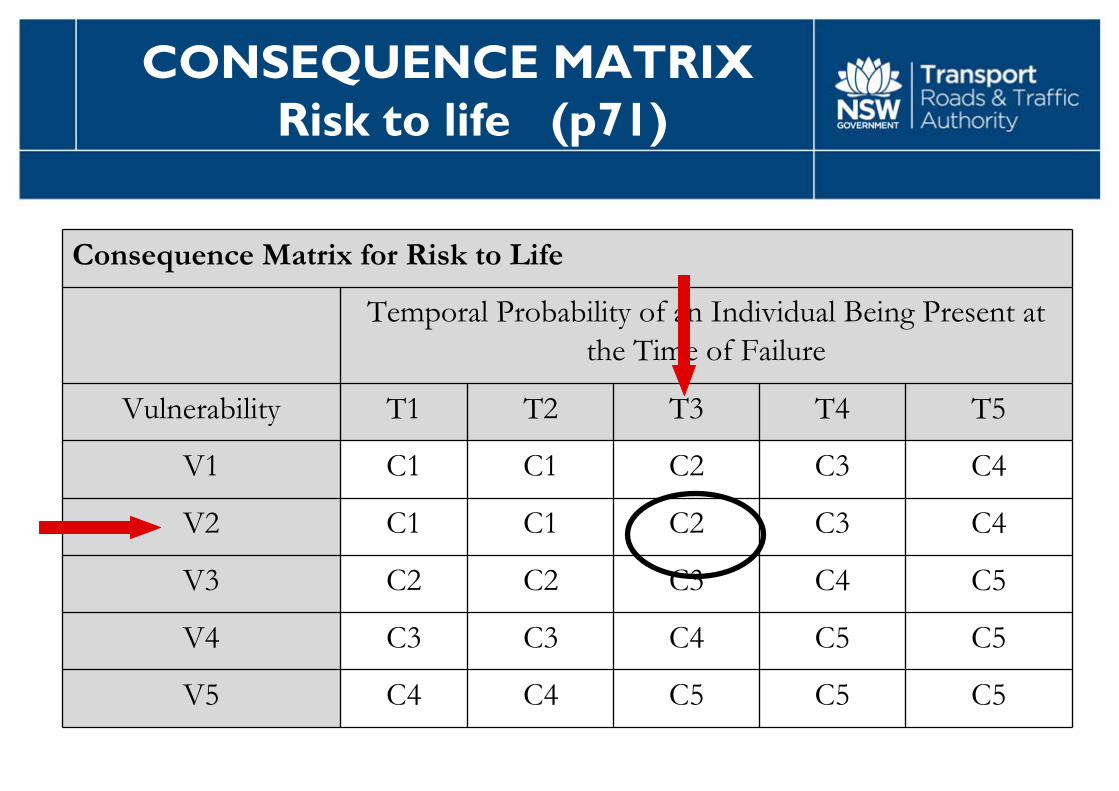
CONSEQUENCE MATRIX Risk to life (p71)
Consequence Matrix for Risk to Life
Temporal Probability of an Individual Being Present at the Time of Failure
Vulnerability T1 T2 T3 T4 T5
V1 C1 C1 C2 C3 C4
V2 C1 C1 C2 C3 C4
V3 C2 C2 C3 C4 C5
V4 C3 C3 C4 C5 C5
V5 C4 C4 C5 C5 C5
GW
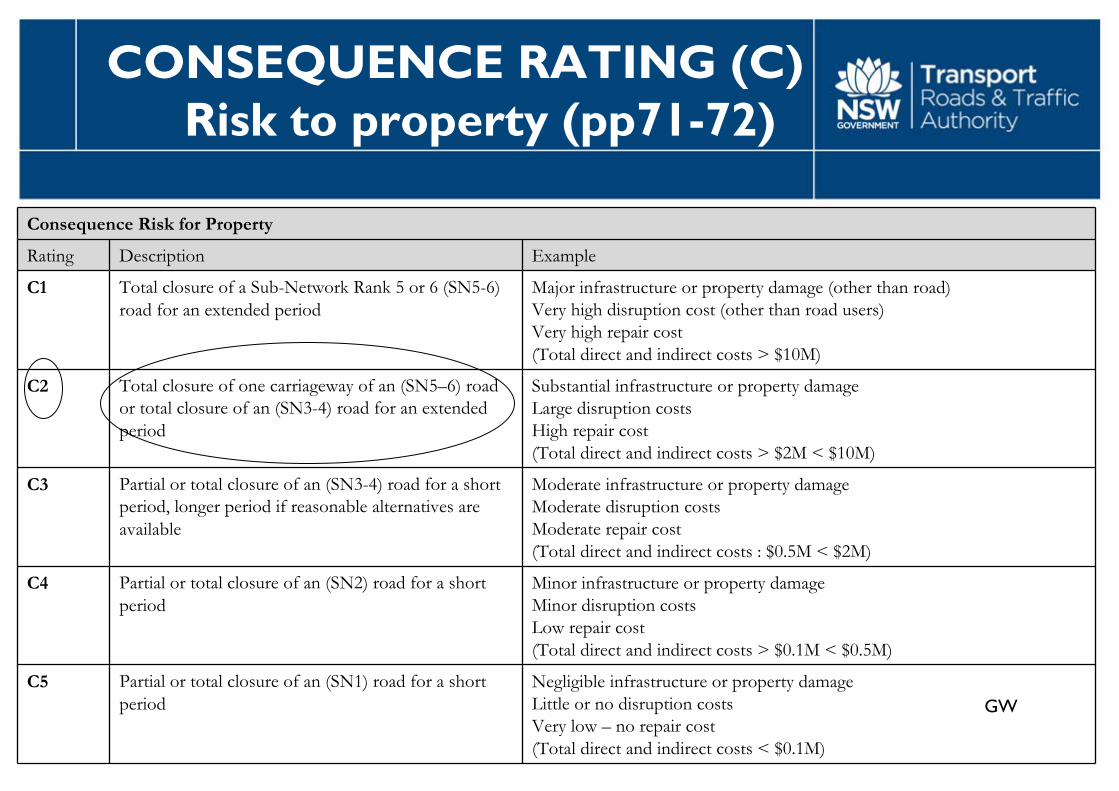
CONSEQUENCE RATING (C) Risk to property (pp71-72)
Consequence Risk for Property
Rating Description Example
C1 Total closure of a Sub-Network Rank 5 or 6 (SN5-6) road for an extended period
Major infrastructure or property damage (other than road)Very high disruption cost (other than road users)Very high repair cost(Total direct and indirect costs > $10M)
C2 Total closure of one carriageway of an (SN5–6) road or total closure of an (SN3-4) road for an extended period
Substantial infrastructure or property damageLarge disruption costsHigh repair cost(Total direct and indirect costs > $2M < $10M)
C3 Partial or total closure of an (SN3-4) road for a short period, longer period if reasonable alternatives are available
Moderate infrastructure or property damageModerate disruption costsModerate repair cost(Total direct and indirect costs : $0.5M < $2M)
C4 Partial or total closure of an (SN2) road for a short period
Minor infrastructure or property damageMinor disruption costsLow repair cost(Total direct and indirect costs > $0.1M < $0.5M)
C5 Partial or total closure of an (SN1) road for a short period
Negligible infrastructure or property damageLittle or no disruption costsVery low – no repair cost(Total direct and indirect costs < $0.1M)
AD
RISK ASSESSMENT METHODOLOGY
• Risk Management Process 1. Hazard Identification2. Likelihood Analysis3. Consequence Analysis4. Assessed Risk Level
Establish Context
Identify Hazards
Analyse Risks
Evaluate Risks
Treat Risks
Likelihood
Consequences
Estimate level
Communicateand consult
Monitorand Review
Establish Context
Identify Hazards
Analyse Risks
Evaluate Risks
Treat Risks
Likelihood
Consequences
Estimate level
Communicateand consult
Monitorand Review

AD
Assessed Risk Level Matrix
Consequence Class
Likelihood C1 C2 C3 C4 C5
L1 ARL1 ARL1 ARL1 ARL2 ARL3
L2 ARL1 ARL1 ARL2 ARL3 ARL4
L3 ARL1 ARL2 ARL3 ARL4 ARL5
L4 ARL2 ARL3 ARL4 ARL5 ARL5
L5 ARL3 ARL4 ARL5 ARL5 ARL5
L6 ARL4 ARL5 ARL5 ARL5 ARL5
ASSESSED RISK LEVEL (ARL) (p74)

GW
RISK ASSESSMENT - PART 2 (Risk Analysis)
• Assessment of each hazards and estimating likelihood• Vulnerability and temporal probability estimates• Consequence Ratings• Deriving Assessed Risk Level• Next steps in risk management
GW
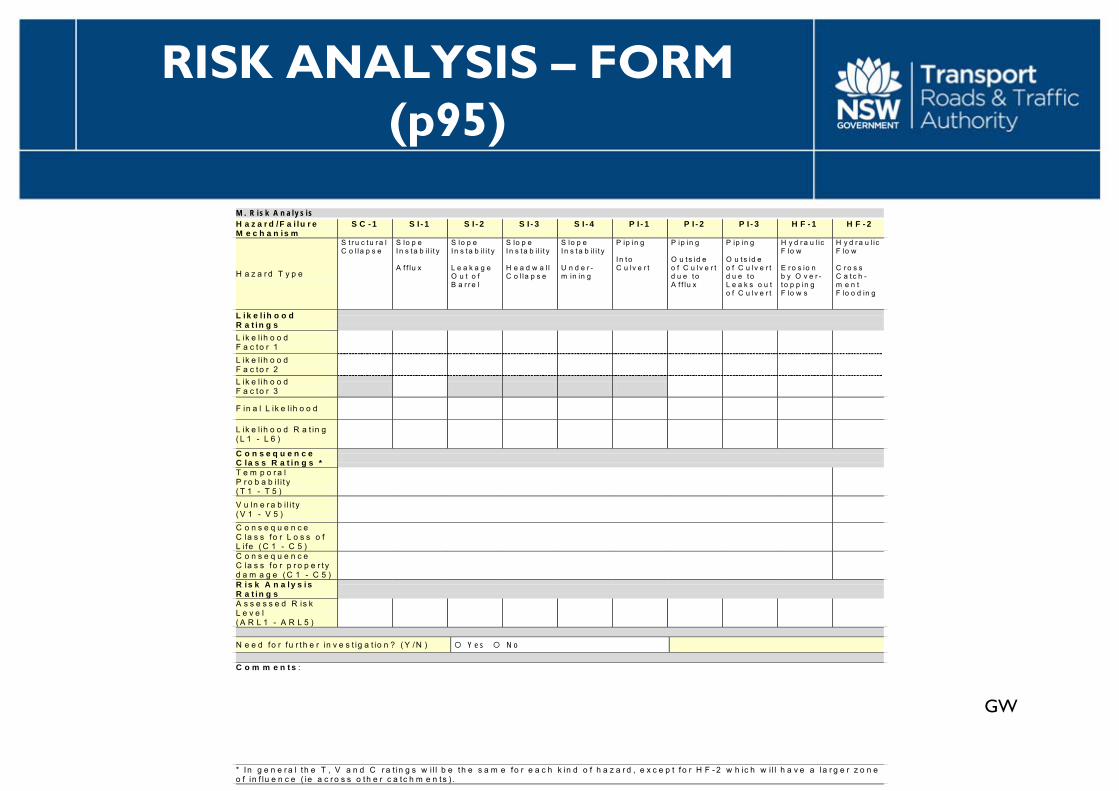
RISK ANALYSIS – FORM (p95)
M . R is k A n a l y s is H a z a r d /F a i lu r e M e c h a n is m
S C - 1 S I - 1 S I - 2 S I - 3 S I - 4 P I - 1 P I - 2 P I - 3 H F - 1 H F - 2
H a z a r d T y p e
S t r u c tu r a l C o l la p s e
S lo p e I n s ta b i l i t y A f f lu x
S lo p e I n s ta b i l i t y L e a k a g e O u t o f B a r r e l
S lo p e I n s ta b i l i t y H e a d w a l l C o l la p s e
S lo p e I n s t a b i l i t y U n d e r -m in in g
P ip in g I n t o C u lv e r t
P ip in g O u ts id e o f C u lv e r t d u e t o A f f lu x
P ip in g O u ts id e o f C u lv e r t d u e t o L e a k s o u t o f C u lv e r t
H y d r a u l ic F lo w E r o s io n b y O v e r -t o p p in g F lo w s
H y d r a u l ic F lo w C r o s s C a tc h -m e n t F lo o d in g
L ik e l ih o o d R a t in g s
L ik e l ih o o d F a c to r 1
L ik e l ih o o d F a c to r 2
L ik e l ih o o d F a c to r 3
F in a l L ik e l ih o o d
L ik e l ih o o d R a t in g ( L 1 - L 6 )
C o n s e q u e n c e C la s s R a t in g s *
T e m p o r a l P r o b a b i l i t y ( T 1 - T 5 )
V u ln e r a b i l i t y ( V 1 - V 5 )
C o n s e q u e n c e C la s s fo r L o s s o f L i fe ( C 1 - C 5 )
C o n s e q u e n c e C la s s fo r p r o p e r t y d a m a g e ( C 1 - C 5 )
R is k A n a l y s i s R a t in g s
A s s e s s e d R is k L e v e l ( A R L 1 - A R L 5 )
N e e d fo r fu r t h e r in v e s t ig a t io n ? ( Y /N ) Y e s N o C o m m e n t s :
* I n g e n e r a l t h e T , V a n d C r a t in g s w i l l b e t h e s a m e fo r e a c h k in d o f h a z a r d , e x c e p t f o r H F - 2 w h ic h w i l l h a v e a la r g e r z o n e o f in f lu e n c e ( ie a c r o s s o th e r c a tc h m e n ts ) .
GW
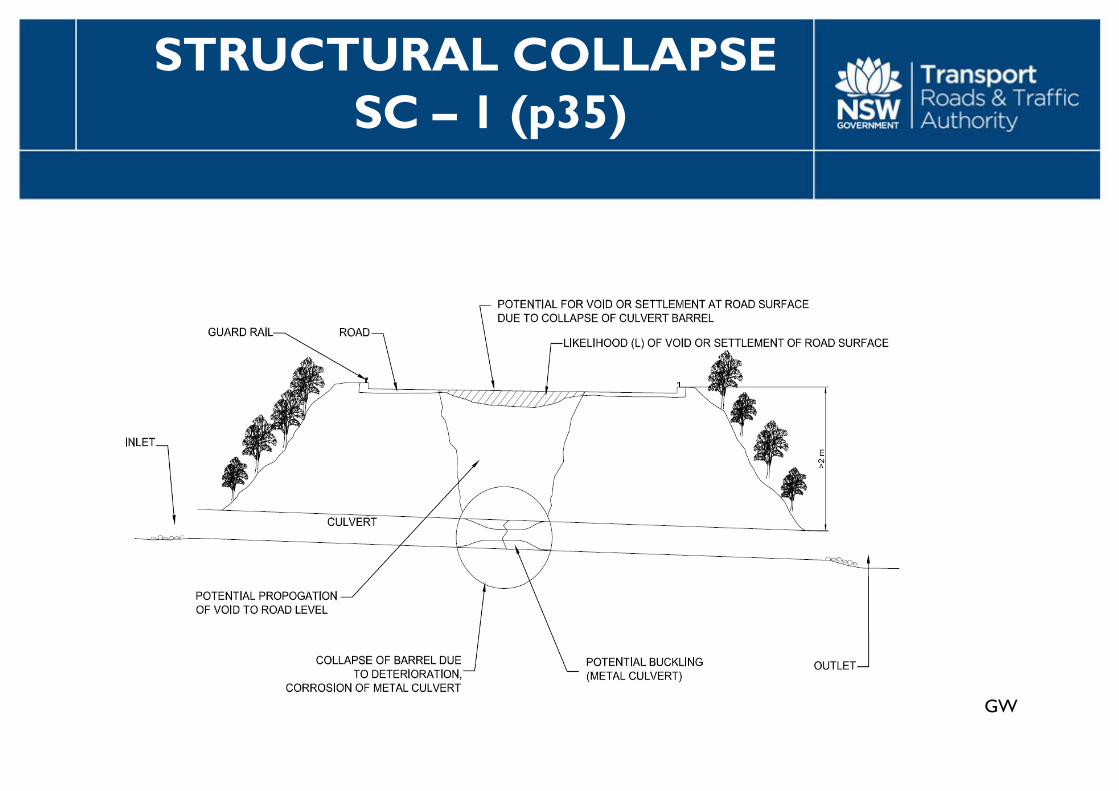
STRUCTURAL COLLAPSE SC – 1 (p35)
GW
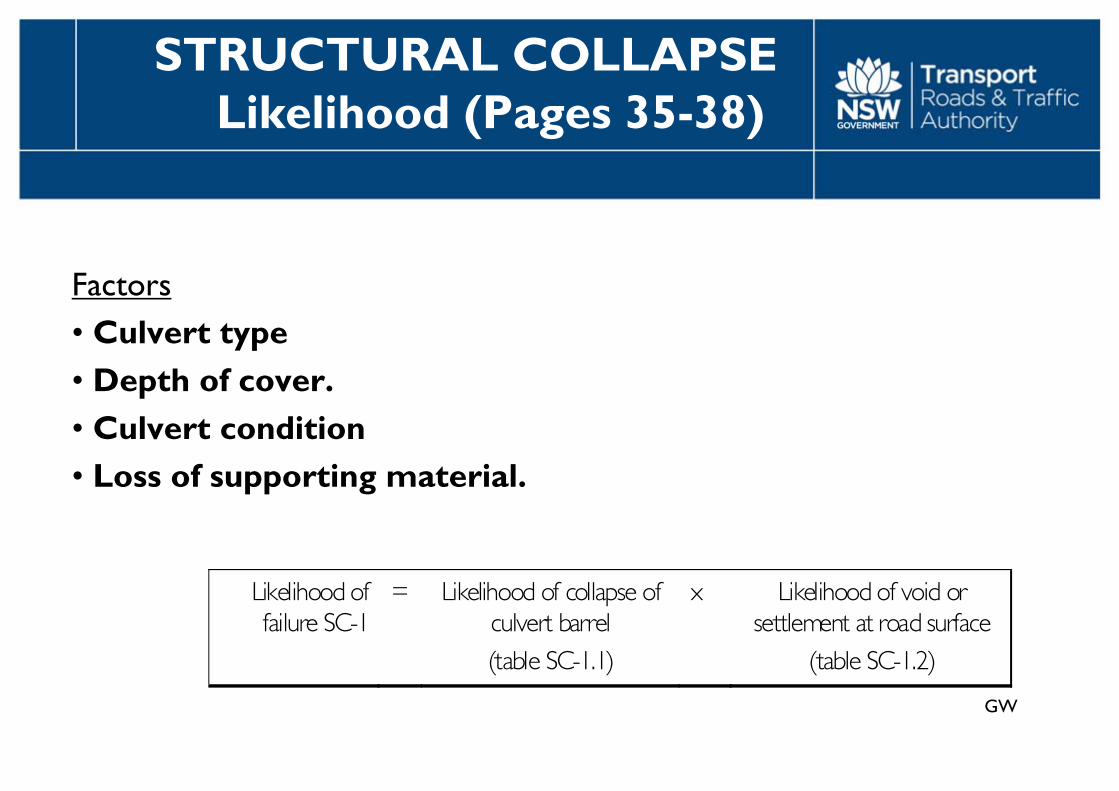
STRUCTURAL COLLAPSE Likelihood (Pages 35-38)
Factors• Culvert type • Depth of cover.• Culvert condition • Loss of supporting material.
Likelihood of failure SC-1
= Likelihood of collapse of culvert barrel (table SC-1.1)
x Likelihood of void or settlement at road surface
(table SC-1.2)

GW
SLOPE INSTABILITY SI – 1 (caused by afflux) (p39)
GW
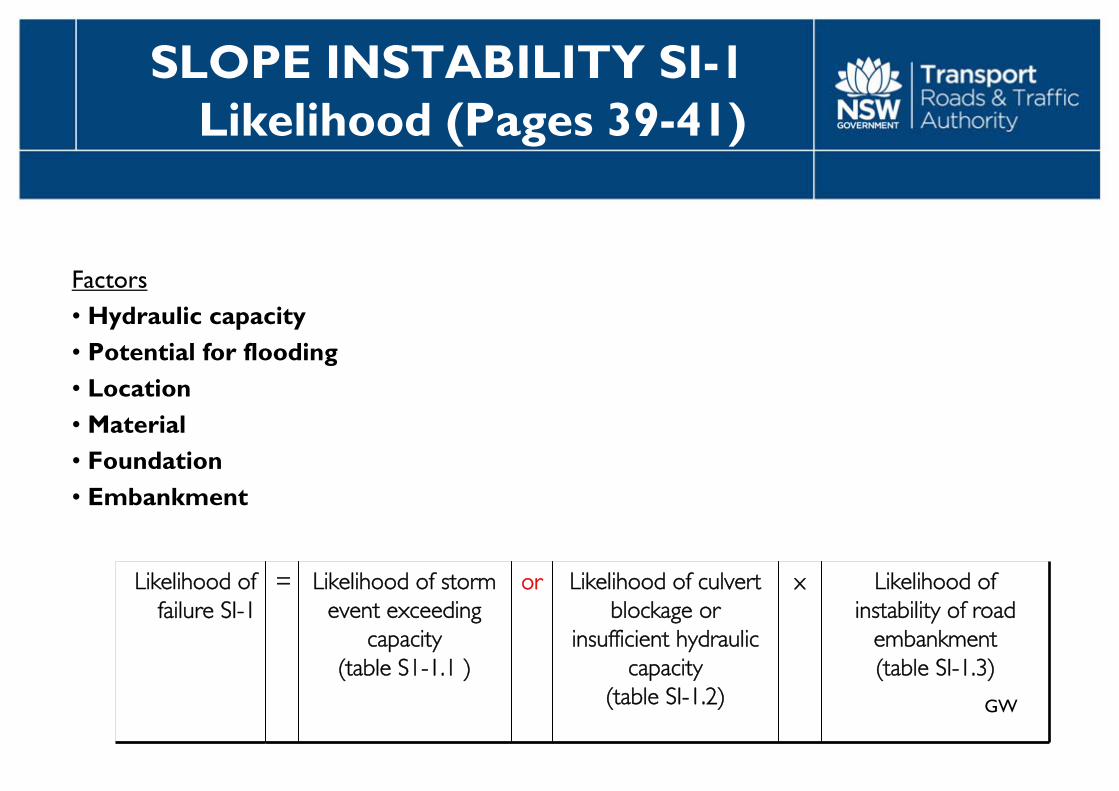
SLOPE INSTABILITY SI-1 Likelihood (Pages 39-41)
Factors• Hydraulic capacity • Potential for flooding• Location• Material• Foundation• Embankment
Likelihood of failure SI-1
= Likelihood of storm event exceeding
capacity(table S1-1.1 )
or Likelihood of culvert blockage or
insufficient hydraulic capacity
(table SI-1.2)
x Likelihood of instability of road
embankment (table SI-1.3)
GW
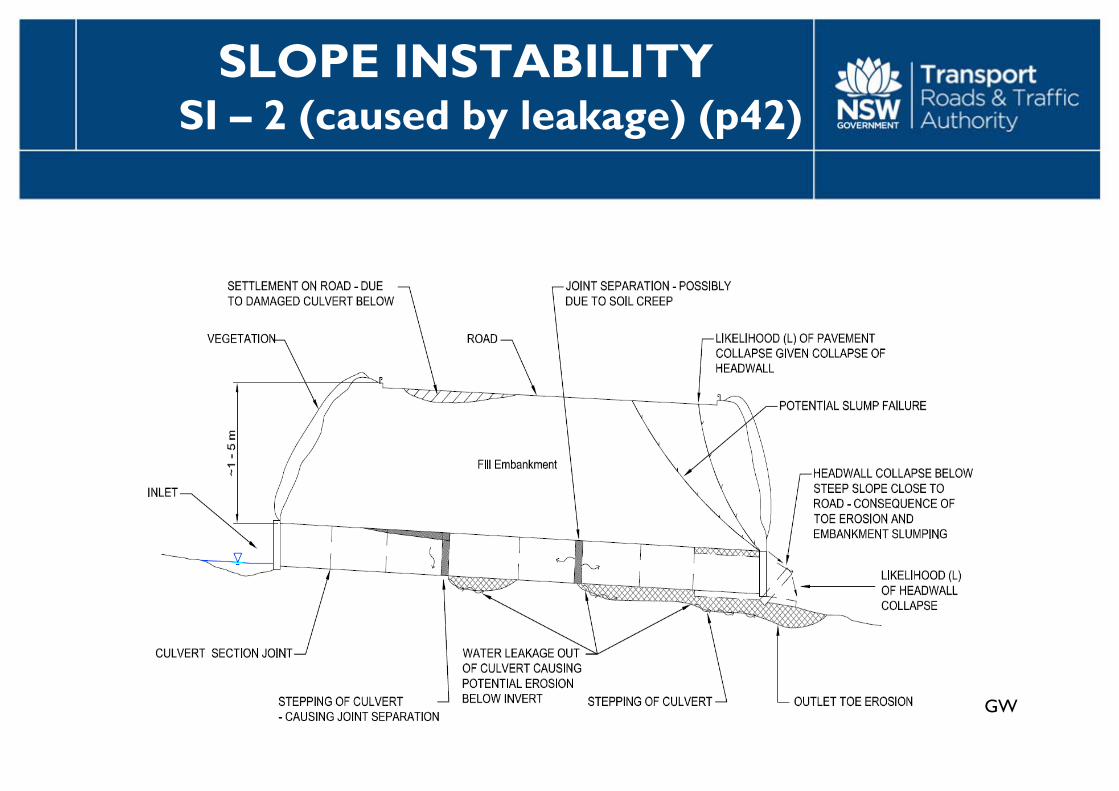
SLOPE INSTABILITY SI – 2 (caused by leakage) (p42)

GW
SLOPE INSTABILITY SI -2 (Caused by leakage SI -2) Likelihood (Pages 42-44)
Factors• Conditions • Scour undermining the toe• Observed condition of embankment• Embankment material and compaction• Foundation Material•Downstream slope
Likelihood of failure SI-2
= Likelihood of leakage out of culvert (table SI-2.1)
x Likelihood of embankment slope instability (table SI-2.2)
GW
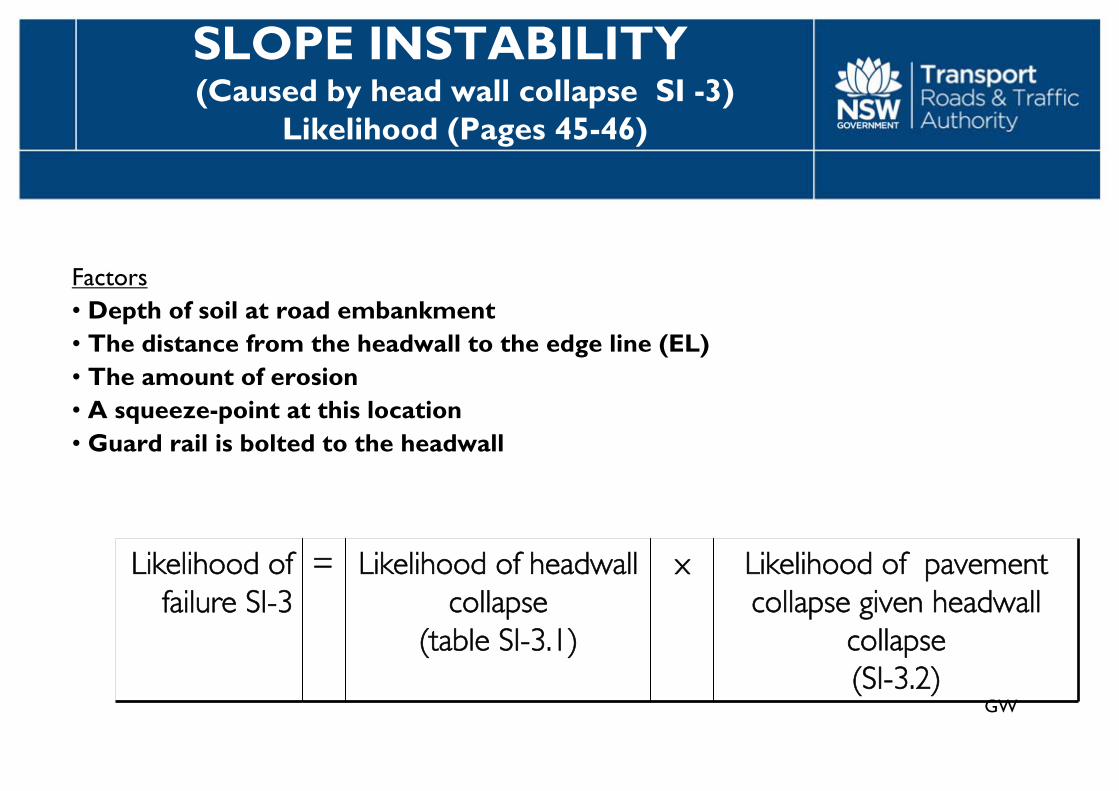
SLOPE INSTABILITY (Caused by head wall collapse SI -3)
Likelihood (Pages 45-46)
Factors• Depth of soil at road embankment• The distance from the headwall to the edge line (EL)• The amount of erosion• A squeeze-point at this location• Guard rail is bolted to the headwall
Likelihood of failure SI-3
= Likelihood of headwall collapse
(table SI-3.1)
x Likelihood of pavement collapse given headwall
collapse(SI-3.2)
GW
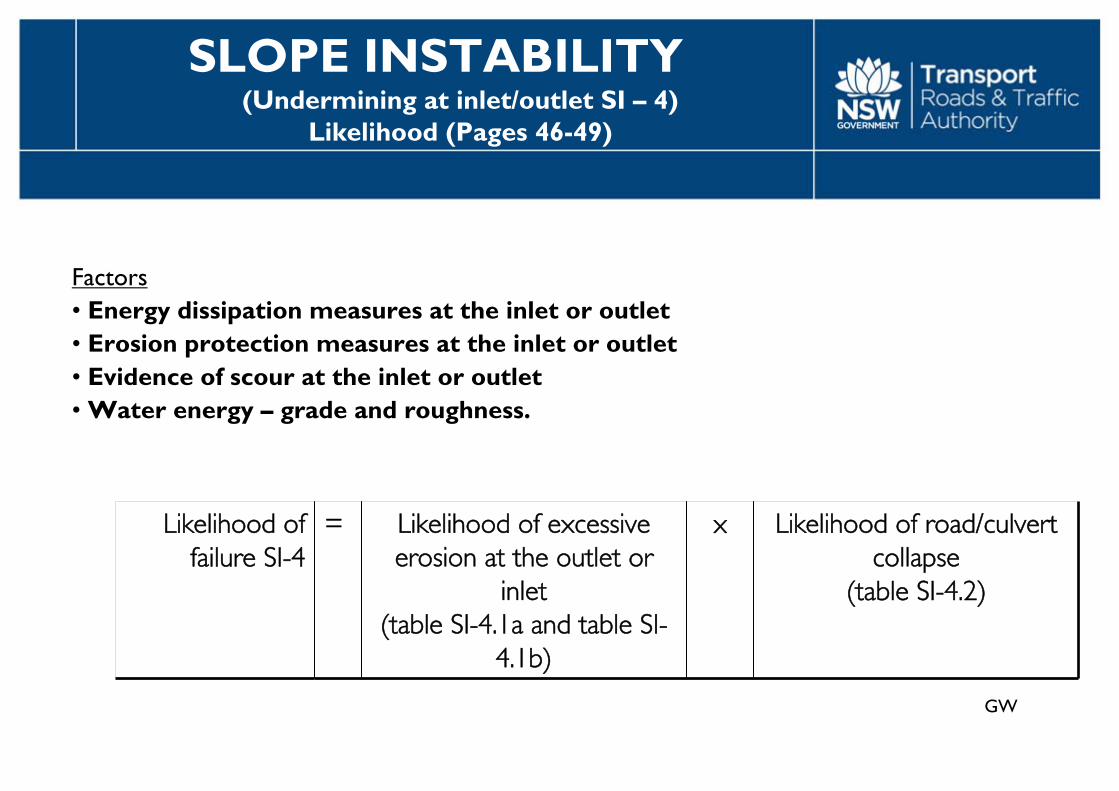
SLOPE INSTABILITY (Undermining at inlet/outlet SI – 4)
Likelihood (Pages 46-49)
Factors• Energy dissipation measures at the inlet or outlet• Erosion protection measures at the inlet or outlet• Evidence of scour at the inlet or outlet• Water energy – grade and roughness.
Likelihood of failure SI-4
= Likelihood of excessive erosion at the outlet or
inlet(table SI-4.1a and table SI-
4.1b)
x Likelihood of road/culvert collapse
(table SI-4.2)

HB
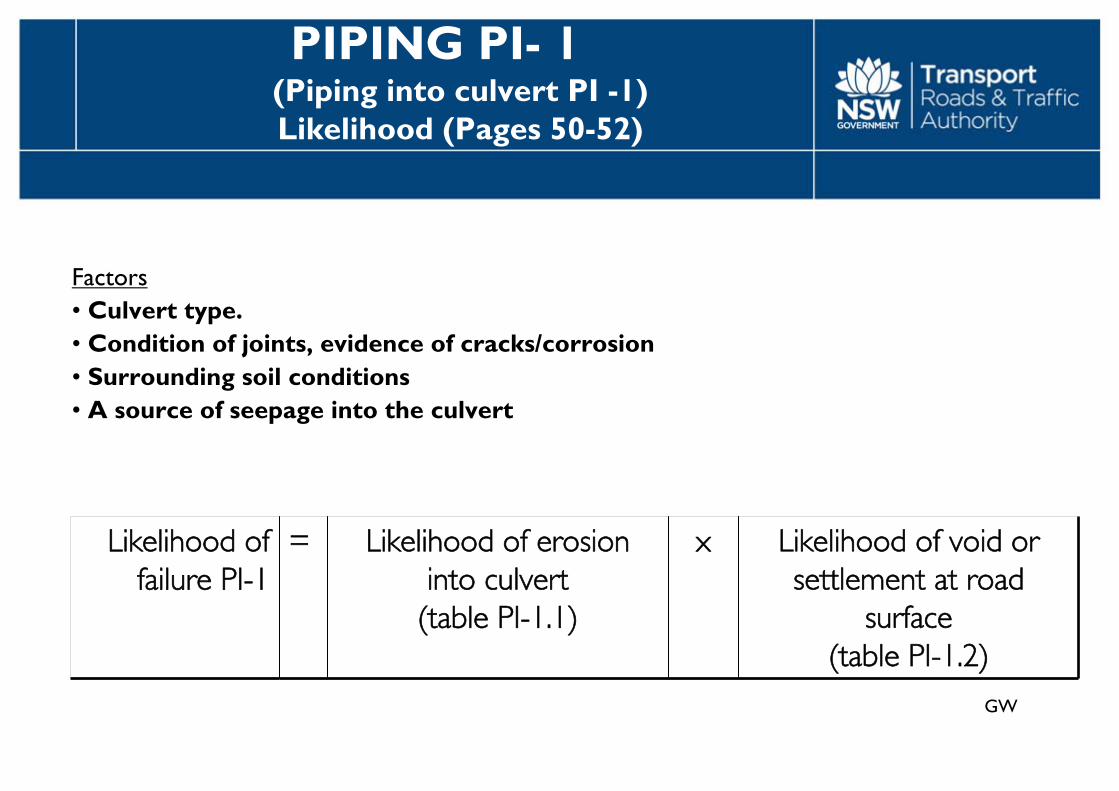
PIPING PI-1 (Piping into culvert) (p50)
GW
PIPING PI- 1 (Piping into culvert PI -1) Likelihood (Pages 50-52)
Factors• Culvert type.• Condition of joints, evidence of cracks/corrosion • Surrounding soil conditions • A source of seepage into the culvert
Likelihood of failure PI-1
= Likelihood of erosion into culvert
(table PI-1.1)
x Likelihood of void or settlement at road
surface(table PI-1.2)

PIPING PI-2 (Piping on outside of culvert due to afflux PI -2)
Likelihood (Pages 53- 55)
Factors• Hydraulic capacity of the culvert• Potential for blockage at the inlet.• Embankment material and compaction • Hydraulic gradient for seepage through the embankment• Duration of ponding of water
Likelihood of failure PI-2
= Likelihood of storm event
exceeding capacity(table P1-2.1)
or Likelihood of culvert blockage or
insufficient hydraulic capacity
(table PI-2.2)
x Likelihood of piping failure of road embankment(table PI-2.3)

GW
PIPING PI-3 (Piping on outside of culvert due to leakage PI -3)
Likelihood (Pages 55- 58)
Factors• Embankment material and compaction • Culvert type• Velocity of flow within the culvert• Condition of joints, evidence of cracks/corrosion
Likelihood of failure PI-
3
= blank Likelihood of internal scour causing piping(table PI-3.2)
x Likelihood of road/void collapse
(table PI-3.3)
GW
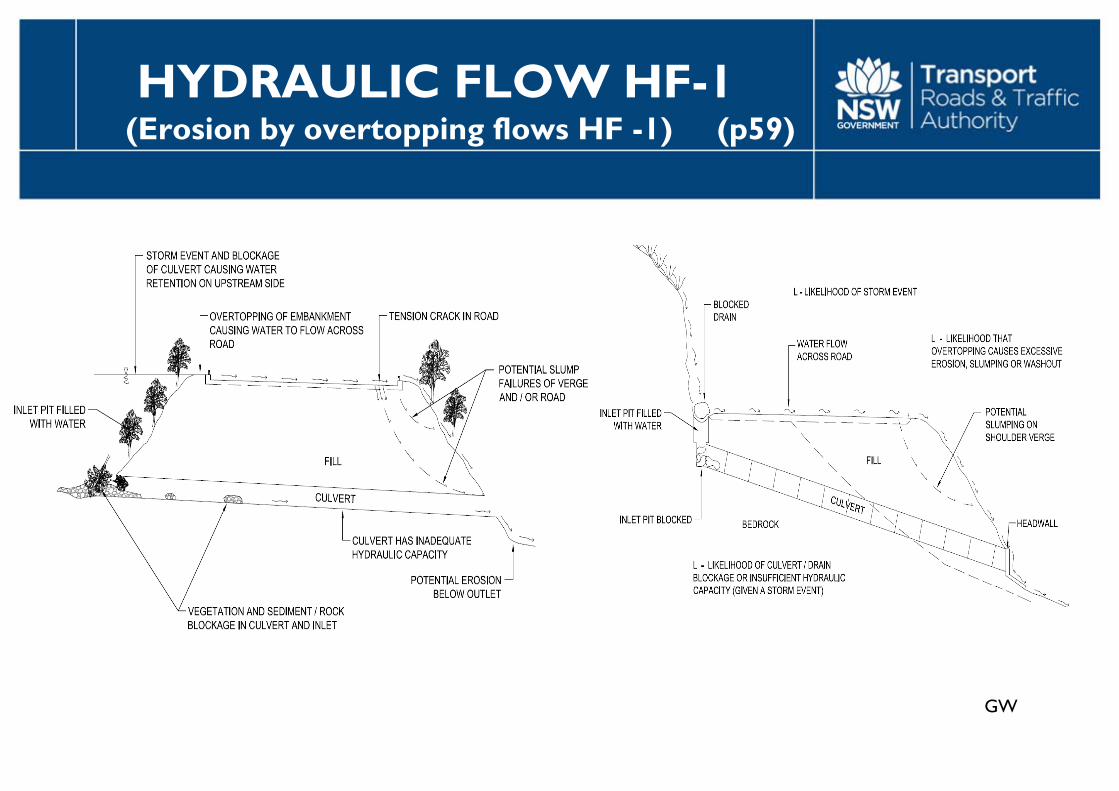
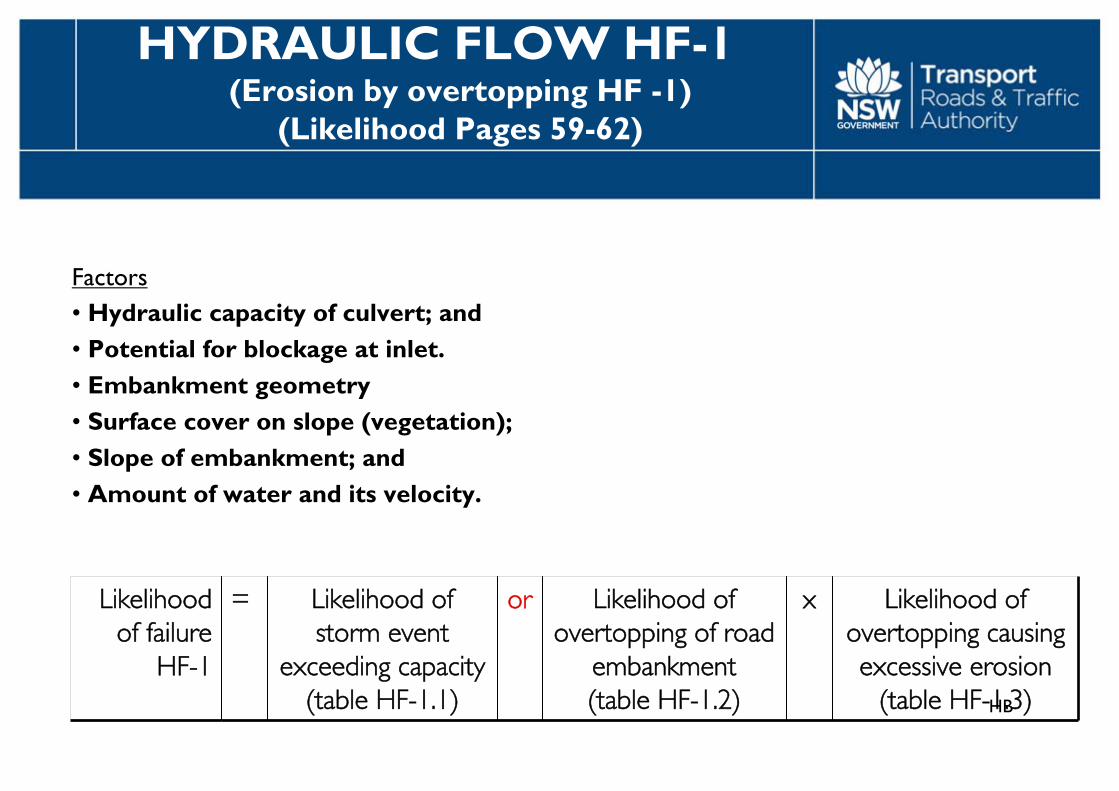
HYDRAULIC FLOW HF-1 (Erosion by overtopping flows HF -1) (p59)
HB
HYDRAULIC FLOW HF-1 (Erosion by overtopping HF -1)
(Likelihood Pages 59-62)
Factors• Hydraulic capacity of culvert; and• Potential for blockage at inlet.• Embankment geometry • Surface cover on slope (vegetation);• Slope of embankment; and• Amount of water and its velocity.
Likelihood of failure
HF-1
= Likelihood of storm event
exceeding capacity(table HF-1.1)
or Likelihood of overtopping of road
embankment(table HF-1.2)
x Likelihood of overtopping causing excessive erosion
(table HF-1.3)
GW
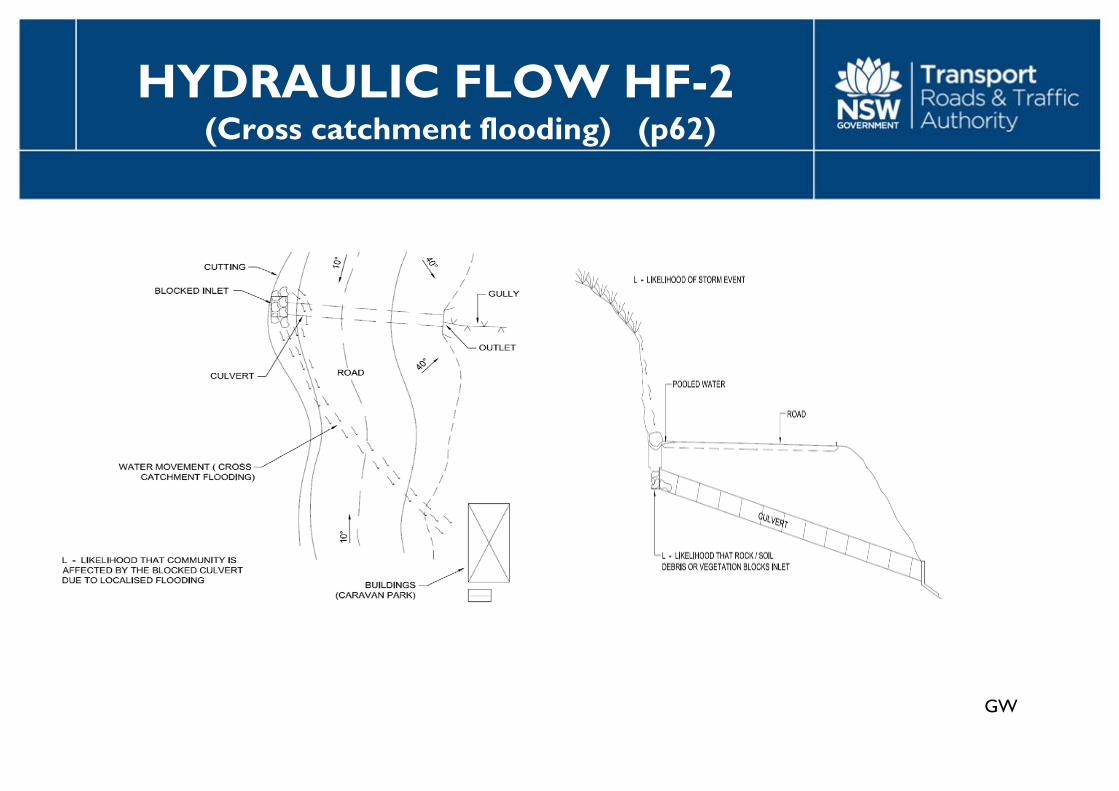
HYDRAULIC FLOW HF-2 (Cross catchment flooding) (p62)

GW
HYDRAULIC FLOW HF-2 (Cross catchment Flooding) (Likelihood Pages 62 - 65)
Factors• Hydraulic capacity of the culvert• Potential for blockage• Geometry of road embankment
Likelihood of failure
HF-2
= Likelihood of storm event exceeding capacity
(table HF-2.1)
or Likelihood of culvert blockage
or insufficient hydraulic capacity
(table HF-2.2)
x Likelihood of cross catchment
flooding(table HF-2.3)
GW
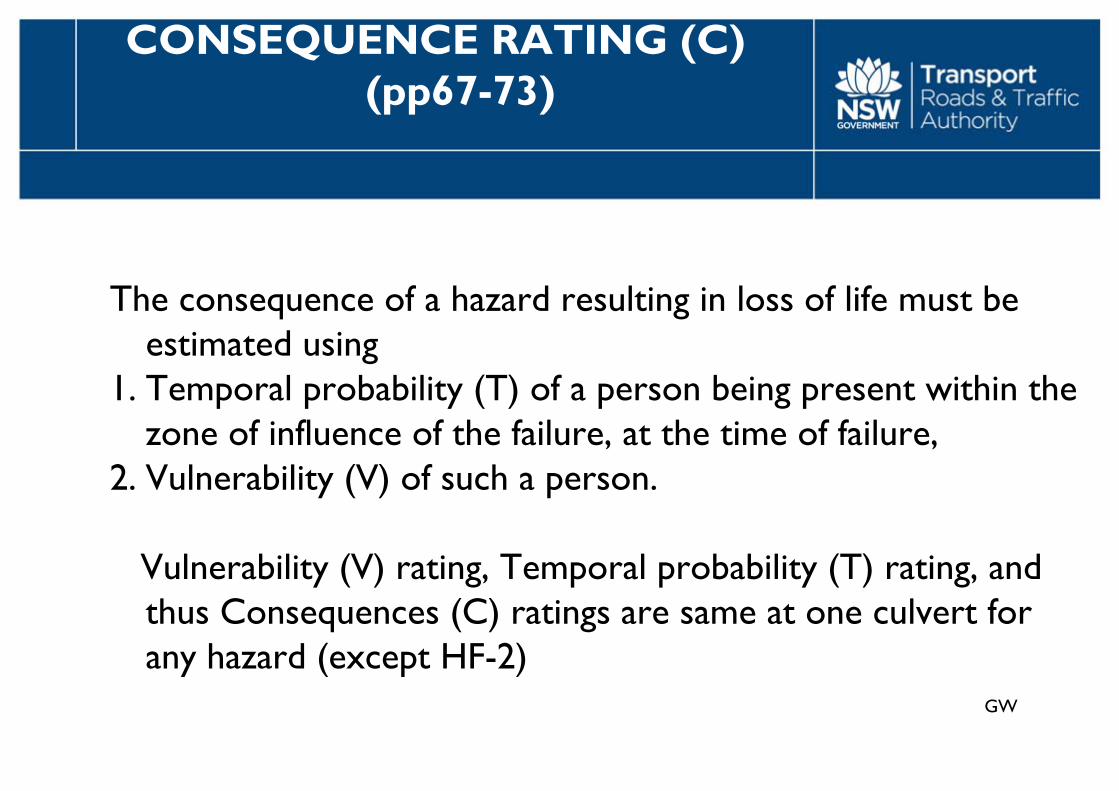
CONSEQUENCE RATING (C) (pp67-73)
The consequence of a hazard resulting in loss of life must be estimated using
1. Temporal probability (T) of a person being present within the zone of influence of the failure, at the time of failure,
2. Vulnerability (V) of such a person.
Vulnerability (V) rating, Temporal probability (T) rating, and thus Consequences (C) ratings are same at one culvert for any hazard (except HF-2)
GW
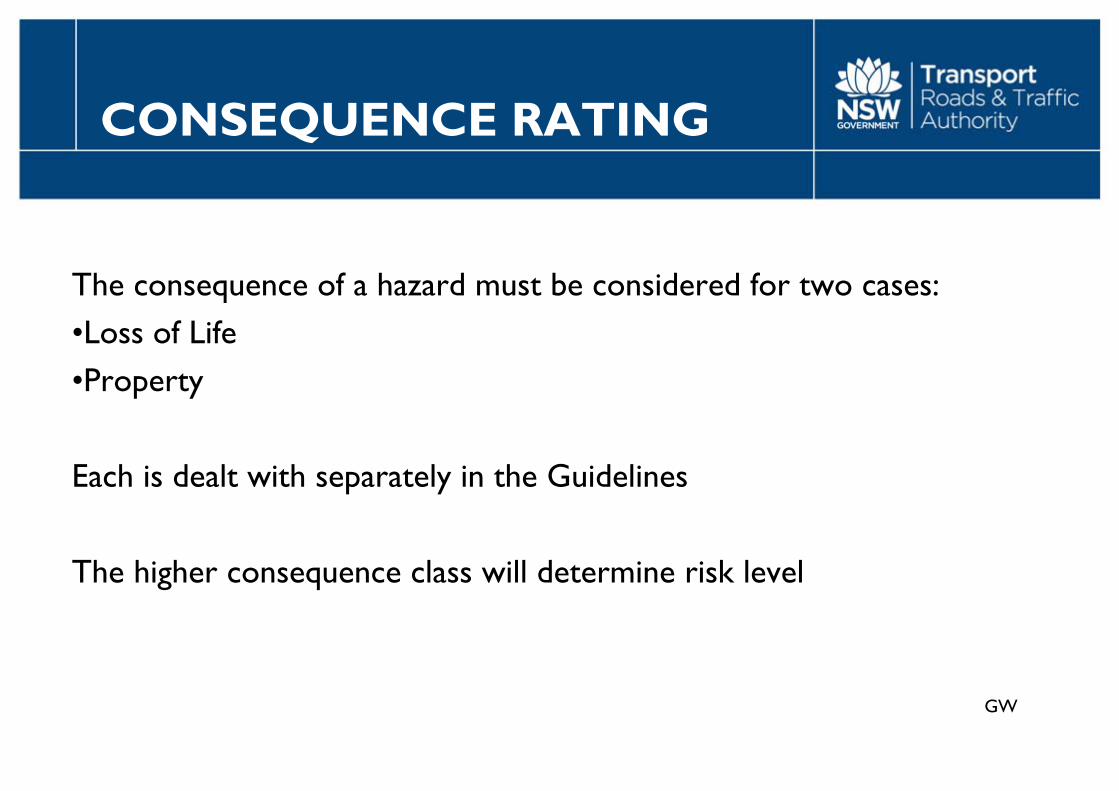
CONSEQUENCE RATING
The consequence of a hazard must be considered for two cases:•Loss of Life•Property
Each is dealt with separately in the Guidelines
The higher consequence class will determine risk level

CONSEQUENCE RATING (C) Vulnerability V (Pages 67-68)
Extended Vulnerability Table
Vulnerability Rating
Vulnerability Element Probability
People in the Open People in Buildings Vehicle Crossing Embankment Failure Area
V1 Unable to evade debris (movement very/extremely rapid), or buried
Engulfed in building collapse
Lost into a deep, narrow void. p > 0.5
V2 May be able to evade debris
Partial building collapse Lost into a shallow void p 0.1 – 0.5
V3 Most people able to evade debris
Building penetrated, no collapse
Stepped surface with 0.1 – 0.2 m steps at highway speeds.Aquaplaning as a result of travelling at highway speeds.
p 0.01 – 0.1
V4 Building struck, damaged but not penetrated
Stepped surface with 0.1 – 0.2 m steps at urban speeds.Shallow void/depression where guardfence may prevent a vehicle from leaving the road.Aquaplaning as a result of travelling at urban speed.
p 0.001 – 0.01
V5 Building struck, only minor damage etc
Stepped surface with 0.1 – 0.2 m steps at low speeds.Irregular surface formed by a developing embankment failure at highway speeds.Water on the road causing some loss of control of the vehicle.
p < 0.001
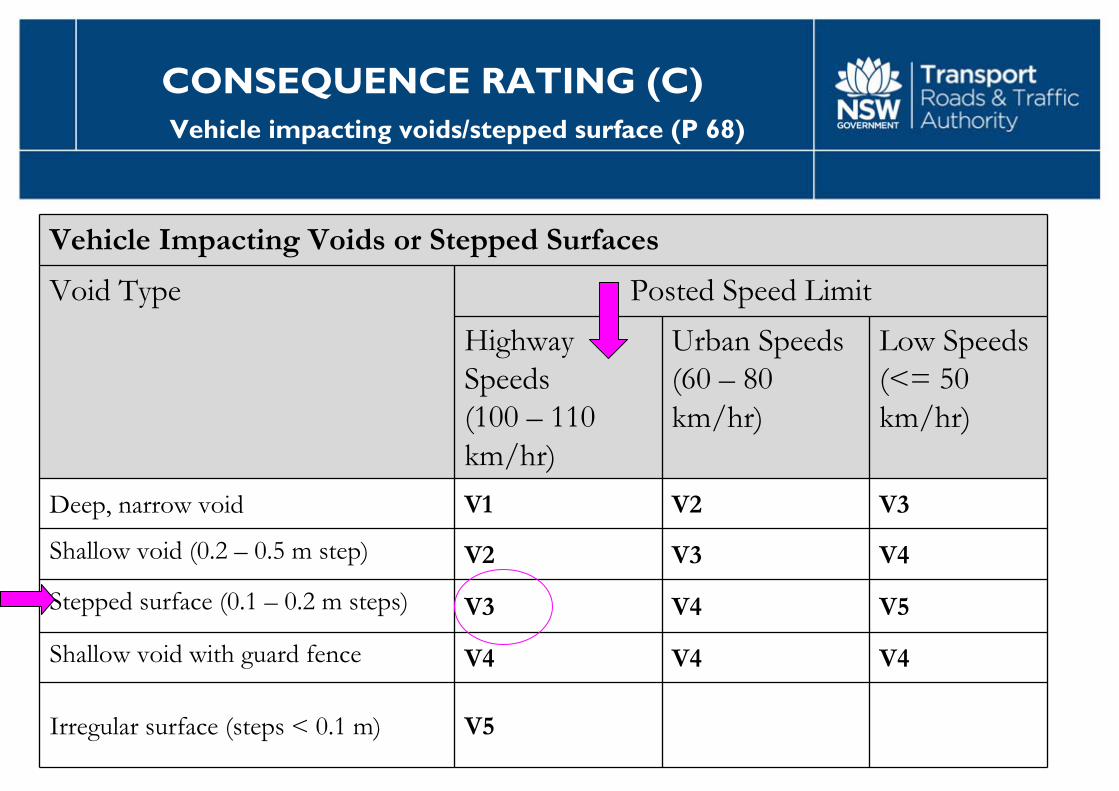
CONSEQUENCE RATING (C) Vehicle impacting voids/stepped surface (P 68)
Vehicle Impacting Voids or Stepped Surfaces
Void Type Posted Speed LimitHighway Speeds(100 – 110 km/hr)
Urban Speeds(60 – 80 km/hr)
Low Speeds(<= 50 km/hr)
Deep, narrow void V1 V2 V3
Shallow void (0.2 – 0.5 m step) V2 V3 V4
Stepped surface (0.1 – 0.2 m steps) V3 V4 V5
Shallow void with guard fence V4 V4 V4
Irregular surface (steps < 0.1 m) V5

CONSEQUENCE RATING (C) Temporal probability estimation (T) (P 69)
Temporal Probability table
Rating Description ProbabilityT1 Person usually expected to be present as part of the normal pattern of
usage (eg residential buildings, some commercial buildings). Road users in the heaviest of urban traffic conditions.
(p > 0.5)
T2 Person often expected to be present as part of the normal pattern of usage (eg many commercial buildings). Road users on major urban arterial roads and the most heavily trafficked rural roads.
(p 0.1 – 0.5)
T3 Person may sometimes be present as part of the normal pattern of usage. Road users on many urban arterial roads and most major rural arterial roads.
(p 0.01 – 0.1)
T4 Person may sometimes be present as part of the normal pattern of usage. Road users on many urban arterial roads and most major rural arterial roads.
(p 0.001 – 0.01)
T5 Person may sometimes be present as part of the normal pattern of usage. Road users on many urban arterial roads and most major rural arterial roads.
(p < 0.001)
GW
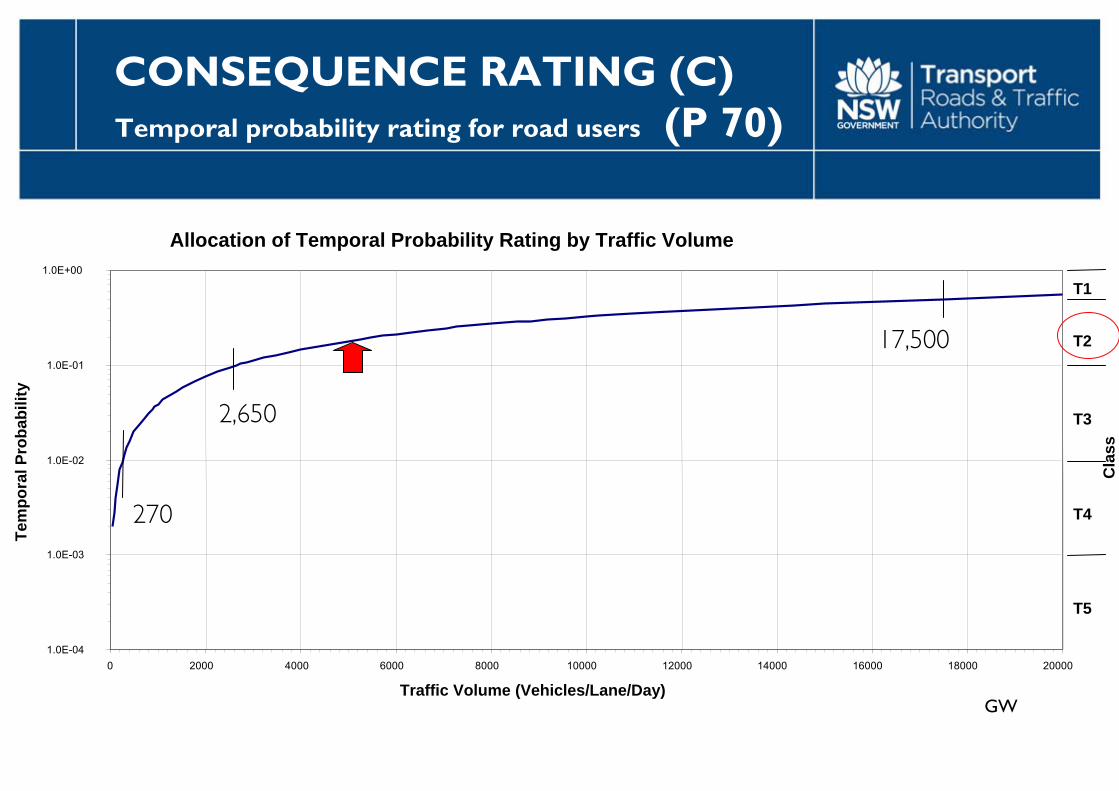
CONSEQUENCE RATING (C) Temporal probability rating for road users (P 70)
Allocation of Temporal Probability Rating by Traffic Volume
1.0E-04
1.0E-03
1.0E-02
1.0E-01
1.0E+00
0 2000 4000 6000 8000 10000 12000 14000 16000 18000 20000
Traffic Volume (Vehicles/Lane/Day)
Tem
pora
l Pro
babi
lity
T5
T4
T3
T2
T1
Cla
ss
270
2,650
17,500
GW
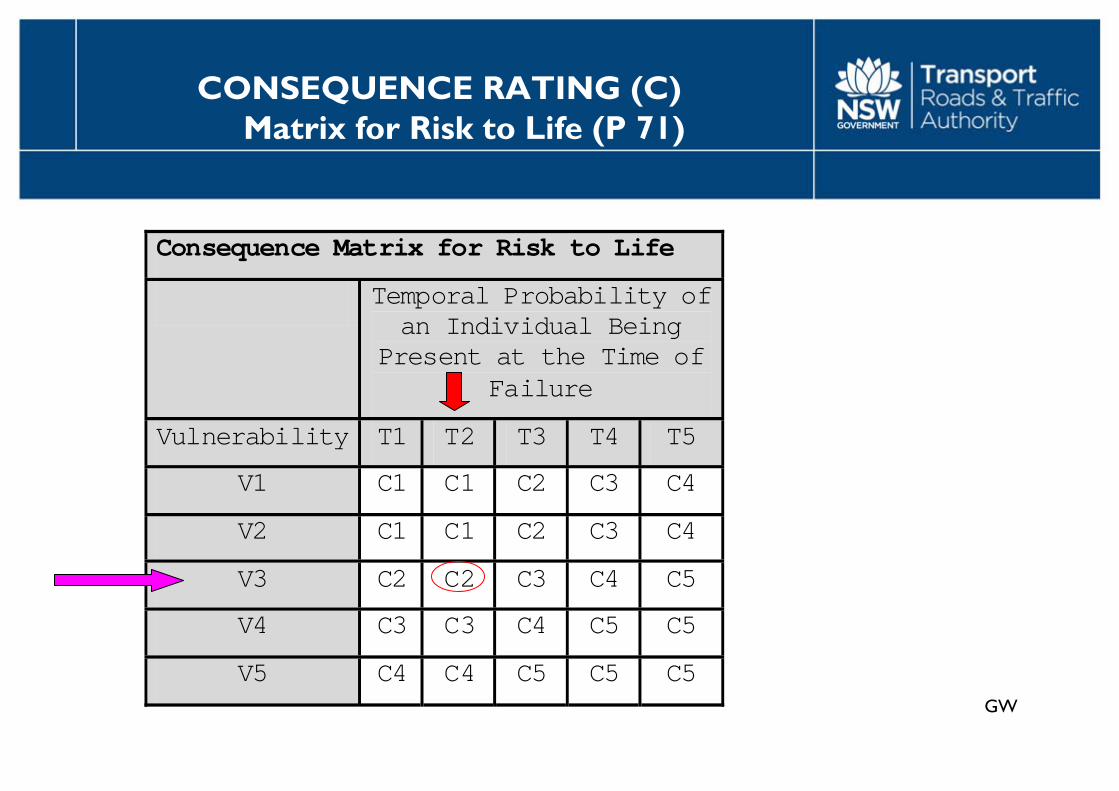
Consequence Matrix for Risk to Life
Temporal Probability of an Individual Being
Present at the Time of Failure
Vulnerability T1 T2 T3 T4 T5
V1 C1 C1 C2 C3 C4
V2 C1 C1 C2 C3 C4
V3 C2 C2 C3 C4 C5
V4 C3 C3 C4 C5 C5
V5 C4 C4 C5 C5 C5
CONSEQUENCE RATING (C) Matrix for Risk to Life (P 71)
GW
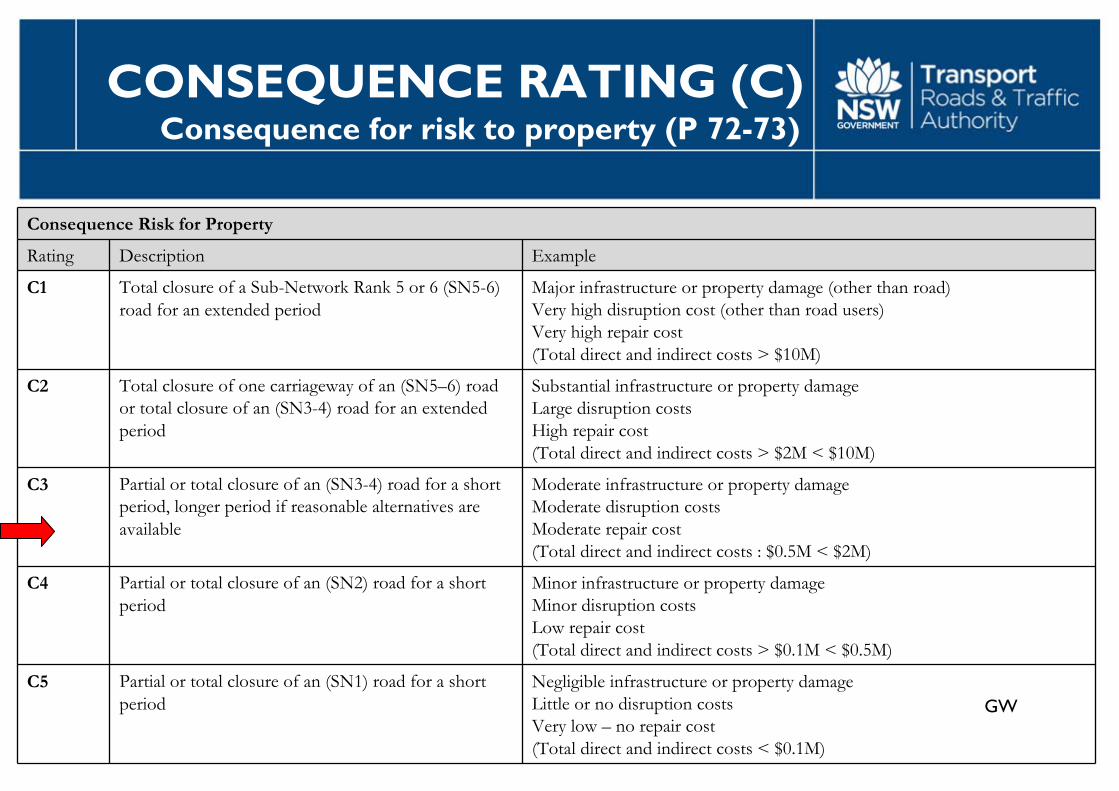
CONSEQUENCE RATING (C) Consequence for risk to property (P 72-73)
Consequence Risk for Property
Rating Description Example
C1 Total closure of a Sub-Network Rank 5 or 6 (SN5-6) road for an extended period
Major infrastructure or property damage (other than road)Very high disruption cost (other than road users)Very high repair cost(Total direct and indirect costs > $10M)
C2 Total closure of one carriageway of an (SN5–6) road or total closure of an (SN3-4) road for an extended period
Substantial infrastructure or property damageLarge disruption costsHigh repair cost(Total direct and indirect costs > $2M < $10M)
C3 Partial or total closure of an (SN3-4) road for a short period, longer period if reasonable alternatives are available
Moderate infrastructure or property damageModerate disruption costsModerate repair cost(Total direct and indirect costs : $0.5M < $2M)
C4 Partial or total closure of an (SN2) road for a short period
Minor infrastructure or property damageMinor disruption costsLow repair cost(Total direct and indirect costs > $0.1M < $0.5M)
C5 Partial or total closure of an (SN1) road for a short period
Negligible infrastructure or property damageLittle or no disruption costsVery low – no repair cost(Total direct and indirect costs < $0.1M)

HB
Assessed Risk Level Matrix
Consequence Class
Likelihood C1 C2 C3 C4 C5
L1 ARL1 ARL1 ARL1 ARL2 ARL3
L2 ARL1 ARL1 ARL2 ARL3 ARL4
L3 ARL1 ARL2 ARL3 ARL4 ARL5
L4 ARL2 ARL3 ARL4 ARL5 ARL5
L5 ARL3 ARL4 ARL5 ARL5 ARL5
L6 ARL4 ARL5 ARL5 ARL5 ARL5
ASSESSED RISK LEVEL (ARL) (P 74)
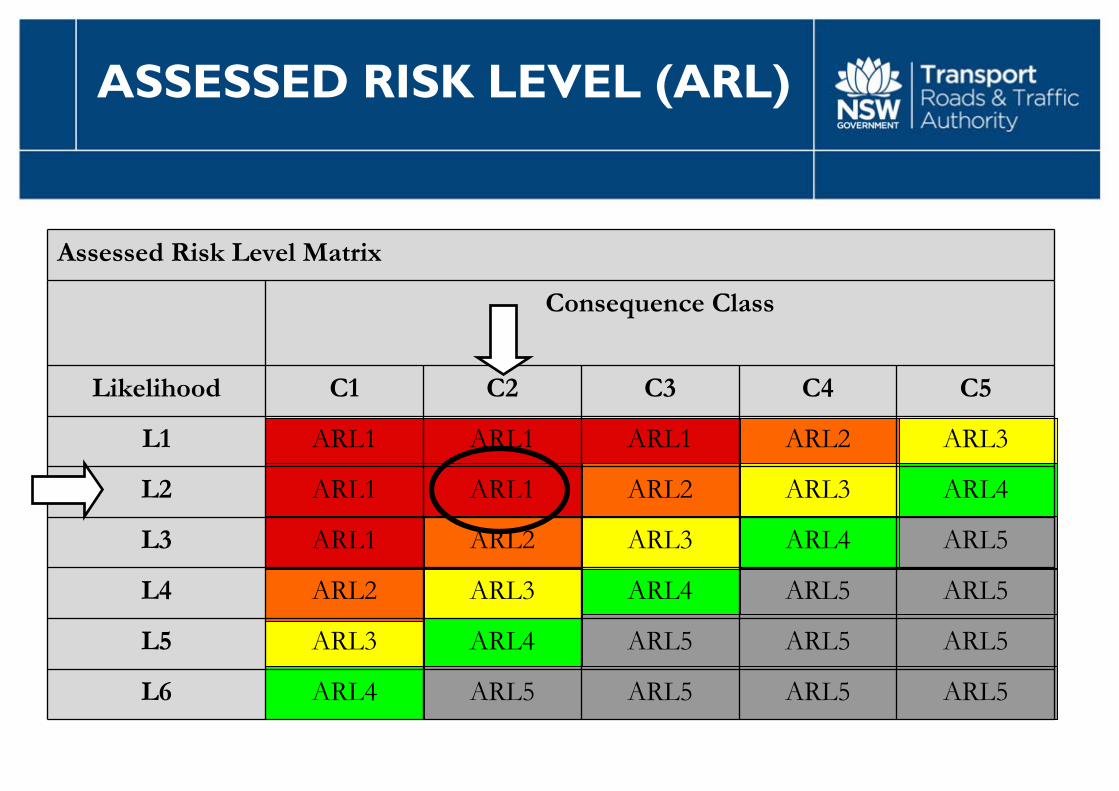
HB
Assessed Risk Level Matrix
Consequence Class
Likelihood C1 C2 C3 C4 C5
L1 ARL1 ARL1 ARL1 ARL2 ARL3
L2 ARL1 ARL1 ARL2 ARL3 ARL4
L3 ARL1 ARL2 ARL3 ARL4 ARL5
L4 ARL2 ARL3 ARL4 ARL5 ARL5
L5 ARL3 ARL4 ARL5 ARL5 ARL5
L6 ARL4 ARL5 ARL5 ARL5 ARL5
ASSESSED RISK LEVEL (ARL)