CULVER VISTA APARTMENTS
20
CULVER VISTA APARTMENTS C U L V E R C I T Y , C A
Transcript of CULVER VISTA APARTMENTS
CULVER VISTA APARTMENTS
C U L V E R C I T Y , C A

Confidentiality and DisclaimerThe information contained in the following Marketing Brochure is proprietary and strictly confidential. It is intended to be reviewed only by the party receiving itfrom Marcus & Millichap and should not be made available to any other person or entity without the written consent of Marcus & Millichap. This MarketingBrochure has been prepared to provide summary, unverified information to prospective purchasers, and to establish only a preliminary level of interest in thesubject property. The information contained herein is not a substitute for a thorough due diligence investigation. Marcus & Millichap has not made anyinvestigation, and makes no warranty or representation, with respect to the income or expenses for the subject property, the future projected financial performanceof the property, the size and square footage of the property and improvements, the presence or absence of contaminating substances, PCB's or asbestos, thecompliance with State and Federal regulations, the physical condition of the improvements thereon, or the financial condition or business prospects of any tenant,or any tenant's plans or intentions to continue its occupancy of the subject property. The information contained in this Marketing Brochure has been obtained fromsources we believe to be reliable; however, Marcus & Millichap has not verified, and will not verify, any of the information contained herein, nor has Marcus &Millichap conducted any investigation regarding these matters and makes no warranty or representation whatsoever regarding the accuracy or completeness ofthe information provided. All potential buyers must take appropriate measures to verify all of the information set forth herein. Marcus & Millichap is a service markof Marcus & Millichap Real Estate Investment Services, Inc. © 2018 Marcus & Millichap. All rights reserved.ALL PROPERTY SHOWINGS ARE BY APPOINTMENT ONLY.PLEASE CONSULT YOUR MARCUS & MILLICHAP AGENT FOR MORE DETAILS.
Special COVID-19 NoticeAll potential buyers are strongly advised to take advantage of their opportunities and obligations to conduct thorough due diligence and seek expert opinions asthey may deem necessary, especially given the unpredictable changes resulting from the continuing COVID-19 pandemic. Marcus & Millichap has not beenretained to perform, and cannot conduct, due diligence on behalf of any prospective purchaser. Marcus & Millichap’s principal expertise is in marketinginvestment properties and acting as intermediaries between buyers and sellers. Marcus & Millichap and its investment professionals cannot and will not act aslawyers, accountants, contractors, or engineers. All potential buyers are admonished and advised to engage other professionals on legal issues, tax, regulatory,financial, and accounting matters, and for questions involving the property’s physical condition or financial outlook. Projections and pro forma financialstatements are not guarantees and, given the potential volatility created by COVID-19, all potential buyers should be comfortable with and rely solely on their ownprojections, analyses, and decision-making.
Non-Endorsement NoticeMarcus & Millichap is not affiliated with, sponsored by, or endorsed by any commercial tenant or lessee identified in this marketing package. Thepresence of any corporation's logo or name is not intended to indicate or imply affiliation with, or sponsorship or endorsement by, said corporation ofMarcus & Millichap, its affiliates or subsidiaries, or any agent, product, service, or commercial listing of Marcus & Millichap, and is solely included for thepurpose of providing tenant lessee information about this listing to prospective customers.
N O N - E N D O R S E M E N T A N D D I S C L A I M E R N O T I C E
3
01 02INVESTMENT OVERVIEW
FINANCIAL ANALYSIS
MARKET COMPARABLES
MARKET OVERVIEW
03 04

4
P R E S E N T E D B Y
5
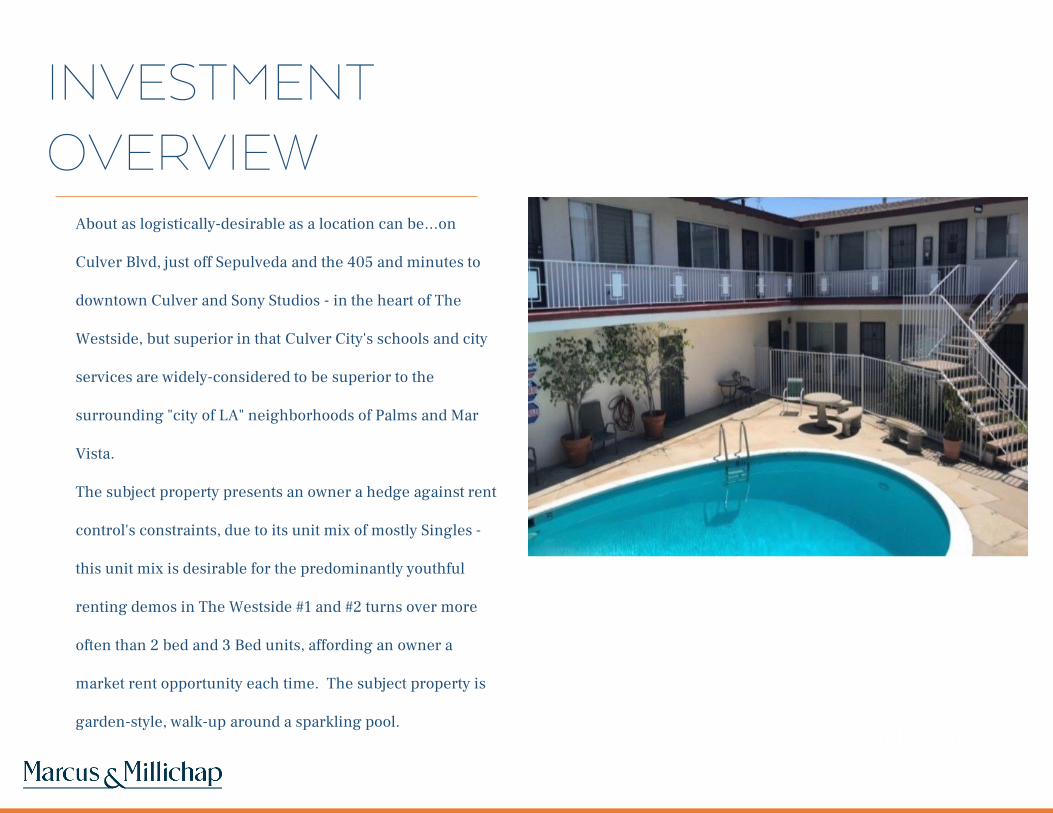
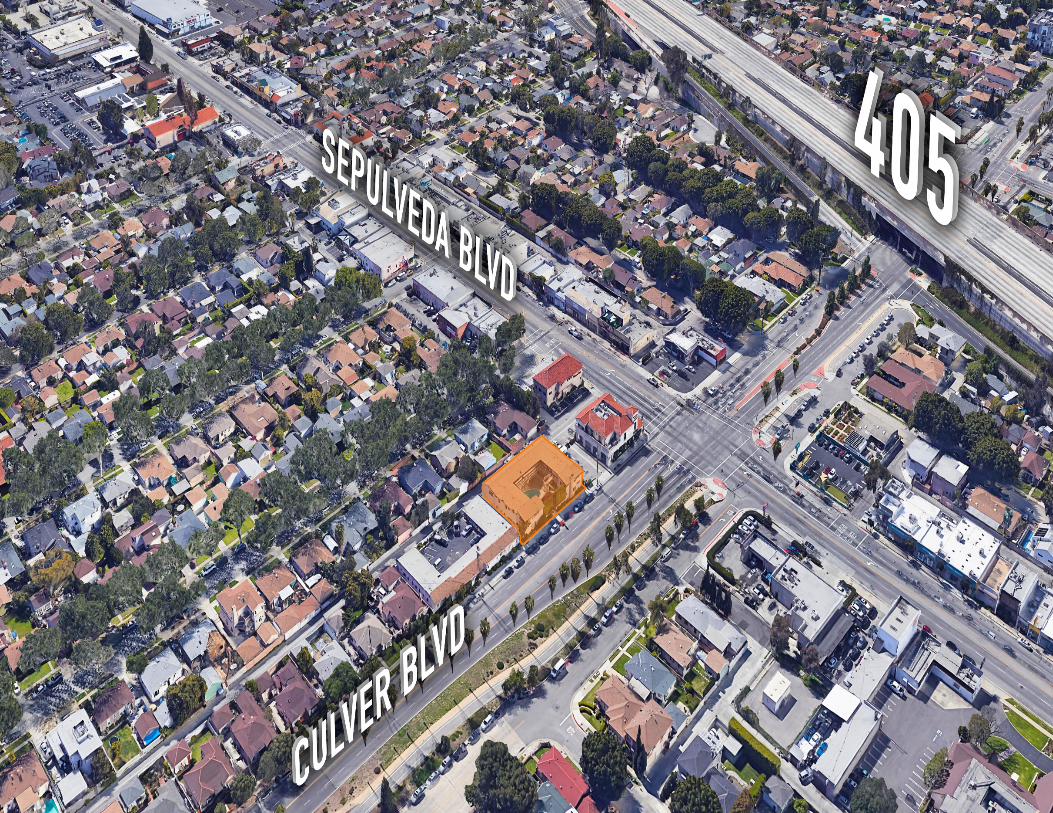
About as logistically-desirable as a location can be…on
Culver Blvd, just off Sepulveda and the 405 and minutes to
downtown Culver and Sony Studios - in the heart of The
Westside, but superior in that Culver City's schools and city
services are widely-considered to be superior to the
surrounding "city of LA" neighborhoods of Palms and Mar
Vista.
The subject property presents an owner a hedge against rent
control's constraints, due to its unit mix of mostly Singles -
this unit mix is desirable for the predominantly youthful
renting demos in The Westside #1 and #2 turns over more
often than 2 bed and 3 Bed units, affording an owner a
market rent opportunity each time. The subject property is
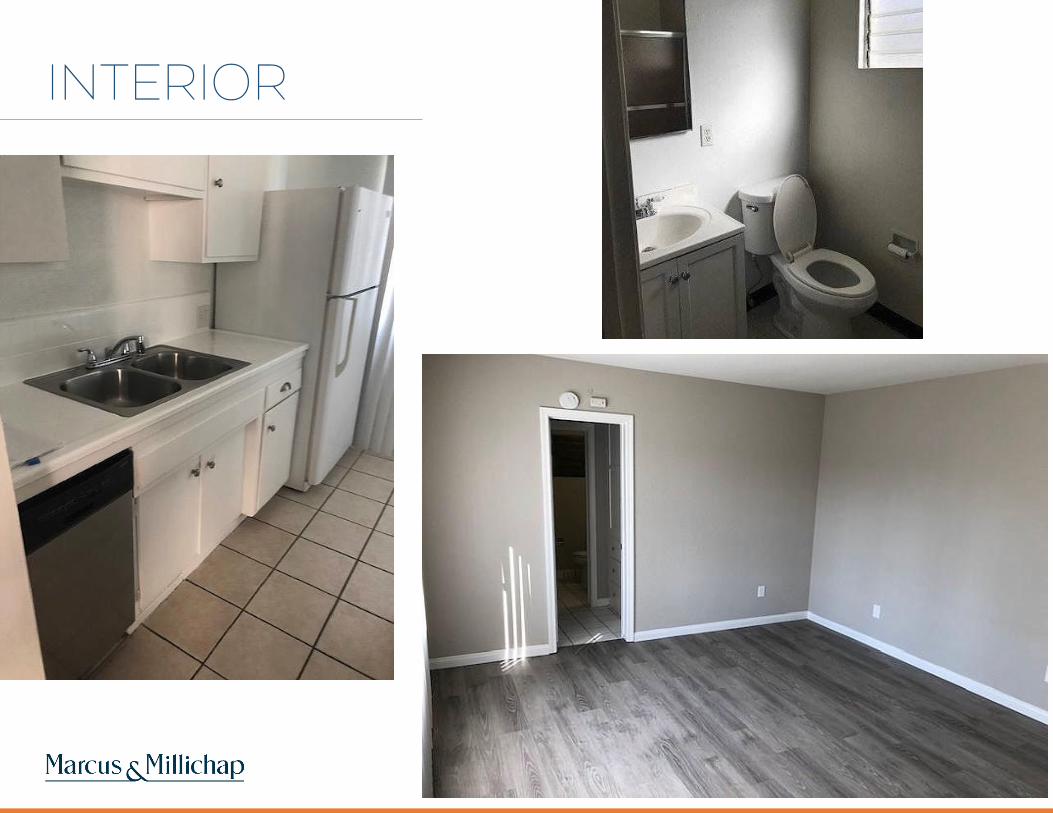
garden-style, walk-up around a sparkling pool.
INVESTMENT OVERVIEW
6
INTERIOR
8
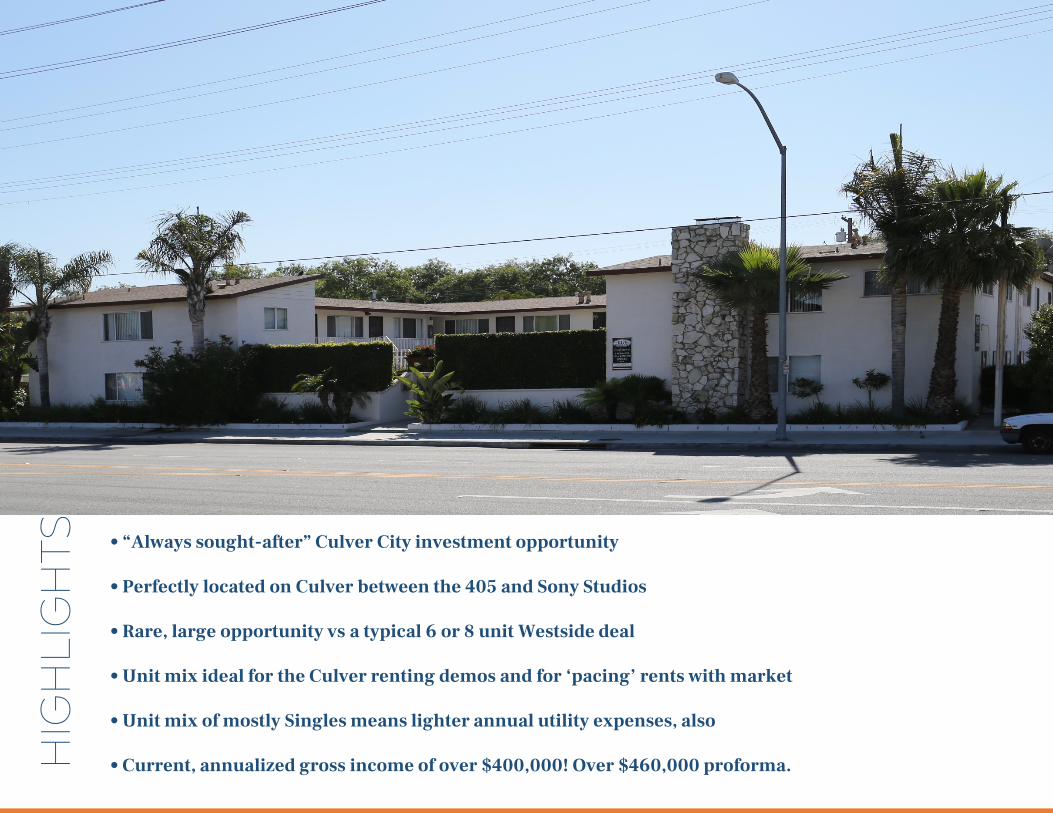
• “Always sought-after” Culver City investment opportunity
• Perfectly located on Culver between the 405 and Sony Studios
• Rare, large opportunity vs a typical 6 or 8 unit Westside deal
• Unit mix ideal for the Culver renting demos and for ‘pacing’ rents with market
• Unit mix of mostly Singles means lighter annual utility expenses, also
• Current, annualized gross income of over $400,000! Over $460,000 proforma.HIG
HLI
GH
TS
FINANCIAL ANALYSIS
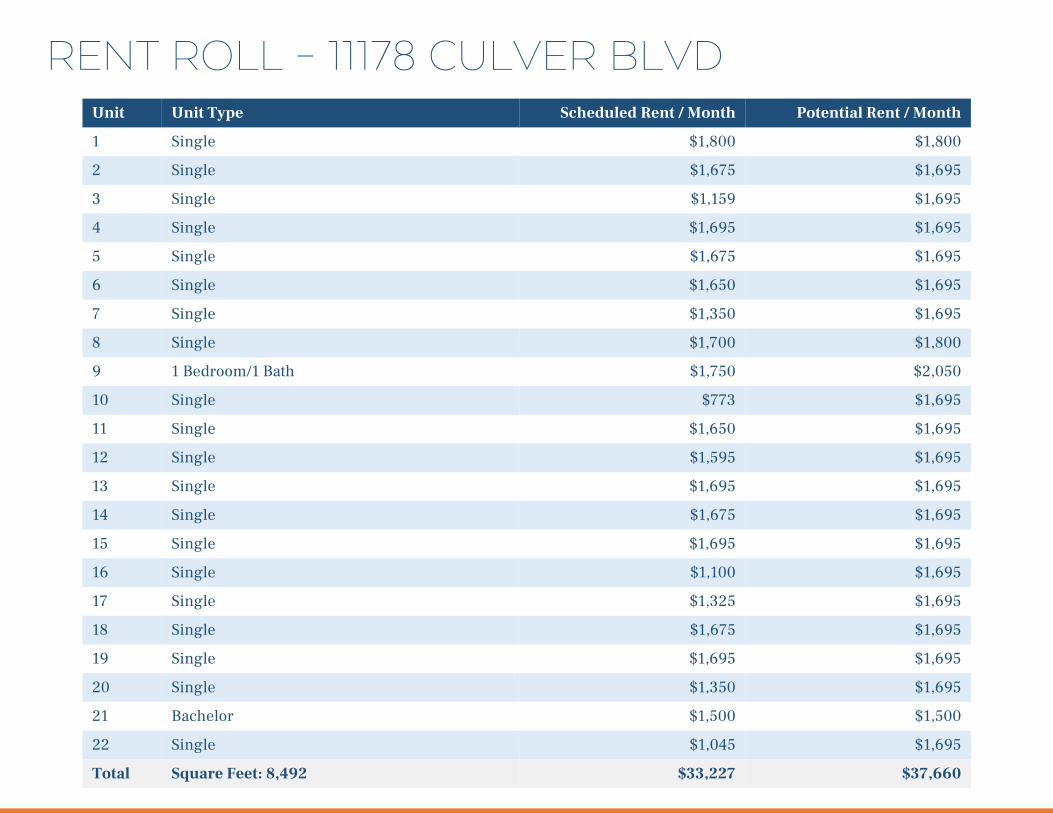
RENT ROLL – 11178 CULVER BLVDUnit Unit Type Scheduled Rent / Month Potential Rent / Month
1 Single $1,800 $1,800
2 Single $1,675 $1,695
3 Single $1,159 $1,695
4 Single $1,695 $1,695
5 Single $1,675 $1,695
6 Single $1,650 $1,695
7 Single $1,350 $1,695
8 Single $1,700 $1,800
9 1 Bedroom/1 Bath $1,750 $2,050
10 Single $773 $1,695
11 Single $1,650 $1,695
12 Single $1,595 $1,695
13 Single $1,695 $1,695
14 Single $1,675 $1,695
15 Single $1,695 $1,695
16 Single $1,100 $1,695
17 Single $1,325 $1,695
18 Single $1,675 $1,695
19 Single $1,695 $1,695
20 Single $1,350 $1,695
21 Bachelor $1,500 $1,500
22 Single $1,045 $1,695
Total Square Feet: 8,492 $33,227 $37,660
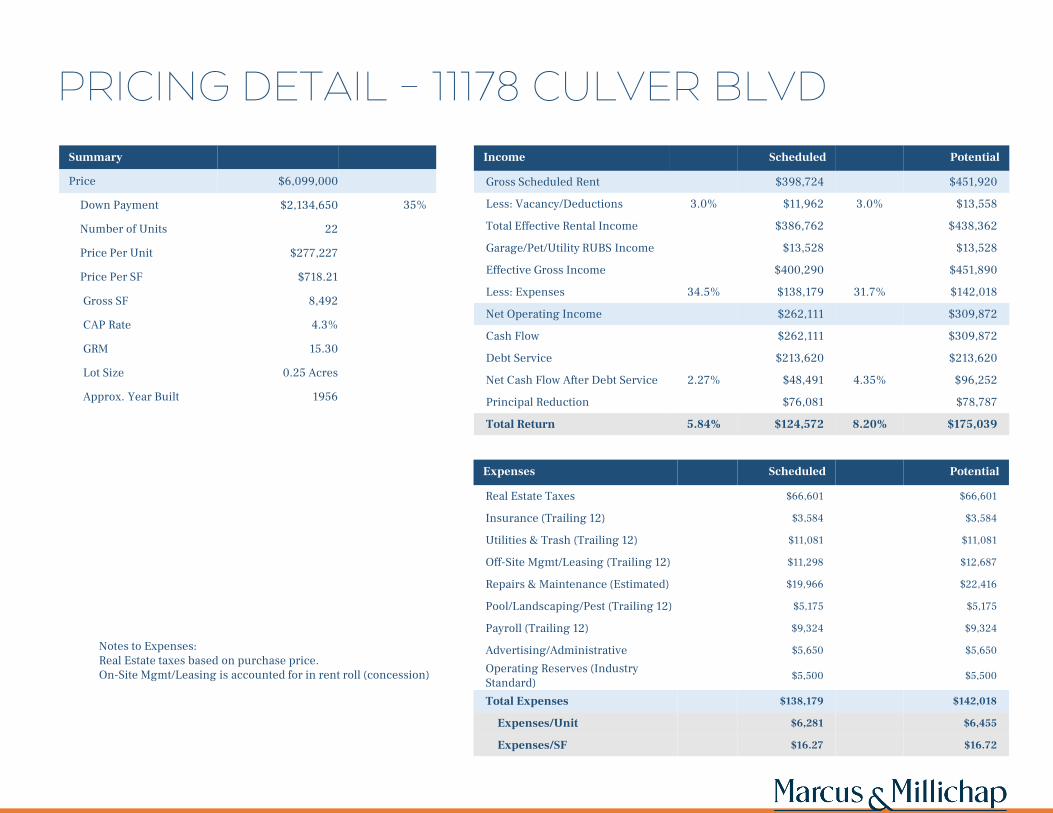
PRICING DETAIL – 11178 CULVER BLVDSummary
Price $6,099,000
Down Payment $2,134,650 35%
Number of Units 22
Price Per Unit $277,227
Price Per SF $718.21
Gross SF 8,492
CAP Rate 4.3%
GRM 15.30
Lot Size 0.25 Acres
Approx. Year Built 1956
Income Scheduled Potential
Gross Scheduled Rent $398,724 $451,920
Less: Vacancy/Deductions 3.0% $11,962 3.0% $13,558
Total Effective Rental Income $386,762 $438,362
Garage/Pet/Utility RUBS Income $13,528 $13,528
Effective Gross Income $400,290 $451,890
Less: Expenses 34.5% $138,179 31.7% $142,018
Net Operating Income $262,111 $309,872
Cash Flow $262,111 $309,872
Debt Service $213,620 $213,620
Net Cash Flow After Debt Service 2.27% $48,491 4.35% $96,252
Principal Reduction $76,081 $78,787
Total Return 5.84% $124,572 8.20% $175,039
Expenses Scheduled Potential
Real Estate Taxes $66,601 $66,601
Insurance (Trailing 12) $3,584 $3,584
Utilities & Trash (Trailing 12) $11,081 $11,081
Off-Site Mgmt/Leasing (Trailing 12) $11,298 $12,687
Repairs & Maintenance (Estimated) $19,966 $22,416
Pool/Landscaping/Pest (Trailing 12) $5,175 $5,175
Payroll (Trailing 12) $9,324 $9,324
Advertising/Administrative $5,650 $5,650
Operating Reserves (Industry Standard)
$5,500 $5,500
Total Expenses $138,179 $142,018
Expenses/Unit $6,281 $6,455
Expenses/SF $16.27 $16.72
Notes to Expenses: Real Estate taxes based on purchase price.On-Site Mgmt/Leasing is accounted for in rent roll (concession)

MARKET COMPARABLES

13
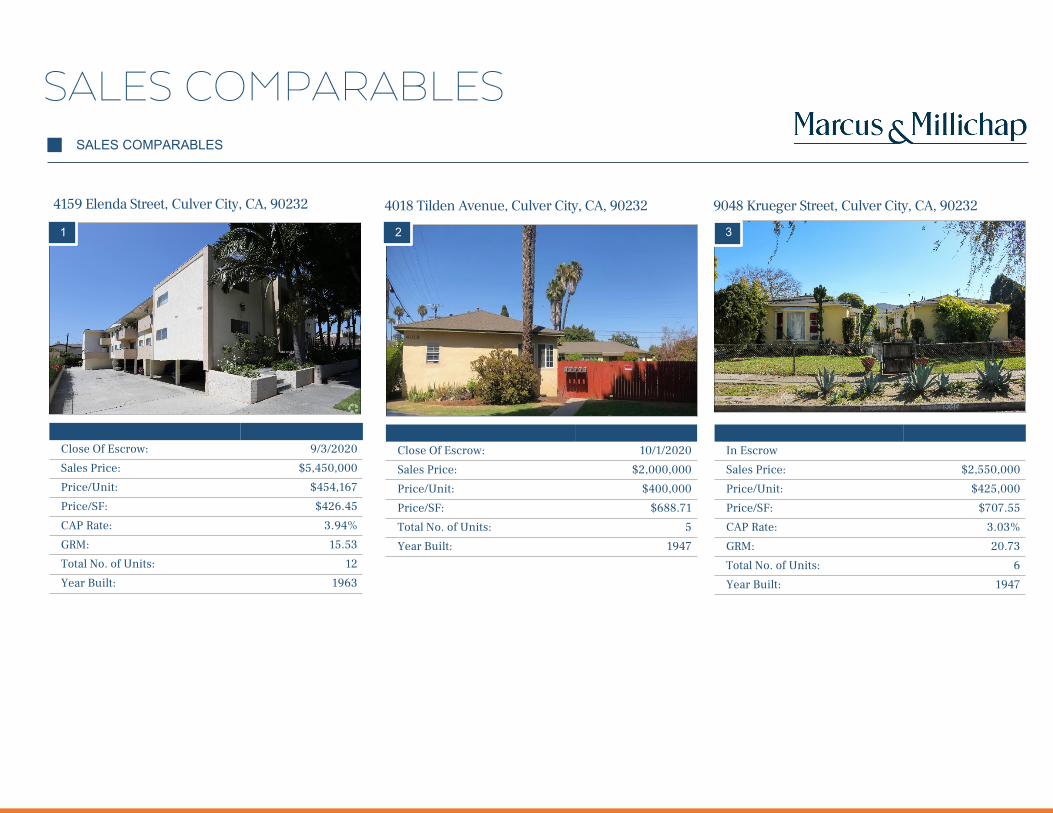
SALES COMPARABLES
1
2
3
4159 Elenda Street
4018 Tilden Avenue
9048 Krueger Street
11178 CULVER BLVD(SUBJECT)
rentpropertyaddress1 rentpropertyaddress1 rentpropertyaddress1
SALES COMPARABLES
1
Close Of Escrow: 9/3/2020
Sales Price: $5,450,000
Price/Unit: $454,167
Price/SF: $426.45
CAP Rate: 3.94%
GRM: 15.53
Total No. of Units: 12
Year Built: 1963
4159 Elenda Street, Culver City, CA, 90232
2
Close Of Escrow: 10/1/2020
Sales Price: $2,000,000
Price/Unit: $400,000
Price/SF: $688.71
Total No. of Units: 5
Year Built: 1947
3
4018 Tilden Avenue, Culver City, CA, 90232
SALES COMPARABLES
In Escrow
Sales Price: $2,550,000
Price/Unit: $425,000
Price/SF: $707.55
CAP Rate: 3.03%
GRM: 20.73
Total No. of Units: 6
Year Built: 1947
9048 Krueger Street, Culver City, CA, 90232
15
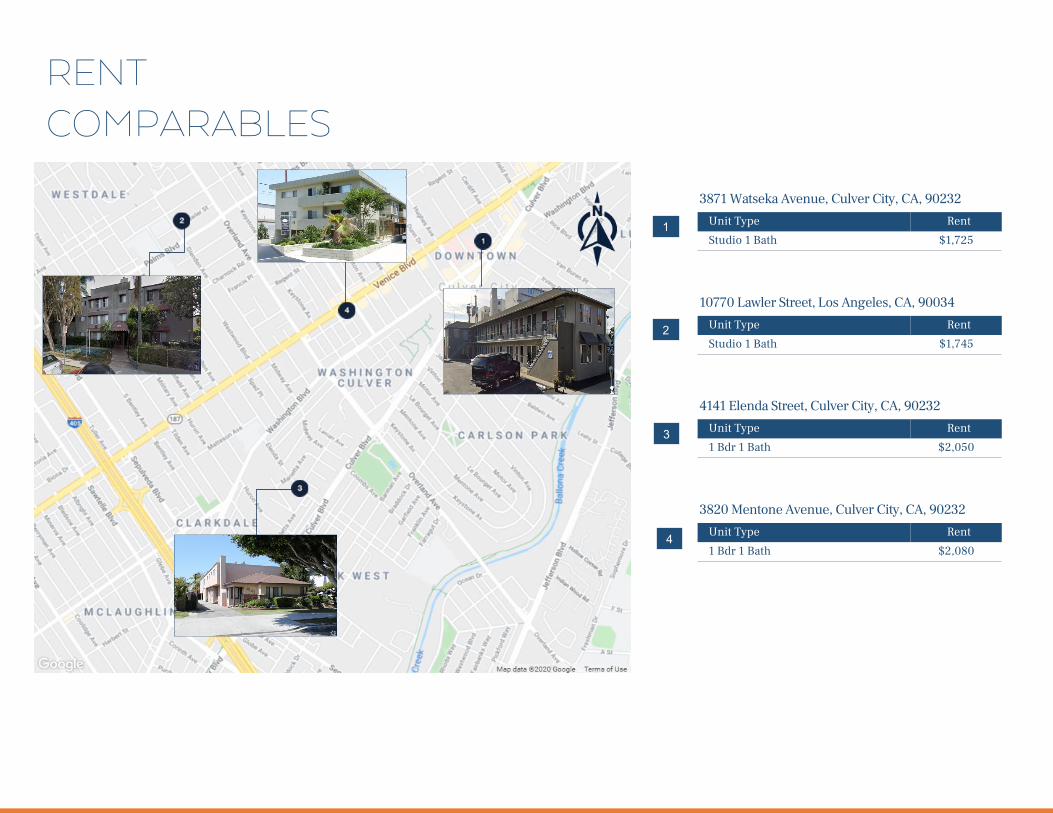
RENT COMPARABLES
Unit Type Rent
Studio 1 Bath $1,7251
3871 Watseka Avenue, Culver City, CA, 90232
Unit Type Rent
Studio 1 Bath $1,745
10770 Lawler Street, Los Angeles, CA, 90034
Unit Type Rent
1 Bdr 1 Bath $2,050
4141 Elenda Street, Culver City, CA, 90232
Unit Type Rent
1 Bdr 1 Bath $2,080
3820 Mentone Avenue, Culver City, CA, 90232
2
3
4
5

MARKET OVERVIEW
PROPERTY NAME
MARKETING TEAM
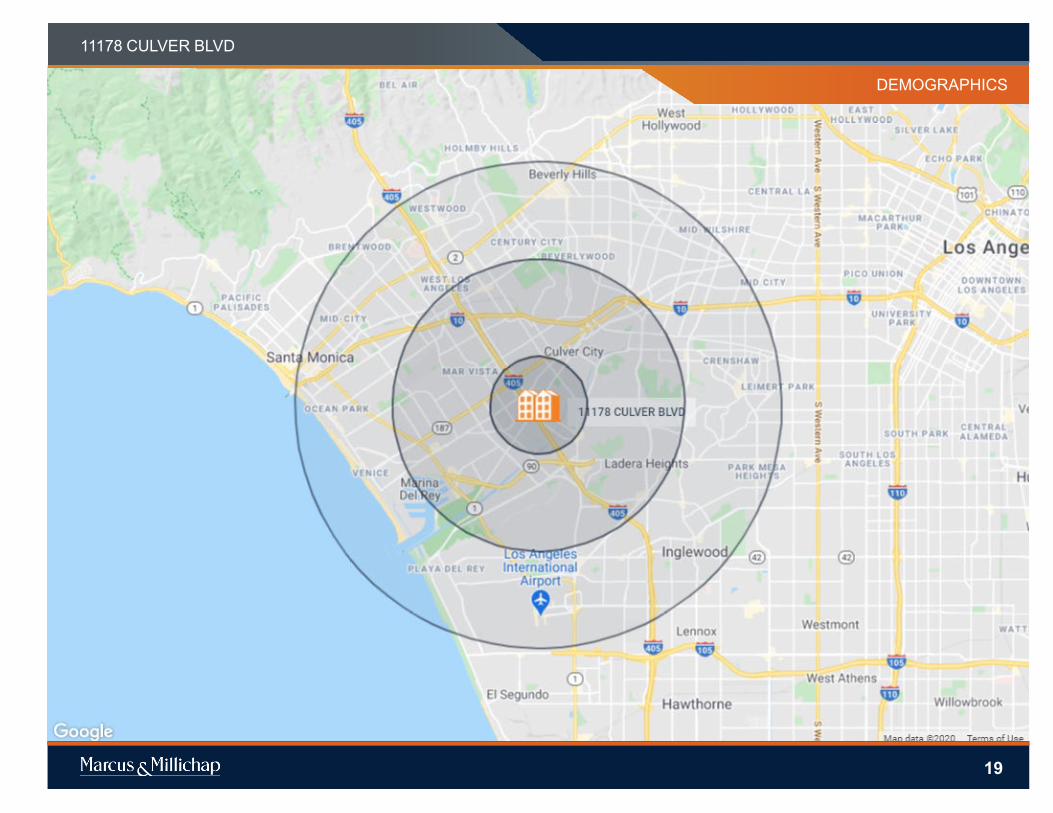
11178 CULVER BLVD
DEMOGRAPHICS
Source: © 2019 Experian
Created on October 2020
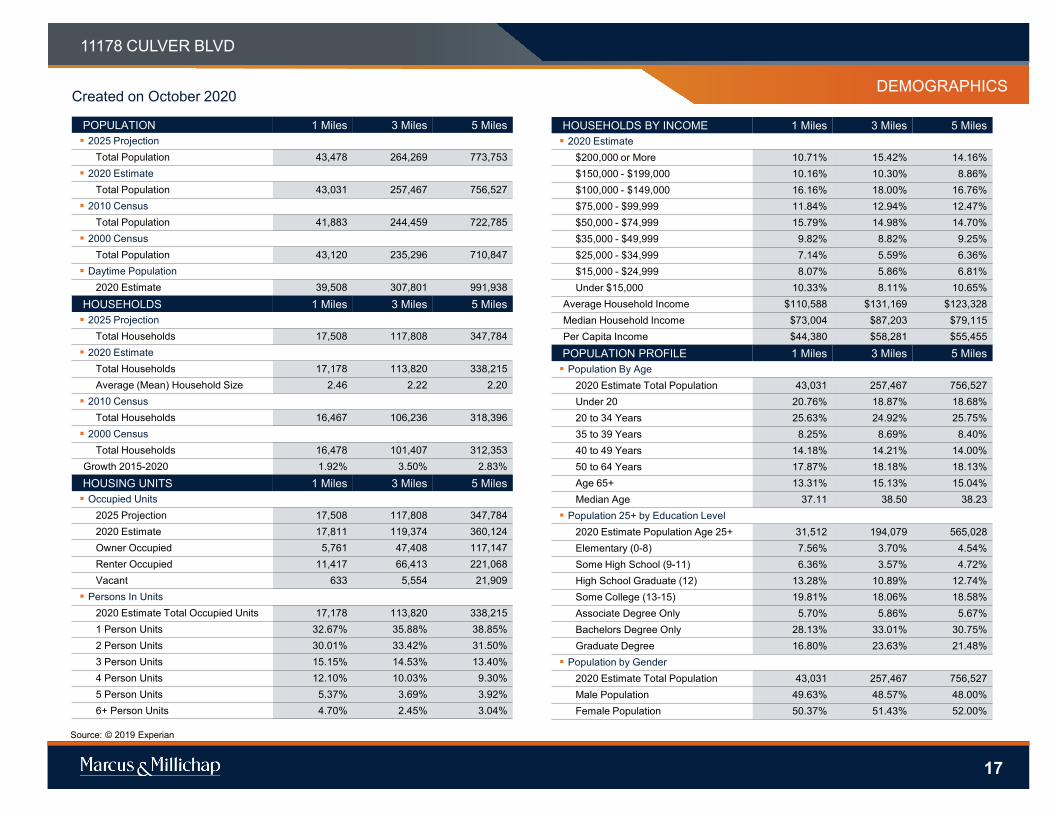
POPULATION 1 Miles 3 Miles 5 Miles 2025 Projection
Total Population 43,478 264,269 773,753 2020 Estimate
Total Population 43,031 257,467 756,527 2010 Census
Total Population 41,883 244,459 722,785 2000 Census
Total Population 43,120 235,296 710,847 Daytime Population
2020 Estimate 39,508 307,801 991,938HOUSEHOLDS 1 Miles 3 Miles 5 Miles 2025 Projection
Total Households 17,508 117,808 347,784 2020 Estimate
Total Households 17,178 113,820 338,215Average (Mean) Household Size 2.46 2.22 2.20
2010 CensusTotal Households 16,467 106,236 318,396
2000 CensusTotal Households 16,478 101,407 312,353
Growth 2015-2020 1.92% 3.50% 2.83%HOUSING UNITS 1 Miles 3 Miles 5 Miles Occupied Units
2025 Projection 17,508 117,808 347,7842020 Estimate 17,811 119,374 360,124Owner Occupied 5,761 47,408 117,147Renter Occupied 11,417 66,413 221,068Vacant 633 5,554 21,909
Persons In Units2020 Estimate Total Occupied Units 17,178 113,820 338,2151 Person Units 32.67% 35.88% 38.85%2 Person Units 30.01% 33.42% 31.50%3 Person Units 15.15% 14.53% 13.40%4 Person Units 12.10% 10.03% 9.30%5 Person Units 5.37% 3.69% 3.92%6+ Person Units 4.70% 2.45% 3.04%
HOUSEHOLDS BY INCOME 1 Miles 3 Miles 5 Miles 2020 Estimate
$200,000 or More 10.71% 15.42% 14.16%$150,000 - $199,000 10.16% 10.30% 8.86%$100,000 - $149,000 16.16% 18.00% 16.76%$75,000 - $99,999 11.84% 12.94% 12.47%$50,000 - $74,999 15.79% 14.98% 14.70%$35,000 - $49,999 9.82% 8.82% 9.25%$25,000 - $34,999 7.14% 5.59% 6.36%$15,000 - $24,999 8.07% 5.86% 6.81%Under $15,000 10.33% 8.11% 10.65%
Average Household Income $110,588 $131,169 $123,328Median Household Income $73,004 $87,203 $79,115Per Capita Income $44,380 $58,281 $55,455POPULATION PROFILE 1 Miles 3 Miles 5 Miles Population By Age
2020 Estimate Total Population 43,031 257,467 756,527Under 20 20.76% 18.87% 18.68%20 to 34 Years 25.63% 24.92% 25.75%35 to 39 Years 8.25% 8.69% 8.40%40 to 49 Years 14.18% 14.21% 14.00%50 to 64 Years 17.87% 18.18% 18.13%Age 65+ 13.31% 15.13% 15.04%Median Age 37.11 38.50 38.23
Population 25+ by Education Level2020 Estimate Population Age 25+ 31,512 194,079 565,028Elementary (0-8) 7.56% 3.70% 4.54%Some High School (9-11) 6.36% 3.57% 4.72%High School Graduate (12) 13.28% 10.89% 12.74%Some College (13-15) 19.81% 18.06% 18.58%Associate Degree Only 5.70% 5.86% 5.67%Bachelors Degree Only 28.13% 33.01% 30.75%Graduate Degree 16.80% 23.63% 21.48%
Population by Gender2020 Estimate Total Population 43,031 257,467 756,527Male Population 49.63% 48.57% 48.00%Female Population 50.37% 51.43% 52.00%
17
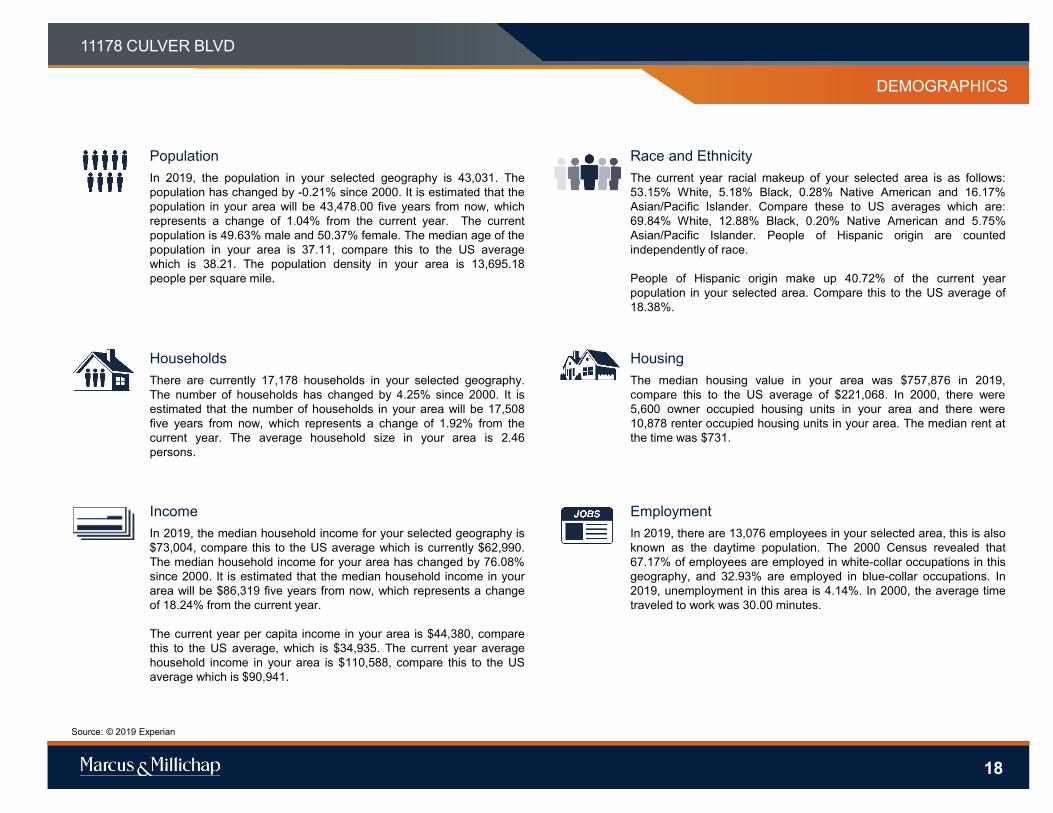
IncomeIn 2019, the median household income for your selected geography is$73,004, compare this to the US average which is currently $62,990.The median household income for your area has changed by 76.08%since 2000. It is estimated that the median household income in yourarea will be $86,319 five years from now, which represents a changeof 18.24% from the current year.
The current year per capita income in your area is $44,380, comparethis to the US average, which is $34,935. The current year averagehousehold income in your area is $110,588, compare this to the USaverage which is $90,941.
PopulationIn 2019, the population in your selected geography is 43,031. Thepopulation has changed by -0.21% since 2000. It is estimated that thepopulation in your area will be 43,478.00 five years from now, whichrepresents a change of 1.04% from the current year. The currentpopulation is 49.63% male and 50.37% female. The median age of thepopulation in your area is 37.11, compare this to the US averagewhich is 38.21. The population density in your area is 13,695.18people per square mile.
HouseholdsThere are currently 17,178 households in your selected geography.The number of households has changed by 4.25% since 2000. It isestimated that the number of households in your area will be 17,508five years from now, which represents a change of 1.92% from thecurrent year. The average household size in your area is 2.46persons.
EmploymentIn 2019, there are 13,076 employees in your selected area, this is alsoknown as the daytime population. The 2000 Census revealed that67.17% of employees are employed in white-collar occupations in thisgeography, and 32.93% are employed in blue-collar occupations. In2019, unemployment in this area is 4.14%. In 2000, the average timetraveled to work was 30.00 minutes.
Race and EthnicityThe current year racial makeup of your selected area is as follows:53.15% White, 5.18% Black, 0.28% Native American and 16.17%Asian/Pacific Islander. Compare these to US averages which are:69.84% White, 12.88% Black, 0.20% Native American and 5.75%Asian/Pacific Islander. People of Hispanic origin are countedindependently of race.
People of Hispanic origin make up 40.72% of the current yearpopulation in your selected area. Compare this to the US average of18.38%.
PROPERTY NAME
MARKETING TEAM
11178 CULVER BLVD
HousingThe median housing value in your area was $757,876 in 2019,compare this to the US average of $221,068. In 2000, there were5,600 owner occupied housing units in your area and there were10,878 renter occupied housing units in your area. The median rent atthe time was $731.
Source: © 2019 Experian
DEMOGRAPHICS
18
8
11178 CULVER BLVD
DEMOGRAPHICS
19

20