CULTURALLY APPROPRIATE HYPERTENSION EDUCATION FOR …
115
CULTURALLY APPROPRIATE HYPERTENSION EDUCATION FOR HAITIAN IMMIGRANTS: A COMMUNITY- AND FAITH-BASED HEALTH PROMOTION PROGRAM Lunise Benjamin A project submitted to the faculty at the University of North Carolina at Chapel Hill in partial fulfillment of the requirements for the degree of Doctor of Nursing Practice in the School of Nursing. Chapel Hill 2017 Approved by: Jean Ann Davison Rumay Alexander Carol Baker
Transcript of CULTURALLY APPROPRIATE HYPERTENSION EDUCATION FOR …

CULTURALLY APPROPRIATE HYPERTENSION EDUCATION FOR HAITIAN
IMMIGRANTS: A COMMUNITY- AND FAITH-BASED HEALTH PROMOTION
PROGRAM
Lunise Benjamin
A project submitted to the faculty at the University of North Carolina at Chapel Hill in partial
fulfillment of the requirements for the degree of Doctor of Nursing Practice in the School of
Nursing.
Chapel Hill
2017
Approved by:
Jean Ann Davison
Rumay Alexander
Carol Baker

ii
© 2017
Lunise Benjamin
ALL RIGHTS RESERVED
iii
ABSTRACT
Lunise Benjamin: Culturally Appropriate Hypertension Education for Haitian
Immigrants: A Community and Faith-based Health Promotion Program
(Under the direction of Jean Davison)
Background: In the U.S., African-American adults have an increased risk than other
races of developing hypertension and suffering from the sequela associated with elevated blood
pressure. Haitian immigrants are often classified as 'AA’, however all Blacks are not the same.
Due to cultural and historical differences, Haitians may define and manage their hypertension
differently from other AA. Few studies have been published on hypertension in this minority
population. Exploration is warranted to determine knowledge about hypertension and its self-
management in the U.S. Haitian immigrant population.
Purpose: This DNP project had a dual purpose to: 1) examine Haitian immigrants’
understanding of hypertension and determine whether cultural differences affected their disease
management, and 2) to implement a culturally-appropriate self-management course at a faith-
based organization in central North Carolina using evidence-based hypertension guidelines.
Information gathered from a multi-faceted Needs Assessment was used to construct culturally-
tailored classes focused on hypertensive illness, self-management and creation of lifestyle-
altering goal.
Methods: A “Needs Assessment” was completed by 23 adult Haitian men and women,
with 11 giving one-on-one interviews. Four educational sessions about hypertension and
modifiable risk factors were taught using a Hypertension Toolkit over a period of 3 months Pre-

iv
and post-tests measured participants’ increase of knowledge. Each session included time for
participants to set a Specific, Measureable, Attainable, Realistic and Timely (SMART) goal.
Four weeks follow-up with goal-setting assessed participants’ individual goal attainment.
Results: The Needs Assessment measured knowledge gaps regarding cardiovascular
accidents, dietary changes, and physical activity. Post-test scores for three of the four sessions
showed a statistically significant increase (p <0.05) in knowledge. SMART goals were set at the
completion of three of the four sessions, and a positive Goal Attainment Scale score was
achieved for two of those sessions.
Conclusion/ Implications: The outcome of the completed program supported previous
evidence that a culturally-based educational program was well-received by the immigrant
population and showed a significant increase in knowledge of hypertension self-management.
Small sample size, inadequate retention, and sample attrition were three limitations to this
project. Future projects should consider using advanced registration and longer sessions to
improve participation over time.
KEYWORDS: Haitian immigrants, hypertension, self-management education, culturally-
competent care, SMART goals

v
To my mother. Because of you, I am able.
vi
ACKNOWLEDGEMENTS
Proper recognition must be given to my parents, Jean-Claude Benjamin and Marie
Dinette Benjamin. My mother arrived to the United States of America from Haiti in the mid
1980’s on a travel visa with the intentions to receive permanent residence. She believed that a
life in the U.S. would benefit her children much more than a life in her native country.
Although her visa expired a few months after her arrival, she stayed. My father followed her to
the U.S. shortly thereafter, ‘smuggled’ into the country from Canada on the back of a semi-
truck. Both of them left everything in Haiti: friends, security and their two older children, in
order to work and assure a better future for their family. Over the following years, they faced
retribution and the possibility of deportation, yet they fought the system, and were finally granted
a permanent resident status in 1992. This project, my career, and my accomplishments would
not have been possible without the sacrifices those two immigrants made. My gratitude extends
far beyond the completion of this project. I am aware this project is a small accomplishment
relative to the healthcare needs of the Haitian people. Yet, I would be remorseful if I was not to
acknowledge them.
Thank you to my chair and committee, three amazing women who turned my nothing
idea into a detailed doctoral project. A few had doubts with my topic and urged me to change
my topic, focus and population. These women did not. They put in more hours than necessary
to make sure this project was completed at a scholarly level. Dr. Davison, Dr. Baker, Dr.
Alexander, I would not have been able to do this without you all. I would also like to extend a
vii
large amount of gratitude to my support system, one that extends state borders.
Throughout the course of this project, I had friends that encouraged me every step of the way.
They refused to give up on me when I saw no reason to continue. They spent hours sharing
words of encouragement, relevant bible verses, and at times, talking me off an allegorical ledge.
Many thanks to you all.
Finally, thank you my Lord and Savior, Jesus Christ. His plans for me were far greater
than I could have ever imagined. I would not have been able to be transformed from a (jobless,
hopeless, new graduate nurse to a doctorally-prepared nurse practitioner in four years without
His grace, His mercy and His unfailing love. My progress is proof of His amazing effect on my
life and those that have faith in Him.
Merci,
Lunise

viii
TABLE OF CONTENTS
LIST OF TABLES ............................................................................................................ xii
LIST OF FIGURES ......................................................................................................... xiii
LIST OF ABBREVIATIONS ........................................................................................... xv
CHAPTER 1: INTRODUCTION ....................................................................................... 1
CHAPTER 2: REVIEW OF LITERATURE ...................................................................... 4
CHAPTER 3: CONCEPTUAL AND THEORETICAL FRAMEWORK........................ 23
CHAPTER 4: METHODOLOGY .................................................................................... 26
CHAPTER 5: PROJECT DESIGN ................................................................................... 28
CHAPTER 6: ETHICAL CONSIDERATIONS .............................................................. 30
CHAPTER 7: HYPERTENSION TOOL KIT .................................................................. 31
CHAPTER 8: NEEDS ASSESSMENT ............................................................................ 32
Tools .......................................................................................................................................... 32
Analysis Plan ............................................................................................................................. 33
Procedure ................................................................................................................................... 33
Results ........................................................................................................................................ 35
CHAPTER 9: EDUCATIONAL COURSE ...................................................................... 45

ix
Tools .......................................................................................................................................... 45
Analysis Plan ............................................................................................................................. 47
Procedure ................................................................................................................................... 48
Results ........................................................................................................................................ 51
CHAPTER 10: DISCUSSION .......................................................................................... 61
CHAPTER 11: LIMITATIONS ....................................................................................... 69
CHAPTER 12: SUGGESTIONS FOR FURTHER RESEARCH .................................... 71
CHAPTER 13: CONCLUSION ....................................................................................... 73
Appendix A - IRB Statement ............................................................................................ 74
Appendix B - Health and Demographic Survey .............................................................. 75
Appendix C - Interview Questions ................................................................................... 78
Appendix D - "What is High Blood Pressue" ................................................................... 79
Appendix E - Session 1 Quiz ............................................................................................ 81
Appendix F - "Food, Salt and Hypertension" ................................................................... 82
Appendix G - Session 2 Quiz............................................................................................ 84
Appendix H - "Physical Activity, Weight Management and Hypertension" ................... 85
Appendix I - Session 3 Quiz ............................................................................................ 87
Appendix J - "Medication Management and Symptom Recognition" .............................. 88
Appendix K - Session 4 Quiz............................................................................................ 90
Appendix L - Goal evaluation form .................................................................................. 91

x
Appendix M - Post course survey .................................................................................... 92
References ......................................................................................................................... 93

xi
LIST OF TABLES
Table 8.1 - Blood Pressure Descriptive Statistics ............................................................ 44
Table 9.1 - Educational Session Outline .......................................................................... 50
Table 9.2 - Session Attendees .......................................................................................... 51
Table 9.3- Session 1: Test Comparison ............................................................................ 52
Table 9.4 - Session 1: T-Test Results ............................................................................... 52
Table 9.5 - Session 2: Test Comparison .......................................................................... 55
Table 9.6 - Session 2: T-Test Results .............................................................................. 55
Table 9.7 - Session 3: Test Comparison ........................................................................... 57
Table 9.8 - Session 3: T-Test Results ............................................................................... 57
Table 9.9 - Session 4: Test Comparison ........................................................................... 59
Table 9.10 - Session 4: T-Test Results ........................................................................... 59
Table 10.1 - Four hypertensive patients ........................................................................... 63
Table 10.2 - Comparison of full course participants ........................................................ 66

xii
LIST OF FIGURES
Figure 8.1 - DHS: Gender ................................................................................................. 36
Figure 8.2 - DHS: Place of Birth ...................................................................................... 36
Figure 8.3 - DHS: Age Groups ......................................................................................... 36
Figure 8.4 - DHS: Year of Migration................................................................................ 36
Figure 8.5 - DHS: Highest Level of Education Completed .............................................. 37
Figure 8.6 - DHS: Employment Rate ................................................................................ 37
Figure 8.7 - DHS: Yearly Income Level ........................................................................... 38
Figure 8.8 - DHS: Type of Insurance................................................................................ 38
Figure 8.9 - DHS: Have a HTN Prescription .................................................................. 39
Figure 8.10 - DHS: Using HTN Medication ..................................................................... 39
Figure 8.11 - DHS: Current Reported Diagnosis .............................................................. 39
Figure 8.12 - DHS: Beliefs Regarding BP ....................................................................... 40
Figure 8.13 - DHS: Percentage of Respondents who Exercise ......................................... 41
Figure 8.14 - DHS: BMI Category ................................................................................... 42
Figure 8.15 - DHS: Blood Pressure Measurements ......................................................... 44
Figure 9.1 - Session 1: Question results ........................................................................... 52
Figure 9.2 - Session 1: 4 Week GAS Follow-up ............................................................. 53
Figure 9.3 - Session 2: Question Results ......................................................................... 54
Figure 9.4 - Session 2: 4 Week GAS Follow-up .............................................................. 56
Figure 9.5 - Session 3: Question Results ......................................................................... 57
Figure 9.6 - Session 3: 4 Week GAS Follow-up .............................................................. 58
Figure 9.7 - Session 4: Question Results ......................................................................... 59

xiii
Figure 9.8 - Post Session Surveys .................................................................................... 60

xiv
LIST OF ABBREVIATIONS
AHA American Heart Association
BP Blood Pressure
CDC Centers for Disease Control and Prevention
CHO Community Health Outreach
DHS Demographic Health Survey
GAS Goal Attainment Scale
HTN Hypertension
SMART Specific, Measurable, Acceptable, Realistic Time-bound
U.S. United States

1
Chapter 1: Introduction
Thirty-three percent of adults in the United States (U.S.), about eighty-five million
people, are currently diagnosed with high blood pressure (American Heart Association [AHA],
2014a). African-Americans and those who identify as Black have an increased risk of
developing hypertension (HTN) and suffering from the sequela associated with elevated blood
pressure (BP), such as stroke, kidney disease, and heart disease, when compared to other racial
groups (AHA, 2014a). Of the one-third of adults in the U.S. diagnosed with high blood
pressure, 41% are members of the non-Hispanic Black community (Centers for Disease Control
and Prevention [CDC], 2015b).
In the U.S., Haitians are more often associated with African-Americans than other
Caribbean ethnicities, both in the general and demographic sense. Haitians are currently one of
the fastest-growing immigrant populations in the U.S. (Lubetkin et al., 2015), the fourth largest
immigrant population claiming a Caribbean country as their birthplace, and the second largest
black immigrant population in the U.S. (Sanon, Mohammed, & McCullagh, 2014; Sanon,
Spigner, & McCullagh, 2016). Distinct cultural and historical differences may lead to Haitians
defining and managing HTN differently, though, from the rest of the American Black population
(Sanon et al., 2014). No exact data regarding the prevalence of HTN in Haitian immigrants
currently exists; however, the World Health Organization (WHO) classifies approximately 60%
of adult Haitians living in Haiti as hypertensive (WHO, 2015). Researchers continue to
investigate the causes of the increased rate of HTN among the Black population (AHA, 2014b),

2
as well as possible improvements for the management of the disease (Connell, Wolfe, &
McKevitt, 2008). Despite these ongoing studies, HTN prevalence and management in Haitian
immigrants remains a largely unexplored area of research. The needs of this unique immigrant
group continue to be unnoticed in literature regarding hypertension management due to the
tendency to associate Haitians with the African-American culture.
Problem Statement
The risk of HTN for Haitian immigrants stems from a variety of unique risk factors, such
as lifestyle choices, pressures arising from immigration and assimilation into a new culture, and
reduced awareness of the onset of the disease, coupled with a higher susceptibility due to their
African ancestry. The prevalence of HTN has negatively impacted the overall health of the
Haitian immigrant population in the U.S., as they continue to have an increased rate of sequela
associated with the poor management of the disease. Potential causes may be the lack of
information available regarding Haitian preferences for managing HTN or providers’ inability to
communicate with Haitian patients due to a language barrier. A culturally-appropriate, group-
based educational program for Haitian immigrants, one that aims to increase the knowledge of
modifiable risk factors and assists individuals in setting their own health goals, may improve
overall management of the disease among this population.
Purpose of the Project
This project had a dual purpose: first, to examine Haitian immigrants’ understanding of
HTN and determine whether cultural distinctions exist within their management choices, and
second, to implement a culturally-appropriate self-management course at a faith-based
organization in central North Carolina using evidence-based HTN guidelines. The information

3
gathered from a multi-faceted Needs Assessment of the participants was used to create a self-
management course focused on HTN, specifically tailored to their cultural background. At the
completion of this educational group intervention, the goals for the participants were as follows:
1. demonstrate an increased knowledge of the causes of hypertension;
2. use culturally relevant, evidence-based self-management tools to reduce their modifiable
risk factors regarding diet, physical activity, medications, and weight management; and
3. initiate the development of specific, measurable, attainable, realistic, and timely
(SMART) goal-setting behaviors that they can employ on a daily basis to reduce their
symptoms.
Clinical Practice Question
Will culturally-appropriate HTN educational information and self-management tools
increase Haitian immigrants’ general knowledge of the disease, as well as provide skills for those
affected with HTN to create SMART goals?

4
Chapter 2: Review of Literature
Problem of Hypertension
Hypertension and cardiovascular diseases (CVDs) are not just American epidemics.
Worldwide, one in three adults are diagnosed with HTN annually (WHO, 2016), matching the
current rate of diagnosis in the U.S. (CDC, 2015). CVDs, such as myocardial infarctions and
stroke, are currently the number one killers globally, accounting for 17.5 million deaths a year,
or 31% of total global deaths (WHO, 2016). High blood pressure (BP), one of the most
recognizable and prevalent precursors to CVDs, is classified as a systolic BP greater than or
equal to 140 mm Hg or diastolic BP greater than or equal to 90 mm Hg (AHA, 2016b,
Chobanian et al., 2003; James et al., 2014). According to the CDC, 33% of U.S. adults are
currently diagnosed with high BP, but only half of that group claims to have their BP under
control (i.e., a sustained BP reading under 140/90) (CDC, 2015b). Poorly managed or untreated
BP has repeatedly been shown to increase the risk of further detrimental or chronic diseases such
as heart attacks, strokes, and kidney disease (AHA, 2014a). Heart disease remains the leading
cause of death in the U.S., accounting for one in four deaths annually (CDC, 2015b), and HTN
is the leading cause of strokes—which ranks as the fifth leading cause of death and disability in
the adult American population (American Stroke Association, 2015). Approximately 20 million
adults in the U.S. (10% of the population) have a varying degree of chronic kidney disease, with
the National Center for Chronic Disease Prevention and Health Promotion estimating

5
approximately 28% of new kidney disease diagnoses resulting from uncontrolled HTN
(National Center for Chronic Disease Prevention and Health Promotion, 2014).
The risks of HTN and CVD also increase with age and race. In a 2015 data brief
published by the CDC, researchers discovered a 23.1% age-adjusted increase of HTN-related
deaths in the U.S. In adults over 45, the number of deaths increased from 255.1 per 100,000 in
2000 to 314.1 per 100,000 in 2013 (CDC, 2015b). The highest prevalence of HTN in a
demographic group in the U.S. is among non-Hispanic Blacks (AHA, 2014b; CDC, 2015b),
with approximately 42.1% of non-Hispanic Black adults holding a HTN diagnosis and having a
higher mortality rate resulting from it compared to their non-Hispanic white counterparts (CDC,
2015b). The non-Hispanic Black population also has the highest rate of morbidity due to
coronary heart disease—124.9 deaths per 100,000 compared to 109.2 deaths among the general
American population (U.S. Department of Health and Human Services, 2015b).
Modifiable Risk Factors for Hypertension Management
The AHA lists several risk factors, both modifiable and non-modifiable, behind the
development of HTN (AHA, 2014b). Non-modifiable risk factors are factors not under the
patient’s control, such as family history, race, gender, and age. Groups with non-modifiable risk
factors that are at the highest risk for developing HTN are Black males over the age of 45 and
adults with a parent or blood relative diagnosed with HTN. Other risk factors, such as a
sedentary lifestyle, an unhealthy diet, and obesity, are recognized as modifiable risk factors for
HTN development. It has been shown that physical activity supports healthy cardiac function,
and therefore those with an inactive lifestyle are more likely to have high BP (Borjesson,
Onerup, Lundqvist, & Dahlof, 2016). Couple a high-caloric, salt-laden diet with inactivity and

6
there is an increased risk of obesity along with HTN. Though research has yet to fully confirm
stress and smoking as risk factors for HTN, the AHA recommends proper management of one’s
stress level and cessation of tobacco use to reduce susceptibility (AHA, 2014b). Panel members
of the Eighth National Joint Committee continued to stress the importance of a “healthy diet,
weight control, and regular exercise” in their most recent meeting (James et al., 2014).
Researchers have acknowledged these modifiable risk factors by developing clinical trials
and educational programs targeting people exhibiting them (Hinderliter et al., 2014; Obarzanek
et al., 2007). The data in a systematic review analyzing studies pertaining to behavioral changes
in diet and increased physical activity support the notion that lessening the impact of these risk
factors will significantly decrease systolic and diastolic BPs (Bacon, Sherwood, Hinderliter, &
Blumenthal, 2004). The effectiveness of behavior modification on BP control in African-
Americans has been tested during a multicenter randomized trial, known as the PREMIER study
(Obarzanek et al., 2007; Artinian et al., 2010). Testing the effects of lifestyle modifications in
hypertensive patients, the results of the PREMIER study implicated a significant reduction in
African-American participants’ HTN after dietary and physical activity interventions. Positive
outcomes from these trials provide credence to the importance of developing a program focused
on non-modifiable risk factors for the Haitians immigrant population.
Stress Management
Evidence has shown that physiological and psychological stress may also be important
contributors to the onset of HTN (AHA, 2014b; Schneider et al., 2005). Findings have shown
significant decreases in BP in patients following stress-reduction interventions, such as
relaxation and mediation or prayer (Rainforth et al., 2007). Specific studies focusing on African-
Americans have identified stress as a modifiable factor that increases the occurrence of HTN

7
among this demographic group (Barnes, Schneider, Alexander, & Staggers, 1997), and they
discussed its role in the overall health decline of African-Americans (Thorpe et al., 2016).
The long-term effects of stress management in HTN treatment have been, and continue to
be, analyzed. The most utilized long-term method for stress management is the Transcendental
Meditation method, requiring the participant to sit in a quiet, wakeful metabolic state for 20
minutes per day. A study employing this method among African-American subjects saw an
overall average decrease of 3.52 mm Hg in systolic BP during the 12-month follow-up
(Schneider et al., 2005). An additional study found a 10 mm Hg decrease of systolic BP in
African-American men and women aged 35–55 after a 3-month follow-up (Barnes et al., 1997).
Despite research clearly being performed in this area, little research literature has been published
about the effect of stress contributing to HTN in the Haitian immigrant population. In a study
focused on the level of perceived stress between African-Americans and Haitians, Fatma and
colleagues used the Perceived Stress Scale and found that Haitian-Americans have a higher level
of perceived stress when compared to their African-American counterparts (Fatma et al., 2013).
However, little research has compared the relationship between this higher perceived stress level
among Haitians and its effects on their predisposition to high BP and CVDs. While the evidence
concerning the relationship between stress reduction and its effect on decreasing BP continues to
be evaluated, this DNP project recognizes the relationship’s importance and discussed stress
reduction during the course of the project.
Prayer and Stress Management. The role of religion and spirituality in healthcare and
the healing process has garnered scientific attention over the past few decades. Dr. Koenig
assessed a comparison of interventions between religion and non-religious persons, as well as the
effect of prayer, in a 2015 review. The physician and his team reviewed 3,300 articles to assess

8
the influence of prayer and religion in regards to multiple health concerns. When separated into
specific categories, Koenig and colleagues reviewed 37 articles discussing physical activity/
exercise, 18 articles regarding a consistent healthy diet, and 299 articles about anxiety and stress.
The review team noted that religious persons reported greater rates of physical activity, better
compliance with a healthy diet, and lower rates of anxiety/stress (Koenig, 2015).
A few studies in the review also studied the relationship between prayer and the
prevalence of coronary heart disease. Thirteen of the 19 studies (69%) in the review regarding
coronary heart diseases found an inverse relationship between religious persons and the reported
prevalence of coronary heart disease: the more religious the subject, the lower the prevalence of
the disease. This review’s findings support this faith-based project’s incorporation of prayer to
help with anxiety/stress reduction, increased compliance to healthy diet, and increased rates of
physical activity with the goal of improved outcomes in cardiovascular disease.
Dietary Modification
Since the AHA identified increased sodium intake as a risk factor for HTN (AHA,
2014b), many studies have analyzed the effects of decreased sodium levels in hypertensive
patients. A meta-analysis of randomized controlled trials concluded that hypertensive patients
showed a decrease in systolic/diastolic BP by 5/3 mm Hg, respectively, after reducing their salt
intake to 4.4 grams a day (approximately 1,716 mg of sodium), and normotensive patients
exhibited a decrease of 2/1 mm Hg (Ndanuko, Tapsell, Charlton, Neale, & Batterham, 2016).
However, it is important to note that this meta-analysis did not separate the results into racial
subgroups, which may affect the interpretability of the data when applying it to a specific
demographic group. Researchers from the Exercise and Nutritional Interventions for
Cardiovascular Health (ENCORE) study saw an overall drop of 11.2 mm Hg in systolic BP in

9
participants who modified their eating habits using the Dietary Approaches to Stop Hypertension
(DASH) method (Epstein et al., 2012), a dietary plan rich in fruits, vegetables, and low-fat or
non-fat dairy. The DASH method also recommends lean meats and whole grains and follows the
U.S. dietary recommendation of 2,300 mg of sodium a day. Meanwhile, the National Heart,
Lung and Blood Institute suggests lowering daily salt intake to below 1,500 mg a day for a
greater impact on lowering BP.
African-Americans, specifically African-American women, have been found to be less
compliant than other ethnic groups to the dietary modifications suggested by such research
(Svetkey et all., 2004); however, a consensus statement released by the International Society of
Hypertension in Blacks asserted that when dietary modifications are followed, blood pressure
reduction in Blacks was similar with their white counterparts (Stuart-Shor, Berra, Kamau, &
Kumanyika, 2012). Though they did not propose specific solutions to the issue, modifying the
recommendations to be more culturally sensitive and meet the needs of minority populations
would assist in reaching these groups.
Weight Management and Physical Activity
Obesity is one of the strongest modifiable risk factors for developing HTN. Obesity is
defined as a body mass index (BMI) over 30 kg/m2, and overweight is defined as a BMI between
25 and <30 kg/m2 (Chobanian et al., 2003; CDC, 2016). Research suggests the increased rate of
obesity within the U.S. is positively related to the increase of HTN diagnoses (Neter, Stam, Kok,
Grobbee, & Geleijnse, 2003; AHA, 2016a). Unsurprisingly, the effects of weight loss and
physical activity on hypertensive patients have been a focus of research over the past two
decades. A 2003 meta-analysis estimated the physiological effect of weight loss in hypertensive
10
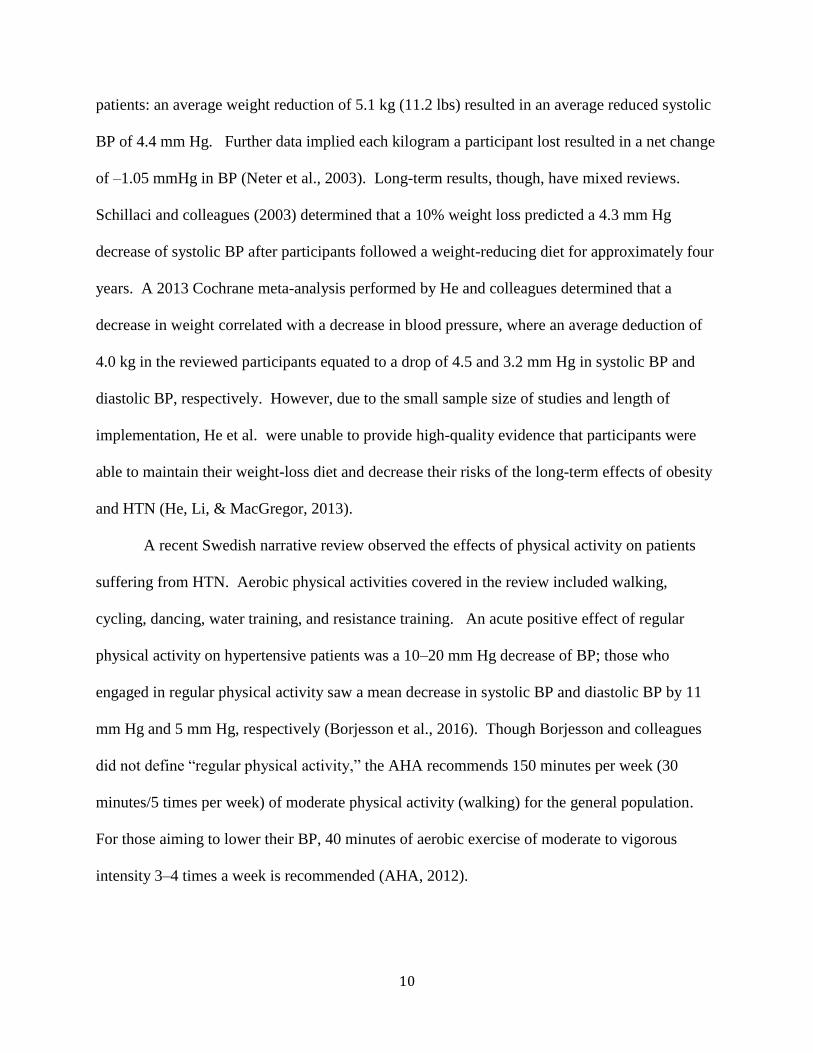
patients: an average weight reduction of 5.1 kg (11.2 lbs) resulted in an average reduced systolic
BP of 4.4 mm Hg. Further data implied each kilogram a participant lost resulted in a net change
of –1.05 mmHg in BP (Neter et al., 2003). Long-term results, though, have mixed reviews.
Schillaci and colleagues (2003) determined that a 10% weight loss predicted a 4.3 mm Hg
decrease of systolic BP after participants followed a weight-reducing diet for approximately four
years. A 2013 Cochrane meta-analysis performed by He and colleagues determined that a
decrease in weight correlated with a decrease in blood pressure, where an average deduction of
4.0 kg in the reviewed participants equated to a drop of 4.5 and 3.2 mm Hg in systolic BP and
diastolic BP, respectively. However, due to the small sample size of studies and length of
implementation, He et al. were unable to provide high-quality evidence that participants were
able to maintain their weight-loss diet and decrease their risks of the long-term effects of obesity
and HTN (He, Li, & MacGregor, 2013).
A recent Swedish narrative review observed the effects of physical activity on patients
suffering from HTN. Aerobic physical activities covered in the review included walking,
cycling, dancing, water training, and resistance training. An acute positive effect of regular
physical activity on hypertensive patients was a 10–20 mm Hg decrease of BP; those who
engaged in regular physical activity saw a mean decrease in systolic BP and diastolic BP by 11
mm Hg and 5 mm Hg, respectively (Borjesson et al., 2016). Though Borjesson and colleagues
did not define “regular physical activity,” the AHA recommends 150 minutes per week (30
minutes/5 times per week) of moderate physical activity (walking) for the general population.
For those aiming to lower their BP, 40 minutes of aerobic exercise of moderate to vigorous
intensity 3–4 times a week is recommended (AHA, 2012).

11
Medication Adherence and Symptom Notification
Two life-threatening consequences that can directly result from poorly managed BP are
heart attack and stroke. While these conditions are two of the top five leading causes of death in
the U.S. (CDC, 2015b), proper adherence to medications and awareness of warning signs mark
them as some of the more preventable and treatable conditions affecting Americans.
Among the African-American population, non-adherence to prescribed medications is
considered one of the top reasons for poorly managed BP (Solomon, Schoenthaler, Seixas,
Ogedegbe, Jean-Louis & Lai, 2015). Researchers found that African-American patients who had
consistent medication routines (i.e., taking their medications at the same time every day) had an
increased rate of medication adherence, and, in turn, showed a decrease in systolic and diastolic
BPs (Solomon et al., 2015; Young et al., 2015). Though not specified in present literature, this
lifestyle modification may also yield positive results when applied specifically to Haitian
immigrants.
Early recognition of heart attacks and stroke by witnesses and/or those affected are key
tools in reducing the mortality associated with these events. Unfortunately, international rates of
pre-hospital delay in urban areas range from 2–5 hours for an acute myocardial infarction with
data sampled from multiple cities (Zerwic, Ryan, DeVon, & Drell, 2003; Saberi, Adib-
Hajbaghery, & Zohrehea, 2014) and 3–6 hours for a cerebrovascular incident (Lutfiyya, Ng,
Asner, & Lipsky, 2009). Zerwic and colleagues discovered that African-Americans had a
significantly longer delay time when compared to non-Hispanic whites (3.25 hours vs. 2 hours)
(Zerwic, Ryan, DeVon, & Drell, 2003). Researchers continue to study the link between those
with lower incomes and living in areas classified as “inner city” as having an increased delay
time—though they were unable to report an accurate statistical difference due to participants’

12
hesitancy to declare their financials at the time of the study (Zerwic at al., 2003). Insurance and
marital status also appeared to contribute to hospital delay: African-Americans without insurance
coverage and African-Americans that were single, divorced, or widowed had a longer delay time
than non-Hispanic whites with similar, non-racial characteristics (Bank & Dracup, 2006). Such
studies not only highlight the difference in symptom recognition between racial groups but may
also explain the difference in mortality rates. Motivational interviewing and education sessions
aimed toward patients have been shown to increase the knowledge of stroke and heart attack
symptoms, which in turn may lead to a decrease in the length of pre-hospital delay (Green,
Haley, Eliasziw, & Hoyte, 2007). Increasing the awareness of an impending heart attack or
stroke creates more responsible patients and community members and would significantly
decrease the prevalence of sequela associated with these life-threatening events.
Haitians in America
Haitian immigrants—individuals who were born in Haiti and migrated to the
U.S.—are one of the fastest-growing immigrant populations in the U.S. By 2014, the Haitian
immigrant population in the U.S. consisted of 927,038 people, an increase of 57.9% from the
587,000 following the January 12, 2010 earthquake, and this number appears to be continually
rising (Nwosu & Batalova, 2014). The majority of Haitians reside in southern Florida, New
York City, and Boston (Camarota, 2010; Sanon et al. 2016). Haitian immigrants can be
classified as “triple minorities”: non-U.S. born, Black, and non-English speaking (Saint-Jean &
Crandall, 2005). Additionally, one in five Haitian immigrants (20%) live in poverty or poverty-
stricken areas. And with only one in three Haitians (33%) having health insurance coverage and
approximately 22% not completing high school (Allen et al., 2013), the ability of this population
to have access to informed medical care is much lower than the average American.

13
Haitian immigrants in the U.S. have been victims of discrimination since the early
1990s, when thousands of Haitians fled Haiti in the wake of the 1991 coup d’etat. The first wave
of Haitian immigrants arriving onto U.S. soil arose during the rule of the dictatorship of
President François Duvalier. The political chaos pushed many non-elite Haitians to migrate to
the U.S. (Sanon et al., 2016). This mass migration occurred at the height of Westernized
countries’ fear of HIV, a disease that was then-classified as “4H” after the groups many believed
were highly infected: homosexuals, hemophiliacs, heroin users, and Haitians (Neff, 2014).
While many Haitians could be classified as political refugees, over 250 Haitians were denied
entrance into the U.S. due to their positive HIV status. Instead, these men, women, and children
were sent to Camp Bulkeley in Guantanamo Bay for approximately three years until the U.S.
District Court declared the camp unconstitutional (Porter, 2012). This polarizing chain of events
led to a fairly prevalent distrust among the Haitian people towards the Westernized government
and, in turn, it’s associated healthcare system (Allen et al., 2013).
Haitians, hypertension, and healthcare barriers
Haitians living in the U.S. are currently categorized as part of the non-Hispanic Black
population in the U.S. Census and in studies regarding that minority population. While no
specific data regarding the prevalence of HTN in Haitian immigrants in the U.S. currently exist,
past studies have noted a high prevalence rate stemming from self-reported cases in the 1980s
(Sanon et al., 2014) and from the rate of HTN diagnoses in Haiti (WHO, 2015). Kenerson
(2014) identified the importance of recognizing the problem of HTN in Haitians, touching on the
effects of cultural beliefs and its ties to dietary differences in Haitian’s management of the
disease. Though it is difficult to measure the amount of salt in a normal Haitian diet, many
traditional Haitian meals call for the use of seasoning cubes called Maggi, which contain

14
approximately 2.5 grams of sodium per one 4g cube (Nestle, 2017). Salt is also used as a
preservative for certain proteins such as codfish and herring, and often the fish is cooked with the
salt layer intact. Some Haitians also associate salt with vitality and its supposed ability to
cleanse the blood of “strong emotions” (Kenerson, 2014). In addition to a possibly higher than
average salt intake, Haitian meals are heavy on starches and oil with limited use of fruits,
vegetables, and protein. Implementation of a DASH modified diet appears promising for this
population, as it has been shown to be effective on their African-American counterparts (Svetkey
et al., 2004). However, there are concerns of the affordability of the diet and its ability to be
applied to Haitian meals (Kenerson, 2014).
The impact of healthcare barriers and disparities in regards to minority populations has
been well documented (Ahmed et al., 2015), with studies reporting a disproportionate rate of
morbidity and mortality associated with those belonging to a minority group (Liu et al., 2012).
These barriers include, but are not limited to, the cost of healthcare without health insurance,
healthcare’s systemic barriers (such as approachability of care), and clinical barriers. Immigrants
are far more likely to be uninsured then native U.S. inhabitants (Ku, 2006). In 2014, 27% of
immigrants in the U.S. did not have any form of insurance, compared to 9% of U.S. citizens
(Zong & Batlova, 2016). Lack of insurance is associated with a decreased likelihood of utilizing
healthcare services due to the higher out-of-pocket cost. Approximately one-third of Haitian
immigrants do not have any form of health insurance (Nwosu & Batlova, 2014), therefore only
about 60% of Haitian immigrants receive annual physicals, preventative care, or care for chronic
diseases (Saint-Jean & Crandall, 2005).
Structural barriers within the American healthcare system can cause minority patients to
forgo healthcare service due to their archaic design (Betancourt, Green, Carrillo & Ananeh-

15
Firempong, 2003; Degrie, Gastmans, Mahieu, Casterlé, & Denier, 2017). This includes lack of
interpreter services and culturally-appropriate educational material, along with a bureaucratic
intake process that favors the well-insured. For most immigrant populations, a major concern is
a lack of available bilingual providers. When interviewed about communication barriers in the
Haitian population, one participant in a 2013 study stated, “When non-English speakers go
somewhere for services and can’t ask for what they want, they are ignored” (Allen et al., 2013).
The same study noted the prevalence of culturally-modified terms used to describe symptoms by
non-English speakers. For instance, Haitians call chest pain “stomach pain” when referring to
the symptom in English. Therefore, a Haitian patient presenting with chest pain may be
misdiagnosed or overlooked, and the patient may decline future Westernized healthcare services
due to improper addressing of symptoms (Allen et al., 2013). Though not a literal
misunderstood translation, the diagnosis of HTN may be interpreted in two ways for a Haitian
immigrant: as a chronic disease or as a normal condition of the body. In a study conducted by
Sanon et al., researchers found that Haitians that view HTN, or “tansyon,” as normal do not take
their prescribed medications; they do not believe they are sick because “everyone has tansyon”
(Sanon et al., 2016). This study showed the importance of distinguishing terms and proper
explanation of a diagnosis, its effects, and treatments, especially when working with a minority
population.
Mistrust or perceived inadequacy of the patient–provider relationship is classified as a
clinical barrier. Additional clinical barriers arise when the patient and provider have
sociocultural differences that are not accepted or understood by the provider. Discriminatory
actions and treatments have been known to occur when this type of barrier is widely present
within an organization (Betancourt et al., 2003). The role of implicit bias also fits in the category

16
of a clinical barrier. Chapman, Katz, and Carnes (2013) define implicit bias as unconscious
belief towards groups of people, which when it exists in healthcare providers may alter care
practices. In regards to race, White physicians were found to have higher levels of pro-White
bias, assuming Black patients were less likely to be cooperative and delay certain types of
treatment. Chapman et al.’s review also noted that Black patients described physicians with a
higher degree of implicit pro-White bias as poor communicators and provided lower quality of
care. Chapman and colleagues suggested an increased awareness and acknowledgement of
implicit biases to combat the effects of it in healthcare. Due to their lower scores of implicit and
explicit biases in many of the reviewed studies, an increase of Black or culturally-comparable
physicians/healthcare providers was also recommended (Chapman, Katz, & Carnes, 2013).
In order to access proper health information and make informed decisions regarding their
care, patients must have adequate health literacy—the ability to obtain, communicate, process,
and understand basic health information. A recent study that assessed Haitian immigrants’
health literacy discovered that while this population’s Brief Health Literacy Screen scores varied
by age, education, and language, those with lower health literacy scores were more likely to trust
their friends, family, and members of their religious organizations as their healthcare resources,
rather than healthcare professionals (Lubetkin et al., 2015). Those with lower health literacy
included older participants, those who preferred speaking Haitian Creole, and those with less
than a high school education.
A proper relationship between Haitians and the American healthcare system must also be
present. To combat the mistrust created during the fallout from the coup d’etat migrations,
healthcare providers could incorporate the Haitians’ faith and social support systems to better
reach out to the population. Allen and colleagues have suggested involving priests and
17
clergymen, whom Haitians often include among their support systems (Desrosiers & St Fleurose,
2002), to become “health ambassadors” within their communities. Religious leaders are well
aware of the impact they hold in their communities, especially immigrant populations, and some
have expressed their desire to be better equipped with knowledge when health concerns occur so
they can offer guidance and assistance (Allen et al., 2013).
Educational intervention programs
Proper management of chronic diseases such as HTN requires the patient to be involved
in their care and be properly educated about the disease process and appropriate interventions.
“Generalized health education” is defined as the communication of health information from
provider to patient (Connell et al., 2008). “Self-management education” emphasizes patient
education in preventative and therapeutic health activities. Supporting those self-managing a
chronic disease means providing care and encouragement by increasing the understanding of a
patient’s role in their illness, how to make informed decisions about his or her care, and how to
make healthy, behavioral choices (Improving Chronic Illness Care, 2016). A systematic review
performed by Warsi and colleagues concluded that a proper self-management program resulted
in moderate yet significant changes to a patient’s overall management of chronic disease (Warsi,
Wang, LaValley, Avorn, & Solomon, 2004).
Haitians may believe managing their HTN relies on social support as noted by
researchers in a 2016 ethnography study. Many Haitians are aware of the effects of stress on
their blood pressure, illustrated by their translation of “high blood pressure” to “tansyon” or
tension. The ability to maintain ties with their friends and family in Haiti in the form of sending
remittances helps them feel at ease, which in turn keeps their blood pressure under control.
18
Some participants in the study also mentioned their obligation to send money to their families
encouraged them to take their medication daily (Sanon et al., 2016).
Utilizing a community setting when adapting educational and preventative programs has
had some success (Artinian, et al., 2010). A narrative review performed in the United Kingdom
focused on group interventions for HTN control in Black adults (Connell et al., 2008). The
studies included in this review integrated culturally-sensitive strategies in a group setting to
either attempt to reduce BP in the adult Black population or increase the general knowledge of
BP. Connell et al.’s review discovered that many successful educational interventions utilized
group education classes with culturally-matched educational material; instructors that were
ethnically matched to the group also yielded positive results. Pre-/post results showed explicit
benefits in reducing BP and improving patients’ health knowledge. In regards to HTN and CVD
education, a review of literature pertaining to interventions aiming to reduce health disparities
discovered group interventions, such as classes held at a community center or faith-based
organization, were well-received by the participants of the study (Crook et al., 2009).
Goal setting
Some educational programs have added a focus on personalized outcomes, therefore
holding both the patient and provider more accountable for the results of interventions. In order
to better measure the success of the interventions, researchers have used individualized goals as
an outcome measure (Artinian, et al., 2010). Kiresuk and Sherman (1968) developed a tool to
determine the effectiveness of the goals called the Goal Attainment Scale (GAS). Since its
creation, goal setting and the GAS have been used primarily in the mental health and
rehabilitation fields and resulted in some measurable success within those patient populations. A

19
systematic review by Hurn and colleagues evaluated the reliability, validity, and sensitivity of
goal setting in rehabilitation literature. They discovered that while attainment of goals has been
shown as “a sound measure for use in physical rehabilitation settings,” much work needs to be
done in determining whether this outcome is a successful measure for other fields, such as
chronic diseases (Hurn, Kneebone, & Cropley, 2006).
A well-known and oft-utilized method of goal setting is creating a goal that meets the
SMART criteria, which requires a goal to be Specific, Measurable, Attainable, Realistic, and
Timely (Morrison, 2010). The origin of the SMART acronym is difficult to trace, yet this
method continues to be a staple in goal setting in various healthcare fields. Practitioners in
rehabilitation tested its practicality in 2009, and they determined the SMART method to be a
quick, patient-centered method in goal construction that may be suitable for many situations
(Bovend'Eerdt, Botell, & Wade, 2009). Medical students came to a similar conclusion when
examining the effectiveness of SMART goals in creating a treatment plan for asthmatic patients
(Tichelaar et al., 2016). The medical students were separated into two groups: one group created
goals for their patients using WHO’s six-step Guide to Good Prescribing, and the other group
utilized the SMART method. Researchers discovered that the medical students using the
SMART method showed an increased ability to set attainable treatment goals. Such results
continue to prove that the SMART goal setting method is successful in assisting patients in
setting and achieving individualized treatment goals.
Culturally-adapted interventions
Due to the growing realization of the healthcare disparities that minorities face, many
healthcare professionals have altered their focus to more “culturally competent” care. A
culturally competent system acknowledges and incorporates a person’s culture, cross-cultural

20
relations, and cultural differences in order to adapt services to meet that person’s needs
(Betancourt et al.,2003; Sopoaga, Zaharic, Kokaua, & Covello, 2017). Methods to ensure
culturally competent care include hiring an appropriately multicultural staff that reflects the
population, offering interpreter services and educational materials in patients’ preferred
languages, and providing and encouraging cross-cultural training for staff.
Self-management and educational programs have proven to have positive health
outcomes when modified for ethnic populations. Ehrlich and colleagues reviewed nearly two
dozen studies assessing the results of interventions in chronic disease management in minority
populations to determine the effectiveness of culturally-responsive interventions (Ehrlich,
Kendall, Parekh, & Walters, 2015). Studies in their review focused on participants with Type 2
diabetes, CVD, stroke, respiratory disease, and chronic kidney disease. The reviewers
discovered that culturally-adapted self-management and educational programs, regardless of
their duration or level of intensity, may result in significant changes in health knowledge, skills,
and attitudes (Ehrlich et al., 2015).
However, researchers have warned practitioners who employ culturally-appropriate care
of the dangers of stereotyping. When applying methods of culturally competent care, training
typically requires patients to be grouped into broad ethnic or racial categories, such as “Asian” or
“Hispanic” (Betancourt et al., 2003). This process often leads to some minority groups, such as
Haitians, being underrepresented or misunderstood due to their continued classification as part of
“African-American” and “Black” groups rather than as their own unique ethnic group (Sanon et
al., 2016).

21
Congregation and faith-based interventions
Faith-based interventions are not a new concept when managing chronic disease and in
regards to a patient’s overall health promotion. Early literature in medicine and nursing strongly
emphasized connecting a patient’s spiritual and psychological beliefs with their health
(Nightingale, 1860). Current literature also supports interventions via patients’ faith
communities as an effective method for health promotion and disease management. Not only did
Peterson (2011) observe positive outcomes in the health determinates of the target population
(i.e., reduction of BP reading, increased fitness, etc.) when faith-based health promotion
programs were utilized, he also found that such programs encouraged healthy behavioral
changes, such as dietary modification, more supportive relationships, and renewed focus on the
overall health of the community. Government organizations have taken notice of the positive
effects faith-based interventions can have on the health of a community and have supported this
movement by creating additional health programs, such as 100 Congregations. A branch of the
“Million Hearts” initiative, 100 Congregations is a program that incorporates teaching a heart-
healthy lifestyle, specifically blood pressure control, into a faith-based organizations’
congregation. There are currently over 100 congregations in 21 states participating in this
lifestyle modification program (CDC, 2015a; U.S. Department of Health & Human Services,
2015).
Limited data are available regarding the prevalence and influence of faith and religious
participation by Haitian immigrants living in the U.S. However, the most recent report of
religious affairs released by the U.S. Department of State estimates that 80% of Haiti’s
population categorized themselves as Roman Catholic (Bureau of Democracy, Human Rights
and Labor, 2012). The U.S. Department of Health and Human Services (2015) noted places of

22
worship are important outlets in reaching neglected and underserved populations such as
African-Americans and Haitians. According to the Pew Research Center, African-Americans
have the highest rate of religious affiliation when compared to other racial groups in America.
Eighty percent of adult African-Americans state religion plays a “very important role in their
lives” compared to 56% of all U.S. adults (Sahgal & Smith, 2009). African-Americans are also
more likely to pray on a daily basis and intertwine religion with their everyday lives, such as
reading religious material and listening to religious music/programs (Hamilton, Sandelowski,
Moore, Agarwal, & Koenig, 2012). Due to the high rate of importance faith has to this
population, there has been measurable success in using faith-based and faith-centered
interventions among both Haitian-Americans and the more general Black American populations.
These types of interventions include self-management programs taught by pastors, classes held
by trained facilitators, and the distribution of educational materials and bulletins. Researchers
utilizing these methods have successfully educated participants about HTN, diabetes (Lynch,
Liebman, Ventrelle, Avery, & Richardson, 2014), and overall “heart health” (Gittner,
Hassanein, & Murphy, 2007). As such, faith-based organizations have proven to be important
venues in the effort to reduce health disparities within racial minority groups (Campbell,
Hudson, Resnicow, Blakeney, Paxton & Baskin, 2007).

23
Chapter 3: Conceptual and Theoretical Framework
Theory of the problem
The clinical problem was approached using the transnational theory, which describes the
relationships immigrants have with their counterparts in their homelands. U.S. anthropologists
Schiller, Basch, and Blanc-Szanton first described the transnational theory in 1992, which
compares the behavior of immigrants in a new country to behaviors of their counterparts in their
native country (Ehrlich et al., 2015). The theory was developed to explain the “new group” of
immigrants arriving in the U.S. in the later twentieth century. When compared to earlier
immigrants from Europe, anthropologists realized that this group of immigrants, who hailed from
Haiti, the English-speaking Caribbean, and the Philippines, tended to create and sustain social
relations between both their new society and the societies of origin (Sanon, Spigner, &
McCullagh, 2014; Sanon et al., 2016).
Transnationalism studies the relationship between the birth and host countries of
immigrants with an emphasis on their culture and practices (Schiller, Basch, & Blanc-Szanton,
1992; Sanon et al., 2016). The approach explains how the migration process affects the countries
of origin and residence of these immigrants. Transnationalism was primarily used as a tool to
understand complex, international familial networks and possible coping methods for new
immigrant populations (Falicov, 2007). In regards to healthcare, the foundations of
transnationalism are readily apparent, as immigrants often contact friends and family for advice
and home remedies rather than receiving care from the unfamiliar Westernized healthcare system

24
(Thomas, 2010). This theory will be employed during the course when describing the
HTN management in the Haitian immigrant population and as a possible method to explain
participants’ behaviors.
Theory of the intervention
In order to successfully control HTN and its symptoms, patients must first be willing to
change their habits. Habits, by nature, are formed by behaviors and beliefs that are a part of an
individual’s identity. In order to aid patients self-managing their HTN, researchers and providers
must individualize their plan of care according to the patient’s beliefs and behaviors (Hoseini,
Maleki, Moeini, & Sharifirad, 2014).
The health belief model (HBM) was created by social psychologists in the 1950s in an
attempt to explain the reasoning behind the lack of community participation in preventative
services (Glanz, Burke, & Rimer, 2015). This model has further expanded in recent years to
better understand the health decisions of individuals and groups of people who share the same
beliefs (Bell, Holliday, Ormond, & Mainil, 2015). The HBM has been used in the creation of
educational programs due to its focus on health motivation. Six hypotheses, or constructs, create
the HBM: in order to change behaviors, one must address the other’s perceived susceptibility,
perceived severity, perceived benefits, perceived barriers, self-efficacy, and provide a cue to
action and self-efficacy. Of the six main constructs of the model, researchers found that tailoring
educational interventions to increase a patient’s perceived susceptibility and perceived severity
resulted in significant increases in a patient’s health and health behaviors (Hoseini et al., 2014;
Yue, Li, Weilin, & Bin, 2015).
To tailor the education to meet the needs of the target population—Haitian immigrants
and their descendants—questions regarding participants’ beliefs towards HTN and HTN

25
management were asked via a survey format prior to the start of the first education session. This
survey also contained questions regarding the behaviors of family members, as health behaviors
can be influenced by those of their family and social networks (Scisney-Matlock et al., 2009).
Acknowledgement of their perception regarding their current management of HTN was
addressed in each session, and information that will presumably increase factual awareness of
participants’ problems with HTN was provided.

26
Chapter 4: Methodology
Target Population
The target population was a convenience sample of adult (over the age of 18) Haitian
men and women, who were either immigrants or of Haitian descent and attend a faith-based
organization in central North Carolina. The attendees of this organization were also encouraged
to bring friends and family members who met the above criteria. The community health
outreach (CHO) member of the organization was a registered nurse, licensed by the Board of
Nursing in North Carolina. The CHO was able to schedule meetings with organization leaders
for the DNP student to discuss session dates, times, and settings. Weekly announcements were
made to the assembly for three weeks prior to the interview session and the week before each
session.
Setting
This project was implemented at a faith-based organization located in central North
Carolina. A Haitian-born pastor founded this organization in 2010 along with two Haitian-born
deacons and their wives. This organization brings together Haitians and Haitian-Americans of
all ages, who travel from multiple counties in central North Carolina, such as Wake, Guilford,
Greenville, and Pitt, over a span of 90 miles. The organization’s services take place in a local
community center and have the capability to seat 70 comfortably. To date, there are 15 official
adult members of the organization, yet Sunday services have an average of 20 adult attendees.
Per organization leaders, this organization views itself as more of a family; therefore, there was

27
already a strong sense of community instilled within the members and the visitors. Many
members of the organization are blood relatives (mothers, sisters, etc.), and consequently
encouraging partnership during this project was not difficult. The educational sessions were
conducted in the same room as the faith-based services before or after the services were held.
There are no current records regarding the prevalence of HTN within this small setting.
The CHO member is the wife of one of the deacons in the organization and the sister of the
founding pastor, and she currently holds “community health” sessions for the congregation once
a month. Previous topics have included mammograms, Papanicolaou smears, and diabetes.
Prior to the implementation of this course, no class had been offered regarding high BP.
However, conversations with the organization’s leaders confirmed that a few members within the
organization’s congregation have a diagnosis of HTN.

28
Chapter 5: Project Design
This project is a descriptive study of a convenience sample of Haitian immigrants’
understanding of HTN, as well as an educational program that utilized group-teaching sessions
as its primary intervention. This project utilized culturally-appropriate education that was
enhanced by an initial survey collection and interviews of the participants concerning their
understanding and beliefs about HTN management. The surveys, interviews, and physiological
assessments completed prior to the start of the educational sessions will be described as the
“Needs Assessment” (i.e., Part 1); the subsequent four hypertension educational sessions,
pre/post-tests, and SMART goals will be described as the “Educational Course” (i.e., Part 2).
Informed consent was obtained and a demographic health survey, with questions about
HTN understanding and modifiable risk factors, was given to participants. The DNP student
requested a confidential interview with every participant that completed the health assessment
survey prior to the start of the sessions. These interviews consisted of open-ended questions
about their knowledge of HTN and management of the disease. Information obtained from the
surveys and interviews was used to direct the content of the culturally-appropriate HTN
education intervention. Future participants taking individual classes had the opportunity to sign
the consent form and complete the same demographic health survey before they attended each
session. Each participant was asked to sign in at the start of every session to track attendance.
Four educational sessions were presented over the span of approximately three months. At the
end of each session, information regarding the definition and creation of SMART goals was

29
presented. To assure that each participant was equally versed, the information presented
about SMART goals was the same for each session; the only changes were examples of SMART
goals to express applicability to each topic

30
Chapter 6: Ethical Considerations
IRB approval was requested in April 2016 prior to the implementation of this project.
The Office of Human Research Ethics determined this project “does not constitute human
subjects research as defined under federal regulations [45 CFR 46.102 (d or f) and 21 CFR
56.102(c)(e)(l)] and does not require IRB approval” (Appendix A) on May 6th, 2016. The DNP
student obtained informed consent from participants through a general permission form prior to
gathering demographic data. Each participant was assigned a participant ID (PID) number. A
single PID number was associated with each participant for his/her demographic assessment,
interviews, pre-tests/post-tests, and SMART goal. The list matching each participant’s name to
his/her PID number was kept in a secure location separate from the data collected during this
project to ensure anonymity; the lists of data were stored with the DNP student.

31
Chapter 7: Hypertension Tool Kit
The complete “Hypertension Tool Kit” consists of a Demographic Health Survey (DHS),
one-on-one interview questions, four educational sessions, a pre- and post-test for each session,
and a SMART goal/GAS scoring guide. The preliminary section of the tool kit, the Needs
Assessment (Part 1), contains the DHS, which contains an area to record the physiological
assessment measurements and the one-on-one interviews. Answers from the Needs Assessment
were used to create the Educational Course (Part 2), determine incentives for the participants,
and aid in the creation of SMART goal examples.
The overall success of the program was evaluated on the following outcomes: statistically
significant p-values with an increase in post-test scores from a matched T-test containing scores
from each session’s pre-/post-tests, and neutral (0) or positive GAS scores for each session’s
four-week follow-up (Appendix L). Positive outcomes for this project may support the claim
that a culturally-tailored HTN session can increase understanding of the HTN disease process
and encourage goal-setting behaviors.
32
Chapter 8: Needs Assessment
Tools
Demographic Health Survey (DHS). A demographic and health survey was given to
members of the organization four weeks prior to the first educational session to gain an
understanding of the characteristics of the target audience (see Appendix A). The DNP student
developed the DHS under the guidance of committee members using a previous study’s survey
as a guide (Sanon et al., 2014). The survey used each person’s PID number for identification and
included demographic information such as gender, age, income level, and immigration year. The
DHS also contained an area for the DNP student and CHO member to record physical data, such
as the height, weight, and BP of each willing participant. This physiological data was used for
descriptive purposes only; no change in height, weight, or BP was expected during the course of
this project. Multiple-choice and fill-in-the-blank questions regarding the participant’s lifestyle
habits and HTN beliefs were also included in this preliminary survey. These questions inquired
about the participant’s health status, eating habits, and activity level to identify modifiable risk
factors for targeted teaching and individual goal setting. The health and demographic
information obtained from the survey served as data for the DNP student in the planning of the
program and ensured that the educational classes were culturally appropriate for this specific
group of participants. The survey was available in English, Haitian Creole, and French for the
participant’s preferred language choice, and the option to have the survey read to him/her was
also offered. The DHS was filled out by each participant and returned to the DNP student upon
completion. A total of 23 surveys were completed at various dates (see Procedures).

33
One-on-one Interviews. Confidential interviews with open-ended questions concerning
HTN understanding and general lifestyle choices were completed between agreeing participants
(n = 11) and the DNP student on May 22nd and May 29th, 2016, prior to the educational
sessions (Appendix B). The purpose of the interviews was to allow participants to use their own
common terminology of technical terms and voice their understanding about hypertension and
lifestyle choices. This qualitative information was used to further aid the DNP student in
teaching culturally-appropriate group lessons and identify gaps in knowledge.
Analysis Plan
Answers to the DHS were manually entered into Qualtrics (Qualtrics, Provo, UT,
2015), a web-based survey program software to assess the results for trends and central
tendencies of the data. This software created spreadsheets displaying all the answers chosen by
the participants. Answers relating to the participant’s physical activity and eating habits were
used as guides when creating the sessions related to those topics, with certain food choices and
prevalent physical activity habits being focal points in the participants’ education. Interviews
were recorded after receiving permission from the participants and manually transcribed by the
DNP student. Interviews answers were manually separated by common themes.
Procedure
Surveys. The initial survey distribution and collection spanned over four weeks from
May 15th to June 5th, 2016. Twenty-three DHS surveys were completed at various times: 5
surveys were returned on May 15th, 2016, 16 on May 29th, 2016 and 2 on November 6th, 2016.
Participants had the opportunity to complete the survey in their preferred language (Appendix
A). Three surveys were completed in Haitian Creole, 1 in French, and 14 in English, with the

34
remaining 5 participants having the surveys read to them by the DNP student or CHO member.
Surveys done prior to May 29th were completed after the religious service: two participants took
their surveys home to complete and returned them to the DNP student the following Sunday, and
the remaining three participants had the surveys read to them in a private room immediately after
service on May 15th. Two of the five that had the surveys read to them on May 15th agreed to
participate in an open-ended interview as well, which were completed at that time. The 16
surveys completed on May 29th were completed before the religious service, with the remaining
8 interviews being completed that day. The participants completing the interview were seated in
an area with the DNP student away from the other participants to ensure privacy.
Confidential interviews. Eleven participants agreed to be interviewed. Interviewees
were asked the same interview questions in their preferred language and answered the questions
in their preferred language. Interview questions focused on terminology for conditions, such as
stroke and heart attack, and allowed for the description of stroke and heart attack symptoms by
the interviewee, along with the interviewee informing the DNP student of his/her diet, physical
activity, and daily lifestyle (Appendix B). The DNP student manually transcribed audio
recordings of interviews. Similar answers to interview questions were noted as “themes” to be
addressed in each appropriate session (i.e., use of Maggi in cooking, general poor recognition
and definition of heart attack/stroke, etc.).
Physiological Assessment. Objective assessments were gathered prior to the
implementation of the educational session from those who completed the DHS. Of those
participants, BP and height/weight converted to BMI (weight in kilograms/height in meters
squared) were gathered at an hour-long session before the faith organization’s service on May
29th, 2016. The DNP student and the organization’s CHO member measured height, weight, and

35
BP readings for all participants. Height and weight were gathered upon entrance into the
building, and participants were asked to remove their shoes, hats, and jackets to allow for an
accurate measurement. Weight was measured in pounds (lbs) by a Health o meter scale
purchased by the DNP student.
Results
Demographic Health Survey. A total of 23 members of the faith-based organization
completed a DHS. The majority of survey respondents were female (n = 14/23 [61%]) (Figure
8.1) with a median age of 42 years old, and ages ranged from 18–80 years old (Figure 8.3). The
majority of respondents were in the age groups ranging from 25–34 (n = 6) and 35–44 (n = 5).
Twenty-two (96%) respondents were Haitian-born (Figure 8.2) and migrated to the U.S.
between 1975–2013 (Figure 8.4), with more participants having migrated in 2008 than any other
year (n = 8). The year 2002 was the second migration year with four participants, and 2000 and
2004 were tied for third most at two participants per year each.
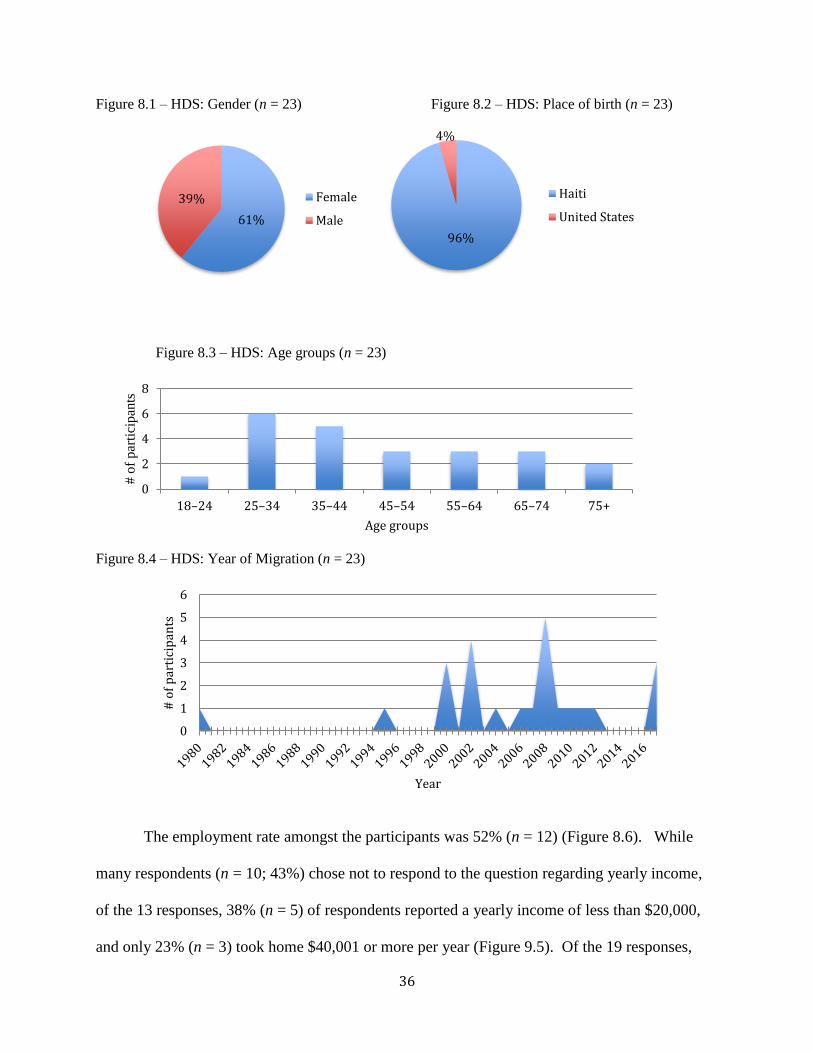
36
Figure 8.1 – HDS: Gender (n = 23) Figure 8.2 – HDS: Place of birth (n = 23)
Figure 8.4 – HDS: Year of Migration (n = 23)
The employment rate amongst the participants was 52% (n = 12) (Figure 8.6). While
many respondents (n = 10; 43%) chose not to respond to the question regarding yearly income,
of the 13 responses, 38% (n = 5) of respondents reported a yearly income of less than $20,000,
and only 23% (n = 3) took home $40,001 or more per year (Figure 9.5). Of the 19 responses,
61%
39% Female
Male
96%
4%
Haiti
United States
0
1
2
3
4
5
6
# o
f p
arti
cip
ants
Year
0
2
4
6
8
18–24 25–34 35–44 45–54 55–64 65–74 75+
# o
f par
tici
pan
ts
Age groups
Figure 8.3 – HDS: Age groups (n = 23)

37
only four (21%) of the respondents did not complete high school, and nine (47%) had college or
some college education (Figure 8.7). Reported employment among the respondents varied
greatly, ranging from restaurant manager, sterile equipment processor, delivery driver, and rental
car agent.
Figure 8.5 – Highest level of education completed (n = 23)
Figure 8.6 – HDS: Employment rate (n = 23)
01234567
# o
f p
arti
cip
ants
Education Level
Employed52%
Unemployed48%
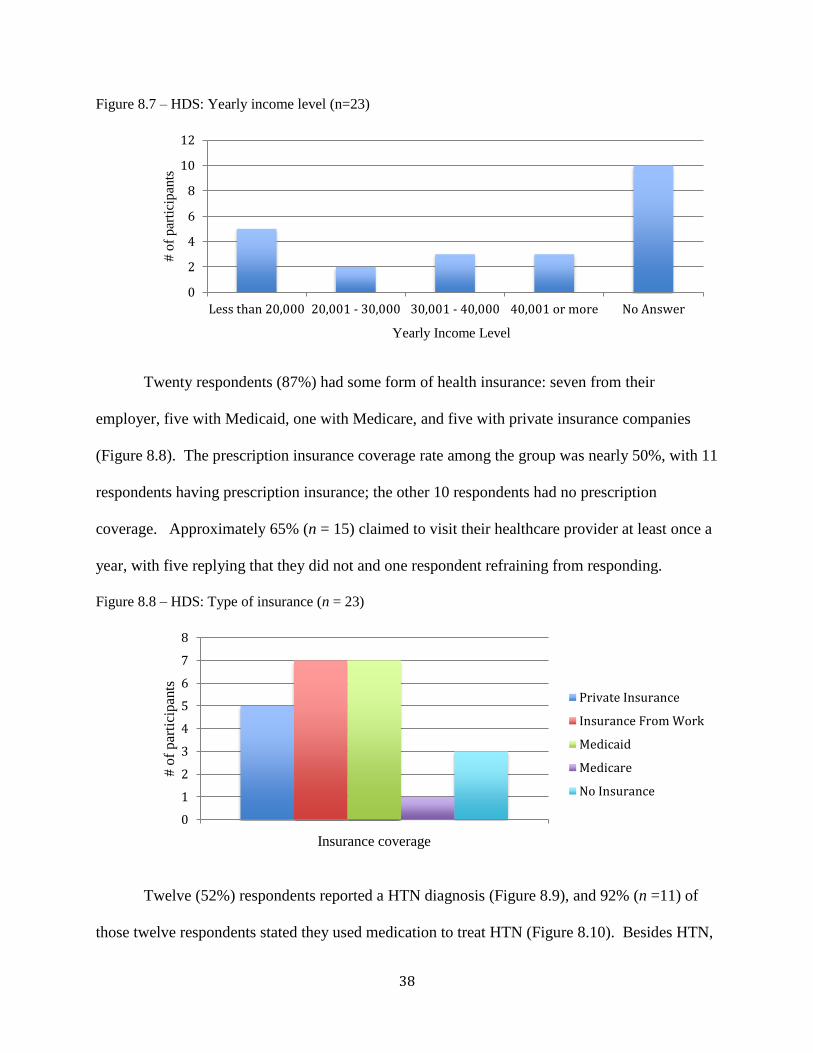
38
Figure 8.7 – HDS: Yearly income level (n=23)
Twenty respondents (87%) had some form of health insurance: seven from their
employer, five with Medicaid, one with Medicare, and five with private insurance companies
(Figure 8.8). The prescription insurance coverage rate among the group was nearly 50%, with 11
respondents having prescription insurance; the other 10 respondents had no prescription
coverage. Approximately 65% (n = 15) claimed to visit their healthcare provider at least once a
year, with five replying that they did not and one respondent refraining from responding.
Figure 8.8 – HDS: Type of insurance (n = 23)
Twelve (52%) respondents reported a HTN diagnosis (Figure 8.9), and 92% (n =11) of
those twelve respondents stated they used medication to treat HTN (Figure 8.10). Besides HTN,
0
2
4
6
8
10
12
Less than 20,000 20,001 - 30,000 30,001 - 40,000 40,001 or more No Answer
# o
f p
arti
cip
ants
Yearly Income Level
0
1
2
3
4
5
6
7
8
# o
f p
arti
cipan
ts
Insurance coverage
Private Insurance
Insurance From Work
Medicaid
Medicare
No Insurance

39
medical diagnoses included high cholesterol (n = 1), diabetes (n = 2), and stroke (n =1) (Figure
8.11). Respondents’ beliefs concerning the effects of medication, diet, and physical activity on
HTN were assessed, regardless of whether or not they were diagnosed with the disease. The
majority of participants who answered believed that medications, a diet change, and exercise
would lower BP (56%, 50%, and 60% respectively) (Figure 8.12).
Figure 8.9 – HDS: Have a HTN Figure 8.10 – HDS: Using HTN medication (n = 12)
prescription (n = 23)
Figure 8.11 – HDS: Current reported diagnosis (n = 16)
Yes52%
No48%
Yes92%
No8%
02468
101214
HTN High Cholesterol Diabetes Stroke
# o
f par
tici
pan
ts
Diagnosis

40
Figure 8.12 – HDS: Beliefs regarding interventions on lowering BP (n = 23)
In regards to dietary choices, sodium intake is often restricted in people who have been
diagnosed with HTN. In this group, many (13) of the respondents did not eat canned food, a
high sodium-containing item (with three electing not to answer), but 17 (17/23 [80%]) used
Maggi, a common Haitian seasoning substitute high in monosodium glutamate and sodium,
while cooking, and 13 (13/23 [57%]) used Maggi as well as salt in their home-cooked meals.
Common high-sodium foods traditionally consumed by Haitians include salted codfish, slated
mackerel, sardines, smoked turkey, and deli meat. When given the opportunity to choose one or
more of these foods that they consumed, 8 of 13 respondents (62%) claimed to eat salted cod
fish, 7 (54%) ate deli meant, and 3 reported either sardines or smoked turkey as part of their diet
(23% each).
Eleven respondents (48%) stated that they engage in some form of exercise (Figure 8.13).
Regarding type of exercise, walking was the most common response (n = 5), typically 3 days a
week with lengths of time ranging from 10–15 minutes to 2 hours. Other specific forms of
exercise included resistance training (n = 2) and soccer (n = 1).
0 2 4 6 8 10
Physical Activity
Diet
Medications
# of participants
Typ
e o
f in
terv
enti
on
Yes
Maybe
No
No Answer

41
Figure 8.13 – HDS: Percentage of respondents who exercise (n = 23)
Interviews. Eleven participants were interviewed, with ten allowing voice recording and
one refusing an audio recording but allowing transcription of the interview. The length of the
interviews ranged from two to nine minutes. All but one interview was conducted in Haitian
Creole. Each interview was reviewed in order to identify themes, terminologies, and gaps of
knowledge for use in this study. All interviewees agreed on the term “tansyon” for high BP, yet
no single Haitian Creole term was agreed upon for the words “heart attack” and “stroke”—“heart
attack” was described in a variety of terms, such as ”kris cardiac,” “fe yo couer,” “kris tansyon,”
“attack couer,” “move san,” and “couer blocke.” Many of the interviewees (n = 8) stated they did
not know an equivalent Haitian Creole term for stroke; they called the event “stroke,” yet the
word was said in their native accent.
In regards to knowledge gaps, the largest lack of knowledge concerned common
symptoms of heart attack and stroke. Heart attack symptoms were described by respondents as
“[one’s] body is hurting all the time,” “becoming dizzy and tired,” “[someone] passing out,”
“grabbing [one’s] heart/chest tightness.” Six interviewees were unable to describe the symptoms
of a heart attack whatsoever. The descriptions of stroke symptoms overlapped with the
symptomatology of a heart attack—interviewees that were able to describe symptoms used
48%
35%
17%
Yes
No
No response

42
translated phrases such as “falling out” and becoming dizzy. Three interviewees stated weakness
and damage to one side of the body as a sign of a possible stroke; one identified slurred speech
and facial droop as well. Four of the eleven interviewees could not describe any signs of stroke
when questioned.
Home remedies mentioned by the interviewees to manage BP included the use of
smoothies, teas (“feye”), garlic, and abstinence from coffee. One interviewee remarked that
“walking barefoot” helps to decrease BP. A few interviewees stated they “knew [their] healthy
weight,” yet were unable to define said healthy weight further through a numerical value or BMI
measurement. One commented that they “know [they] weigh too much” and three believed they
were not overweight. Physical activity and exercise were described as anything that makes the
“body move,” causes one to sweat, and “makes sure [one’s] blood flows through their body.”
Specific activities that respondents considered exercise were jogging, weight lifting, running,
resistance training, “going to the gym,” and “doing things around the house.”
Physiological Assessment. While many of the respondents did not believe they were
overweight (n = 10), the average BMI for respondents was 28.2 (19.1 - 37.6), which placed the
participants in the overweight/obese category (WHO, 2006) (Figure 8.14).
Figure 8.14 – HDS: BMI category (n =13)
23%
38%
31%
8%
Normal
Overweight
Obese I
Obese II
43
An initial BP reading was taken to determine if participants (n = 13) were currently
hypertensive and recorded on the demographic form to provide data for referral if follow-up care
was needed (Figure 8.15). Observing a decrease of BP was not an expectation for this project
due to its short duration and the possibility of participants not completing the full educational
program. The BP reading was gathered using an automatic cuff after the participant completed
the survey in a seated position (for at least five minutes). Two automatic sphygmomanometers
were available: a standard-sized adult cuff and a larger adult cuff, both manufactured by
ReliOn. The DNP student and CHO member selected the appropriate cuff based on the
participant’s arm size following recommended BP guidelines by the product’s manufacturer. If
the participant was found to be hypertensive (BP of 140/90 or higher) with the initial reading,
they were referred for further follow-up. If any participants were found to be in a hypertensive
crisis, as defined by the AHA (BP of 180/110) (AHA, 2014b), participants were strongly
encouraged to receive immediate care from the nearest healthcare facility 4.6 miles away. Of the
14 BPs taken, the average reading at the time of survey completion was 133.2/82.43 (Table 8.1).
Three participants met the hypertensive criteria (with readings of 142/88, 149/90, and 160/90)
and were told to follow up with a healthcare provider as soon as possible. One respondent’s BP
measurement resulted as 180/110. This respondent was strongly urged by the DNP student and
CHO member to receive care immediately at the nearest health facility, yet the respondent
refused.

44
Figure 8.15 – HDS: Blood pressure measurements (n = 13)
0
20
40
60
80
100
120
140
160
180
200
Systolic Diastolic
Systolic Diastolic
Minimum 97 56
Maximum 180 110
Range 83 54
Median 133 83.5
Mean 133.2 76
Q1 120 68
Q3 142 90
Table 8.1 – BP descriptive statistics

45
Chapter 9: Educational Course
Tools
Four independent educational sessions were offered to participants (Table 10.1).
Educational material for the sessions was extricated from multiple toolkits and organizations
(Association of Black Cardiologists Inc., 2016; The College of Family Physicians of Canada,
2008; AHA, 2014b; International Society of Hypertension in Blacks, 2011). The original
information was adapted to correlate with the culture of this Haitian population, using the
responses from the DHS and the interviews as reference. The resulting educational course was
separated into four different teaching sessions: “What is High Blood Pressure,” “Food, Salt, and
Hypertension,” “Physical Activity, Weight Management, and Hypertension,” and “Medication
Management and Symptom Recognition.” Each session contained different evidence-based
information on the effect of each modifiable risk factor (diet, physical activity, etc.) on HTN, and
the role of self-management procedures to control HTN (Appendices C, E, G, I). The education
sessions were independent of each other; although participants were encouraged to attend all of
the sessions, they were allowed to attend only one or as many as they chose. The educational
information presented in these sessions allowed for participants to create SMART goals to learn
self-management of their chronic conditions and their overall health based on the modifiable risk
factors discussed in each session. The SMART goal format was presented in the same fashion

46
for every class: a definition of each aspect of a SMART goal, followed by questions to
initiate selection of a pre-made SMART goal or for participants to create one of their own.
Pre-/post-tests. The DNP student modified questions developed primarily by the AHA
(2014b) to tailor the content of the educational sessions and pre-/post-tests to better align with
Haitian culture and to determine whether each session resulted in improved participant
knowledge and awareness. The modifications of these test questions were informed by the
answers given from the demographic surveys administered prior to the first session. For
example, when participants were asked to choose a food item with a higher salt content, the food
options available were determined by items that were the majority of participants’ answers on the
health assessment survey. Each session’s pre- and post-tests contained the same questions, but
each pair of tests reflected the learning outcomes of the different educational session
(Appendices D, E, F, G).
Incentives. Twenty-nine booklets containing evidence-based information were
developed to aid in the teaching sessions and provided to participants in English, with
translations in French and Haitian Creole available if needed. Information for these booklets was
gathered from educational pamphlets used by current associations, such as the AHA, Blood
Pressure Canada, GlaxoSmithKline and the American Association of Black Cardiologists. The
information obtained from these sources was then adapted by the DNP student to reflect the
Haitian immigrants’ lifestyle and culture. These booklets included local resources for
participants to receive additional information regarding BP management and affordable primary
healthcare.
Each session offered incentives to encourage participants to track and maintain their
individualized goals regarding their health. These incentives were free to all participants and

47
were as follows: Session 1, a take-home booklet mentioned about containing information from
each session and tools to track participants’ progress; Session 2, measuring spoons; Session 3, a
pedometer for each person in attendance; and Session 4, a BP monitoring device for one
participant who attended all four sessions.
SMART Goals. Participants were coached in the task of creating SMART goals
concerning the discussed topics. Goals were measured by using a modified version of the GAS
(Appendix L) and on the participant’s ability to complete all aspects of their personalized goal.
The DNP student followed up with the participants face-to-face weekly over the course of four to
six weeks following the previous session. The goal set by each participant was Level 0; if a
participant reported the goal complete, the score was registered as a “0.” Level –1 was given if
the goal’s outcome was less than the expected level and Level –2 if it was significantly less than
the expected level. Levels +1 and +2 were awarded when the participants performed somewhat
better than expected or much better than expected, respectively. The GAS was entered into an
ExcelTM spreadsheet to calculate the average (mean) goal attainment score for the participants
who formed SMART goals. A participant’s average GAS score was interpreted as the
individual’s overall ability to maintain their goal over the course of the four weeks. For instance,
a negative average (–2 to –0.1) denoted the individual was generally unsuccessful in maintaining
all aspects of their SMART goal at the time of follow-up, while a neutral or positive average (0
to 2) signified the individual was generally successful in maintaining all parts of his or her
SMART goal, even exceeding the expectation of the goal at times (scores > 1).
Analysis Plan
Each group education class on HTN education was assessed for a “change in
knowledge.” Change in knowledge of participants was evaluated using a non-experimental, pre-

48
test/post-test design. Test data were transcribed onto a Microsoft ExcelTM (2016) spreadsheet
and analyzed using paired T-tests via R software (2016) to determine whether there was a
significant increase, or change, in the group’s pre-test scores (taken before the educational
session) when compared to post-test scores (after the educational session) for each of the four
educational sessions. A probability value of p < 0.05 was set to determine whether there was a
statistically significant change in the post-test scores as compared to the pre-test scores.
The DNP student determined the participant’s Goal Attainment Scale (GAS) score for the
four-week follow-ups after meeting with the participant individually. For each session, each
participant’s SMART goal attainment scale (GAS) score was entered into an Excel sheet, and
average GAS scores were computed via Excel.
Procedure
The educational intervention consisted of the four educational sessions taught by the
DNP student over the course of three months (Table 9.1). The educational sessions were held at
the faith-based organization’s campus and conveyed the following information at each session:
the disease process and causes of HTN and stress management (Session 1; Appendices C and D),
healthy dietary choices (Session 2; Appendices E and F), physical activity and weight
management (Session 3; Appendices G and H), and stroke/heart attack recognition and
medication management (Session 4; Appendices I and J).
The DNP student presented all four sessions and the CHO was available during each
session if translation was needed. Each session taught goal setting using the SMART format.
The DNP student asked the participants the following questions to guide their creation of a
SMART goal (S [specific]: What exactly do you want to happen with you [diet, physical activity,
etc.]?, M [measurable]: How will you know when you’ve reached your goal?, A [attainable]:

49
What steps do you need to take to reach your goal?, R [realistic]: Can you achieve this goal?, and
T [timely]: When do you want to reach this goal?).
The pre-test was given at the beginning of each educational session. The post-test
questionnaire contained the same questions as the pre-test questionnaire and was given at the end
of each session. The final session of the series followed the same format as previous sessions
with the addition of a satisfaction survey for the participants. This survey was distributed at the
conclusion of the last session and the following week to assess participants’ satisfaction with the
information and the sessions’ design. Participants were asked if they were willing to be
contacted weekly for four weeks post-intervention. This final follow-up allowed the DNP
student to determine long-term behavioral changes initiated and supported by the sessions.
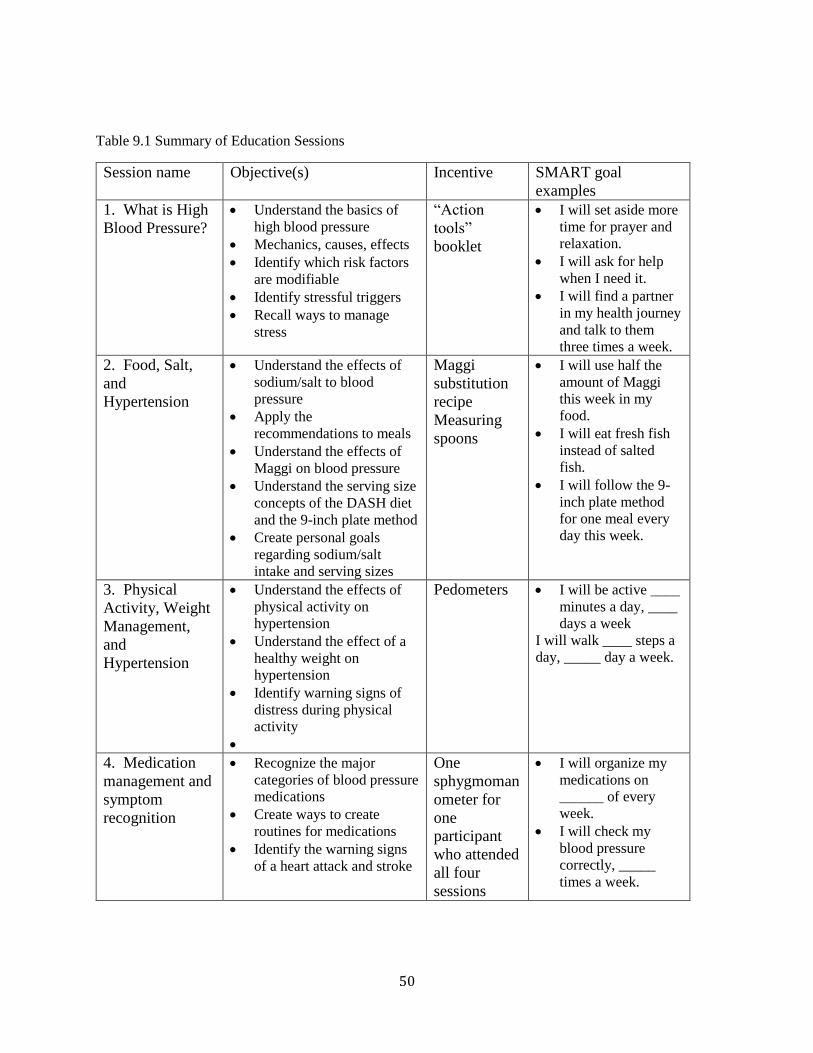
50
Table 9.1 Summary of Education Sessions
Session name Objective(s) Incentive SMART goal
examples
1. What is High
Blood Pressure?
• Understand the basics of
high blood pressure
• Mechanics, causes, effects
• Identify which risk factors
are modifiable
• Identify stressful triggers
• Recall ways to manage
stress
“Action
tools”
booklet
• I will set aside more
time for prayer and
relaxation.
• I will ask for help
when I need it.
• I will find a partner
in my health journey
and talk to them
three times a week.
2. Food, Salt,
and
Hypertension
• Understand the effects of
sodium/salt to blood
pressure
• Apply the
recommendations to meals
• Understand the effects of
Maggi on blood pressure
• Understand the serving size
concepts of the DASH diet
and the 9-inch plate method
• Create personal goals
regarding sodium/salt
intake and serving sizes
Maggi
substitution
recipe
Measuring
spoons
• I will use half the
amount of Maggi
this week in my
food.
• I will eat fresh fish
instead of salted
fish.
• I will follow the 9-
inch plate method
for one meal every
day this week.
3. Physical
Activity, Weight
Management,
and
Hypertension
• Understand the effects of
physical activity on
hypertension
• Understand the effect of a
healthy weight on
hypertension
• Identify warning signs of
distress during physical
activity
•
Pedometers • I will be active ____
minutes a day, ____
days a week
I will walk ____ steps a
day, _____ day a week.
4. Medication
management and
symptom
recognition
• Recognize the major
categories of blood pressure
medications
• Create ways to create
routines for medications
• Identify the warning signs
of a heart attack and stroke
One
sphygmoman
ometer for
one
participant
who attended
all four
sessions
• I will organize my
medications on
______ of every
week.
• I will check my
blood pressure
correctly, _____
times a week.

51
Results
The four sessions were presented between the months of July and October 2016: Session
1 on July 16th, Session 2 on July 31st, Session 3 on October 9th, and the fourth and final session
on October 23rd. A total of 25 different participants attended at least one session during the
course of the program (Table 9.2): 12 participants attended the first session, 8 individuals
attended the second session (all of which attended the previous session), 9 individuals attended
the third session (5 attended both previous sessions, 2 attended one, and 2 had never attended a
session), and 12 individuals attended the final session (4 attended all 3 previous sessions, 2
attended at least 2 sessions, and 6 only attended one session prior).
Table 9.2 – Session attendees
Session # of Attendees # of Attendees previous session(s)
attended
Session 1 12 ---
Session 2 8 session 1 8
Session 3 9 session 1 & 2 5
either session 1 or 2 2
Session 4 12
session 1-3 4
only two of sessions 1-3 2
either session 1, 2 or 3 6
Session 1 – Introduction and basics of HTN. This introductory session described the
causes of HTN and the disease onset and process. The session emphasized the differences
between modifiable and non-modifiable risk factors, along with the effects of stress on BP.
Participants were given the opportunity to recognize possible triggers to their stress and were
able to have an open discussion about ways they managed their stress. The session lasted
approximately 30 minutes and was conducted with 12 voluntary participants. The only question
all participants answered correctly in both test versions was “Which group has the highest rate of

52
high blood pressure?” (African-Americans or Blacks). The largest variance of answers was the
sixth pre-test question regarding the complications of uncontrolled HTN (“What are
complications from uncontrolled high blood pressure, besides a heart attack?” / All the above
[Vision loss, kidney problems, memory loss]) (Figure 9.1).
The percentage of correct answers on the pre-test ranged from 43–71%, with a mean
score of 55%. In comparison, the range of scores on the post-test was 71–86% and a mean score
of 85%. The majority of participants (11 out of 12) received 86% on the post-test (Table 9.3).
The mean difference (95% confidence interval) was 30% (0.23 – 0.37). The paired T-test
resulted with a T-value of 9.376 and a p-value = < 0.001, supporting a significant change in test
pre-test and post-test scores.
Figure 9.1 – Session 1: Question results
0
20
40
60
80
100
120
1 2 3 4 5 6 7
Aver
age
Sco
re
Question Number
Pre-Test
Post-Test
Pre-test Post-test
Mean 0.55 0.85
Mode 0.43 0.86
Std. Dev 0.1169 0.00433
Paired T-test
CI (0.26 – 0.41)
T-value 9.376
p-value <0.001
Table 9.3 – Session 1: Test comparison Table 9.4 – Session 1: T-test
result

53
Goal setting. Five of the 12 participants decided to create a SMART goal this first
session. Examples of the goals set included “I will choose a member in the congregation to talk
to when I feel stressed and talk to them at four times a week” and “I will pray every weekday this
week.” Two of the five participants resulted with a positive average GAS score at the end of the
four week follow-up, and one participant averaged a neutral (0) score. The average four-week
GAS score for all participants resulted as –0.92, which reflected the participants’ inability to
achieve all components of their SMART goals. Participants appeared to struggle with the
consistency aspect of their goals; if their goal was to talk to a member about their stressors four
times a week, they would only speak with them twice. Inability to accomplish the “measurable”
aspect of their goal led to a lower GAS score for that week.
Figure 9.2 – Session 1: Four-week GAS follow-up
Session 2 – Dietary modifications and BP management. The second session focused
on a healthy diet and lasted 60 minutes, with 8 individuals attending the session, all of whom
Week 1 Week 2 Week 3 Week 4
1760 0 -1 0 -1
2111 -1 1 0 0
3430 0 1 1 0
5685 1 1 0 0
6156 0 -1 0 0
-2
-1
0
1
2
GA
S S
core
PID

54
attended the previous session. This session began with a detailed breakdown of the salt content
of popular Haitian foods and seasoning. Cooking modifications were introduced by the DNP
student, along with a home-made alternative to the popular Maggi seasoning cubes used in many
Haitian meals. While some participants received perfect scores in the pre-test, not one question
was answered correctly by all participants in the pre-test. Three of the seven post-test questions
were answered correctly by all participants (questions 3, 5, and 8; see Appendix F) (Figure 9.3).
The range of pre-test scores was 57–100%, with a mean score of 76%; post-test scores ranged
from 71–100%, with a mean score of 89.3% (Table 9.5). The mean difference (95% confidence
interval) was 11% (–0.1 – 0.32), The paired T-test resulted with a T-value of 1.23 and an
insignificant p-value of 0.258, denoting there was not a significant change between pre-test and
post-test score for this group of participants (Table 9.6).
Figure 9.3 – Session 2: Questions results
0
20
40
60
80
100
120
1 2 3 4 5 6 7
Aver
ge
Sco
re
Question Number
Pre-Test
Post-Test

55
Goal setting. 100% of participants (8 out of 8) set a SMART goal after session two.
Goals included “I will substitute a homemade Maggi cube in two of my meals,” “I will follow
the MyPlate (a food guide released by the United States Department of Agriculture that stresses
portion control (2017)) example for one meal a day,” and “I will use a measuring spoon while
cooking all my meals.” During the course of the four-week follow-up, no participants received a
negative score, reporting that they were successful in maintaining their SMART goal. After
four weeks, the average goal attainment score was 0.875, indicating an above-average ability to
maintain their individualized goals.
Pre-
test Post-test
Mean 0.83 0.89
Mode 0.86; 1 0.86
Std.
Dev 0.1728 0.1016
Paired T-test
CI (-0.1003 – 0.3178)
T-
value 1.2301
p-
value 0.2584
Table 9.5 – Session 2: Test comparison Table 9.6 – Session 2: T-test results

56
Figure 9.4 – Session 2: Four-week GAS follow-up
Session 3 – Physical activity and BP. The third session focused on physical activity and
weight management. Participants were taught about the differentiating factors between exercise
and physical activity, how to determine their healthy weight, and the proper way to set SMART
goals for their physical activities. The session lasted 45 minutes and had 9 participants—5 of
the participants attended both of the previous sessions, 2 attended 1 previous session, and the
remaining 2 participants had not attended a previous session. Pre-test scores ranged from 46–
86% with a mean score of 64%. Question seven on the pre-test received the widest variety of
answers regarding the relationship between weight loss and its effect on BP (see Appendix H)
(Figure 9.5). Post-test scores had a mean score of 87%, ranging from 53–100% and with 4 of 9
participants scoring 100%. All participants answered two questions correctly on the post-test
Week 1 Week 2 Week 3 Week 4
7535 2 2 0 2
2976 2 2 0 1
1399 1 1 1 0
5588 2 1 0 2
1006 0 1 0 0
8633 0 1 0 0
2111 2 1 2 1
2981 1 2 1 1
-2
-1
0
1
2
GA
S S
core
PID

57
(questions two and seven; see Appendix H) (Table 9.7). The mean difference (95% confidence
interval) was 24% (0.13 – 0.35). The paired T-test resulted with a T-value of 5.099 and a
significant p-value = < 0.001, illustrating that there was a significant difference between the pre-
test and post-test score for this group of participants (Table 9.8).
Figure 9.5 – Session 3: Question results
Goal setting. Five of the nine participants chose to set a SMART goal following the end
of the session. SMART goals for this session included “I will continue walking for 30 minutes a
day 3 days a week” and “I will walk with my father 2 times a week for 45 minutes.” The
majority of the participants maintained a positive GAS score at the end of the four-week follow-
0
20
40
60
80
100
120
1 2 3 4 5 6 7
Aver
age
Sco
re
Question Number
Pre-Test
Post-Test
Paired T-test
CI (0.1328 – 0.352)
T-value 5.0992
p-value <0.001
Pre-test Post-test
Mean 0.64 0.89
Mode 0.57;
0.71 1
Std.
Dev 0.1174 0.137
Table 9.7 – Session 3: Test
comparison Table 9.8 – Session 3: T-test results

58
up, with the highest score (i.e., the strongest ability to maintain their SMART goal) resulting in
0.75, and the lowest and sole negative score resulting in –0.2.
Figure 9.6 – Session 3: Four-week GAS follow-up
Session 4 – Medication management and symptom recognition. The final session
discussed medications used to treat HTN, general medication management, and the proper
symptom recognition of heart attack and stroke. This class also stressed the importance of
knowing the available resources for healthcare within the participants’ communities, touching on
the resources printed in the “Taking Control of Your blood pressure” booklet. The session
lasted approximately 40 minutes and had 12 participants, all of whom had attended previous
sessions, with 4 attending all three previous sessions, 2 attending at least 2 previous sessions, and
6 attending 1 previous session. Pre-test scores ranged between 48–86% with a mean score of
61%, and there was not one question that was answered correctly by every participant (Figure
9.7). The pre-test question that received the largest variety of answers concerned recognizing
Week 1 Week 2 Week 3 Week 4
6156 0 -1 0 0
5695 1 1 0 0
3430 0 1 1 0
2111 -1 1 0 0
1760 0 -1 0 -1
-2
-1
0
1
2
GA
S S
core
PID

59
stroke signs (“Which one is a correct way to remember stroke signs?” / Face, Arm, Speech,
Time) (Table 9.9). The mean difference (95% confidence interval) was 31% (0.21 – 0.42). The
paired T-test resulted with a T-value of 6.74 and a significant p-value = < 0.001, indicating a
statistically significant change of test scores from pre- to post-test (Table 9.10).
Figure 9.7 – Session 4: Question results
Goal setting. No goals were set by this session’s participants.
Four-week Post-session Surveys. Anonymous post-session surveys (Appendix L) were
distributed the following Sunday after completion to assess the reception of the course by
participants (Figure 9.8). The survey asked about the ease of comprehension of each individual
session, as well as if the participants benefited from the class being taught in Haitian Creole.
0
20
40
60
80
100
120
1 2 3 4 5 6 7
Ave
rage
Sco
re
Question Number
Pre-Test
Post-Test
One-sample, paired T-test
CI (0.2909 – 0.4123)
T-value 6.7406
p-value <0.001
Pre-test Post-test
Mean 0.61 0.92
Mode 0.57 1
Std.
Dev 0.1231 0.1143
Table 9.9 – Session 4: Test
result
Table 9.10 – Session 4: T-test results

60
Members were allowed to take the surveys home to complete and return them within two weeks.
A total of 13 surveys were completed. No statement on the survey received a 100% “agree”
score, yet a larger percentage selected “agree” over any other option (“do not agree,” “not sure,”
“does not apply”). Participants were also allowed to provide written recommendations for
improvement for future sessions. Only 1 of the 13 participants returned an answer in this
section, stating “no need to [make improvements].”
Figure 9.8 – Post-session surveys
0
2
4
6
8
10
12
14
Agree
Do not agree
Not sure
Does not apply

61
Chapter 10: Discussion
Overall, the completed program supported previous evidence that a culturally-based
health educational program is well-received by the target population and tends to produce a
statistically significant increase in knowledge, as evidenced by significant p-values in three of
the four sessions. The intent of this program was to evaluate the increase of knowledge the
sample group exhibited and their ability to create and maintain SMART goals over a four-week
period. Three of the four sessions produced a statistically significant increase of test scores
(Sessions 1, 3, and 4), SMART goals were set after three of the four sessions (Sessions 1–3) and
a positive GAS score was obtained for two of those three sessions (Session 2 and 3). This self-
management program supports a community/group presentation model, mirroring the success of
previous programs aimed towards minority populations in similar settings, specifically targeting
adult participants in a faith-based setting. Participants in this project agreed that attending the
program within their organization was accessible and trustworthy, similar to other studies (Lynch
et al., 2014; Gittner et al., 2007).
As described by previous studies, “cultural competence” was another important aspect of
this program, as culturally-relevant information, especially in regards to diet and terminology of
certain disease processes, may have allowed participants a better connection with their disease
and encouraged reasonable lifestyle changes (Betancourt et al., 2003; Ehrlich et al., 2015). Per
the post-session survey, 12 of the 13 (92%) of the participants believed information from this
course was relevant to their culture, and 11 of the 13 (85%) participants believed they benefited
62
from the sessions being taught in Haitian Creole. Though the sample of this project was
small, the positive reaction to this culturally-competent group model encourages similar future
endeavors. The participants may have benefited from the small sample size, along with their
history as an established community. Interaction consisted of questions to the DNP students and
amongst each other, and some participants suggested lifestyle changes to others.
Results from the Health Demographic Survey (HDS) did not match all the results from
previous studies’ demographics. This group was younger and held higher levels of education
compared to other studies focused on Haitian immigrants (Sanon et al., 2014; Sanon et al., 2016;
Allen et al., 2013; Lubetkin et al., 2015). Categories that matched previous studies were the
groups’ gender majority (female) and hesitancy to disclose financial information.
Due to the large number of participants that stated Maggi is a familiar seasoning in their
household, the DNP student focused on that product during the dietary session by detailing its
ingredients, their side effects and providing alternatives. This seasoning was also used to create
SMART goal examples. In turn, two of the goals set the week following the class regarding
dietary changes were centered about eliminating and replacing the Maggie seasoning cube in the
daily recipes. HDS respondents’ answers regarding the effects of modifiable risk factors
assessed the participants’ association with the Health Behavior Theory’s “perceived benefits”
and “perceived severity” constructs. Many of those who chose to answer questions stated that
they believed the changes to their diet, activity level and medication management would
positively affect their blood pressure reading. The participants acknowledged the implications of
a change of behavior, important steps in a successful educational program.
Of the 23 participants that completed the small physiological assessment, four
participants, three (33%) of the men and one woman (7%), fit the hypertensive/ hypertensive
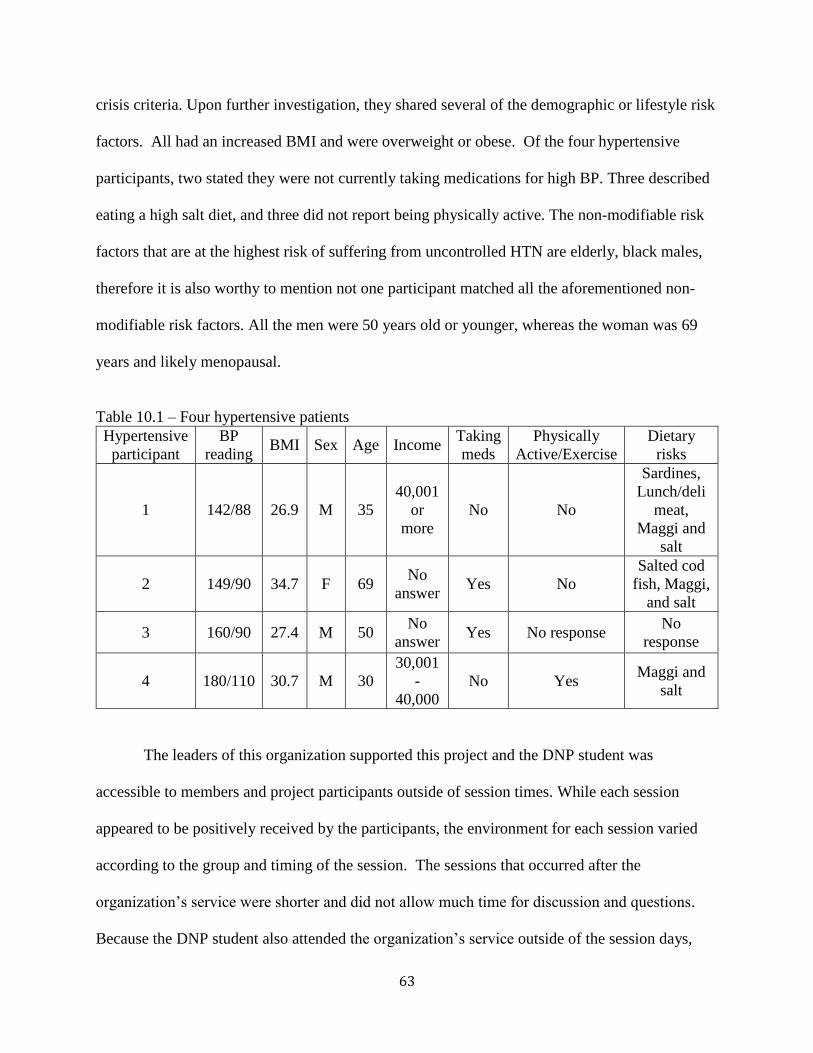
63
crisis criteria. Upon further investigation, they shared several of the demographic or lifestyle risk
factors. All had an increased BMI and were overweight or obese. Of the four hypertensive
participants, two stated they were not currently taking medications for high BP. Three described
eating a high salt diet, and three did not report being physically active. The non-modifiable risk
factors that are at the highest risk of suffering from uncontrolled HTN are elderly, black males,
therefore it is also worthy to mention not one participant matched all the aforementioned non-
modifiable risk factors. All the men were 50 years old or younger, whereas the woman was 69
years and likely menopausal.
Table 10.1 – Four hypertensive patients
Hypertensive
participant
BP
reading BMI Sex Age Income
Taking
meds
Physically
Active/Exercise
Dietary
risks
1 142/88 26.9 M 35
40,001
or
more
No No
Sardines,
Lunch/deli
meat,
Maggi and
salt
2 149/90 34.7 F 69 No
answer Yes No
Salted cod
fish, Maggi,
and salt
3 160/90 27.4 M 50 No
answer Yes No response
No
response
4 180/110 30.7 M 30
30,001
-
40,000
No Yes Maggi and
salt
The leaders of this organization supported this project and the DNP student was
accessible to members and project participants outside of session times. While each session
appeared to be positively received by the participants, the environment for each session varied
according to the group and timing of the session. The sessions that occurred after the
organization’s service were shorter and did not allow much time for discussion and questions.
Because the DNP student also attended the organization’s service outside of the session days,

64
participants were able to ask additional questions regarding the information taught in previous
sessions. However, it may have been beneficial to the group if there was a proper allocation of
time for those questions to be asked during the session. Allowing the elders of the organization
(the deacons and the CHO member) to attend each session was also beneficial to the project in
regards to encouraging questions and conversation amongst participants. In the first two
sessions, participants did not begin to ask questions or make statements regarding their self-
management until an established elder of the organization made a statement. This interaction
supports Allen and colleagues’ (2013) claim regarding the importance of involving leaders of the
faith organization in the entirety of the health education intervention. As participants noted
members of their “support system” discussing health concerns with the DNP student, it is
possible the comfort level within the group increased and they, in turn, were able to directly
address their concerns.
The sole session that did not produce a significant increase in test results was the second
session regarding dietary changes. Session 2 had a larger time allocation than the other sessions,
allowing more time for discussion. As such, the insignificant statistical increase of the post-tests
was unexpected. However, this session had the highest percentage of participants who decided
on a SMART goal for the upcoming month. The lack of significance difference in the pre-/post-
test results may be related to the higher pre-test scores than in other sessions, therefore limiting
the potential of post-test scores to show a significant increase. This session also had a smaller
sample of participants (n = 8) compared to the other three sessions.
The incentives given during this project were behavioral change incentives compared to
incentives to increase retention (i.e. financial compensation). A detailed assessment into the
effectiveness of the incentives was not completed with this project. However, some participants’

65
SMART goals included the use of incentives given: “I will measure the salt I use in my meals”
(measuring spoons – Session 2), “I will walk 7,000 steps a day for at least 5 days this week”
(pedometer – Session 3). Those goals received positive GAS scores at the conclusion of the four-
week follow up. While it cannot be assumed that SMART goals were a direct result of those
incentives, supplying the participants with objects that would allow them to reach their goals and
handouts that allowed the participants to monitor their progress, such as the “Action Tools”
booklet distributed to every participant, may have encouraged the participants in their goal
attainment.
All reasons as to why session sizes varied are unknown. Some attendees of the
organization stated they had prior engagements (work, meetings, childcare limitations) that
interfered with attending additional sessions. Since not all attendees were questioned regarding
their lack of attendance, the DNP student cannot conclude that additional incentives would have
encouraged additional members of the organization to complete the educational courses. Four
participants attended all four sessions (Table 10.1). Though each educational session was
designed to be independent from one another, due to the problem of attrition found in previous
studies (Crook et al., 2009; Peterson, 2011), the DNP student expected to see improved scores in
the later sessions for participants who were present for the entire program. However, the average
increase in test scores for those four “full course participants” fell within the confidence interval
of each session’s T-test, signifying there was no difference between their scores when compared
to the entire group.

66
Table 10.2 – Comparison of full course participants
Session
number
Average change in
score (full course
participants)
Session Mean
difference (entire
group)
Session confidence
interval (entire group)
1 29% 30% (0.23 – 0.37)
2 15% 11% (-0.1 – 0.32)
3 21.5% 24% (0.13 – 0.35)
4 39.5% 31% (0.21 – 0.42)
Of these four full course participants, only one set a goal for Sessions 1–3. Ideally, a
participant who set multiple SMART goals would display an increase in overall GAS scores for
each goal (i.e., an increased ability to achieve and maintain all aspects of the SMART goals).
The GAS score of this single participant fluctuated with the rest of the participants; the
participant received an overall negative GAS score following Session 1 (–1), a positive GAS
score for Session 2 (1.4), and a positive but lower score for Session 3 (0.2). It also may have
been more difficult for the participant to maintain all aspects of all four SMART goals during the
short follow-up period. While attending the complete Hypertension for Haitian Immigrants
program is encouraged, at this time there is no evidence to support the notion that attending all
four sessions will increase the ability of participants to absorb knowledge regarding HTN and/or
maintain their SMART goals.
Goals from the first session may not have been as attainable or realistic as goals for the
following two sessions. Session 1’s goals were specific, but participants may have been unable
to reach said goal due to its increased frequency (i.e., “I will talk to a church member four times
a week”). Sessions that were associated with topics that were more measurable and time-
specific, such as dietary modifications and physical activity, seemed to fair better with the
participants (setting a numerical value to the amount of time they would be physically active vs.
increased time in prayer and talking to others about stressors). Participants who set SMART
67
goals such as “I will walk 30 minutes a day with my daughter three days a week” and “I will
change one of my meals a day to match the ‘My plate’ guide” received positive GAS scores after
the four-week follow-up, compared to the negative scores from Session 1.
These differences in GAS scores may also be related to the incentives given: measuring
spoons and pedometers, both resources that may have simplified their goal achievement. There
was no common trend between the participants’ GAS scores over the course of the program, but
the highest scores were seen for the second session. This may be due to the longer allocation of
time for that session and more intimate group size, allowing for more group interaction, which
could indicate that more personal interaction can lead to an improved likelihood of goal
achievement. Due to short intervention time and not monitoring/tracking BP, no conclusions can
be drawn to determine if this program aided in the reduction of BP in hypertensive patients.
Session 4 was the only session where no participants set a SMART goal. More “group
sharing” was completed during this session than in any previous session. The participants shared
their current medication management techniques and their experiences with family members and
friends who suffered from a stroke or heart attack. During the session, it became apparent that
many of the participants practiced medication management routines that allowed them to
efficiently administer their medications. Time constraints limited the ability to further divulge
their reasons as to why no goals were made. Perhaps the participants felt that no change was
necessary in that aspect of their self-management.
An unforeseen, historical event may have impacted this project. Hurricane Matthew
occurred prior to Session 4. Hurricane Matthew made landfall on the Tiburon Peninsula in Haiti
on October 4, 2016, the strongest hurricane to make landfall in that country since 1964. The
category four hurricane caused a total of 270 deaths in the area and damaged over 28,000 homes

68
(Wright & Carr, 2016). Matthew later moved to the United States and made landfall in South
Carolina on October 8, 2016 as a category one hurricane and left many areas in Georgia, North
Carolina, and South Carolina flooded and powerless (The Weather Channel, 2016). Fortunately,
the building that the faith organization is housed along with the homes of the members of the
organization were undamaged. However, the aftermath of the hurricane in Haiti brought to light
the effect of transnationalism on the congregation. Many of the members’ extended family still
live in Haiti, and while they were all safe and accounted for after the storm, the members raised
supplies and remittances within a couple of weeks to send to those living in the affected areas.
While the members stressed that these donations were trivial in expenditure, it is not known if
sacrifices were made in order to afford supplies and safely transfer them to Haiti. The concern
about their extended family and other Haitians living in Haiti over their own needs may have
affected participants’ ability to purchase healthier food options or their normal medications, and
the situation certainly added additional stress to their lives. When working with this immigrant
population, and other immigrants that may unknowingly ascribe to the transnationalism theory, it
is important to recognize the events that are occurring in their native country and discuss how
these events are affecting their lives and decisions in the United States. As mentioned
previously, the fourth and final session was the only session in which no participants set a
SMART goal. In addition to the rationale given above, the attention and concern of the
participants who attended this session may have resided with their Haitian counterparts
victimized by the storm, thereby affecting their decision to set a goal for weeks to come.

69
Chapter 11: Limitations
Sample size, poor participant retention, and attrition of the sample were the three largest
limitations to this project. Class sizes were never larger than 12 participants, making it difficult
to prove significance with such a limited number. Of the 25 different members who attended
various sessions, only 4 members attended all the sessions, and their test scores did not show a
significant difference compared to the test scores of those who attended three or less sessions.
Previous studies utilizing a convenience sample of minority populations also faced the problem
of attrition (Crook et al., 2009; Peterson, 2011). Due to this awareness, the DNP student
designed the sessions to allow participants to succeed whether or not they had any previous
knowledge. While a higher test score or GAS score in the final session for those that attended all
four sessions is ideal, these results verify the independence of each session. While the
partnership with the faith-based organization increased the convenience, community support, and
availability of the program for the participants, there were strict time constraints set by the
organization that limited the length of the class and the time between each session.
Certain questions may have been added to the Health Demographic Survey to gain a
more thorough background on the program’s participants. Though stress is becoming a more
relevant risk factor for hypertension, the DNP student did not have many questions regarding
stress and stress management techniques in the HDS. Questions such as “what things/topic cause
you to feel stressed?” and “What do you do if you feel stressed?” may have increased the
specificity of stress management techniques presented in the first session.

70
Hurricane was an external event that occurred at the same time as the 4th educational
session and affected the setting of SMART goals by the participants. This unforeseen event not
only physically affected the citizens of Haiti and the east coast of the United States, but it may
have caused emotional unrest in the participants of the study. The final session was completed as
planned the Sunday following the storm, but no one formed SMART goals. The emotional
effects of the destruction the storm caused in Haiti are unknown.
Finally, there are limited amounts of literature and materials available that center on
Haitian immigrants and, even more specifically, their management of HTN. The DNP student
therefore created all the culturally-specific education materials and tools utilized in this program,
and subsequently they were not validated. This project marks the first time this toolkit was
utilized in the community. Since the questions had not been analyzed prior to these sessions, the
accompanying test questions derived from them were not measured for their validity and
reliability in regards to illustrating an increase in knowledge within the target population and
may have also had a wide range of difficulty. For instance, the first question from the first
session’s pre-/post-test showed no change during the comparison, and no participants were able
to choose the correct answer. A few other questions in the did not have an increase of correct
answers in the pre-test/post-test comparisons (Session 1: questions one and two; Session 2:
questions one and four, and Session 3: question five). The lack of increase in correctly selecting
answers may be due to the ease of the questions. The remaining questions had equally varying
answers during the pre-test and a high percentage of correct answers for post-test results. In
retrospect, this DNP student suggests analyzing each question for validity and reliability before
using them again, especially those that showed no change in pre-/post-tests.

71
Chapter 12: Suggestions for Further Research
Upon review of the course implementation process, the following suggestions are
recommended prior to offering this course again: strategies to increase participants’ retention,
testing the validity and reliability of test questions for the sessions, and planning an extended
follow-up period. Implementing a method to decrease attrition, such as requiring participants to
sign up for the sessions beforehand to ensure attendance, may improve retention of the
information and allow a better flow between courses. A longer allocation of time for each
session (e.g., presenting the sessions at the faith-based organization’s infrastructure but on a
different day from the religious service) could also improve the pre-/post-test results and
encourage more participants to create SMART goals under the instructor’s guidance. This study
also indicates that increased session length may have a positive effect on participants and
increase the likelihood of successful SMART goal achievement. The DNP student spoke with
participants who created SMART goals after each session and every week for the follow-up, but
did not have contact with participants’ friends and/or family members. Obtaining consent from
participants to discuss their individualized goal with their support system may also increase the
sustainability of said goal. There are some additional alterations to the toolkit that could be
made based on the questions from the participants throughout the sessions, such as the difference
between the methods of recording BP measurement in Haiti versus the United States (Session 1),
caloric and sodium content of American snack foods (Session 2), and the dosage of medications
and the importance of not sharing medications with friends and family (Session 4).
72
Future utilizers of this toolkit should adjust text questions according to the answer
received from the DHS to acknowledge gaps in learning as the practitioners see fit. Additional
questions regarding stress and stress management should also be added to the DHS. Those
questions can then be reconstructed to assure reliability and validity. The proper reconstruction
of test questions may show improved results with future participants.
A longer follow-up period may also be insightful, as it will allow time to evaluate if goals
started during the program are continued afterwards as permanent healthy life changes. This
project only required that the participants be contacted on a weekly basis for one month;
previous research has noted that lifestyle changes must be long-term in order to produce a
recognizable change in BP measurements (Schillaci et al., 2003; He et al., 2013; Epstein et al.,
2012; Borjesson et al., 2016) and a lower risk of cardiovascular events.

73
Chapter 13: Conclusion
The utilization of culturally-relevant information regarding the self-management of HTN
was well-received in this program and showed an encouraging increase in knowledge among an
at-risk minority population. Accessing the Haitians’ strong foundations of community, faith,
and culture to encourage positive lifestyle changes and increase awareness concerning managing
chronic diseases proved beneficial for both the participants and for the implementation of future
studies. While this project did not produce strong statistical support in regards to participants
creating and maintaining individualized SMART goals, the moderately positive GAS scores
showed promise and indicated this study’s validity as a point of reference for future educators
and healthcare professionals aiming to cross cultural barriers.
The need for the healthcare industry to be in touch with foreign-born populations is
becoming more relevant by the year. In the most recent data collected by the U.S. Census
Bureau, 1.3 million individuals immigrated to America in 2014, an 11% increase from the
previous year (Zong & Batalova, 2016). With that number predicted to continue to rise in the
future, healthcare providers must seriously consider expanding available resources to properly
educate these immigrant populations. Identifying and categorizing differing minority groups
from their broader racial counterparts is imperative in order to responsibly serve their medical
needs and provide culturally-appropriate care. This toolkit exemplifies the positive outcomes of
such educational material and may well serve as a foundation and model for future healthcare
providers and health educators to service this burgeoning population.

74
Appendix A
IRB Statement
To: Lunise Benjamin
School of Nursing
From: Office of Human Research Ethics
Date: 5/06/2016
RE: Determination that Research or Research-Like Activity does not require IRB Approval
Study #: 16-1224
Study Title: Culturally Appropriate Hypertension Education for Haitian Immigrants: A Faith-based Health
Promotion Program
This submission was reviewed by the Office of Human Research Ethics, which has determined that this submission
does not constitute human subjects research as defined under federal regulations [45 CFR 46.102 (d or f) and 21
CFR 56.102(c)(e)(l)] and does not require IRB approval.
Study Description:
Purpose: 1) Examine Haitian immigrants’ understanding of hypertension and if cultural differences exist within their
hypertension self-management; 2) to implement a community-based culturally appropriate self-management course
using evidence based guidelines at a faith based organization in central North Carolina.
Participants: A small convenience sample of non-pregnant adults ages 18-79 years old of Haitian descent
Procedures (methods): After IRB approval and consent (Appendix A), all participants will complete a demographic
and health survey (Appendix B). Selected participants will complete confidential interviews (Appendix C) one
month before educational classes. Interview answers will assist in teaching content to make it culturally competent.
Four classes on hypertension self-management and goal setting will be taught over four to six weeks. Project
evaluation will be determined by pretest/post test scores and goal attainment.
Please be aware that approval may still be required from other relevant authorities or "gatekeepers" (e.g., school
principals, facility directors, custodians of records), even though IRB approval is not required.
If your study protocol changes in such a way that this determination will no longer apply, you should contact the
above IRB before making the changes.

75
Appendix B
Health and Demographic Survey – English
Consent
Name:
By completing this survey, I hereby consent voluntarily to be a participant in this DNP
project. All information given during this project will be kept confidential.
Signature: __________________________ Date ____________________
May the DNP student, Lunise Benjamin contact you?
Yes ______________ No______________________
What is the best way to contact you? 1. Phone number _______________________
2. Email __________________________
3. Face-to-face at Sunday’s service
Phone Number ________________________________________
FOR RESEARCHER USE ONLY
ID #:
Height:
Weight:

76
What is your gender?
a. Female
b. Male
2. What is your age?
3. What is your yearly income level?
a. Less than 20,000
b. 20,001 – 30,000
c. 30,001 – 40,000
d. 40,001 or more
4. What is the highest level of
education you have completed?
a. 1st – 5th
b. 6th – 9th
c. High School
d. Vocational/trade school
e. Some college
f. College
g. Graduate (post BS)
h. Other
5. Are you employed?
a. Yes
b. No
6. What kind of work do you do?
7. Where were you born?
a. Haiti
b. United States (skip next question)
c. Other
8. What year did you move to live in
the United States?
9. Do you have health insurance?
a. Yes
b. No (skip next question)
10. What kind?
a. Private insurance
b. Insurance from work
c. Medicare
d. Medicaid
11. Do you have prescription insurance?
a. Yes
b. No
12. If you need to take medications, can
you afford them?
a. Yes
b. No
13. Do you see your doctor at least once
a year?
a. Yes
b. No
14. How do you get to your doctor’s
appointments?
15. Which one of these conditions do
you have? (Select all that apply)
a. High blood pressure
b. High cholesterol
c. Diabetes
d. Heart attack
e. Stroke
f. Kidney disease
g. Heart failure
16. Has anyone told you that you have
high blood pressure?
a. Yes
b. No
17. Are you on medication for high
blood pressure?

77
a. Yes
b. No
18. Do you take them at the same time
everyday?
a. Yes
b. No
19. Who picks up your medications?
a. I do
b. A family member
c. A friend
d. They are mailed
20. Do you believe medication will help
lower blood pressure?
a. Yes
b. No
c. Maybe
21. Do you eat canned foods?
a. Yes
b. No
22. Do you eat the following foods? If
yes, please circle which ones:
a. Salted cod fish (mori)
b. Salted herring (aranso)
c. Sardines
d. Smoked turkey
e. Lunch/deli meat
23. Do you use Maggi, Adobe or Sazon
when cooking?
a. Yes
b. No (skip next question)
24. Do you use salt with the Magi,
Adobe or Sazon?
a. Yes
b. No
25. Who buys the groceries at your
house?
a. I do
b. A family member
c. A friend
26. Do you believe changing the food
you eat will help lower blood
pressure?
a. Yes
b. No
c. Maybe
27. Do you exercise?
a. Yes
b. No
28. If yes, what do you do?
29. For how long?
30. How many times a week?
31. Does exercising help lower blood
pressure?
a. Yes
b. No
c. Maybe
32. Do you feel you are overweight?
a. Yes
b. No
33. Who do you go to for medical
advice?
a. My doctor
b. Family/friends
c. Pastor
d. Internet
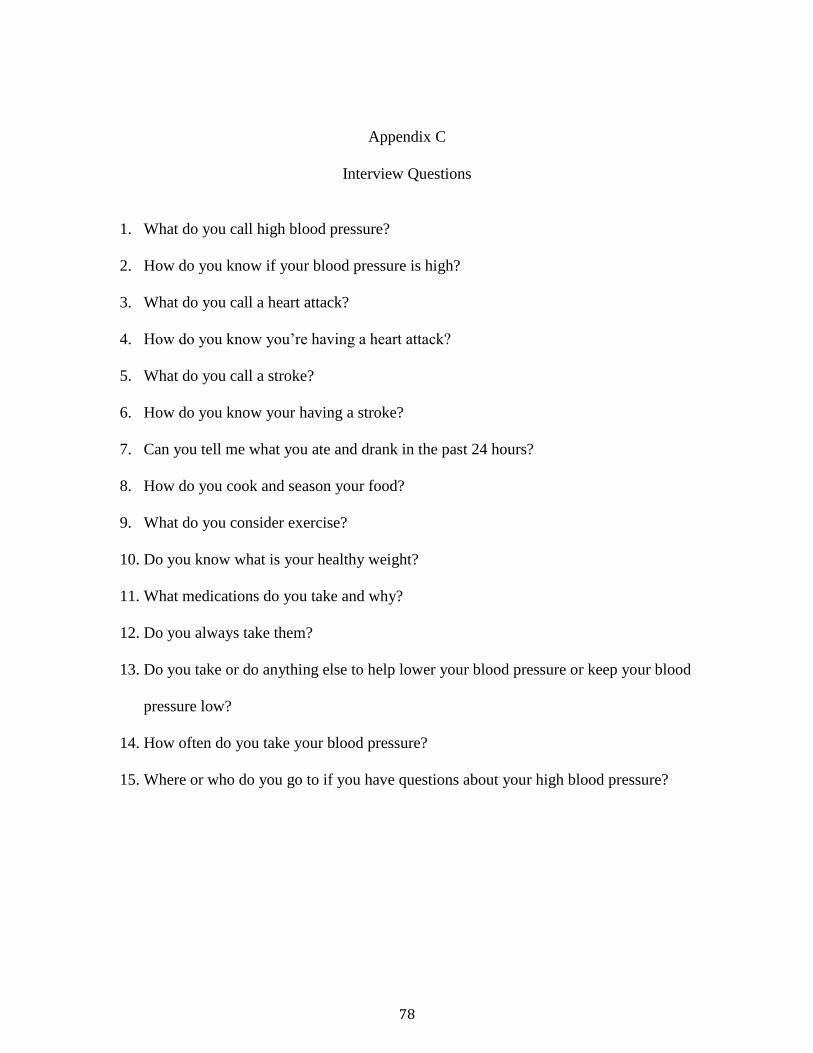
78
Appendix C
Interview Questions
1. What do you call high blood pressure?
2. How do you know if your blood pressure is high?
3. What do you call a heart attack?
4. How do you know you’re having a heart attack?
5. What do you call a stroke?
6. How do you know your having a stroke?
7. Can you tell me what you ate and drank in the past 24 hours?
8. How do you cook and season your food?
9. What do you consider exercise?
10. Do you know what is your healthy weight?
11. What medications do you take and why?
12. Do you always take them?
13. Do you take or do anything else to help lower your blood pressure or keep your blood
pressure low?
14. How often do you take your blood pressure?
15. Where or who do you go to if you have questions about your high blood pressure?

79
Appendix D
What is High Blood Pressure?
Hypertension Education for Haitian Immigrants
Class 1 of 4
Overview
Black Americans have the highest prevalence of hypertension in the United States (American
Heart Association, 2014). This first class will focus on the basics of hypertension (i.e.
mechanics, long-term effects, and prevalence within their community). Information for this
class, and further classes, will be displayed in a group format with accompanying illustrations.
Time will be provided for questions and one-on-one interactions between participants and
instructor.
The risk factor focus of the week is stress. Evidence has shown that stress may be an important
contributor to hypertension (Schneider et al., 2005). Haitians may have an increased amount of
stress due to their immigrant status and transnationalism (Allen et al., 2013). A study analyzing
the long-term effects of stress management noted results as high as a 10 mmHg decrease of
systolic blood pressure in the African-American community (Barnes, Schneider, Alexander, &
Staggers, 1997). Methods of managing stress will be shared. Participants will be given the
opportunity to create personal goals at the end of class.
Some educational programs have shifted to focus on individual outcomes, therefore holding both
the patient and provider more accountable for the effectiveness of interventions. In order to
better measure the success of the interventions, individualized goal setting has been used as an
outcome measure by researchers. The SMART (Specific, Measurable, Acceptable, Realistic, and
Time-bound) method is a quick, patient centered method in goal construction that may be
suitable for most situations (Bovend'Eerdt, Botell, & Wade, 2009). SMART goals will be
covered in each class. Participants will be encouraged to either chose a SMART goals from their
Action Tools booklet, or create one of their own after each class.
Objectives
At the end of the class, participants will be able to:
• Understand the basics of high blood pressure
o Mechanics, causes, effects
• Identify which risk factors are modifiable
• Identify stressful triggers
• Recall ways to manage stress
Annotated description of content
• Definition of blood pressure and high blood pressure
• Debunking myths of symptomology regarding hypertension
• Naming risk factors
o Modifiable vs. non-modifiable
• Presenting numerical facts about blood pressure
• Showcase effects of poorly managed hypertension
• Identifying possible stress factors for that population
o Focus on the stresses of immigrant status in the United States (transnationalism)
• Ways to manage your stress
• `Defining SMART goals

80
• Creation of SMART goals
Adaptations/Recourses
American Heart Association (AHA)
Blood Pressure Canada
Evaluation
Pretest/ post-test evaluation
Materials
PowerPoint presentation
“Action tools” booklet
References
Allen, J. D., Mars, D. R., Tom, L., Apollon, G., Hilaire, D., Iralien, G., . . . Zamor, R. (2013).
Health beliefs, attitudes and service utilization among Haitians. Journal of Health Care
for the Poor and Underserved, 24(1), 106-119. doi:10.1353/hpu.2013.0015 [doi]
American Heart Association. (2014). High blood pressure
Barnes, V., Schneider, R., Alexander, C., & Staggers, F. (1997). Stress, stress reduction, and
hypertension in African Americans: An updated review. Journal of the National Medical
Association, 89(7), 464-476.
Blood Pressure Canada. (2008). Brief hypertension action tools. Retrieved from
http://www.cfpc.ca/uploadedFiles/Resources/Resource_Items/Health_Professionals/Brief
_Hypertension_Action_Tools.pdf
Bovend'Eerdt, T. J., Botell, R. E., & Wade, D. T. (2009). Writing SMART rehabilitation
goals and achieving goal attainment scaling: A practical guide. Clinical Rehabilitation,
23(4), 352-361. doi:10.1177/0269215508101741 [doi]
Schneider, R. H., Alexander, C. N., Staggers, F., Orme-Johnson, D. W., Rainforth, M.,
Salerno, J. W., . . . Nidich, S. I. (2005). A randomized controlled trial of stress
reduction in African Americans treated for hypertension for over one year. American
Journal of Hypertension, 18(1), 88-98. doi:S0895-7061(04)01008-8 [pii]
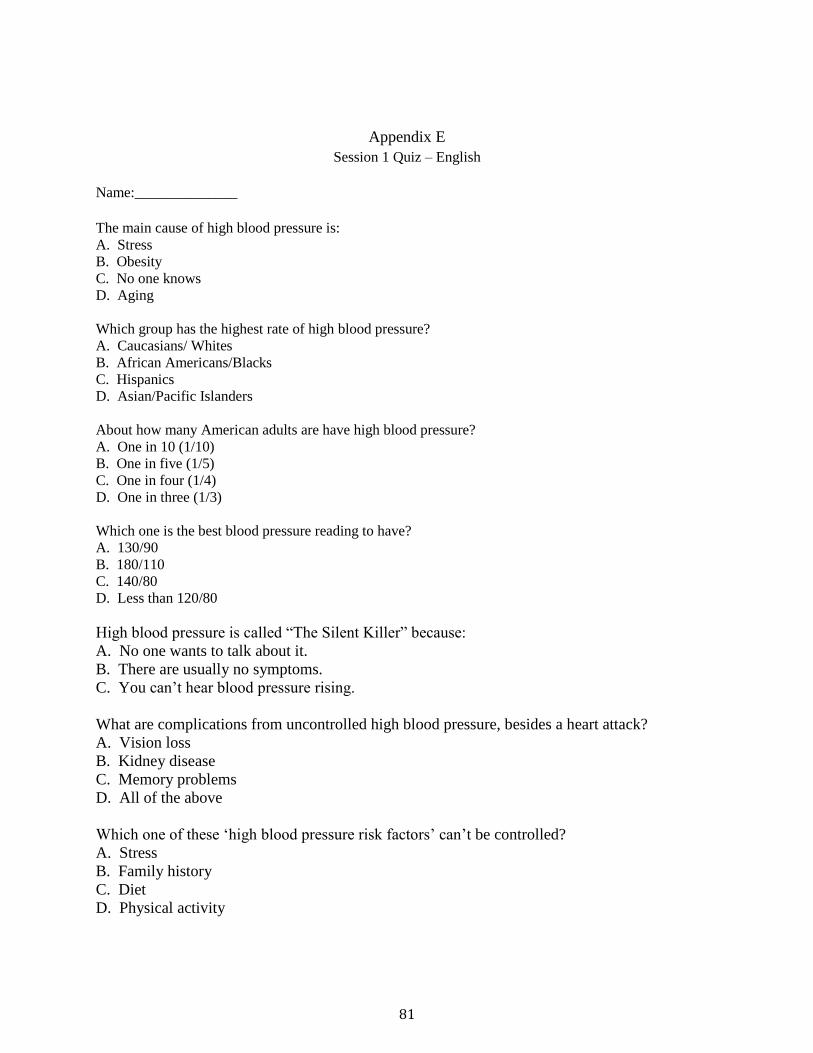
81
Appendix E
Session 1 Quiz – English
Name:______________
The main cause of high blood pressure is:
A. Stress
B. Obesity
C. No one knows
D. Aging
Which group has the highest rate of high blood pressure?
A. Caucasians/ Whites
B. African Americans/Blacks
C. Hispanics
D. Asian/Pacific Islanders
About how many American adults are have high blood pressure?
A. One in 10 (1/10)
B. One in five (1/5)
C. One in four (1/4)
D. One in three (1/3)
Which one is the best blood pressure reading to have?
A. 130/90
B. 180/110
C. 140/80
D. Less than 120/80
High blood pressure is called “The Silent Killer” because:
A. No one wants to talk about it.
B. There are usually no symptoms.
C. You can’t hear blood pressure rising.
What are complications from uncontrolled high blood pressure, besides a heart attack?
A. Vision loss
B. Kidney disease
C. Memory problems
D. All of the above
Which one of these ‘high blood pressure risk factors’ can’t be controlled?
A. Stress
B. Family history
C. Diet
D. Physical activity

82
Appendix F
Food, Salt and Hypertension Hypertension Education for Haitian Immigrants
Class 2 of 4
Overview
The AHA has identified increased sodium intake as a risk factors (AHA, 2014). The AHA
recommends no more than 2,400 mg of sodium daily, but notes that the healthiest option is less
than 1,300 mg. Those that reduce their salt (sodium) intake by 4 grams a day witness a
significant decrease in blood pressure (Ndanuko, Tapsell, Charlton, Neale, & Batterham, 2016).
There is not much known about Haitians and their intake of sodium and sodium containing
products. Using information gathered from the Health Assessment survey, this class highlights
the use of salted cod fish and Maggi. Visuals of salt and serving sizes will be used.
Objectives
At the end of the class, participants will be able to:
• Understand the effects of sodium/salt to blood pressure
• Recall the amount of salt recommended by the AHA
o Apply the recommendations to their meals
• Understand the effects of Maggi on BP and their health
• Understand the serving size concepts of the DASH diet and the 9-inch plate method
• Create personal goals regarding their sodium/salt intake and serving sizes
Annotated description of content
• What’s wrong with too much salt?
• How much sodium is ok?
• Where is all of this salt coming from?
• But my food doesn’t have that much salt…
• Maggi
• Salted cod and salted herring
• Eating at restaurants
• A balanced meal using the DASH diet or 9-inch plate method
• How can I change?
• What can happen when I change?
• Definition of SMART goals
• Examples of SMART goals
Adaptations/Resources
AHA
Association of Black Cardiologists
International Society of Hypertension in Blacks
Evaluation
Pretest/ post-test evaluation

83
Materials
PowerPoint presentation
Maggi Substitution recipe
References
American Heart Association. (2014). High blood pressure
Association of Black Cardiologists Inc,. (2016). ABC education resources. Retrieved from
http://www.abc-patient.com
Flo. (2016). Homemade stock cubes (basic version). Retrieved from
http://blog.allnigerianrecipes.com/homemade-stock-cubes/
International Society on Hypertension in Blacks. (2011). ISHIB: Devoted to ethnicity and
health. Retrieved from http://www.ishib.org
Ndanuko, R. N., Tapsell, L. C., Charlton, K. E., Neale, E. P., & Batterham, M. J. (2016).
Dietary patterns and blood pressure in adults: A systematic review and meta-analysis of
randomized controlled trials. Advances in Nutrition (Bethesda, Md.), 7(1), 76-89.
doi:10.3945/an.115.009753 [doi]

84
Appendix G
Session 2 Quiz
Name:____________________
Which one of these foods is not good for someone with high blood pressure to eat? A. Veggies
B. Salty snacks
C. Fruits
D. Bread
There is a direct relationship between sodium intake and blood pressure. A. True/yes
B. Fasle/no
Black people are more sensitive to salt. A. True/yes
B. False/no
Which has more sodium: 1 piece of salted cod or 1 tsp of salt? A. Salted cod (mori)
B. 1 tsp of salt
Which one of these foods is the best choice for someone with high blood pressure to eat? A. Baked fish
B. Fried pork (griot)
C. Salted herring (aranso)
D. Sardines
When making a plate of food, there should be more of which food group on the plate? A. Meats/fish/protein
B. Fruits
C. Vegetables
D. Rice
If I use Maggi in my food, I still need to add salt. A. True/yes
B. False/no
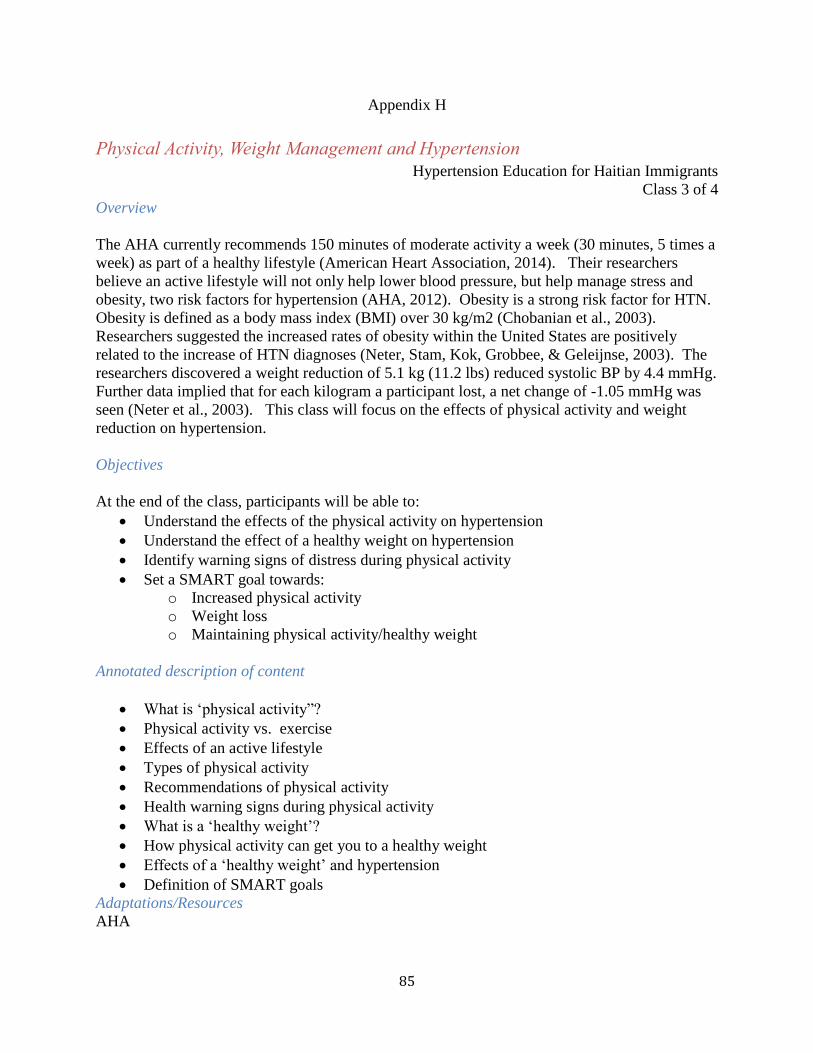
85
Appendix H
Physical Activity, Weight Management and Hypertension
Hypertension Education for Haitian Immigrants
Class 3 of 4
Overview
The AHA currently recommends 150 minutes of moderate activity a week (30 minutes, 5 times a
week) as part of a healthy lifestyle (American Heart Association, 2014). Their researchers
believe an active lifestyle will not only help lower blood pressure, but help manage stress and
obesity, two risk factors for hypertension (AHA, 2012). Obesity is a strong risk factor for HTN.
Obesity is defined as a body mass index (BMI) over 30 kg/m2 (Chobanian et al., 2003).
Researchers suggested the increased rates of obesity within the United States are positively
related to the increase of HTN diagnoses (Neter, Stam, Kok, Grobbee, & Geleijnse, 2003). The
researchers discovered a weight reduction of 5.1 kg (11.2 lbs) reduced systolic BP by 4.4 mmHg.
Further data implied that for each kilogram a participant lost, a net change of -1.05 mmHg was
seen (Neter et al., 2003). This class will focus on the effects of physical activity and weight
reduction on hypertension.
Objectives
At the end of the class, participants will be able to:
• Understand the effects of the physical activity on hypertension
• Understand the effect of a healthy weight on hypertension
• Identify warning signs of distress during physical activity
• Set a SMART goal towards:
o Increased physical activity
o Weight loss
o Maintaining physical activity/healthy weight
Annotated description of content
• What is ‘physical activity”?
• Physical activity vs. exercise
• Effects of an active lifestyle
• Types of physical activity
• Recommendations of physical activity
• Health warning signs during physical activity
• What is a ‘healthy weight’?
• How physical activity can get you to a healthy weight
• Effects of a ‘healthy weight’ and hypertension
• Definition of SMART goals
Adaptations/Resources
AHA

86
Evaluation
Pretest/ post-test evaluation
Materials
PowerPoint presentation
Pedometers (2 per participant)
References
American Heart Association. (2014). High blood pressure
Association of Black Cardiologists Inc,. (2016). ABC education resources. Retrieved from
http://www.abc-patient.com
Flo. (2016). Homemade stock cubes (basic version). Retrieved from
http://blog.allnigerianrecipes.com/homemade-stock-cubes/
International Society on Hypertension in Blacks. (2011). ISHIB: Devoted to ethnicity and
health. Retrieved from http://www.ishib.org
Ndanuko, R. N., Tapsell, L. C., Charlton, K. E., Neale, E. P., & Batterham, M. J. (2016).
Dietary patterns and blood pressure in adults: A systematic review and meta-analysis of
randomized controlled trials. Advances in Nutrition (Bethesda, Md.), 7(1), 76-89.
doi:10.3945/an.115.009753 [doi]

87
Appendix I
Session 3 Quiz
Name:_________________________
Being physically active means I have to go to the gym.
a. True/yes
b. False/no
If I want to start a specific exercise routine, I may have to talk to my doctor (or provider) first.
a. True/yes
b. False/no
Which of the following are benefits of being physically active?
a. It may help you lose weight
b. It helps lower your blood pressure
c. It helps you reduce stress
d. All of the above
You can get your required daily physical activity by doing which of the following:
(circle all that apply)
a. Walking to nearby grocery stores instead of driving
b. Engaging in home yard work
c. Dancing
d. Stair climbing
e. Actively playing with your child like playing soccer, or basketball
There is an age when you become too old to be physically active
a. True/yes
b. False/no
A healthy weight means my Body Mass Index (BMI) is less than:
a. 20
b. 25
c. 30
d. 35
If you have high blood pressure losing 10 pounds can decrease you blood pressure reading by
___ points. a. 2
b. 3
c. 4
0 (it won’t lower your blood pressure)

88
Appendix J
Medication Management and Symptom Recognition
Hypertension Education for Haitian Immigrants
Class 4 of 4
Overview
Proper adherence to medications and knowledge of warning signs of these conditions mark them
as preventable and treatable conditions. Non-adherence to prescribed medications is named one
of the top reasons for poorly managed BP in African-Americans (Solomon et al., 2015)
(Solomon, Schoenthaler, Seixas, Ogedegbe, Jean-Louis & Lai, 2015). Researchers found that
those African American patients that had consistent medication routines (i.e. taking their
medications at the same time every day) had an increase rate of medication adherence, which in
turn showed a decrease in systolic and diastolic BPs (Solomon et al., 2015; Young et al., 2015)
(Solomon et al., 2015; Young et al., 2015). The AHA also recommends home monitoring of
blood pressure for those diagnosed with hypertension. Tracking the readings show a “time-
lapse” picture of the patient’s blood pressure on a day-to-day basis (American Heart Association,
2014).
Early recognition of heart and attacks and strokes are key tools in reducing the mortality
associated with the event. Zerwic and colleagues discovered that African Americans had a
significantly longer delay time when compared to non-Hispanic whites (3.25 hours versus 2
hours) (2003). This class will focus on creating a routine for those that have multiple
medications, and how to recognize the signs and symptoms of a heart attack or stroke.
Objectives
At the end of the class, participants will be able to:
• Recognize the major categories of blood pressure medications
• Create ways to create routines for medications
• Identify the warming signs of a heart attack and stroke
Annotated description of content
• Why some people need medications
• Major categories for high blood pressure
• Ways to keep track of medications
• When to talk to your doctor or provider
• Chances of heart attack or stroke
• Heart attack warnings signs
• Stoke warning signs
• What to do next
• Review definition of SMART goals
• Examples of SMART goals for medication management, blood pressure monitoring
and/or being aware of warning sign & symptoms of heart attack and stroke with an
emergency action plan.

89
Adaptations/Resources
AHA
GlaxoSmithKline
Association of Black Cardiologists
Blood Pressure Canada
Evaluation
Pretest/ post-test evaluation
Program evaluation survey
Materials
PowerPoint presentation
Take home prize for one participant who attended all four session (blood pressure monitor)
References
American Heart Association. (2014). High blood pressure
Association of Black Cardiologists Inc,. (2016). ABC education resources. Retrieved from
http://www.abc-patient.com
Flo. (2016). Homemade stock cubes (basic version). Retrieved from
http://blog.allnigerianrecipes.com/homemade-stock-cubes/
International Society on Hypertension in Blacks. (2011). ISHIB: Devoted to ethnicity and
health. Retrieved from http://www.ishib.org
Ndanuko, R. N., Tapsell, L. C., Charlton, K. E., Neale, E. P., & Batterham, M. J. (2016).
Dietary patterns and blood pressure in adults: A systematic review and meta-analysis of
randomized controlled trials. Advances in Nutrition (Bethesda, Md.), 7(1), 76-89.
doi:10.3945/an.115.009753 [doi]

90
Appendix K
Session 4 Quiz
Name:________________________
High blood pressure medication is to be taken:
A. Under stressful situations
B. As often as your doctor or provider ordered
C. When activities require physical exertion
D. Whenever a patient feels bad
If you start feeling better and your blood pressure is low, you can stop taking your medication. A. True/yes
B. False/no
All high blood pressure medications work the same. C. True/yes
D. False/no
Which is a way to remember to take you medications? A. Take them at the same time everyday
B. Get a pill box
C. Write a note to yourself next to your favorite picture
D. All of the above
Which of these is NOT considered a heart attack warning sign?
A. Cold sweats
B. Nausea
C. Food cravings
D. Lightheadedness
Which one is correct way to remember stroke signs? A. Face, Actions, Sweat, Time
B. Faint, Arm, Sweat, Tremble
C. Forgetfulness, Appetite, Speech, Tremble
D. Face, Arm, Speech, Time
If you or someone around you are showing signs of a heart attack or stroke, what should you do?
A.Call 9-1-1 immediately.
B.Get someone to drive you to the emergency room. Now.
C.Drive yourself to the emergency room. Now.
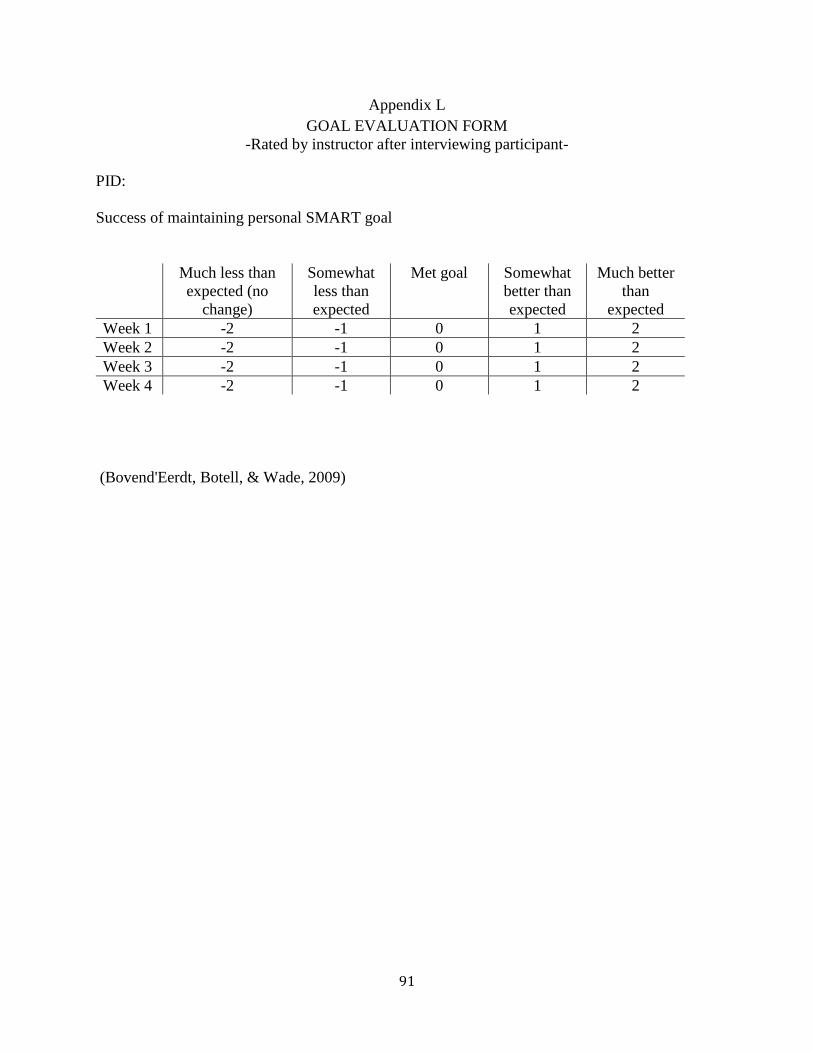
91
Appendix L
GOAL EVALUATION FORM
-Rated by instructor after interviewing participant-
PID:
Success of maintaining personal SMART goal
Much less than
expected (no
change)
Somewhat
less than
expected
Met goal Somewhat
better than
expected
Much better
than
expected
Week 1 -2 -1 0 1 2
Week 2 -2 -1 0 1 2
Week 3 -2 -1 0 1 2
Week 4 -2 -1 0 1 2
(Bovend'Eerdt, Botell, & Wade, 2009)

92
Appendix M
Survey
Name:
How can we improve?
______________________________________________________________________________
______________________________________________________________________________
______________________________________________________________________________
______________________________________________________________________________
Survey Questions Agree Somewhat
Agree
Somewhat
Disagree
Disagree Does
not
apply
1. These classes helped me
understand of the basics of blood
pressure.
2. These classes helped me
understand how food affects blood
pressure.
3. These classes helped me
understand how physical activity
affects blood pressure.
4. These classes helped me
understand the warning signs of a
heart attack and stroke.
5. The information in the classes
was relevant to my culture and
beliefs.
6. These classes helped me
understand goals and encouraged me
to set and keep them.
7. I benefited from the classes being
taught in Haitian Creole
8. I would recommend this class
and information to friends, family
and other Haitians if this it were
offered again.

93
REFERENCES
Ahmed, S., Shommu, N. S., Rumana, N., Barron, G. R., Wicklum, S., & Turin, T. C. (2015).
Barriers to access of primary healthcare by immigrant populations in Canada: A literature
review. Journal of Immigrant and Minority Health / Center for Minority Public Health,
18(6), 1522–1540. doi:10.1007/s10903-015-0276-z
Allen, J. D., Mars, D. R., Tom, L., Apollon, G., Hilaire, D., Iralien, G., . . . Zamor, R. (2013).
Health beliefs, attitudes and service utilization among Haitians. Journal of Health Care for
the Poor and Underserved, 24(1), 106–119. doi:10.1353/hpu.2013.0015
American Heart Association. (2012). American Heart Association recommendation for physical
activity. Retrieved in Fall 2015 from
http://www.heart.org/HEARTORG/HealthyLiving/PhysicalActivity/FitnessBasics/American
-Heart-Association-Recommendations-for-Physical-Activity-in-
Adults_UCM_307976_Article.jsp#.V1fI1YT5OfQ
American Heart Association. (2014a). Heart disease and stroke statistics- at a glance. American
Heart Association. Retrieved in Fall 2015 from http://www.heart.org/idc/groups/ahamah-
public/@wcm/@sop/@smd/documents/downloadable/ucm_480086.pdf
American Heart Association. (2014b). High blood pressure. Retrieved in Fall 2015 from
http://www.heart.org/HEARTORG/Conditions/HighBloodPressure/High-Blood-Pressure-
or-Hypertension_UCM_002020_SubHomePage.jsp
American Stroke Association. (2015). Impact of stroke. Retrieved in Fall 2015 from
http://www.strokeassociation.org/STROKEORG/AboutStroke/About-
Stroke_UCM_308529_SubHomePage.jsp
American Heart Association. (2016a). Understanding the American obesity epidemic.
Retrieved January 15, 2017 from
http://www.heart.org/HEARTORG/HealthyLiving/WeightManagement/Obesity/Understand
ing-the-American-Obesity-Epidemic_UCM_461650_Article.jsp#.WG1GHIT5OfQ
American Heart Association. (2016b ). The facts about high blood pressure. Retrieved January
11, 2017, from American Heart Association,
http://www.heart.org/HEARTORG/Conditions/HighBloodPressure/GettheFactsAboutHighB
loodPressure/The-Facts-About-High-Blood-
Pressure_UCM_002050_Article.jsp#.WHvM5IT5OfQ
Artinian, N. T., Fletcher, G. F., Mozaffarian, D., Kris-Etherton, P., Horn, L. V., Lichtenstein,
A. H., . . . Burke, L. E. (2010). Interventions to Promote Physical Activity and Dietary
Lifestyle Changes for Cardiovascular Risk Factor Reduction in Adults: A Scientific
Statement From the American Heart Association. Circulation, 122(4), 406-441.
doi:10.1161/cir.0b013e3181e8edf1

94
Association of Black Cardiologists Inc. (2016). ABC education resources. Retrieved in Winter
2015 from http://www.abc-patient.com
Bacon, S. L., Sherwood, A., Hinderliter, A., & Blumenthal, J. A. (2004). Effects of exercise,
diet and weight loss on high blood pressure. Sports Medicine, 34(5), 307–316. doi:
10.2165/00007256-200434050-00003
Barnes, V., Schneider, R., Alexander, C., & Staggers, F. (1997). Stress, stress reduction, and
hypertension in African Americans: An updated review. Journal of the National Medical
Association, 89(7), 464–476.
Bell, D., Holliday, R., Ormond, M., & Mainil, T. (2015). Transnational healthcare, cross-border
perspectives. Social Science & Medicine, 124, 284–289.
doi:10.1016/j.socscimed.2014.11.014
Betancourt, J. R., Green, A. R., Carrillo, J. E., & Ananeh-Firempong, O.,2nd. (2003).
Defining cultural competence: A practical framework for addressing racial/ethnic disparities
in health and health care. Public Health Reports, 118(4), 293–302.
Borjesson, M., Onerup, A., Lundqvist, S., & Dahlof, B. (2016). Physical activity and exercise
lower blood pressure in individuals with hypertension: Narrative review of 27 RCTs.
British Journal of Sports Medicine, 50(6), 356–361. doi:10.1136/bjsports-2015-095786
Bovend'Eerdt, T. J., Botell, R. E., & Wade, D. T. (2009). Writing SMART rehabilitation
goals and achieving goal attainment scaling: A practical guide. Clinical Rehabilitation,
23(4), 352–361. doi:10.1177/0269215508101741
Bureau of Democracy, Human Rights and Labor. (2012). Haiti 2012 international religious
freedom report. Retrieved in Fall 2015 from
http://www.state.gov/documents/organization/208698.pdf
Camarota, S. (2010). Fact sheet on Haitian immigrants in the United States. Retrieved in
Winter 2017 from http://cis.org/HaitianImmigrantFactSheet
Campbell, M. K., Hudson, M. A., Resnicow, K., Blakeney, N., Paxton, A., & Baskin, M.
(2007). Church-based health promotion interventions: Evidence and lessons learned.
Annual Review of Public Health, 28, 213–234.
doi:10.1146/annurev.publhealth.28.021406.144016
Centers for Disease Control and Prevention. (2015a). 100 congregations for million hearts.
Retrieved in Winter 2015 from http://millionhearts.hhs.gov/partners-progress/partners/100-
congregations.html
Centers for Disease Control and Prevention. (2015b). Heart disease facts. Retrieved in August
2015 from www.cdc.gov/heartdisease/facts.htm

95
Center for Disease Control and Prevention. (2016, June 16). Defying Adult Overweight and
Obesity. Retrieved January 10, 2017 from https://www.cdc.gov/obesity/adult/defining.html
Chapman, E. N., Kaatz, A., & Carnes, M. (2013). Physicians and implicit bias: How doctors
may unwittingly perpetuate health care disparities. Journal of General Internal Medicine,
28(11), 1504–1510. doi:10.1007/s11606-013-2441-1
Chobanian, A. V., Bakris, G. L., Black, H. R., Cushman, W. C., Green, L. A., Izzo, J. L.,Jr, .
. . National High Blood Pressure Education Program Coordinating Committee. (2003).
The seventh report of the Joint National Committee on Prevention, Detection, Evaluation,
and Treatment of High Blood Pressure: The JNC 7 report. JAMA, 289(19), 2560–2572.
doi:10.1001/jama.289.19.2560
Connell, P., Wolfe, C., & McKevitt, C. (2008). Preventing stroke: A narrative review of
community intervention for improving hypertension control in Black adults. Health &
Social Care in the Community, 16(2), 165–187.
Crook, E. D., Bryan, N. B., Hanks, R., Slagle, M. L., Morris, C. G., Ross, M. C., . . .
Arrieta, M. I. (2009). A review of interventions to reduce health disparities in
cardiovascular disease in African Americans. Ethnicity & Disease, 19(2), 204–208.
Degrie, L., Gastmans, C., Mahieu, L., Casterlé, B. D., & Denier, Y. (2017). How do ethnic
minority patients experience the intercultural care encounter in hospitals? A systematic
review of qualitative research. BMC Medical Ethics, 18(2). doi:10.1186/s12910-016-0163-
8
Desrosiers, A., & St Fleurose, S. (2002). Treating Haitian patients: Key cultural aspects.
American Journal of Psychotherapy, 56(4), 508–21. Retrieved from
http://search.proquest.com.libproxy.lib.unc.edu/docview/213139524?accountid=14244
Ehrlich, C., Kendall, E., Parekh, S., & Walters, C. (2015). The impact of culturally responsive
self-management interventions on health outcomes for minority population: A systematic
review. Chronic Illness, 12(1), 47–57.
Epstein, D. E., Sherwood, A., Smith, P. J., Craighead, L., Caccia, C., Lin, P. H., . . .
Blumenthal, J. A. (2012). Determinants and consequences of adherence to the dietary
approaches to stop hypertension diet in African American and white adults with high blood
pressure: Results from the ENCORE trial. Journal of the Academy of Nutrition and
Dietetics, 112(11), 1763–1773. doi:10.1016/j.jand.2012.07.007
Falicov, C. J. (2007). Working with transnational immigrants: Expanding meanings of family,
community, and culture. Family Process, 46(2), 157–171. Retrieved from
https://auth.lib.unc.edu/ezproxy_auth.php?url=http://search.ebscohost.com/login.aspx?direct
=true&db=rzh&AN=2009598784&site=ehost-live&scope=site

96
Fatma, H. G., Joan, V. A., Ajabshir, S., Gustavo, Z. G., Exebio, J., & Dixon, Z. (2013).
Perceived stress and self-rated health of Haitian and African Americans with and without
type 2 diabetes. Journal of Research in Medical Sciences: The Official Journal of Isfahan
University of Medical Sciences, 18(3), 198–204.
Gittner, L. S., Hassanein, S. E., & Murphy, P. J. (2007). Church-based heart health project:
Health status of urban African Americans. The Permanente Journal, 11(3), 21–25.
Glanz, K., Burke, L., & Rimer, B. (2015). Health behavior theories. In J. Butts & K. Rich
(Eds.), Philosophies and Theories for advanced nursing practice (2nd ed., pp. 235–256).
Burlington: Jones & Bartlett Learning.
Green, T., Haley, E., Eliasziw, M., & Hoyte, K. (2007). Education in stroke prevention:
Efficacy of an educational counseling intervention to increase knowledge in stroke
survivors. Canadian Journal of Neuroscience Nursing, 29(2), 13–20.
Hamilton, J. B., Sandelowski, M., Moore, A. D., Agarwal, M., & Koenig, H. G. (2012). "You
Need a Song to Bring You Through": The Use of Religious Songs to Manage Stressful Life
Events. The Gerontologist, 53(1), 26-38. doi:10.1093/geront/gns064
He, F. J., Li, J., & MacGregor, G. A. (2013). Effect of longer term modest salt reduction on
blood pressure: Cochrane systematic review and meta-analysis of randomised trials. BMJ
346, f1325–f1325. doi:10.1136/bmj.f1325
Hinderliter, A. L., Sherwood, A., Craighead, L. W., Lin, P. H., Watkins, L., Babyak, M. A., &
Blumenthal, J. A. (2014). The long-term effects of lifestyle change on blood pressure:
One-year follow-up of the ENCORE study. American Journal of Hypertension, 27(5), 734–
741. doi:10.1093/ajh/hpt183
Hoseini, H., Maleki, F., Moeini, M., & Sharifirad, G. R. (2014). Investigating the effect of an
education plan based on the health belief model on the physical activity of women who are
at risk for hypertension. Iranian Journal of Nursing and Midwifery Research, 19(6), 647–
652.
Hurn, J., Kneebone, I., & Cropley, M. (2006). Goal setting as an outcome measure: A
systematic review. Clinical Rehabilitation, 20(9), 756–772.
doi:10.117/0269215506070793
Improving Chronic Illness Care. (2016). Self-management support. Retrieved in Winter 2016
from www.improvingchroniccare.org/index.php?p=SelfManagement_Support&s=39
James, P. A., Oparil, S., Carter, B. L., Cushman, W. C., Dennison-Himmelfarb, C., Handler, J.,
. . . Ortiz, E. (2014). 2014 evidence-based guideline for the management of high blood
pressure in adults: Report from the panel members appointed to the Eighth Joint National
Committee (JNC 8). JAMA, 311(5), 507–-520. doi:10.1001/jama.2013.284427

97
Kenerson, J. G. (2014). Hypertension in Haiti: The challenge of best possible practice. The
Journal of Clinical Hypertension, 16(2), 107–114. doi:10.1111/jch.12242
Kiresuk, T. J., & Sherman, R. E. (1968). Goal attainment scaling: A general method for
evaluating comprehensive community mental health programs. Community Mental Health
Journal, 4(6), 443–453. doi:10.1007/BF01530764
Koenig, H. G. (2014). Religion, spirituality, and health: a review and update. Advances in
mind-body medicine, 29(3), 19-26.
Ku, L. (2006). Why immigrants lack adequate health care and health insurance. Retrieved in
Fall 2015 from http://www.migrationpolicy.org/article/why-immigrants-lack-adequate-
access-health-care-and-health-insurance
Liu, J., Davidson, E., Bhopal, R., White, M., Johnson, M., Netto, G., . . . Sheikh, A. (2012).
Adapting health promotion interventions to meet the needs of ethnic minority groups:
Mixed-methods evidence synthesis. Health Technology Assessment, 16(44), 1–469.
doi:10.3310/hta16440
Lubetkin, E., I., Zabor, E., C., Isaac, K., Brennessel, D., Kemeny, M., M., & Hay, J., L. (2015).
Health literacy, information seeking, and trust in information in Haitians. American Journal
of Health Behavior, 39(3), 441–450. doi:10.5993/AJHB.39.3.16
Lutfiyya, M. N., Ng, L., Asner, N., & Lipsky, M. S. (2009). Disparities in stroke
symptomology knowledge among US midlife women: An analysis of population survey
data. Journal of Stroke and Cerebrovascular Diseases: The Official Journal of National
Stroke Association, 18(2), 150–157. doi:10.1016/j.jstrokecerebrovasdis.2008.09.009
Lynch, E., Liebman, R., Ventrelle, J., Avery, E., & Richardson, D. (2014). A self-management
intervention for African Americans with comorbid diabetes and hypertension: A pilot
randomized controlled trial. Preventing Chronic Disease, 11, 130349.
doi:10.5888/pcd11.130349
"Maggi® Seasoning Cube." Maggi®. N.p., n.d. Web. 05 Feb. 2017.
Morrison, M. (2010). Introduction to SMART objectives and SMART goals. Retrieved Fall
2016 from https://rapidbi.com/history-of-smart-objectives/
MyPlate. (2017, January 25). Retrieved March 15, 2017, from
https://www.choosemyplate.gov/MyPlate
National Center for Chronic Disease Prevention and Health Promotion. (2014). National
chronic kidney disease fact sheet, 2014. Retrieved from
http://www.cdc.gov/diabetes/pubs/pdf/kidney_factsheet.pdf

98
Ndanuko, R. N., Tapsell, L. C., Charlton, K. E., Neale, E. P., & Batterham, M. J. (2016).
Dietary patterns and blood pressure in adults: A systematic review and meta-analysis of
randomized controlled trials. Advances in Nutrition, 7(1), 76–89.
doi:10.3945/an.115.009753
Neff, D. (2014). The impact of HIV on the Haitian refugee crisis. Retrieved in Spring 2016
from http://blog.gitmomemory.org/2014/03/19/the-impact-of-hiv-on-the-the-haitian-
refugee-crisis/
Neter, J. E., Stam, B. E., Kok, F. J., Grobbee, D. E., & Geleijnse, J. M. (2003). Influence of
weight reduction on blood pressure: A meta-analysis of randomized controlled trials.
Hypertension, 42(5), 878–884. doi:10.1161/01.HYP.0000094221.86888.AE
Nightingale, F. (1860). Notes on nursing: What it is and is not. New York: D. Appleton and
Company.
Nwosu, C., & Batalova, J. (2014). Haitian immigrants in the United States. Retrieved in Fall
2015 from http://www.migrationpolicy.org/article/haitian-immigrants-united-states
Obarzanek, E., Vollmer, W. M., Lin, P. H., Cooper, L. S., Young, D. R., Ard, J. D., . . .
Appel, L. J. (2007). Effects of individual components of multiple behavior changes: The
PREMIER trial. American Journal of Health Behavior, 31(5), 545–560.
doi:10.5555/ajhb.2007.31.5.545
Peterson, J. (2011). Key elements for church-based health promotion programs: Outcome-based
literature review. Public Health Nursing, 19(6), 401–411.
Porter, S. (2012). An American concentration camp. Retrieved from
http://blog.gitmomemory.org/2012/10/22/an-american-concentration-camp/
R Core Team (2016). R: A language and environment for statistical computing. R Foundation
for Statistical Computing, Vienna, Austria. URL https://www.R-project.org/
Rainforth, M. V., Schneider, R. H., Nidich, S. I., Gaylord-King, C., Salerno, J. W., &
Anderson, J. W. (2007). Stress reduction programs in patients with elevated blood
pressure: A systematic review and meta-analysis. Current Hypertension Reports, 9(6), 520–
528.
Saberi, F., Adib-Hajbaghery, M., & Zohrehea, J. (2014). Predictors of Prehospital delay in
patients with acute myocardial infarction in Kashan city. Nursing and Midwifery Studies,
3(4), e24238. doi:10.17795/nmsjournal24238
Sahgal, N., & Smith, G. (2009). A religious portrait of African Americans. Retrieved in Fall
2015 from http://www.pewforum.org/2009/01/30/a-religious-portrait-of-african-americans/

99
Saint-Jean, G., & Crandall, L. A. (2005). Utilization of preventive care by Haitian immigrants
in Miami, Florida. Journal of Immigrant Health, 7(4), 283–292.
Sanon, M. A., Mohammed, S. A., & McCullagh, M. C. (2014). Definition and management of
hypertension among Haitian immigrants: A qualitative study. Journal of Health Care for
the Poor and Underserved, 25(3), 1067–1078. doi:10.1353/hpu.2014.0147
Sanon, M.A., Spigner, C., & McCullagh, M. C. (2016). Transnationalism and hypertension
self-management among Haitian immigrants. Journal of Transcultural Nursing, 27(2),
147–156. doi:10.1177/1043659614543476
Schillaci, G., Pasqualini, L., Vaudo, G., Lupattelli, G., Pirro, M., Gemelli, F., . . . Mannarino,
E. (2003). Effect of body weight changes on 24-hour blood pressure and left ventricular
mass in hypertension: A 4-year follow-up. American Journal of Hypertension, 16(8), 634–
639. doi:10.1016/S0895-7061(03)00894-X
Schiller, N., Basch, L., & Blanc-Szanton, C. (1992). Transnationalism: A new analytic
framework for understanding migration. Annals of the New York Academy of Sciences, 645,
1–24.
Schneider, R. H., Alexander, C. N., Staggers, F., Orme-Johnson, D. W., Rainforth, M.,
Salerno, J. W., . . . Nidich, S. I. (2005). A randomized controlled trial of stress reduction
in African Americans treated for hypertension for over one year. American Journal of
Hypertension, 18(1), 88–98. doi:10.1016/j.amjhyper.2004.08.027
Scisney-Matlock, M., Bosworth, H. B., Giger, J. N., Strickland, O. L., Harrison, R. V.,
Coverson, D., . . . Jamerson, K. A. (2009). Strategies for implementing and sustaining
therapeutic lifestyle changes as part of hypertension management in African Americans.
Postgraduate Medicine, 121(3), 147–159. doi:10.3810/pgm.2009.05.2015
Stuart-Shor, E. M., Berra, K. A., Kamau, M. W., & Kumanyika, S. K. (2012). Behavioral
strategies for cardiovascular risk reduction in diverse and underserved racial/ethnic groups.
Circulation, 125(1), 171–184. doi:10.1161/circulationaha.110.968495
Solomon, A., Schoenthaler, A., Seixas, A., Ogedegbe, G., Jean-Louis, G., & Lai, D. (2015).
Medication routines and adherence among hypertensive African Americans. The Journal of
Clinical Hypertension, 17(9), 668–672. doi:10.1111/jch.12566
Sopoaga, F., Zaharic, T., Kokaua, J., & Covello, S. (2017). Training a medical workforce to
meet the needs of diverse minority communities. BMC Medical Education, 17(1), 19.
Svetkey, L. P., Erlinger, T. P., Vollmer, W. M., Feldstein, A., Cooper, L. S., Appel, L. J., …
Stevens, V. J. (2004). Effect of lifestyle modifications on blood pressure by race, sex,
hypertension status, and age. Journal of Human Hypertension, 19(1), 21–31.
doi:10.1038/sj.jhh.1001770

100
The College of Family Physicians of Canada. (2008). Brief hypertension action tools.
Retrieved in Fall 2015 from
http://www.cfpc.ca/uploadedFiles/Resources/Resource_Items/Health_Professionals/Brief_H
ypertension_Action_Tools.pdf
Thomas, F. (2010). Transnational health and treatment networks: Meaning, value and place in
health seeking amongst southern African migrants in London. Health & Place, 16(3), 606–
612. doi:10.1016/j.healthplace.2010.01.006
Thorpe, R. J., Fesahazion, R. G., Parker, L., Wilder, T., Rooks, R. N., Bowie, J. V., . . .
Laveist, T. A. (2016). Accelerated Health Declines among African Americans in the USA.
Journal of Urban Health, 93(5), 808-819. doi:10.1007/s11524-016-0075-4
Tichelaar, J., den Uil, S. H., Antonini, N. F., van Agtmael, M., de Vries, T. P. G. M., &
Richir, M. C. (2016). A SMART way to determine treatment goals in pharmacotherapy
education. British Journal of Clinical Pharmacology, 82(1), 280–284.
doi:10.1111/bcp.12919
U.S. Department of Health & Human Services. (2015a). HHS partners with more than 20 faith
organizations to promote enrollment in the health insurance marketplace. Retrieved in
Spring 2016 from http://www.hhs.gov/about/news/2015/12/11/hhs-partners-with-more-than-
20-faith-organizations.html
U.S. Department of Health and Human Services. (2015b). Heart disease and stroke. Retrieved
in Spring 2016 from http://www.healthypeople.gov/2020/topics-objectives/topic/heart-
disease-and-stroke/objectives
Warsi, A., Wang, P., LaValley, M., Avorn, J., & Solomon, D. (2004). Self-management
education programs in chronic disease. Arch Intern Med, 164(15), 1641–1649.
The Weather Channel. (2016). Hurricane Matthew Recap: Destruction From the Caribbean to
the United States. Retrieved January 17, 2017, from
https://weather.com/storms/hurricane/news/hurricane-matthew-bahamas-florida-georgia-
carolinas-forecast
Wright, P., & Carr, A. (2016, October 6). Hurricane Matthew Kills At Least 264 in Haiti: "The
Situation Is Catastrophic," Says Haitian President. Retrieved January 17, 2017, from
https://weather.com/news/news/hurricane-matthew-haiti-deaths
World Health Organization. (2015). Haiti: WHO statistical profile. Retrieved Winter 2016
from http://www.who.int/gho/countries/hti.pdf?ua=1
World Health Organization. (2016). Cardiovascular diseases (CVDs). Retrieved winter, 2016,
from http://www.who.int/mediacentre/factsheets/fs317/en/

101
Young, J. H., Ng, D., Ibe, C., Weeks, K., Brotman, D. J., Dy, S. M., . . . Klag, M. J. (2015).
Access to care, treatment ambivalence, medication nonadherence, and long-term mortality
among severely hypertensive African Americans: A prospective cohort study. The Journal
of Clinical Hypertension, 17(8), 614–621. doi:10.1111/jch.12562
Yue, Z., Li, C., Weilin, Q., & Bin, W. (2015). Application of the health belief model to improve
the understanding of antihypertensive medication adherence among Chinese patients.
Patient Education and Counseling, 98(5), 669–673. doi:10.1016/j.pec.2015.02.007
Zerwic, J. J., Ryan, C. J., DeVon, H. A., & Drell, M. J. (2003). Treatment seeking for acute
myocardial infarction symptoms: Differences in delay across sex and race. Nursing
Research, 52(3), 159–167.
Zong, Jie & Batalova, Jeanne. (2016). Frequently Requested Statistics on Immigrants and
Immigration in the United States. Retrieved from
http://www.migrationpolicy.org/article/frequently-requested-statistics-immigrants-and-
immigration-united-states