Cultural Mapping Toolkit
94
A PAR TNERSHIP BETWEEN 2010 LEGACIES NOW & CREATIVE CITY NETWORK OF CANADA CULTURAL MAPPING TOOLKIT
Transcript of Cultural Mapping Toolkit

8/8/2019 Cultural Mapping Toolkit
http://slidepdf.com/reader/full/cultural-mapping-toolkit 1/94
A PARTNERSHIP BETWEEN2010 LEGACIES NOW& CREATIVE CITY NETWOOF CANADA
CULTURAL MAPPING TOOLK

8/8/2019 Cultural Mapping Toolkit
http://slidepdf.com/reader/full/cultural-mapping-toolkit 2/94
2010 Legacies Now gratefully acknowledges the Province of British Columbia
for its ongoing support of initiatives like the Cultural Mapping Toolkit

8/8/2019 Cultural Mapping Toolkit
http://slidepdf.com/reader/full/cultural-mapping-toolkit 3/94
PA
Introduction
3 Why Engage in Cultural Mapping?
5 Some Uses of Cultural Mapping6 To Map or not to Map?
7 Explore, Make Sense, Tell the Story
8 Glossary
9 Stages and Timelines
Stage I – Planning
12 Step 1 – Determine Objectives
12 Community Meeting
15 Step 2 – State the Objectives
15 What do we need to know?
15 Who needs to know?
16 Maintaining the Map
18 Step 3 – Set Parameters
20 Step 4 – Estimate Readiness
21 Step 5 – Assemble Resources
21 Human Resources
21 Finances and Budgeting
22 Partners and Collaborators
23 Timing
Stage II – Proect Design
26 Step 6 – Frame the Fundamental Questions
27 Step 7 – The Inventory27 The Inventory as the Basis of the Map
27 Data Categories
30 Technology
30 Structuring Your Database
31 Step 8 – Design Survey and Interview Questions
31 Respondents – Core and Supporting
31 Survey Questions
32 Interview Questions
Stage III – Implementation – Eplore
36 Step 9 – Contacting the Community
36 Announcing the Process
36 Collaborations
36 Informal Networks
36 Leaders and Key Individuals
39 Step 10 – Tallying and Entering Results
Contents
Cover Photo:
Avril Orloff, Creative Facilitation
cont
USING THIS TOOLKITThis toolkit has been designed to take you
through the entire mapping process, from
creating an inventory to drawing up and
presenting your map. The process has been
broken down into stages and steps. Each
step is accompanied by examples, checklists or
worksheets to help you get organized. When
you have nished, the working documents
will serve as a record of the suggestions and
solutions you came up with as you went along.
Cultural Mapping Toolkit
8/8/2019 Cultural Mapping Toolkit
http://slidepdf.com/reader/full/cultural-mapping-toolkit 4/94
AGE
ULtURAL MAPPInG tooLKIt: A Parerhip ewee 00 Legaie nw a creaive ciy newrk f caaa
Stage IV – Synthesis – Make Sense
42 Step 11 – Roughing Out the Map(s)
42 Matching Data with Objectives
46 More than One Map?
47 Step 12 – Converting an Inventory to a Map
47 The Legend
48 Visual Keys and Structural Elements
52 Map Making
52 The Role of Narrative
53 Step 13 – Analysis and Interpretation
53 Things to Look For
57 Consult with the Community
57 Check the Realities
Stage V – Finaliing the Report
60 Step 14 – Speaking to Different Audiences
60 Levels of Detail
62 Subjective Elements
62 Custody and Succession
62 Finalize the Report
Stage VI – Going Public64 Step 15 – Getting the Word Out
64 Who is listening?
65 Who isn’t listening, but needs to hear?
67 Now that the party’s over …
Appendi A: Background
70 What Is Cultural Mapping?
70 Political Dimension
71 Ethical Issues – Intellectual Property
71 Community Participation
Appendi B: Maps
73 What Does a Cultural Map Look Like?
Appendi C: Tools
75 Objectives and Parameters
76 Budget
77 Data Categories – Examples
78 Inventory Grid
79 Venues – Usage (by discipline)
80 Collecting Data – Surveys and Interviews
83 Sample Questions
86 Legend
87 GIS
88 Report Outline
Appendi D: References90 Reference List
Contents-cont’d

8/8/2019 Cultural Mapping Toolkit
http://slidepdf.com/reader/full/cultural-mapping-toolkit 5/94
PA
culural mappig i a valuale l frieifyig a mmuiy’ regh a ireure. thi pre a help a mmuiiemve i he plaig a implemeaiphae y ieifyig early he reure,efieie a lik ewee ar a uluralgrup, a well a heir mm apirai
a value.
- Hurale sa Hage, Miier f turim, spr a he Ar
Cultural mapping enables us to understand
and share culture; to re-think history; and
to promote creativity and development.
This toolkit focuses primarily on promoting
creativity and development. Where culturalmapping can be most valuable is in
generating new perspectives and preparing
the ground for effective cultural planning.
As we know, many reports and studies
never leave the shelf. Cultural mapping is
an attention-getter, and your map can be
used to tell your story to different types of
interest groups in an innovative way.
As a vehicle of information the map is
extremely versatile. It can be loaded withmany kinds of data that can then be
unpacked, isolated and recongured. As
for its form, the choice ranges from an
artist’s hand-crafted rendering to the most
sophisticated, hyper-linked, web-ready,
multi-media compendium. On both counts
of information and form, a map has much
greater potential than an inventory. A graphic
map communicates rapidly and in a holistic
fashion; a web-based map can be multi-
dimensional and can have a very broad reach.
A broadly-based mapping exercise for
purposes of investigating or creating
an identity prole of the community is
enriching, informative and useful. One
member of the Creative City Network of
Canada commented he has “got more
political mileage out of that than just
about anything else.” It can give a boost to
advocacy activities, both yours and those of
the community.
The process of mapping by itself draws
attention to the existence and importance
of cultural resources. The results pointout problems to be solved or strengths to
build upon. The publicity surrounding the
announcement of results can be used to
move the issues up a notch on the public
agenda. The various community sectors can
also rely on the results to support their own
arguments for increased support.
Why Engage in Cultural Mapping?
“
”
IntRodUc

8/8/2019 Cultural Mapping Toolkit
http://slidepdf.com/reader/full/cultural-mapping-toolkit 6/94
AGE
ULtURAL MAPPInG tooLKIt: A Parerhip ewee 00 Legaie nw a creaive ciy newrk f caaa
8/8/2019 Cultural Mapping Toolkit
http://slidepdf.com/reader/full/cultural-mapping-toolkit 7/94
PA
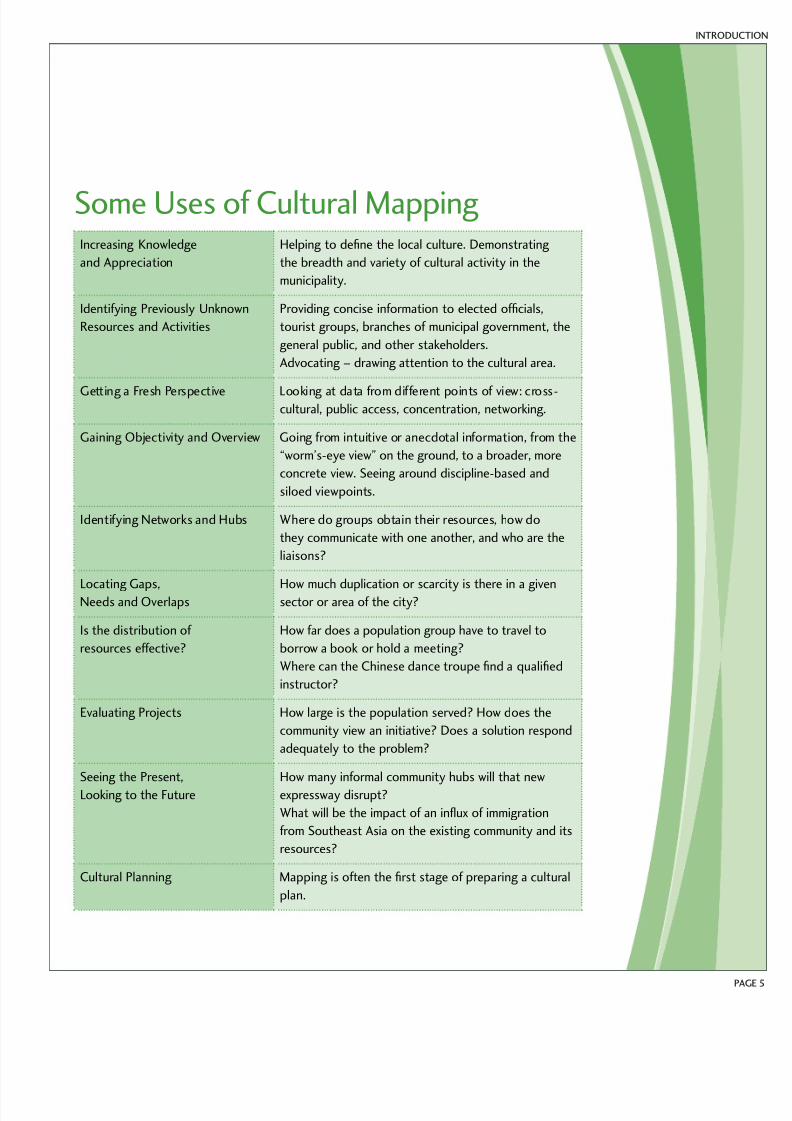
Increasing Knowledge
and Appreciation
Helping to dene the local culture. Demonstrating
the breadth and variety of cultural activity in the
municipality.
Identifying Previously Unknown
Resources and Activities
Providing concise information to elected ofcials,
tourist groups, branches of municipal government, the
general public, and other stakeholders.
Advocating – drawing attention to the cultural area.
Getting a Fresh Perspective Looking at data from different points of view: cross-cultural, public access, concentration, networking.
Gaining Objectivity and Overview Going from intuitive or anecdotal information, from the
“worm’s-eye view” on the ground, to a broader, more
concrete view. Seeing around discipline-based and
siloed viewpoints.
Identifying Networks and Hubs Where do groups obtain their resources, how do
they communicate with one another, and who are the
liaisons?
Locating Gaps,Needs and Overlaps
How much duplication or scarcity is there in a givensector or area of the city?
Is the distribution of
resources effective?
How far does a population group have to travel to
borrow a book or hold a meeting?
Where can the Chinese dance troupe nd a qualied
instructor?
Evaluating Projects How large is the population served? How does the
community view an initiative? Does a solution respond
adequately to the problem?
Seeing the Present,
Looking to the Future
How many informal community hubs will that new
expressway disrupt?
What will be the impact of an inux of immigration
from Southeast Asia on the existing community and its
resources?
Cultural Planning Mapping is often the rst stage of preparing a cultural
plan.
Some Uses of Cultural Mapping
IntRodUc

8/8/2019 Cultural Mapping Toolkit
http://slidepdf.com/reader/full/cultural-mapping-toolkit 8/94
AGE
ULtURAL MAPPInG tooLKIt: A Parerhip ewee 00 Legaie nw a creaive ciy newrk f caaa
Most cultural workers have a comprehensive
and functional cultural map in their
head, and a mapping process can help to
document and communicate this knowledge.
A cultural map can be used to orient
new staff or members of council to the
community very quickly, and to preserve
your corporate memory in a transferable
form.
The other advantage for cultural workers
is that mapping allows you to escape the
silos and gain an overview of relationships
that cut across disciplines and constitute
informal networks. It can also be used as an
analytical tool to yield new insights. Who
knew the police department’s community
liaison ofcers drop in to shows at a local
artist-run gallery because the station is just
two doors down the street?
However, mapping can be a demanding
process and feasibility is an important
consideration. Do you have the money,
the time and the human resources to see
it through? If there are specic problems
or situations you wish to address, a good
question to ask before you launch in is
whether mapping would be the most useful
and economical approach. Are there other,
less demanding ways to go about it?
To Map or not to Map?

8/8/2019 Cultural Mapping Toolkit
http://slidepdf.com/reader/full/cultural-mapping-toolkit 9/94
PA
Cultural mapping is widely recognized
as an effective tool for development and
planning. Our ambitions in presenting this
kit are practical and direct – to give cultural
workers both inside and outside municipal
government the means to carry out a
cultural mapping exercise on their own.
We propose to do this by explaining the
basic techniques of cultural mapping and
suggesting some possible applications atthe local level.
The particular kind of cultural mapping to
be explained here is a method of describing
the resources and assets of a specic
community and the relationships between
them. This is done in a concise and easily
understandable form that can then be used
for informing stakeholders, problem solving
and planning.
How cultural mapping is carried out haseverything to do with who is doing the
mapping and why. We have made some basic
assumptions about who you are, why you
are using this toolkit and what you need:
Who – cultural workers and planners at a
local level
Why – development and planning
Needs – dening local culture, assessment,
identifying gaps, making the case for
investing in the community’s cultural
development
Groups undertake a mapping project for two
reasons: First, to increase their knowledge
of what’s happening in the community;
second, to discover more about an area of
concern and use the information gained
for a specic purpose. Usually, groups are
interested in communicating the results to a
target audience. That’s why our toolkit also
provides tips for communicating with the
public.
What kind of information you collect and
how you use the information is up to you,as is the way in which you choose to report
what you have found.
Explore, Make Sense, Tell the Story
IntRodUc

8/8/2019 Cultural Mapping Toolkit
http://slidepdf.com/reader/full/cultural-mapping-toolkit 10/94
AGE
ULtURAL MAPPInG tooLKIt: A Parerhip ewee 00 Legaie nw a creaive ciy newrk f caaa
Cultural mapping – a process of
collecting, recording, analyzing and
synthesizing information in order to
describe the cultural resources, networks,
links and patterns of usage of a given
community or group.
Cultural inventory – a list or database
of information about cultural resources and
assets.
Cultural map – a report on the ndings
and conclusions of a cultural mapping
process; the cultural map can take many
forms.
Graphic map – a visually based,
topographical map that is either drawn by
an artist or generated by a computer using
GIS.
GIS – geographical information system
(GIS) is a system for creating, storing,analyzing and managing spatial data and
associated attributes. GIS is a tool that
allows users to create searches, analyze the
spatial information and edit data.
Web-based map – a website dedicated
to describing and representing the cultural
resources and assets of a community.
Tet-based map – a written report on
a cultural mapping process, giving ndings
and conclusions.
Resources and assets – in this context,
the various elements that contribute to
culture, whether human, natural, social,
economic or bricks and mortar.
Respondents – the individuals who
complete surveys and allow themselves
to be interviewed, either on their own
behalf or as representatives of groups and
organizations.
Target population – the sector or
community being studied.
Target audience – the group to which
you intend to present your ndings andrecommendations.
Usage – the rate of use of a resource or
asset by community members, that is, how
many individuals or groups use a given
resource.
Glossary

8/8/2019 Cultural Mapping Toolkit
http://slidepdf.com/reader/full/cultural-mapping-toolkit 11/94
PA
STAGE I – PLANNING• determining objectives – with the
community
• obtaining buy-in from colleagues and
community leaders
• setting a budget – revenues can be cash
or in-kind
• identifying and assembling mapping
resources – these can be human, nancial
or technical
STAGE II – PROjECT DESIGN• designing the inventory
• drafting survey questionnaires and
interview questions
• setting interim and nal deadlines
STAGE III – IMPLEMENTATION• public announcement
• broad-based research – surveys
• targeted research – interviews
• assembling the inventory
• taking stock
STAGE IV – SYNTHESIS• roughing out the map (text-based, web-
based or graphic)
• analyzing the results
• interpreting the results
• checking with the community STAGE V – FINALIzING THE MAP• speaking to different audiences
STAGE VI – GOING PUBLIC• previewing the map
• presenting the results to the target
audience
Stages and TimelinesOnce you have decided that cultural mapping is what you need, you should anticipate taking
some or all of the following steps and allocate time to each of them:
IntRodUc

8/8/2019 Cultural Mapping Toolkit
http://slidepdf.com/reader/full/cultural-mapping-toolkit 12/94
AGE 0
ULtURAL MAPPInG tooLKIt: A Parerhip ewee 00 Legaie nw a creaive ciy newrk f caaa

8/8/2019 Cultural Mapping Toolkit
http://slidepdf.com/reader/full/cultural-mapping-toolkit 13/94
PA
Stage I:
Planning
Mappig make ulure mre viile ha i a e uilie i ew way –ehage, like a furher evelpe.
– Greg Yug, Cultural Mapping in the Global World
“”
stAGE I: PLAn

8/8/2019 Cultural Mapping Toolkit
http://slidepdf.com/reader/full/cultural-mapping-toolkit 14/94
AGE
ULtURAL MAPPInG tooLKIt: A Parerhip ewee 00 Legaie nw a creaive ciy newrk f caaa
COMMUNITY MEETINGAn open meeting that is structured to solicit
suggestions can help you take the pulse
of the community and discover what their concerns are and what they hope to see in
terms of results of the mapping exercise.
Simply making an open call for a plenary
meeting can bring many other benets:
• it gives the community a sense of
ownership and contribution
• it informs them about the nature of the
process and how it will be carried out
• it gives an indication of the level of urgency or interest
• participants may raise issues or concerns
of which you weren’t aware
• it may bring respondents from sectors
you hadn’t considered
• the list of those in attendance can feed
into your list of respondents
At the meeting, don’t forget to include
a sign-in list that asks attendees to note
contact information and any afliation
with an organization. Be sure to have
a mechanism to record comments and
suggestions from those present. This can be
an invaluable reference later on as you start
to design the project. If you are leading the
meeting yourself, ask someone to act as arecording secretary.
Step 1 – Determine ObjectivesAn important source of input in determining your objectives is the community itself.
Consultation can be as formal or informal as you wish. In the early stages it can take place
with your regular community contacts, such as existing advisory committees or key individuals.
They are well positioned to help you outline the scope of the project and identify key
questions. Another important source of input is a plenary meeting with the larger community.

8/8/2019 Cultural Mapping Toolkit
http://slidepdf.com/reader/full/cultural-mapping-toolkit 15/94
PA
Community Meeting ResultsGroups present:
. . . . . . . . . . . . . . . . . . . . . . . . . . . . . . . . . . . . . . . . . . . . . . . . . . . . . . . . . . . . . . . . . . . . . . . . . . . . . . .
. . . . . . . . . . . . . . . . . . . . . . . . . . . . . . . . . . . . . . . . . . . . . . . . . . . . . . . . . . . . . . . . . . . . . . . . . . . . . . .
. . . . . . . . . . . . . . . . . . . . . . . . . . . . . . . . . . . . . . . . . . . . . . . . . . . . . . . . . . . . . . . . . . . . . . . . . . . . . . .
. . . . . . . . . . . . . . . . . . . . . . . . . . . . . . . . . . . . . . . . . . . . . . . . . . . . . . . . . . . . . . . . . . . . . . . . . . . . . . .
. . . . . . . . . . . . . . . . . . . . . . . . . . . . . . . . . . . . . . . . . . . . . . . . . . . . . . . . . . . . . . . . . . . . . . . . . . . . . . .
. . . . . . . . . . . . . . . . . . . . . . . . . . . . . . . . . . . . . . . . . . . . . . . . . . . . . . . . . . . . . . . . . . . . . . . . . . . . . . .
. . . . . . . . . . . . . . . . . . . . . . . . . . . . . . . . . . . . . . . . . . . . . . . . . . . . . . . . . . . . . . . . . . . . . . . . . . . . . . .
. . . . . . . . . . . . . . . . . . . . . . . . . . . . . . . . . . . . . . . . . . . . . . . . . . . . . . . . . . . . . . . . . . . . . . . . . . . . . . .
Needs stated:
. . . . . . . . . . . . . . . . . . . . . . . . . . . . . . . . . . . . . . . . . . . . . . . . . . . . . . . . . . . . . . . . . . . . . . . . . . . . . . .
. . . . . . . . . . . . . . . . . . . . . . . . . . . . . . . . . . . . . . . . . . . . . . . . . . . . . . . . . . . . . . . . . . . . . . . . . . . . . . .
. . . . . . . . . . . . . . . . . . . . . . . . . . . . . . . . . . . . . . . . . . . . . . . . . . . . . . . . . . . . . . . . . . . . . . . . . . . . . . .
. . . . . . . . . . . . . . . . . . . . . . . . . . . . . . . . . . . . . . . . . . . . . . . . . . . . . . . . . . . . . . . . . . . . . . . . . . . . . . .
. . . . . . . . . . . . . . . . . . . . . . . . . . . . . . . . . . . . . . . . . . . . . . . . . . . . . . . . . . . . . . . . . . . . . . . . . . . . . . .
. . . . . . . . . . . . . . . . . . . . . . . . . . . . . . . . . . . . . . . . . . . . . . . . . . . . . . . . . . . . . . . . . . . . . . . . . . . . . . .
. . . . . . . . . . . . . . . . . . . . . . . . . . . . . . . . . . . . . . . . . . . . . . . . . . . . . . . . . . . . . . . . . . . . . . . . . . . . . . .
. . . . . . . . . . . . . . . . . . . . . . . . . . . . . . . . . . . . . . . . . . . . . . . . . . . . . . . . . . . . . . . . . . . . . . . . . . . . . . .
. . . . . . . . . . . . . . . . . . . . . . . . . . . . . . . . . . . . . . . . . . . . . . . . . . . . . . . . . . . . . . . . . . . . . . . . . . . . . . .
. . . . . . . . . . . . . . . . . . . . . . . . . . . . . . . . . . . . . . . . . . . . . . . . . . . . . . . . . . . . . . . . . . . . . . . . . . . . . . .
. . . . . . . . . . . . . . . . . . . . . . . . . . . . . . . . . . . . . . . . . . . . . . . . . . . . . . . . . . . . . . . . . . . . . . . . . . . . . . .
. . . . . . . . . . . . . . . . . . . . . . . . . . . . . . . . . . . . . . . . . . . . . . . . . . . . . . . . . . . . . . . . . . . . . . . . . . . . . . .
Suggested uses of the map:
. . . . . . . . . . . . . . . . . . . . . . . . . . . . . . . . . . . . . . . . . . . . . . . . . . . . . . . . . . . . . . . . . . . . . . . . . . . . . . .
. . . . . . . . . . . . . . . . . . . . . . . . . . . . . . . . . . . . . . . . . . . . . . . . . . . . . . . . . . . . . . . . . . . . . . . . . . . . . . .
. . . . . . . . . . . . . . . . . . . . . . . . . . . . . . . . . . . . . . . . . . . . . . . . . . . . . . . . . . . . . . . . . . . . . . . . . . . . . . .
. . . . . . . . . . . . . . . . . . . . . . . . . . . . . . . . . . . . . . . . . . . . . . . . . . . . . . . . . . . . . . . . . . . . . . . . . . . . . . .
. . . . . . . . . . . . . . . . . . . . . . . . . . . . . . . . . . . . . . . . . . . . . . . . . . . . . . . . . . . . . . . . . . . . . . . . . . . . . . .
. . . . . . . . . . . . . . . . . . . . . . . . . . . . . . . . . . . . . . . . . . . . . . . . . . . . . . . . . . . . . . . . . . . . . . . . . . . . . . .
. . . . . . . . . . . . . . . . . . . . . . . . . . . . . . . . . . . . . . . . . . . . . . . . . . . . . . . . . . . . . . . . . . . . . . . . . . . . . . .
. . . . . . . . . . . . . . . . . . . . . . . . . . . . . . . . . . . . . . . . . . . . . . . . . . . . . . . . . . . . . . . . . . . . . . . . . . . . . . .
. . . . . . . . . . . . . . . . . . . . . . . . . . . . . . . . . . . . . . . . . . . . . . . . . . . . . . . . . . . . . . . . . . . . . . . . . . . . . . .
. . . . . . . . . . . . . . . . . . . . . . . . . . . . . . . . . . . . . . . . . . . . . . . . . . . . . . . . . . . . . . . . . . . . . . . . . . . . . . .
stAGE I: PLAn

8/8/2019 Cultural Mapping Toolkit
http://slidepdf.com/reader/full/cultural-mapping-toolkit 16/94
AGE
ULtURAL MAPPInG tooLKIt: A Parerhip ewee 00 Legaie nw a creaive ciy newrk f caaa

8/8/2019 Cultural Mapping Toolkit
http://slidepdf.com/reader/full/cultural-mapping-toolkit 17/94
PA
WHAT DO WE NEED TO KNOW?For example:
• the resources that make up our culturalidentity (Does our concept conform to
the reality?)
• our existing strengths and what makes us
unique
• what kinds of changes we need to make
• the means we have in hand to meet our
challenges
• whether there are sufcient funds/
facilities/means of access/resources in a
particular area or for a particular purpose
• resources in the community about which
we know little or nothing
• resources of a particular kind for a given
target population and their distribution
• the potential impact of coming
developments
• how to deal well and appropriately with
change
WHO NEEDS TO KNOW?• members of your own organization or
department
• if you are in city government, workers in
other departments
• city councillors and the municipal
administration
• members of the target community
• the city’s communications department
and the media
• local associations, such as a heritage
society or arts commission
• business improvement associations and
tourism organizations
• funding agencies and foundations
• city residents
• visitors from outside the city
Step 2 – State the ObjectivesNow you have to tailor the process to your purpose. The structure of the mapping exercise
and the nature of the data to be collected, as well as what you communicate and to whom, will
depend on the objective or objectives you identify. If you and the community have a specic
question to answer or situation to address, this step is crucial. Even if you want to engage in
a more open-ended, exploratory process, you will still have to focus the scope of your search
and identify targets. Ask yourself these two questions:
stAGE I: PLAn
The answers to those questions will help you establish your goals and determine howto communicate your results.

8/8/2019 Cultural Mapping Toolkit
http://slidepdf.com/reader/full/cultural-mapping-toolkit 18/94
AGE
ULtURAL MAPPInG tooLKIt: A Parerhip ewee 00 Legaie nw a creaive ciy newrk f caaa
The overriding objective may be to gain
greater knowledge of the resources present
in the municipality so as to assess needs,
networks and strengths. In that case the
inventory should be organized along the
lines of gathering data about who, how
many and their mutual dependence.
If the report is internal to your own
organization or department, an inventory
may be enough, although a map would be
helpful. If the results are to be presented to
busy people like city councillors, who would
prefer a concise report, then a graphic map
might be a suitable vehicle, especially as the
councillors are accustomed to dealing with
various kinds of maps of the town or city.
A map is useful to the local organizations
involved in the process, since it gives them
a sense of their place and role in the big
picture. Any form of map can providethem with support for their own advocacy
initiatives.
If the intention is to assist the local tourist
industry and their association by analyzing
participation in local events, a graphic map
might not meet their needs. However, they
would probably love it if your data and
analysis could feed into their collective
promotional website.
Similarly, a web presentation is the most
efcient way to communicate results to the
general public, if that is the target audience.
Either way, you should have a clear idea of
what you want to achieve. Knowing your
objectives will help you determine feasibilityand timing, develop a structure for the
mapping process, and communicate with
stakeholders in order to gain their support.
MAINTAINING THE MAPThings change and maps lose their currency,
sometimes very rapidly. Some thought
should be given to whether you and the
community wish to maintain the map as a
living document or preserve it as a historical
snapshot.
Do you and the community want to update
the map periodically? If so, how often and
who would do it? Can you get support for a
long-term plan? Do you have the necessary
resources?

8/8/2019 Cultural Mapping Toolkit
http://slidepdf.com/reader/full/cultural-mapping-toolkit 19/94
PAG
What do we need to know?
. . . . . . . . . . . . . . . . . . . . . . . . . . . . . . . . . . . . . . . . . . . . . . . . . . . . . . . . . . . . . . . . . . . . . . . . . . . . . . .
. . . . . . . . . . . . . . . . . . . . . . . . . . . . . . . . . . . . . . . . . . . . . . . . . . . . . . . . . . . . . . . . . . . . . . . . . . . . . . .
. . . . . . . . . . . . . . . . . . . . . . . . . . . . . . . . . . . . . . . . . . . . . . . . . . . . . . . . . . . . . . . . . . . . . . . . . . . . . . .
. . . . . . . . . . . . . . . . . . . . . . . . . . . . . . . . . . . . . . . . . . . . . . . . . . . . . . . . . . . . . . . . . . . . . . . . . . . . . . .
. . . . . . . . . . . . . . . . . . . . . . . . . . . . . . . . . . . . . . . . . . . . . . . . . . . . . . . . . . . . . . . . . . . . . . . . . . . . . . .
. . . . . . . . . . . . . . . . . . . . . . . . . . . . . . . . . . . . . . . . . . . . . . . . . . . . . . . . . . . . . . . . . . . . . . . . . . . . . . .
. . . . . . . . . . . . . . . . . . . . . . . . . . . . . . . . . . . . . . . . . . . . . . . . . . . . . . . . . . . . . . . . . . . . . . . . . . . . . . .
Who needs to know?
. . . . . . . . . . . . . . . . . . . . . . . . . . . . . . . . . . . . . . . . . . . . . . . . . . . . . . . . . . . . . . . . . . . . . . . . . . . . . . .
. . . . . . . . . . . . . . . . . . . . . . . . . . . . . . . . . . . . . . . . . . . . . . . . . . . . . . . . . . . . . . . . . . . . . . . . . . . . . . .
. . . . . . . . . . . . . . . . . . . . . . . . . . . . . . . . . . . . . . . . . . . . . . . . . . . . . . . . . . . . . . . . . . . . . . . . . . . . . . .
. . . . . . . . . . . . . . . . . . . . . . . . . . . . . . . . . . . . . . . . . . . . . . . . . . . . . . . . . . . . . . . . . . . . . . . . . . . . . . .
. . . . . . . . . . . . . . . . . . . . . . . . . . . . . . . . . . . . . . . . . . . . . . . . . . . . . . . . . . . . . . . . . . . . . . . . . . . . . . .
. . . . . . . . . . . . . . . . . . . . . . . . . . . . . . . . . . . . . . . . . . . . . . . . . . . . . . . . . . . . . . . . . . . . . . . . . . . . . . .
. . . . . . . . . . . . . . . . . . . . . . . . . . . . . . . . . . . . . . . . . . . . . . . . . . . . . . . . . . . . . . . . . . . . . . . . . . . . . . .
Maintaining the Map
Who would maintain it?
. . . . . . . . . . . . . . . . . . . . . . . . . . . . . . . . . . . . . . . . . . . . . . . . . . . . . . . . . . . . . . . . . . . . . . . . . . . . . . .
. . . . . . . . . . . . . . . . . . . . . . . . . . . . . . . . . . . . . . . . . . . . . . . . . . . . . . . . . . . . . . . . . . . . . . . . . . . . . . .
How often should it be updated?
. . . . . . . . . . . . . . . . . . . . . . . . . . . . . . . . . . . . . . . . . . . . . . . . . . . . . . . . . . . . . . . . . . . . . . . . . . . . . . .
. . . . . . . . . . . . . . . . . . . . . . . . . . . . . . . . . . . . . . . . . . . . . . . . . . . . . . . . . . . . . . . . . . . . . . . . . . . . . . .
How much can we invest?
. . . . . . . . . . . . . . . . . . . . . . . . . . . . . . . . . . . . . . . . . . . . . . . . . . . . . . . . . . . . . . . . . . . . . . . . . . . . . . .
. . . . . . . . . . . . . . . . . . . . . . . . . . . . . . . . . . . . . . . . . . . . . . . . . . . . . . . . . . . . . . . . . . . . . . . . . . . . . . .
Objectives
stAGE I: PLAn
8/8/2019 Cultural Mapping Toolkit
http://slidepdf.com/reader/full/cultural-mapping-toolkit 20/94
AGE
ULtURAL MAPPInG tooLKIt: A Parerhip ewee 00 Legaie nw a creaive ciy newrk f caaa
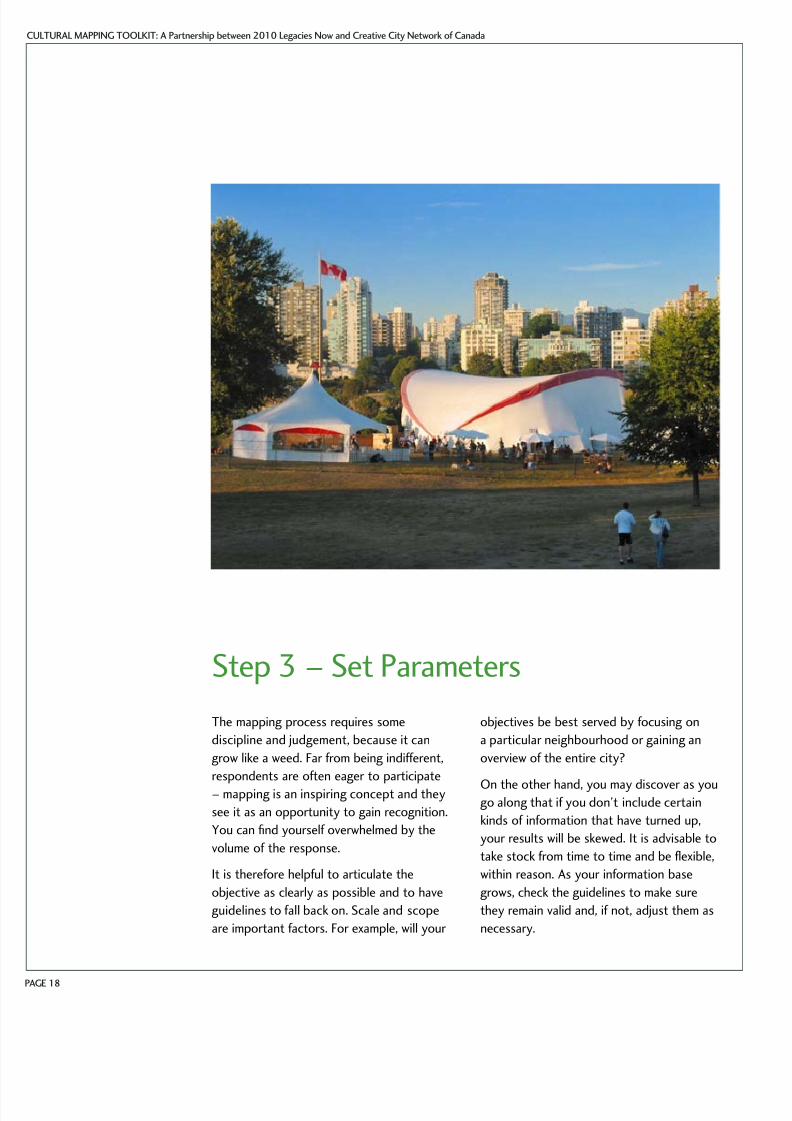
Step 3 – Set Parameters
The mapping process requires some
discipline and judgement, because it can
grow like a weed. Far from being indifferent,
respondents are often eager to participate
– mapping is an inspiring concept and they
see it as an opportunity to gain recognition.
You can nd yourself overwhelmed by the
volume of the response.
It is therefore helpful to articulate the
objective as clearly as possible and to have
guidelines to fall back on. Scale and scope
are important factors. For example, will your
objectives be best served by focusing on
a particular neighbourhood or gaining an
overview of the entire city?
On the other hand, you may discover as yougo along that if you don’t include certain
kinds of information that have turned up,
your results will be skewed. It is advisable to
take stock from time to time and be exible,
within reason. As your information base
grows, check the guidelines to make sure
they remain valid and, if not, adjust them as
necessary.

8/8/2019 Cultural Mapping Toolkit
http://slidepdf.com/reader/full/cultural-mapping-toolkit 21/94
PA
ParametersScale – neighbourhood/district/city/region
. . . . . . . . . . . . . . . . . . . . . . . . . . . . . . . . . . . . . . . . . . . . . . . . . . . . . . . . . . . . . . . . . . . . . . . . . . . . . . .
. . . . . . . . . . . . . . . . . . . . . . . . . . . . . . . . . . . . . . . . . . . . . . . . . . . . . . . . . . . . . . . . . . . . . . . . . . . . . . .
. . . . . . . . . . . . . . . . . . . . . . . . . . . . . . . . . . . . . . . . . . . . . . . . . . . . . . . . . . . . . . . . . . . . . . . . . . . . . . .
. . . . . . . . . . . . . . . . . . . . . . . . . . . . . . . . . . . . . . . . . . . . . . . . . . . . . . . . . . . . . . . . . . . . . . . . . . . . . . .
Scope – all resources/arts only/heritage only, etc.
. . . . . . . . . . . . . . . . . . . . . . . . . . . . . . . . . . . . . . . . . . . . . . . . . . . . . . . . . . . . . . . . . . . . . . . . . . . . . . .
. . . . . . . . . . . . . . . . . . . . . . . . . . . . . . . . . . . . . . . . . . . . . . . . . . . . . . . . . . . . . . . . . . . . . . . . . . . . . . .
. . . . . . . . . . . . . . . . . . . . . . . . . . . . . . . . . . . . . . . . . . . . . . . . . . . . . . . . . . . . . . . . . . . . . . . . . . . . . . .
. . . . . . . . . . . . . . . . . . . . . . . . . . . . . . . . . . . . . . . . . . . . . . . . . . . . . . . . . . . . . . . . . . . . . . . . . . . . . . .
Respondents – person on the street?
. . . . . . . . . . . . . . . . . . . . . . . . . . . . . . . . . . . . . . . . . . . . . . . . . . . . . . . . . . . . . . . . . . . . . . . . . . . . . . .
. . . . . . . . . . . . . . . . . . . . . . . . . . . . . . . . . . . . . . . . . . . . . . . . . . . . . . . . . . . . . . . . . . . . . . . . . . . . . . .
. . . . . . . . . . . . . . . . . . . . . . . . . . . . . . . . . . . . . . . . . . . . . . . . . . . . . . . . . . . . . . . . . . . . . . . . . . . . . . .
. . . . . . . . . . . . . . . . . . . . . . . . . . . . . . . . . . . . . . . . . . . . . . . . . . . . . . . . . . . . . . . . . . . . . . . . . . . . . . .
Principal target group
. . . . . . . . . . . . . . . . . . . . . . . . . . . . . . . . . . . . . . . . . . . . . . . . . . . . . . . . . . . . . . . . . . . . . . . . . . . . . . .
. . . . . . . . . . . . . . . . . . . . . . . . . . . . . . . . . . . . . . . . . . . . . . . . . . . . . . . . . . . . . . . . . . . . . . . . . . . . . . .
. . . . . . . . . . . . . . . . . . . . . . . . . . . . . . . . . . . . . . . . . . . . . . . . . . . . . . . . . . . . . . . . . . . . . . . . . . . . . . .
. . . . . . . . . . . . . . . . . . . . . . . . . . . . . . . . . . . . . . . . . . . . . . . . . . . . . . . . . . . . . . . . . . . . . . . . . . . . . . .
Demographic targets. . . . . . . . . . . . . . . . . . . . . . . . . . . . . . . . . . . . . . . . . . . . . . . . . . . . . . . . . . . . . . . . . . . . . . . . . . . . . . .
. . . . . . . . . . . . . . . . . . . . . . . . . . . . . . . . . . . . . . . . . . . . . . . . . . . . . . . . . . . . . . . . . . . . . . . . . . . . . . .
. . . . . . . . . . . . . . . . . . . . . . . . . . . . . . . . . . . . . . . . . . . . . . . . . . . . . . . . . . . . . . . . . . . . . . . . . . . . . . .
. . . . . . . . . . . . . . . . . . . . . . . . . . . . . . . . . . . . . . . . . . . . . . . . . . . . . . . . . . . . . . . . . . . . . . . . . . . . . . .
(See Appendi C: Tools – Obectives and Parameters)
stAGE I: PLAn

8/8/2019 Cultural Mapping Toolkit
http://slidepdf.com/reader/full/cultural-mapping-toolkit 22/94
AGE 0
ULtURAL MAPPInG tooLKIt: A Parerhip ewee 00 Legaie nw a creaive ciy newrk f caaa
Step 4 – Estimate Readiness
Not a small thing. Cultural mapping can be exhausting as well as exhaustive, and you will
need a lot of support and cooperation. The best way to obtain support is to make sure the
stakeholders you have identied understand what you want to do and why, and agree with the
need for mapping. Make sure you have the necessary time, money and skills at your disposal.
Readiness
Do you have:
buy-in from the community
buy-in from the departments of municipal government
their understanding of the objectives and the process
the necessary nancial resources
the necessary human resources
the time required to carry out the study

8/8/2019 Cultural Mapping Toolkit
http://slidepdf.com/reader/full/cultural-mapping-toolkit 23/94
PAG
HUMAN RESOURCESFunctions to be performed:
• project management and administration
• database design
• data collection – interviewers and
researchers
• data entry
• collation and analysis
• map or web design
• communications and public relations
Don’t try to do every task all by yourself. You
will be able to feed the process on the level
of design, project management and providing
leads, but you won’t have the time to collect
information from respondents or learn how
to produce maps or design a website.
The work of collecting data may best be done
intensively rather than extensively, by a larger
number of people over a shorter period of time. Depending on the situation, things can
change rapidly. If what you want is a freeze-
frame, you don’t want to have to go back and
revise as you are trying to move forward.
It is a wonderful opportunity for students,
youth, seniors and beginning workers to get
involved and gain or contribute experience.
They may have a stake in the outcome and
some ideas or information to share.
Consider partnering with a university or technical college department or program for
assistance with project design, collection of
information and the map/web design. The
process could be an interesting class project
or the subject of a graduate student’s
dissertation on urban planning or public
administration.
FINANCES AND BUDGETINGThe cash cost of the study depends on
multiple factors, such as:
• the skills and resources, human and
otherwise, you have at your disposal
within your own organization, department
or municipal administration
• services you can obtain on an in-kind or
voluntary basis
• the scope of your study
• the type of report you choose to make
Budget items are:
• contracts or salaries for interviewers and
researchers
• wages for data entry
• community meetings – room bookings,
refreshments
• communications – preparation of mediareleases or media conferences
• design and drafting of a graphic map
• design of a website
• preparation and printing of the report
(See Appendi C: Tools – Budget)
Funding assistance, in the form of grants,
may be available from provincial or federal
governments or agencies. You may also
be able to obtain human and technical
resources as contributions from the city or from partners such as tourism agencies or
university and college departments.
2010 Legacies Now, through its Arts Now
program, provides assistance for cultural
mapping initiatives to municipalities
within British Columbia. Other support
may be possible through special funding
opportunities or discretionary funds.
Step 5 – Assemble Resources
stAGE I: PLAn

8/8/2019 Cultural Mapping Toolkit
http://slidepdf.com/reader/full/cultural-mapping-toolkit 24/94
AGE
ULtURAL MAPPInG tooLKIt: A Parerhip ewee 00 Legaie nw a creaive ciy newrk f caaa
PARTNERS AND COLLABORATORSUrban Planning
The city or town urban planning branch
is a valuable ally. In most cases they have
statistical data about the city and its
neighbourhoods and information about
developments and revitalization. They may
be able to advise on rate of usage of certain
facilities or resources owned by the city.
Most important, they may have in their
computers various forms of topographic
and demographic GIS maps that could makeyour mapping process easier.
Other Municipal Departments
• Public transit – maps, information on
routes, passes for your researchers
• Social services – demographics, needs,
patterns of usage of public services and
facilities, accessibility programs
• Leisure and recreation – distribution of
facilities, subscription/participation data,
comparisons with private-sector facilities
Colleges or Universities• assistance with design and
implementation of research tools
• technical assistance with reporting/
drawing the map
• collaboration on the entire project
• possibly funding or donation of
resources, such as meeting spaces
Resources
Human resources Sources of funding Partners and collaborators

8/8/2019 Cultural Mapping Toolkit
http://slidepdf.com/reader/full/cultural-mapping-toolkit 25/94
PAG
TIMINGYou should look down the road and estimate
how much time you have to allocate for each
of the stages and what your end-date might
be. A thorough mapping process can take
up to a year to complete, building in time
for planning and design, implementation,
analysis and presenting the results. If
you are seeking outside funding, having a
timeline drawn up will be a considerable
advantage.
As mentioned previously, surveys and
interviews are best done over a short
period. If you are collaborating with a
university department, that might be at
the beginning of the summer, with data
entry in late summer. The phase of sorting
and synthesizing data is one you will want
to take time with, since you will want to
explore alternative proles. You should also
be generous with the time you allow for the
transfer of your data to a map, as you may
have to go through a few drafts before you
arrive at the best representation.
Timeline
Stage Estimated Time
Planning/assembling resources
Project design
Implementation – interviews and data entry
Analysis and synthesis
Preparing the report
Presenting the report
stAGE I: PLAn

8/8/2019 Cultural Mapping Toolkit
http://slidepdf.com/reader/full/cultural-mapping-toolkit 26/94
AGE
ULtURAL MAPPInG tooLKIt: A Parerhip ewee 00 Legaie nw a creaive ciy newrk f caaa

8/8/2019 Cultural Mapping Toolkit
http://slidepdf.com/reader/full/cultural-mapping-toolkit 27/94
PAG
Stage II:
Project Design
Mappig ur ulure i all heir0 egree a i heir eph, keepigur ivere rie a muliple hirieierrgaig a reewig eah her,i a key ulural fui f ur ime.
– Greg Yug, Cultural Mapping in the Global World
“
”
stAGE II: PRojEct d
8/8/2019 Cultural Mapping Toolkit
http://slidepdf.com/reader/full/cultural-mapping-toolkit 28/94
AGE
ULtURAL MAPPInG tooLKIt: A Parerhip ewee 00 Legaie nw a creaive ciy newrk f caaa
Step 6 –
Frame the Fundamental QuestionsBefore ring up your database software,
try repeating your objectives to yourself in
the form of a question. You are not looking
for answers at this stage, so put that aside
for the moment. It would be helpful to
look back at the rst question you asked in
setting your objectives – What do we need
to know?
If what you need to know is the nature of
your cultural identity, then the obvious
fundamental question would be, Who are
we? What are our principal assets and
resources? What makes us unique? What
would we say or point to if a stranger were
to ask us?
If you are looking at a particular situation,
you might ask, Why is XX so successful,
while YY is performing poorly? What does
population ZZ need in order to participate
more fully?
The answers to those questions will startyou along the road to dening the types of
information you need to look for.
Fundamental Questions
1
2
3
4
5
6
7
8
9
10

8/8/2019 Cultural Mapping Toolkit
http://slidepdf.com/reader/full/cultural-mapping-toolkit 29/94
PAG
Step 7 – The InventoryTHE INVENTORY AS THE BASIS OFTHE MAPA comprehensive, well-designed inventory
not only provides indispensable data but
helps you to structure your process. As well
as listing the resources in certain categories,
it can include characteristics you might
want to track, such as location, access, level
of usage, types of users, and discipline.
Resources can range from facilities and
heritage sites to individuals, artists or
leaders situated at the centre of networks.
Initial information is usually provided by thepeople conducting the study, and you are
probably the best source of a preliminary
list of resources, straight from your les or
Rolodex. Start by listing the associations
and individuals with whom you work most
closely. You can then add groups who
receive funding from the city or the province
and groups you know by name.
Mapping is a process of exploration, and
as you go along you will likely discover
resources and relationships of which you
were not aware when you set out. The
inventory can and should be expanded
as new leads and possibilities present
themselves. For example, social service groups
or recreational associations often have close
ties with demographic subgroups or diverse
communities and could provide contacts.
DATA CATEGORIESOnce you have a basic list of resources you
can start to think in terms of what you want
to know about them – your data categories.
The design of the database anticipates the
structure and legend of the ultimate product,
the map. Picture the map(s) or website in
your head before you start to dene your
categories. What would you like to see there?
stAGE II: PRojEct d

8/8/2019 Cultural Mapping Toolkit
http://slidepdf.com/reader/full/cultural-mapping-toolkit 30/94
AGE
ULtURAL MAPPInG tooLKIt: A Parerhip ewee 00 Legaie nw a creaive ciy newrk f caaa
Location – If you’re planning to present a
graphic map, this is an obvious element. But
will location refer to the neighbourhood or
district as well as the street address?
Other database categories and elements
you might consider have to do with:
• sector – commercial, educational, social,
political, government
• scale of activities – local, provincial, federal• corporate structure – private, public,
charitable, cooperative, non-prot,
volunteer
• role in the area you’re studying –
individual, formal or informal association,
established organization, institution,
government program
• mandate – professional or community
art, service, advocacy, heritage, youth,
environment
• discipline or type of activity – museum,
dance, soccer, literacy, theatre, etc.
• function – producer, presenter,
venue, production facility, funder,
communications medium
• collaborators/clients – what other groups
or individuals they work with or serve
You might also want to look at
demographics and statistics:• size of population base – membership,
audience or attendance, residents, tenants
• age of members, participants or
adherents – youth, seniors, children
• corporate size – revenues, number of
employees, ownership of facilities, footprint
• usage – by what kind of groups or
individuals, and how many?
• support structures(See Appendi C:
Tools – Data Categories)

8/8/2019 Cultural Mapping Toolkit
http://slidepdf.com/reader/full/cultural-mapping-toolkit 31/94
PAG
Inventory Data CategoriesCategory
Elements to Include
Location
Sectors
Scale of activity
Structures
Roles
Disciplines
Functions
Demographics – size
Demographics – age
Rate of usage
stAGE II: PRojEct d

8/8/2019 Cultural Mapping Toolkit
http://slidepdf.com/reader/full/cultural-mapping-toolkit 32/94
AGE 0
ULtURAL MAPPInG tooLKIt: A Parerhip ewee 00 Legaie nw a creaive ciy newrk f caaa
TECHNOLOGYThis may seem obvious, but make sure you
establish your inventory using software
that can handle large amounts of data
efciently and allows you to manipulate it
easily. Making lists and tables using a word
processing program will only increase your
project time by an excessive amount and
probably drive you crazy. On the other
hand, you don’t necessarily need the lastword in database software. Spreadsheets
are easy to design and modify; they can be
exported or used to provide data for mail
merges; and they will allow you to sort and
recongure your information.
STRUCTURING YOUR DATABASEHere is an opportunity to be really inventive
– and thorough. This is the point at
which you detail the information you will
be seeking through your interviews and
surveys. The more foresight you exercise
here, the less grief you will experience later.
A comprehensive and detailed database
will lead to richer information and more
comprehensive conclusions.
If you are using exible software such
as a spreadsheet, you can add as many
categories as you need and expand on them
as you go along. If you are concerned that
you are including too much information,
remember that it is possible to create
more than one map from a given base of
information, and that web pages and links
can easily be added to a site.
Tip – Include a summary of your categoriesand elements, such as the worksheet
developed above, on the spreadsheet itself
for quick reference. It will allow your data
entry people to interpret and enter the
information correctly.
An example of a highly evolved inventory
for a particular type of resource, in this case
performing arts facilities, can be viewed
online at http://vancouver.ca/facility_wac/
facility.exe.(See Appendi C: Tools – Inventory Grid)

8/8/2019 Cultural Mapping Toolkit
http://slidepdf.com/reader/full/cultural-mapping-toolkit 33/94
PAG
Step 8 –
Design Survey and Interview QuestionsSurveys and interviews can be conducted
at various points and with different groups
– members of target groups, organizations
and the general public. A survey can be
conducted at the outset to help determine
objectives. At a later stage surveys and
interviews are of course a principal tool for
collecting inventory data.
You can approach the target population in a
variety of ways, by means of written surveys,
telephone interviews, in-person visits, and
plenary meetings or meetings with key
representatives. Members of the community
become your respondents.
Surveys do not necessarily have to be
hand-delivered or administered in person.
They can be distributed either actively or
passively through facilities and gathering
places. With an electronic mailing list in
hand you can send them out, and with thecollaboration of local media or organizations
you can insert them into newsletters and
bulletins. The level of response to a passive
distribution will by itself indicate the buy-in
of the target population.
RESPONDENTS –CORE AND SUPPORTINGRespondents may be on your list because
they are users of a resource, representatives
of groups or organizations, or individualswith many connections and links to different
resources. They can be divided into two
categories, according to the richness of the
information they can offer: those who will
be surveyed (supporting) and those who
will be interviewed (core).
Supporting respondents are usually, but
not always, individual participants without
any strong afliation to a group. They could
be audience members, users of a facility
or resource, or members of the general
public. They could be representatives
of groups who are clients of a service or
resource, individual users of a resource
such as an artists’ association, or less active
organizations.
Core respondents are usually, but not
exclusively, people who have been
involved for a long time in the direction
of an organization or institution, or
knowledgeable individuals with a history of
involvement, activism and representation.
As you go along, you will probably hear
of or discover other respondents who
should be included in the study. You or
your researchers may also nd, on looking
at interim results, that certain supporting
respondents should be moved to the corelist and asked for more information.
SURVEY QUESTIONSSurvey questions for groups and
organizations should be different from those
for individuals. For one thing, the needs and
concerns of individuals are very different,
as are their experiences. It is helpful to
survey a number of local artists or users as
individual respondents, to have a sampling
of data regarding their situation.
In order to obtain information about
artists in the aggregate, the best source
is probably their professional association.
Canadian Artists’ Representation/Le Front
des Artistes Canadiens (CARFAC), provincial
associations of professional dancers, writers,
or musicians, the Alliance of Canadian
Cinema, Television and Radio Artists
stAGE II: PRojEct d

8/8/2019 Cultural Mapping Toolkit
http://slidepdf.com/reader/full/cultural-mapping-toolkit 34/94
AGE
ULtURAL MAPPInG tooLKIt: A Parerhip ewee 00 Legaie nw a creaive ciy newrk f caaa
(ACTRA), and the International Alliance of
Theatrical Stage Employees (IATSE) may be
able to provide you with numbers of their
members in your target area.
You might decide not to ask a respondent’s
name, but be sure to ask their function,
in what sector they operate, and their
relationship to the resources in that sector. It
is amazing how often such fundamental kinds
of information are inadvertently lost through
a simple oversight in the survey design. The
date on which they complete the survey canalso be signicant.
If you do ask their name, be sure to
include a mechanism for getting back to
them, via e-mail or snail mail. This will
aid communications, provide valuable
information for the database, and facilitate
follow-up. You might also want to build in a
formula for permission to use direct quotes
from their responses. Obtaining permission
at this stage will save you time later on.
A major consideration in survey design
is how the responses will be expressed.
Quantitative responses, such as yes or no, or
using a scale of one to ve, are easier to tally
and record, but brief, qualitative responses
yield much richer information. For example,
you could ask respondents how often they
use or visit three named resources (the
arena, the library and the riverside park).
Alternatively, you might ask them to name
the top three facilities or resources they useon a monthly basis. The answers will not be
the same. You could discover in the second
case that the top three are the library, the
hilltop, and a bar on Broadway that hosts
local bands, and that the arena ranks eighth.
Survey questions should be specic and
tailored to your objectives. In designing the
questions themselves, it is usually helpful to
indicate possible responses or give examples;
these will encourage respondents to think
about the questions in ways they might not
otherwise. It is also advisable to give them
the opportunity to express themselves freely,
as with a comments section, so that the
response will not be pre-determined.
INTERVIEW QUESTIONSInterviews, on the other hand, should be
designed to do two things: solicit the
specic kinds of information you are seeking
and leave room for volunteering other information or observations.
The emphasis on volunteering other
information is greater in an interview than
in a survey. Your interview respondents
should be selected for the depth of their
knowledge and, because of that, their ability
to expand on the basic questions. Build in
open-ended, leading questions. For example:
In your opinion, why did a certain project
or program succeed or fail? Where and howdo you nd volunteers? What is the nature
of your private/public sector support?
Has your level of public funding changed
signicantly over the past ve years, and to
what would you attribute this?
Again, be sure to collect the essential,
baseline data you need to complete your
inventory. In this regard, interviewees are
on the same footing as survey respondents.
You need to know their function, their
specic sector, and how they use or provide
resources. Don’t make assumptions; groups
may have connections or functions of which
you are not aware.
(See Appendi C:
Tools – Surveys and
Interviews)
8/8/2019 Cultural Mapping Toolkit
http://slidepdf.com/reader/full/cultural-mapping-toolkit 35/94
PAG
Possible Survey & Interview QuestionsSurvey Questions for Supporting Respondents
Interview Questions for Core Respondents
stAGE II: PRojEct d

8/8/2019 Cultural Mapping Toolkit
http://slidepdf.com/reader/full/cultural-mapping-toolkit 36/94
AGE
ULtURAL MAPPInG tooLKIt: A Parerhip ewee 00 Legaie nw a creaive ciy newrk f caaa
8/8/2019 Cultural Mapping Toolkit
http://slidepdf.com/reader/full/cultural-mapping-toolkit 37/94
PAG
Stage III:Implementation-
Explore
stAGE III: IMPLEMEntAtIon-Ex
the mar mappig l i he ‘ulural aeme’r aui, whih ivlve iveigai i euaa ae; mmuiy prlig hrugh urvey,ierview, a fu grup; ehi prlig;prlig f urim a leiure aiviie; aprlig f ar-relae rgaiai a uie.
– jeifer Raure, Full Hue thery
“
”

8/8/2019 Cultural Mapping Toolkit
http://slidepdf.com/reader/full/cultural-mapping-toolkit 38/94
AGE
ULtURAL MAPPInG tooLKIt: A Parerhip ewee 00 Legaie nw a creaive ciy newrk f caaa
Step 9 – Contacting the CommunityThe next step is to approach members of
the community in order to collect the data.
You should do a little spadework before
giving your interviewers the go-ahead.
ANNOUNCING THE PROCESSIt is always a good idea to let the public
know about the study, usually through a
media release and public communications.
If local media pick it up as a story, so muchthe better. This advance notication tends
to stimulate a buzz. It can give potential
respondents a chance to think ahead about
their contribution and issues that are
important to them. It can also save your
researchers time otherwise spent explaining
the nature of the exercise and its objectives.
Another avenue is to build an
announcement into the agendas of
organizations and associations. Ask the
chair or convener of a meeting to mention
the mapping project and lead a discussion
of possible responses before your
interviewers show up.
COLLABORATIONSLocal or sector organizations can assist with
the process in two ways, aside from acting
as respondents:
• by disseminating surveys and identifying
interview subjects• by promoting the process to their
own constituencies through bulletins,
newsletters and informal networks
INFORMAL NETWORKSCheck out new opportunities for sharing
and collaboration. Participation in funding
programs at other levels of government
(provincial, federal and territorial) may
create alliances that are not visible to you
at the municipal level. Ethnically diverse
groups may share resources in ways that
are unknown to the mainstream population.
All the publishers in town may get together
every week at a downtown pub.
These informal networks can function as
resources in themselves. They are conduits of
information and often the site of backroom
political activity. As such they should be
recognized in some way in your inventory
and used as a source of respondents.
LEADERS AND KEY INDIVIDUALSIn any community there are opinion leaders
and outsiders. As your knowledge of the
community expands, you will become
increasingly aware of their relative importance
and inuence, whether positive or negative.
In an open process of exploration, both types
can be valuable sources of information that
bring to light underlying problems or new
directions in a community.
In some cases individuals cross disciplines
or sectors by virtue of their professional
role. The ofcers of social services or public
funding programs are an example. If you
are not yourself responsible for funding in
municipal administration, you may want to
contact your colleagues in that area. Similarly,
funding ofcers at other levels of governmentcan provide an overview of a certain situation,
in accordance with their mandate.
Community leaders at the neighbourhood
or district level can also prove to be valuable
contacts. Many of them deserve an interview,
since their range of involvement may be large.
At the same time, discreet cross-checking of
their credibility and reliability is advisable, and
8/8/2019 Cultural Mapping Toolkit
http://slidepdf.com/reader/full/cultural-mapping-toolkit 39/94
PAG
in sensitive cases, interviewers should be alert
to the possibility of political conicts. For
example, there may be factions within a given
community, and diplomacy would dictate
contacting the leaders of each, although you
might anticipate contradictory responses.
Community ContactsOrganizations Networks Key Individuals
stAGE III: IMPLEMEntAtIon-Ex

8/8/2019 Cultural Mapping Toolkit
http://slidepdf.com/reader/full/cultural-mapping-toolkit 40/94
AGE
ULtURAL MAPPInG tooLKIt: A Parerhip ewee 00 Legaie nw a creaive ciy newrk f caaa

8/8/2019 Cultural Mapping Toolkit
http://slidepdf.com/reader/full/cultural-mapping-toolkit 41/94
PAG
Step 10 – Tallying and Entering Results
The method of tallying survey results
should allow for qualitative, subjective
responses. If the information is supplied
anonymously and there is no need to tie a
specic response to a specic informant, it
may be most efcient to create a secondary
database or le to store such remarks.
You may nd it a challenge to assimilate andrecord the results of interviews, because
they can be wide-ranging. This underscores
the importance of guidelines for data
collection, and for exibility in applying
the guidelines. You may nd yourself with
crucial information that had not been
anticipated in your planning or a wealth of
detail that is beside the point. It is helpful to
be clear in establishing the overall goals for
interviewers. You might also create reporting
categories, along the lines of:
• factual baseline data – who, what,
where, when
• responses to principal categories of
information – networks, needs or problems,
clients, level of and kind of usage
• red ag items – the unanticipated or
anomalous, emergencies, signicant gaps
For both surveys and interviews, it is
helpful to have a mechanism to record
the unclassiable – general conclusions,
predictions, remarks out of left eld – for
future reference.
stAGE III: IMPLEMEntAtIon-Ex

8/8/2019 Cultural Mapping Toolkit
http://slidepdf.com/reader/full/cultural-mapping-toolkit 42/94
AGE 0
ULtURAL MAPPInG tooLKIt: A Parerhip ewee 00 Legaie nw a creaive ciy newrk f caaa
8/8/2019 Cultural Mapping Toolkit
http://slidepdf.com/reader/full/cultural-mapping-toolkit 43/94
PAG
Stage IV:
Synthesis-Make Sense
culural mappig ha ee regie yUnEsco a a ruial l a ehique ipreervig he wrl’ iagile a agileulural ae. I empae a wie ragef ehique a aiviie frm mmuiy-ae pariipary aa llei amaageme phiiae mappig uigGIs (Gegraphi Ifrmai syem).
– Uie nai Euaial, siei a
culural orgaiai, Cultural Mapping.
“
”
stAGE IV: sYntHEsIs-MAKE

8/8/2019 Cultural Mapping Toolkit
http://slidepdf.com/reader/full/cultural-mapping-toolkit 44/94
AGE
ULtURAL MAPPInG tooLKIt: A Parerhip ewee 00 Legaie nw a creaive ciy newrk f caaa
MATCHING DATA WITHOBjECTIVESOnce you have transferred the results of your
research to the database, it’s appropriate to
recall your fundamental parameters – the
answers to “What do we need to know?”
along with your original vision of the nished
map. It might be helpful to look at your notes
from planning sessions and the results of the
original community meetings.
You can begin by reviewing the information
you have collected with those fundamentals
in mind. It is now possible to align the data
in different ways so as to create alternate
proles and to identify which features will
become the basis of your analysis.
Data clusters that serve to answer your
questions can be called ndings. For
example, by sorting street addresses you
nd that four social service organizationsare housed in the same low-rent building
and share practical resources, such as a
photocopier and a fax line. That building
and its tenants therefore form a network,
which is a nding in itself.
You can break out different subsets of
information according to the categories or
elements that will be relevant to your study
(sector, neighbourhood, usage, etc.).
For example, if your objective includes a
study of performing arts venues, your data
might show the following for music:
• a large number of young musicians on the
cusp of becoming professionals• a number of groups performing ethnically
diverse forms of music
• three small groups playing classical music,
including a chamber orchestra
• an annual school band and choir
competition
• a free after-school music learning program
for low-income families and at-risk youth
• a hip-hop program in a number of middle
and secondary schoolsThis establishes a certain level of demand.
You may also have found that three
neighbourhood churches with wonderful
acoustical properties are looking for alternate
uses and sources of income, such as music
performances, rehearsals and recording.
Both series of information constitute a
nding by adding to your knowledge of the
situation. Your analysis has shown you the
extent and kind of demand and one possibleway to respond to it. You might want to
create two maps, one for demand and one
for supply, or you may wish to provide a
secondary map for music by itself.
Step 11 – Roughing out the Map(s)

8/8/2019 Cultural Mapping Toolkit
http://slidepdf.com/reader/full/cultural-mapping-toolkit 45/94
PAG
Sorting Data(this can be done in your database or spreadsheet)
Music Groups
(symphony, bands, etc.)
Characteristics
(size, audience, frequency of performance)
VenuesCharacteristics
(location, capacity, usage)
stAGE IV: sYntHEsIs-MAKE

8/8/2019 Cultural Mapping Toolkit
http://slidepdf.com/reader/full/cultural-mapping-toolkit 46/94
AGE
ULtURAL MAPPInG tooLKIt: A Parerhip ewee 00 Legaie nw a creaive ciy newrk f caaa
In a second stage you can begin to interpret
the data in terms of your objectives, i.e.,
analyze what answers you have to your
questions, and make a summary of ndings.
If your question is “Who are we?”, a
preliminary summary of ndings could
highlight new resources discovered in the
course of mapping and how they relate to
previously known elements. If you are trying
to hone in on a particular problem or issue,
you can start sorting the data that relate
to alternate diagnoses and solutions and
weighting them for relevance, practicability,
or frequency of occurrence.

8/8/2019 Cultural Mapping Toolkit
http://slidepdf.com/reader/full/cultural-mapping-toolkit 47/94
PAG
Matching Data with ObjectivesObjective Finding Relevance (new information/urgency)
stAGE IV: sYntHEsIs-MAKE

8/8/2019 Cultural Mapping Toolkit
http://slidepdf.com/reader/full/cultural-mapping-toolkit 48/94
AGE
ULtURAL MAPPInG tooLKIt: A Parerhip ewee 00 Legaie nw a creaive ciy newrk f caaa
Determining Levels of Information
Level 1 - Major ndings e.g., city-wide
Level 2A - Findings for structure A city-owned
Level 2B – Findings for structure B non-prot
Level 3A – Findings for discipline A museums
Level 3B – Findings for discipline B dance
The inventory itself is a form of supporting documentation that can be included as part of
your report or website, or as an appendix to your map.
MORE THAN ONE MAP?Again, remember that you are not limited to
a single analysis or map in presenting your
ndings. It might be useful to create subsets
of information having to do with certain
categories of data; for example, the different
communities or sectors that use particular
resources.
In another situation, you may nd while
sorting the data that different axes of
signicance or importance emerge. For
instance, having conducted a general
overview, you could discover that there is a
major deciency in resources in a particular
area, such as a shortage of adequate
venues for dance. At the same time, the
local theatre companies are facing a crisis
regarding their storage space. In such a case
you may want to address each problem area
or issue by using another, secondary map.
You might also realize that you have too
much information to be conveyed by a
single interpretation. On the rst level of
interpretation you may want to demonstrate
how many resources exist, the different
types of resources, and their distribution
city-wide. On a second level, you want to
drill down to show who is using them and
why, or home in on a certain neighbourhood
or district for special treatment.

8/8/2019 Cultural Mapping Toolkit
http://slidepdf.com/reader/full/cultural-mapping-toolkit 49/94
PAG
A properly designed inventory:
• includes all the dimensions you want to
capture
• is organized so as to deliver answers to
your central questions
• is complete for the different resources
Moving from the data to its representation
should proceed logically.
THE LEGENDThe importance of a legend to interpreting
a graphic map is obvious. For instance, if
you’re travelling by car, reading a map’s legend
allows you to distinguish divided highways
from dirt roads. Similar in importance is the
sequence of menu items and navigational
tools that make a website user-friendly or
not. It is obvious, from the map analogy, that
it makes sense to treat the resources in a
particular category in an analogous way (linesfor roads). At the same time, you will want to
ag the differences between them (red lines
are paved roads, grey lines are gravel roads).
So conceiving the legend resides largely
in deciding how general resemblances and
particular distinctions are to be conveyed.
Before creating the actual visual and
structural components of your map, it
is helpful to think through how many
categories of elements there are, how they
compare with one another, and the relative
size of their footprint in the overall picture.
Another major question is the degree of
detail you wish to include.
For example, as with roads, you may have
three resources in a given category that are
fundamentally different in nature. Think of
green spaces – one by the river, unspoiled
and preserved; one next to City Hall,
which houses a public art display; and one
including areas for unorganized sport such
as bocce ball. All can be agged as parks,
and each can be distinguished as to its use.
The next step is to look at the tools you
have at your disposal, such as structural
components, keys, and visual markers (e.g.
symbols, colours). Symbols, for example, can
Step 12 –
Converting an Inventory to a Map
stAGE IV: sYntHEsIs-MAKE

8/8/2019 Cultural Mapping Toolkit
http://slidepdf.com/reader/full/cultural-mapping-toolkit 50/94
AGE
ULtURAL MAPPInG tooLKIt: A Parerhip ewee 00 Legaie nw a creaive ciy newrk f caaa
be used to visually illustrate relationships
or types of resources; colours can signify
density or categories. Determine what you
will need to represent, what kinds of visual
tools and guides will be most useful, and how
many you will need. How many menus on the
home page? How many items for each? How
many lines, dots and squares will it take?
As for how much detail, that depends on
your fundamental question and how muchinformation is required to answer it. On a
practical level, it depends whether you have
a sufcient number of keys at your disposal
to convey the information. If you have a lot
to convey, a subordinate map or menu with
a new set of keys might be the answer. If you
wish to streamline your presentation,
a reader or web user who wants more data
can always be referred to the inventory itself.
VISUAL KEYSAND STRUCTURAL ELEMENTSIn a graphic map, the tools at your disposal
are the map’s scale and coordinates, its
geographical divisions, and the markers. The
markers, with their colour, size, shape and
design, can carry a freight of data. Their design therefore calls for much serious
consideration; however, it also gives your
inner child a chance to come out and play.
Here’s an example of tools and markers that
might be used for a hypothetical study of
performing arts resources:

8/8/2019 Cultural Mapping Toolkit
http://slidepdf.com/reader/full/cultural-mapping-toolkit 51/94
PAG
Tool Key Marker Signicance
Resource – T. C. Douglas Auditorium
Scope of map Entire city City-wide study
Coordinates North/south, east/west M10 Downtown core
District Neighbourhood Centre Lots of trafc; goodaccess
Marker shape Type of organization Star Performing arts venue
Marker size Size of regular clientele/audience 2/5 Second largest –
15,000+ per annum
Marker colour Capacity Red 1,000-2,000 seats
Marker design Corporate status Solid Publicly owned
Resource – Bluebird Recording Studios
Scope of map Entire city City-wide study
Coordinates North/south; east/west B2 Hinterland
District Neighbourhood Carrington Hill Small business in a lightindustrial area
Marker shape Type of organization Musical note/disc Music recording studio
Marker size Size of regular clientele/audience 4/5 Medium – 100+ per
annum
Marker colour Capacity Blue Small
Marker design Corporate status Hollow Privately owned
stAGE IV: sYntHEsIs-MAKE

8/8/2019 Cultural Mapping Toolkit
http://slidepdf.com/reader/full/cultural-mapping-toolkit 52/94
AGE 0
ULtURAL MAPPInG tooLKIt: A Parerhip ewee 00 Legaie nw a creaive ciy newrk f caaa
What might be concluded after looking
at the markers is that the T.C. DouglasAuditorium is under-utilized, which could
be because there are three performing
arts venues in the same district and
they are competing with each other for
the available clients. Regarding Bluebird
Recording Studios, it may be the only such
facility in the city and unable to keep up
with demand, sending potential clients to
suppliers in other cities.
In a website, relationships can be expressed
structurally through hyper-text links fromone page to another and different levels
of subordination in the site structure. In a
sense, the site map becomes the structural
equivalent of the graphic map. Using the
examples from above, a portion of the site
map might look like one of these:
Menu Item – Performing Arts
• Music• Venue
• City Centre
• T.C. Douglas Auditorium
• Capacity
• Usage
• Corporate status
Menu Item – Privately-owned facilities
• Bluebird Recording Studios
• Technical• Performing arts
• Music
• Capacity
• Usage
• Location
For an example of a web presentation, take
a look at http://vancouver.ca/facility_wac/
facility.exe/venuelist_all
In both cases you are presentinginformation about resources. In the rst
case, your objective might be to inform your
target audience about available resources,
with an emphasis on location and capacity.
In the second case, your objective might
be to inform about different corporate
structures within the resource base, or
about resources within cultural industries.
(See Appendi C:
Tools – Legend)
8/8/2019 Cultural Mapping Toolkit
http://slidepdf.com/reader/full/cultural-mapping-toolkit 53/94
PA
The LegendGraphic Map
Category Element Marker Characteristics
Website
Category Element Menu Item Site Location
stAGE IV: sYntHEsIs-MAKE

8/8/2019 Cultural Mapping Toolkit
http://slidepdf.com/reader/full/cultural-mapping-toolkit 54/94
AGE
ULtURAL MAPPInG tooLKIt: A Parerhip ewee 00 Legaie nw a creaive ciy newrk f caaa
MAP MAKINGThis is where your technical assistance
comes in. The city’s or university’s urban
planning department may be able to help
you with the rendering of a graphic map or
a website. They will no doubt have some
ideas about how to present the data.
THE ROLE OF NARRATIVEUnless you are preparing an illustrative map
or website for tourist promotion, you will
rely on a narrative to introduce the study,
draw preliminary conclusions and indicate
new directions. The map or maps remain a
rapid and accessible overview of your data,
but orienting the user or connecting the
dots is usually done by means of text.
As well, you may want to include a summary
of comments gleaned from the interviews
and community meetings, and a digest
of survey results. Adding representative
examples or case studies could help to make
the ndings more concrete and memorable.
(See Appendi C:
Tools – GIS)

8/8/2019 Cultural Mapping Toolkit
http://slidepdf.com/reader/full/cultural-mapping-toolkit 55/94
PAG
THINGS TO LOOK FOR
OVERVIEWS AND URGENCIES
Your study should provide a comprehensive
scan that allows you and your target audience to take a broad and
comprehensive view of the general situation.
You might also be able to hear a common
voice. Have you received comments within
a given sector that are similar, pointing to
a pressing need or, more positively, to what
could be considered a strength? More
important, have you heard the same appeal
from different sectors, indicating a need
common to all? How does this t with the
overall picture? Is it signicant enough to be judged a priority and become the basis of a
recommendation?
DISTRIBUTION OF USAGE WITHINSECTORS
One aspect that can be relatively easy to
track is the distribution of population and
popular usage for different resources by
sector. In addition, the reasons for this
distribution also may have been revealed
through surveys and interviews. For example,why does the dance community consistently
avoid a particular venue? Answer: The
ooring is not suitable and could cause
injuries. Why is one library branch more
popular than another? Because it is across
the street from a major shopping mall,
and mothers drop their children at the
storytelling corner while they’re shopping.
GAPS, BONUSES, SURPRISES
Another thing that is usually quickly
exposed is a resource gap. This will normally
be revealed both through the inventory
and in survey and interview responses. For
example, a number of new independent
theatre companies report they have a lot of
choice for performing venues, but nowhere
to rehearse. Remember that you can also
look for possible solutions, such as using
an existing resource in a new way. Empty
churches might be in search of new user
groups, for example.
Bonuses occur when you nd that
information supplied by one informantanswers the need of another, or that a
certain sector has taken steps to solve its
own problem. If there is a way that the
municipal government can support such
initiatives, so much the better. You may nd
yourself surprised by either unanimity on
the part of the community or, conversely,
deeply rooted conict on certain issues.
Then again, you might nd there are a
high number of null responses on a certain
point. Is the community unaware of certainresources that actually exist? Why is that?
INTERCONNECTIONS
Identifying networks, collaborations and
commonalities is also important. Look for
common addresses where a number of
similar organizations share space. Explore
the evolution of joint initiatives: are they
stAGE IV: sYntHEsIs-MAKE
Step 13 – Analysis and InterpretationOnce you have a draft report in hand, whether it is a graphic map, a website map or a text-
based map, you can begin the business of drawing major conclusions and testing the validity
of your ndings with the community.

8/8/2019 Cultural Mapping Toolkit
http://slidepdf.com/reader/full/cultural-mapping-toolkit 56/94
AGE
ULtURAL MAPPInG tooLKIt: A Parerhip ewee 00 Legaie nw a creaive ciy newrk f caaa
motivated by a shared mandate, a funding
opportunity, or the vision of a particular
individual or group? Anomalous functions
sometimes provide clues to collaboration. For
instance, if the food bank is offering literacy
courses, there is likely a partnership at work.
The impact of certain individuals or groups
of individuals may also come to light, if
the name is heard repeatedly in different
contexts. Madame X sits on three volunteer
boards, works part-time with the Open
Door Society, and owns a neighbourhood
café that offers discount meals to social
assistance recipients. The café is run by her
daughter, Ms. X, who is also involved with
a community theatre group specializing in
collective productions by people on welfare.
In the meantime, a certain Mr. X is president
of the neighbourhood association. Are they
related? Does that family constitute a little
engine of activity all by itself?
OPPORTUNITIES – VISION
On the macro level, you should ask what
kinds of trends are exposed or illustrated.
What are the community’s principal
strengths and weaknesses? What are
the components of its identity? What
challenges is it facing?
How do the results answer your central
question? Do they indicate a need for adjustment? Are there sufcient and
appropriate public resources for youth,
new Canadians, an aging population? With
increased rental rates in the downtown
core, where are the creative members
of the community congregating? Where
is development already taking place on
its own, organically? On the micro level,
opportunities might become apparent.
Group X and Group Y share similar interests
and needs. Should they be introduced?
Would Group Z have something to offer
them both? Could this collaboration serve
as a transferable model for other sectors?
A lot of what you have done serves to cut
across disciplines and sectors. A municipal
cultural worker is in a unique position in
this regard. He or she may well interact with
multiple sectors who do not know each
other very well, or at all. Cultural mapping
gives those who are not in a position to
have an overview the opportunity to gain
a broader perspective. By this means they
can see where opportunities exist to build
on strengths by sharing information, best
practices or resources.
WORKING WITH RELATIONSHIPS
The principal difference between an
inventory and a map is the identication
and depiction of relationships rather than
the presentation of a list of facts. Your
map, with a little imagination in design, can
indicate factors that are relative, contextual
and qualitative. It will animate the inventory,
give it new dimensions, and make it a
much more powerful tool for planning and
advocacy.
8/8/2019 Cultural Mapping Toolkit
http://slidepdf.com/reader/full/cultural-mapping-toolkit 57/94
PAG
ConclusionsNew Findings
(groups, networks, etc.)
Urgent needs
Strengths
Gaps
Challenges met
Overlaps
Interconnections
Opportunities
stAGE IV: sYntHEsIs-MAKE

8/8/2019 Cultural Mapping Toolkit
http://slidepdf.com/reader/full/cultural-mapping-toolkit 58/94
AGE
ULtURAL MAPPInG tooLKIt: A Parerhip ewee 00 Legaie nw a creaive ciy newrk f caaa

8/8/2019 Cultural Mapping Toolkit
http://slidepdf.com/reader/full/cultural-mapping-toolkit 59/94

8/8/2019 Cultural Mapping Toolkit
http://slidepdf.com/reader/full/cultural-mapping-toolkit 60/94

8/8/2019 Cultural Mapping Toolkit
http://slidepdf.com/reader/full/cultural-mapping-toolkit 61/94
PAG
Stage V:
Finalizingthe Report
the aaae a map reaefr hi pre are a igiapiee f he pule ha help eplai hw … failiie riueulurally, ially a emially tr’ qualiy f life.”
– A Map of Toronto’s Cultural Facilities, ciy f tr divii f
Emi develpme, culure a turim.
“
stAGE V: FInALIzInG tHE RE

8/8/2019 Cultural Mapping Toolkit
http://slidepdf.com/reader/full/cultural-mapping-toolkit 62/94
AGE 0
ULtURAL MAPPInG tooLKIt: A Parerhip ewee 00 Legaie nw a creaive ciy newrk f caaa
Early on you identied a target audience,
or a series of them: colleagues, municipal
administrators, city council, and other
stakeholders, up to and including the larger
community and visitors from outside. The
information must be delivered in a way
that is useful and understandable to those
different groups. Keep in mind they do notall have the same requirements and one size
does not necessarily t all. If the report is
to be presented to different constituencies,
you should give some thought to its
versatility.
LEVELS OF DETAILThe level of detail you present is important.
You may have uncovered a wealth of
fascinating tidbits, but many may not serve
the immediate purposes of your targetaudience. What do they need to know?
What do they want to know? What do you
think they should hear, for the benet of all
concerned?
For example, if you are addressing your
colleagues, you will be able to present the
data in a detailed way, since they are likely to
be familiar with the territory. They may also
have a need to hear the nuances. However,
if you are addressing city council or one of
its committees, you will not want to fog the
landscape with a lot of ancillary information,
even if it does support your conclusions. It is
better to deal with categories and examples
than a torrent of specics.
One way to juggle this is to organize your
report by headlining principal information
that responds to the largest questions, and
creating secondary maps or subordinate
menu items that either support or
supplement the major ndings. You can tell
your readers these pieces exist and invite
them to go into the secondary areas as
required.
In any case, it is helpful from a public
relations perspective to include some formof emblematic visual map to get the concept
across and set the tone. If you are not
creating a graphic map as part of the report,
the emblematic piece could be a map of
the city obtained from urban planning or a
compelling visual map created by an artist.
A hi pi yu hul have he awer yur quei. Wih hehelp f he pariipa yu have reviewe a mie he aa, aliehe eeial map epre yur ig, a ree yur luia remmeai. Yu are alm reay g puli. there are aumer f hig ier efre yu , a yu migh eek heavie f a mmuiai fer.
Step 14 –Speaking to Different Audiences
8/8/2019 Cultural Mapping Toolkit
http://slidepdf.com/reader/full/cultural-mapping-toolkit 63/94
PAG
Need to KnowTarget Audience Necessary Information
stAGE V: FInALIzInG tHE RE
8/8/2019 Cultural Mapping Toolkit
http://slidepdf.com/reader/full/cultural-mapping-toolkit 64/94
AGE
ULtURAL MAPPInG tooLKIt: A Parerhip ewee 00 Legaie nw a creaive ciy newrk f caaa
SUBjECTIVE ELEMENTSAmong the fascinating tidbits will be
comments, anecdotes, and quotable quotes
from the surveys and interviews. They often
sum up or underline a particular point, and
they add colour and life to a presentation.
They can be used as sidebars, chapter
headings and epigraphs, or text inserts. If
there is a large number of them and they are
especially relevant, they might be compiledand included in an appendix or a separate
section of the report.
You might want to include examples of
particular situations that illustrate your main
points, such as proles of individuals or
organizations.
If your objective is to create a heritage
website, then these elements become
essential because you will want to portray
the stories and historic social elements of the community.
Just remember to ask the respondents for
their permission to use this kind of material,
if it is to be attributed to them. The request
for permission can be built into the survey
and interview format. You might also assure
respondents that you will let them know
if you quote them, in what context, and
how the quote will be attributed. You can
perform that follow-up once the report hasbeen drafted.
CUSTODY AND SUCCESSIONWhen all is said and written, you must decide
collectively who is the best candidate to
adopt the nal product and give it a home.
This depends on a number of factors:
• the objective
• the type of map
• the target audience
• future needs and probable uses
If your intention was to discover the city’s
cultural identity and you have produced a
graphic map, then the report might best
be housed with the city, with the map
posted on the city’s site for access by thegeneral public. It might then be reasonable
to anticipate periodic updates carried out
by cultural workers and their collaborators,
such as university departments.
In the case of a web-based map describing
the potential for cultural tourism in the
interest of attracting visitors, the logical
caregiver might be the city’s tourism
association and its home might be their site.
If the city has a local arts commission or heritage society, they might be interested in
taking charge of the process and the map
itself.
FINALIzE THE REPORTHaving consulted with your contacts and
the community, you should be in a very
strong position to present a report that is
comprehensive, realistic and supported by
those affected by the fundamental issues.
While the inventory is important and shouldbe included as supporting documentation,
the substance of the report will be in the
ndings – ndings about causes, gaps and
strengths made through your analysis and
synthesis of the data. On the basis of these
ndings, you can make credible conclusions
and recommendations to the target
audience.(See Appendi C:
Tools – Report Outline)

8/8/2019 Cultural Mapping Toolkit
http://slidepdf.com/reader/full/cultural-mapping-toolkit 65/94
PAG
Stage VI:
Going Public
We have g mre pliial mileageu f ur ulural map ha uau ayhig ele.”
– Ke dhery, Peerrugh, oari
creaive ciy newrk Memer
“
stAGE VI: GoInG P
8/8/2019 Cultural Mapping Toolkit
http://slidepdf.com/reader/full/cultural-mapping-toolkit 66/94
AGE
ULtURAL MAPPInG tooLKIt: A Parerhip ewee 00 Legaie nw a creaive ciy newrk f caaa
WHO IS LISTENING?Your communications strategy should
include two groups – those who want to
hear what you have to say and those who
have to be convinced it’s worth listening to.
Your target audience may or may not be
part of the rst group, depending on the
political situation.
However, the receptive group will
likely include your collaborators, your
respondents and the community whose
needs you set out to address. These people
are your best audience and supporters.
Another receptive group is made up of
those people within the administration and
the community who, although not directly
involved in the process, were supportive
early on.
You might want to invite the receptive group
to a preview of the nal map or send them
copies, if that is feasible. It reinforces their
identity as owners of the process, allows you
to rehearse your response to challenges,
and may give you a leg up politically.
Members of the media could also be
sympathetic, especially if they helped to
announce the project initially. In that case
they will be glad to follow up. This kind of
study is usually newsworthy because it is
novel and produces concrete results. Some
of the results can even be visually appealing.
However, it is not usually recommended
to leak results to the media until they are
revealed to the target audience.
Step 15 – Getting the Word Out
Preview Invitations
Target community
Supporters
Collaborators
Interview subjects

8/8/2019 Cultural Mapping Toolkit
http://slidepdf.com/reader/full/cultural-mapping-toolkit 67/94
PAG
WHO ISN’T LISTENING,BUT NEEDS TO HEAR?Your primary target audience may not be
sympathetic, which could be your reason for
undertaking the exercise in the rst place.
A number of factors can come into play:
• indifference to cultural issues
• lack of appreciation for the importance of
certain sectors or approaches• lack of attention to problems
• refusal to accept the validity or utility of
cultural mapping
• reluctance to support new development
initiatives
• reluctance to re-think development
initiatives that threaten the cultural
ecology
City management, tourist associations and
the general public – in short, any one of your potential target audiences – may not
be supportive.
There could also be resistance in certain
sectors of the community itself. People
might not recognize the validity and
importance of other sectors or types of
resources. In these cases, a more aggressive
communications strategy may be required
to make sure the mapping process and its
results are acknowledged and understood.
Despite any resistance, and because of it,
the completion of the map should be an
occasion for celebration. Here are some
things you can do to beat the drum:
• Make a formal presentation of your
report to the mayor and issue a media
release about the occasion.
• Have one or a few of your stakeholders
get on the agenda of a city councilmeeting to discuss the report. Then the
elected ofcials cannot ignore the fact
that the mapping has taken place, and
results will be a matter of public record.
• Make a splash – organize a media
conference and unveiling. Be sure to invite
the target audience. Pack the hall with
supporters and interested parties. In this
situation your local media could be an
ally. Politicians are very sensitive to public
opinion, and they are usually reluctant tobuck a successful trend.
Your communications ofcer may have some
other ideas, such as to time the unveiling to
coincide with another event, or to recruit
key gures from the administration or the
community for the presentation itself. The
venue, if it is not the city hall, can be used
to set the tone.
Don’t forget the launch party for your crew!
stAGE VI: GoInG P

8/8/2019 Cultural Mapping Toolkit
http://slidepdf.com/reader/full/cultural-mapping-toolkit 68/94
AGE
ULtURAL MAPPInG tooLKIt: A Parerhip ewee 00 Legaie nw a creaive ciy newrk f caaa
Invitations to the Unveiling
Mayor
Councillors
Funders
Future custodians of
the map
City administration
Media
Target community
Supporters
Collaborators
Interview subjects

8/8/2019 Cultural Mapping Toolkit
http://slidepdf.com/reader/full/cultural-mapping-toolkit 69/94
PAG
NOW THAT THE PARTY’S OVER......you retire to your desk with a boatload
of information that can be used in a number
of ways:
• as a reference
• to set priorities
• for advocacy
• for orientation of new staff and councillors
and, not to be overlooked,
• as an important initial phase of preparing
a cultural plan for your municipality
G luk!
stAGE VI: GoInG P
8/8/2019 Cultural Mapping Toolkit
http://slidepdf.com/reader/full/cultural-mapping-toolkit 70/94

8/8/2019 Cultural Mapping Toolkit
http://slidepdf.com/reader/full/cultural-mapping-toolkit 71/94
PAG
Appendix A:
Background
APPEndIx A: bAcKGRo

8/8/2019 Cultural Mapping Toolkit
http://slidepdf.com/reader/full/cultural-mapping-toolkit 72/94
PAG
BackgroundWHAT IS CULTURAL MAPPING?Cultural mapping is widely used as a
planning and development tool by different
levels of government and non-governmental
organizations. It has become increasingly
popular with municipal and cultural
administrators in this country; it is now
regarded as the rst step in formulating a
cultural plan.
Cultural mapping is not a new concept, nor
is its current application as an instrument of
cultural planning a new one. Historically, it
evolved as a means to capture and present
the history of indigenous peoples or to
describe their traditional activities within
a given territory. Since then, the mapping
technique has been taken up by agencies
such as the United Nations Education,
Scientic and Cultural Organization
(UNESCO) and the Association of Southeast Asian Nations (ASEAN) to
address other concerns, such as land rights
stemming from traditional usage (tenure
mapping) and the preservation of languages.
A tidy and concise denition of cultural
mapping, one that is not tangled up in its
immediate context, is hard to nd. The
denitions tend to rely on examples more
than on clear-cut terms. This is because
cultural mapping is not an end in itself, but
a means to an end. Everyone agrees it is atool that can be applied in many ways. It has
been used to describe situations as varied
as the potential for cultural tourism and
the participation of diverse populations in
community art activities.
One thing we can conclude from the various
denitions is that cultural mapping is
basically a process of recording, analyzing
and synthesizing, and a method of
describing or depicting resources, networks
and patterns of usage. In this context, the
word resources refers to the various elements
that contribute to culture, whether human,
natural, social, economic or built.
Cultural mapping allows us to see where
we’ve been and where we are in order to
nd our way forward, just as any mapping
process might. The difference is the objects
of cultural mapping are not topographical
features, but tangibles like assets and
resources and intangibles like identity,
relationships and possibilities.
POLITICAL DIMENSIONAs you can see, what we now call a cultural
map was rst used as a political tool. It has
since been used, in less politically charged
situations, as a tool of social and economic
development. It is currently associated with
a movement to democratize culture and
expand its denition to be more general and
inclusive. Some cultural mapping studies
have as their primary objective broadly
based social development goals.
Cultural mapping has also come to
connote inclusion of members of the
entire community and its many constituent
sectors as active participants. This principle
of inclusiveness stems in part from theexpansion of the denition of culture to
include many more aspects of municipal life
than high art, community art and heritage.
It also includes social, economic and
environmental aspects.
It should be kept in mind that cultural
mapping is a tool and a methodology, no
matter what its application. It can be applied
APPEndIx A: bAcKGRo

8/8/2019 Cultural Mapping Toolkit
http://slidepdf.com/reader/full/cultural-mapping-toolkit 73/94

8/8/2019 Cultural Mapping Toolkit
http://slidepdf.com/reader/full/cultural-mapping-toolkit 74/94
PAG
APPEndIx b:
Appendix B:
Maps

8/8/2019 Cultural Mapping Toolkit
http://slidepdf.com/reader/full/cultural-mapping-toolkit 75/94
PAG
WHAT DOES A CULTURAL MAPLOOK LIKE?The end result of cultural mapping is
presumably some kind of map. A document
that has come to be regarded as a classic is
a map created by the Inuit of Nunavut in the
1970s. It charts the natural and technical
resources in their territory that traditionally
supported their physical survival. It is a
graphically rendered, topographical map that
shows the locations of such resources as sh,
caribou, moose and traplines, with a legend
that was created by the community itself.
(see Poole, 2003)
ExAMPLES CITED IN THE TExTGraphic Map using GIS
City of Toronto, (2003). Economic
Development, Culture and Tourism –
A Map of Toronto’s Cultural Facilities
www.creativecity.ca/toolkits
Web-Based Inventory
City of Vancouver – Performing Arts
Facilities Inventory
www.vancouver.ca/facility_wac/facility.
ee/venuelist_all
TExT-BASED REPORTCommunity Arts Ontario –
Cultural Mapping Project (2003)
www.communityartsontario.ca/admindocs/Cultural%20Mapping%20Proect.pdf
ARTIST-DRAWN MAPSLand Trust Alliance. (2003). B.C. Islands
in the Salish Sea Community Mapping
Project: Portrait of a renowned community
in transition.
www.psat.wa.gov/Publications/03_
proceedings/PAPERS/ORAL/2d_harri.pdf
HAND-DRAWN MAPSPoole, Peter. (2003, March). Cultural
Mapping and Indigenous Peoples. ForestPeoples Programme, UNESCO.
http://portal.unesco.org/culture
Search for ”Mapping of Indigenous Cultural
Resources”
WEB-BASED MAPNSW Local Government, Australia – Cultural
Map of Queanbeyan
www.qcc.nsw.gov.au/culturalmap
WEB-BASED INVENTORYCity of Vancouver – On-line Public Art
Registry
www.vancouver.ca/commsvcs/oca/
PublicArt/registry.htm
WEB-BASED TOURIST MAPHalifax Regional Municipality – Art Map
www.halifaartmap.ns.ca/
APPEndIx b:

8/8/2019 Cultural Mapping Toolkit
http://slidepdf.com/reader/full/cultural-mapping-toolkit 76/94
PAG
APPEndIx c: t
Appendix C:
ToolsPlease note that these are
examples only, to get you started.

8/8/2019 Cultural Mapping Toolkit
http://slidepdf.com/reader/full/cultural-mapping-toolkit 77/94
PAG
Objectives and ParametersThese can be set in collaboration with your community.
APPEndIx c: t
What do we need to know?
• identity – who we are, what are the
elements of our cultural identity
. . . . . . . . . . . . . . . . . . . . . . . . . . . . . . . . . .
. . . . . . . . . . . . . . . . . . . . . . . . . . . . . . . . . .
. . . . . . . . . . . . . . . . . . . . . . . . . . . . . . . . . .
• taking stock – evaluation, adjustment of
priorities, estimate of needs. . . . . . . . . . . . . . . . . . . . . . . . . . . . . . . . . .
. . . . . . . . . . . . . . . . . . . . . . . . . . . . . . . . . .
. . . . . . . . . . . . . . . . . . . . . . . . . . . . . . . . . .
• problem-solving – measuring, tracking,
investigating a specic situation
. . . . . . . . . . . . . . . . . . . . . . . . . . . . . . . . . .
. . . . . . . . . . . . . . . . . . . . . . . . . . . . . . . . . .
. . . . . . . . . . . . . . . . . . . . . . . . . . . . . . . . . .
Is our objective to:
describe our actual situation, or
look for new information?
Who needs to know – target audience?
. . . . . . . . . . . . . . . . . . . . . . . . . . . . . . . . . . . . . .
. . . . . . . . . . . . . . . . . . . . . . . . . . . . . . . . . . . . . .
Who are our collaborators?
. . . . . . . . . . . . . . . . . . . . . . . . . . . . . . . . . . . . . .
. . . . . . . . . . . . . . . . . . . . . . . . . . . . . . . . . . . . . .
What outcomes are we seeking or expecting?
. . . . . . . . . . . . . . . . . . . . . . . . . . . . . . . . . . . . . .
. . . . . . . . . . . . . . . . . . . . . . . . . . . . . . . . . . . . . .
How much time do we have/will it take?
. . . . . . . . . . . . . . . . . . . . . . . . . . . . . . . . . . . . . .
. . . . . . . . . . . . . . . . . . . . . . . . . . . . . . . . . . . . . .
What is the scope of the study:
city-wide?
neighbourhood or district?
specic community or group?
Are we seeking:
subjective, qualitative material, or
quantitative data?
Who are our principal respondents and
informants?
. . . . . . . . . . . . . . . . . . . . . . . . . . . . . . . . . . . . . .
. . . . . . . . . . . . . . . . . . . . . . . . . . . . . . . . . . . . . .
Do we want to include individuals as well as
groups as subjects? Yes No
Should we include the general public as
respondents? Yes No
Will we be preparing a:
GIS or graphic map?
Website?
Text-based report?
Will the mapping activity continue into the
future on a periodic basis? Yes No

8/8/2019 Cultural Mapping Toolkit
http://slidepdf.com/reader/full/cultural-mapping-toolkit 78/94
AGE
ULtURAL MAPPInG tooLKIt: A Parerhip ewee 00 Legaie nw a creaive ciy newrk f caaa
Epenses – these may be cash or in-kind epenses
Item Amount
Fees Consultant
Interviewers
Web or map design
Data entry
Interview design
Communications Media releases
Media conference
Advertisements
Meeting Expenses Facilitator
Room bookings and equipment
Refreshments
Final Report Design/Printing
Photocopying
Distribution
Total
Revenues – cash and in-kind (make sure in-kind revenues match in-kind epenses)
Item Amount
Local government
Other governments Provincial
Federal
Foundations
Community partners
Local university/college
Local businesses
Other
Total
Budget

8/8/2019 Cultural Mapping Toolkit
http://slidepdf.com/reader/full/cultural-mapping-toolkit 79/94
PAG
Sector Scale Corporatestructure Role Mandate Activity/
Discipline
Commercial Local Individual Individual artistor group member Professional arts Built heritage
Educational Provincial Public Key individualor leader Community arts Heritage
society
Government Federal Private Informalassociation
Arts (pro andcommunity) Museum
Political Co-operative Establishedorganization Heritage Literary
Social Volunteer Institution Social service Media arts
Collective Governmentprogram Advocacy Theatre
Culturalindustry Recreation Music
Tourism Dance
Aboriginal Visual arts
Youth Research
Seniors Literacy
Diversity
Environment
Function Denition of function
Producer Producer of original work, e.g., dance or theatre company, artist
Presenter Presenter of work or shows, e.g., impresario, festival, gallery
Facility Production facility, e.g., studio
Venue Presentation venue, e.g., auditorium, hall, gallery
Funder Public or private source of grants
Administration Administrative and research support
Association Association of artists or members of a demographic group
Service Service organization
Development Social development organization
Educator Educational institution or group
Promoter Publicity and promotion
Media Communications media
Data Categories – ExamplesMany of these can be applied to either groups or individuals
APPEndIx c: t

8/8/2019 Cultural Mapping Toolkit
http://slidepdf.com/reader/full/cultural-mapping-toolkit 80/94

8/8/2019 Cultural Mapping Toolkit
http://slidepdf.com/reader/full/cultural-mapping-toolkit 81/94
PAG
V e n u e s – U s a g e ( b y d i s c i p l i n e )
R e c o r d I D
O r g a n i z a t i o n N a m e
D i s c i p l i n e
F u n c t i o n A
F u n c t i o n B
F u n c t i o n C
V e n u e T y p e
S
e a t s
# S h o w s /
Y r
A t t e n d /
Y r
C l i e n t A
C l i e n t B
C l i e n t C
2 4
2 0 2
B o y a n U k r a i n i a n D a n
c e A s s o c i a t i o n
D a n c e
P r o d u c e r
A s s o c i a t i o n
3 4
2 1 3
V e s n a F e s t i v a l I n c o r p o r a t e d
D a n c e
P r e s e n t e r
5
1 0 0 5
D e l t a B e s s b o r o u g h H
o t e l
M u l t i p l e
F a c i l i t y
V e n u e
H a l l s ,
M e e t i n g s
3
0 - 5 0 0
1 2
1 , 5 0 0
C o m m u n i t y
L i t e r a r y
A s s o c i a t i o n s
4 1
4 0 2
H e r i t a g e F e s t i v a l o f S
a s k a t o o n I n c .
H e r i t a g e
s o c i e t y
P r e s e n t e r
4 2
4 0 3
S a s k a t o o n H e r i t a g e S
o c i e t y
H e r i t a g e
s o c i e t y
A s s o c i a t i o n
4 7
5 0 3
S a g e H i l l W r i t i n g E x p
e r i e n c e
L i t e r a r y
E d u c a t o r
P r e s e n t e r
5 2
5 0 8
T h i s t l e d o w n P r e s s L t d .
L i t e r a r y
P r e s e n t e r
5 5
6 0 3
F L I C K S F i l m F e s t i v a l
M e d i a
a r t s
P r e s e n t e r
5 7
7 0 1
p a v e d A r t & N e w M e
d i a
M e d i a
a r t s
F a c i l i t y
P r e s e n t e r
V e n u e
G a l l e r y , H a l l 1
5 0
1 0
5 0 0
O w n
p r o g r a m s
M e d i a e v e n t s
L i t e r a r y
1
1 0 0 1
B r o a d w a y T h e a t r e
M u l t i p l e
P r e s e n t e r
V e n u e
A u d i t o r i u m
3
5 0
3 6
2 0 , 0 0 0
O w n l m
p r o g r a m s
M u s i c t o u r s
F r i n g e
t h e a t r e
6
1 0 0 6
F a s t C o n s u l t i n g
M u l t i p l e
A d m i n
7
1 0 0 7
G a b r i e l D u m o n t I n s t i t u t e
M u l t i p l e
E d u c a t o r
8
1 0 0 8
G l o b a l G a t h e r i n g P l a c e
M u l t i p l e
D e v e l o p m e n t
1 2
1 0 1 2
N o r t h e r n S a s k . I n t e r n a t i o n a l
C h i l d r e n ’ s F e s t i v a l
M u l t i p l e
P r e s e n t e r
1 7
1 0 1 7
S a s k a t o o n F o u n d a t i o
n
M u l t i p l e
F u n d e r
1 9
1 0 1 9
S a s k a t o o n T r i b a l C o u
n c i l
M u l t i p l e
P r e s e n t e r
E d u c a t o r
2 0
1 0 2 0
R e n e r y A r t s & S p i r i t C e n t r e
M u l t i p l e
V e n u e
F a c i l i t y
T h e a t r e ,
G a l l e r y
1
0 0
2 5
7 , 5 0 0
I n d i e t h e a t r
e
W o m e n ’ s
f e s t i v a l
Y o g a c l a s s e s
2 1
1 0 2 1
T o u r i s m S a s k a t o o n
M u l t i p l e
P r o m o t e r
3 9
4 0 1
D i e f e n b a k e r C a n a d a
C e n t r e
M u s e u m
V e n u e
G a l l e r y
4
6 , 0 0 0
O w n e x h i b i t s
T o u r i n g
s h o w s
L e c t u r e s
4 4
4 0 5
W e s t e r n D e v e l o p m e n
t M u s e u m
M u s e u m
V e n u e
H a l l
3
0 0
3
1 5 , 0 0 0
O w n e x h i b i t s
H e r i t a g e
F e s t i v a l
I n d i e t h e a t r e
7 0
8 1 2
S a s k a t o o n J a z z S o c i e t y
M u s i c
P r e s e n t e r
V e n u e
C l u b
1
0 0
3 5
2 , 5 0 0
M u s i c t o u r s
L o c a l
m u s i c i a n s
J a z z F e s t
7 4
8 1 6
S a s k a t o o n S y m p h o n y
S o c i e t y
M u s i c
P r o d u c e r
8 1
9 0 1
2 5 t h S t r e e t T h e a t r e
T h e a t r e
P r e s e n t e r
2
1 0 0 2
B r o a d w a y T h e a t r e Y o
u t h S e r i e s
T h e a t r e
P r e s e n t e r
8 3
9 0 3
L a T r o u p e d u J o u r
T h e a t r e
P r o d u c e r
E d u c a t o r
8 5
9 0 5
S a s k a t c h e w a n N a t i v e
T h e a t r e
C o m p a n y I n c .
T h e a t r e
P r o d u c e r
E d u c a t o r
V e n u e
B l a c k b o x ,
H a l l
1
5 0
8
5 , 0 0 0
O w n
p r o g r a m s
C o m m u n i t y
L a u n c h e s
9 2
1 0 4
A K A G a l l e r y
V i s u a l
P r e s e n t e r
V e n u e
G a l l e r y
N
/ A
1 0
5 0 0
O w n
p r o g r a m s
T o u r i n g
s h o w s
1 0 0
1 1 2
C i t y H a l l T e m p o r a r y S c u l p t u r e
P l a c e m e n t
V i s u a l
V e n u e
S t r e e t s p a c e N
/ A
1 2
P u b l i c
I n d i v i d u a l
a r t i s t s
1 0 6
1 1 9
L e i s u r e l a n d A r t i s t S t u d i o s
V i s u a l
F a c i l i t y
9 0
1 0 2
M e e w a s i n V a l l e y A u t h
o r i t y
V i s u a l
A d m i n
V e n u e
R i v e r s i d e
N
/ A
1 0
P u b l i c
P u b l i c a r t
1 0 7
1 2 0
M e n d e l A r t G a l l e r y
V i s u a l
V e n u e
E d u c a t o r
G a l l e r i e s ,
H a l l
N
/ A
1 2
1 7 0 , 0 0 0
O w n
p r o g r a m s
T o u r i n g
s h o w s
C o m m u n i t y
APPEndIx c: t

8/8/2019 Cultural Mapping Toolkit
http://slidepdf.com/reader/full/cultural-mapping-toolkit 82/94

8/8/2019 Cultural Mapping Toolkit
http://slidepdf.com/reader/full/cultural-mapping-toolkit 83/94
PAG
Subject Group Data Sought Format Info RequestedInterview
Length
Organizations
- director
- board member
- front-lineworker
Qualitatitveinformation from thesource about principalresources, networks
Personalinterview,focus group
History, structure,function, supportsystems, networks,vision
1-2 HOURS
Key individuals
- leaders
- activists
Comments andoverview onorganizations, principalresources, communitystructure
Personalinterview,focus group
Function, discipline,resources used, needs,vision
1 HOUR
Individuals
- artists
- workers
- users of services or resources
Qualitative andquantitativeinformation onfacilities and resourcesavailable, usage, needs
Survey,attending their meeting
Function, discipline,resources used, needs,gaps
1/2 HOUR
User groupsInformation on rate of usage, access, needs
Survey,getting ontheir meetingagenda
Demographics, reasonsfor use (needs met),rate of usage, meansof access, support
systems
5-10 MINS
General Public Information onlevels of awareness,preferences, usage,questions of access
Survey – self-adminstered or administeredby a projectmember
Demographics, reasonsfor use, rate of usage,preferred means of access
5 MINSMAx.
SUBjECT GROUPSYour approach should probably be different
for each. Following is a summary of
suggestions for structuring your approach.
APPEndIx c: t

8/8/2019 Cultural Mapping Toolkit
http://slidepdf.com/reader/full/cultural-mapping-toolkit 84/94
AGE
ULtURAL MAPPInG tooLKIt: A Parerhip ewee 00 Legaie nw a creaive ciy newrk f caaa
NOTE ON PERMISSION TOUSE SURVEY AND INTERVIEWRESPONSESThe objectives of the mapping project and
the uses of information gathered through
surveys and interviews must be clearly
understood and acceptable to the subjects.
It is helpful to provide interviewers with a
brief written summary of these items for
communication to their contacts and to buildthe summary into survey questionnaires
intended for passive distribution.
Particularly in interview situations, there
is the possibility that direct quotes will be
inserted verbatim into the report. Alert the
subjects to this possibility and ask them for
their permission to use their contribution,
if it is to be attributed to them. The
request for permission can be built into the
survey and interview format as a standard
declaration. At that point you might also
assure informants that you will let them
know if you quote them, in what context,
and how the quote will be attributed. You
can perform that follow-up once the report
has been drafted.
SAMPLE DECLARATION –QUOTING INTERVIEW MATERIAL
I hereby consent to have the information
I contribute and comments I make in
the context of the (title of project)
process directly attributed to me in
any report that may result. (Signature)
OR
I prefer to remain anonymous.Any information or comments I
contribute in the context of the
(title of project) process are not
to be attributed directly to me in
any report that may result.
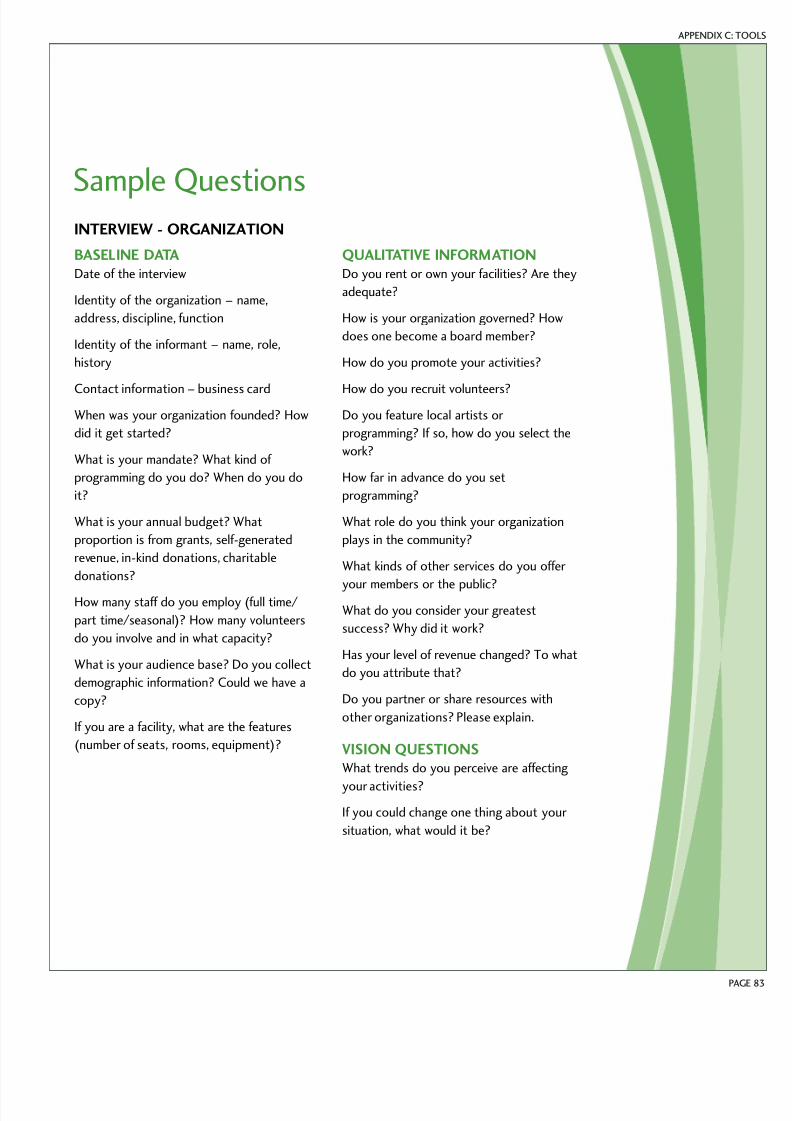
8/8/2019 Cultural Mapping Toolkit
http://slidepdf.com/reader/full/cultural-mapping-toolkit 85/94
PAG
INTERVIEW - ORGANIzATION
BASELINE DATADate of the interview
Identity of the organization – name,
address, discipline, function
Identity of the informant – name, role,
history
Contact information – business cardWhen was your organization founded? How
did it get started?
What is your mandate? What kind of
programming do you do? When do you do
it?
What is your annual budget? What
proportion is from grants, self-generated
revenue, in-kind donations, charitable
donations?
How many staff do you employ (full time/
part time/seasonal)? How many volunteers
do you involve and in what capacity?
What is your audience base? Do you collect
demographic information? Could we have a
copy?
If you are a facility, what are the features
(number of seats, rooms, equipment)?
QUALITATIVE INFORMATIONDo you rent or own your facilities? Are they
adequate?
How is your organization governed? How
does one become a board member?
How do you promote your activities?
How do you recruit volunteers?Do you feature local artists or
programming? If so, how do you select the
work?
How far in advance do you set
programming?
What role do you think your organization
plays in the community?
What kinds of other services do you offer
your members or the public?What do you consider your greatest
success? Why did it work?
Has your level of revenue changed? To what
do you attribute that?
Do you partner or share resources with
other organizations? Please explain.
VISION QUESTIONSWhat trends do you perceive are affecting
your activities?
If you could change one thing about your
situation, what would it be?
Sample Questions
APPEndIx c: t

8/8/2019 Cultural Mapping Toolkit
http://slidepdf.com/reader/full/cultural-mapping-toolkit 86/94
AGE
ULtURAL MAPPInG tooLKIt: A Parerhip ewee 00 Legaie nw a creaive ciy newrk f caaa
INTERVIEW - KEY INDIVIDUAL
BASELINE DATADate of interview
Identity of the informant – name, role,
function, background
CONTACT INFORMATIONHave you been active in the community for
very long? What got you started?What is your current involvement? For
example, do you participate in interdisciplinary
or intersectoral groups? Do you teach?
QUALITATIVE INFORMATIONWhat do you consider to be your greatest
contribution to this community?
What do you consider to be the greatest
contribution of the community to your
situation?
What kinds of facilities or resources do you
use in your personal work / in your work
with the community?
What do you see as the strengths of
your community?
What networks do you participate in or rely
on to share information or resources?
VISION QUESTIONS
What needs are not being met?
What trends do you perceive that are
affecting your community?
If you could change one thing about the
situation, what would it be?
Who or what do you consider to be
the prime movers or engines of change
in the community?
SURVEY – INDIVIDUAL ARTIST,WORKER OR USER OF RESOURCES
BASELINE DATADate completed
Identity – Name (optional), role, discipline
or activity, training, association or group
Contact information – e-mail, telephone
(optional)
QUANTITATIVE INFORMATIONHow long have you been a member of this
community/association/organization?
What community resources or facilities do
you regularly use?
How often do you use them?
QUALITATIVE INFORMATIONAre the resources adequate to your needs?
Are they accessible and available?
What do you consider to be the strengths
of your community or group?
What unmet needs do you have as a worker/
community member/artist?
Additional comments?

8/8/2019 Cultural Mapping Toolkit
http://slidepdf.com/reader/full/cultural-mapping-toolkit 87/94
PAG
SURVEY –USER GROUP MEMBERS
BASELINE DATADate completed and location
Identity of informant – role, demographic,
neighbourhood
Identity of the organization, association
or resource – function, discipline/
activity, mandate
QUANTITATIVE INFORMATIONHow long have you been a member of this
community/association/organization?
Why do you belong to this group? /
Why do you use this community resource
or facility?
How often do you use it?
Do you nd it satisfactory or not?
Have you checked out other, similar
resources?
Is it easy or difcult to gain access?
What makes it easy or difcult –
price, transportation, parking, disability,
personal reasons?
Additional comments?
SURVEY – GENERAL PUBLIC
BASELINE DATADate completed and location
Identity – demographics, residency,
neighbourhood
QUANTITATIVE INFORMATIONWhat community resources or facilities do
you regularly use? / Which of the followingresources do you use?
Why do you use them/it?
How often do you use them/it?
How did you hear or nd out about them/it?
Do you nd them/it satisfactory or not?
Is it easy or difcult to gain access?
What makes it easy or difcult – price,
transportation, parking, disability,
personal reasons?
Do you know about this other, similar
resource? How did you hear about it?
Additional comments?
APPEndIx c: t
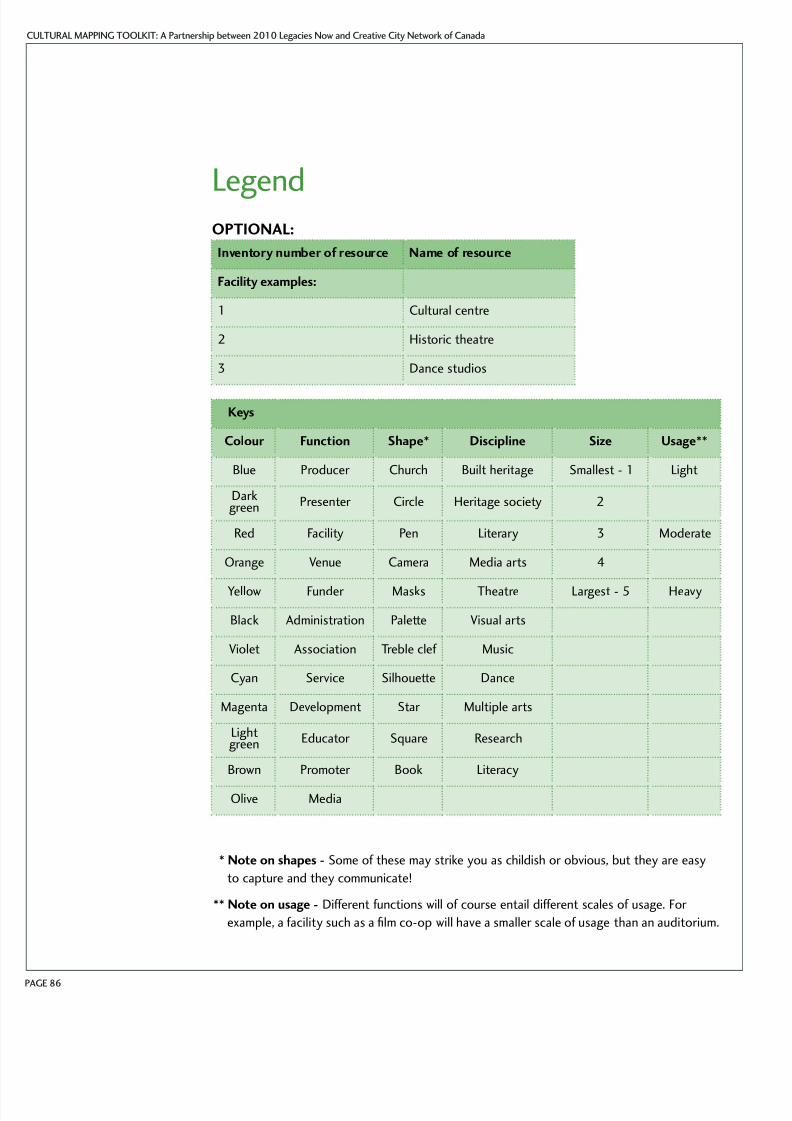
8/8/2019 Cultural Mapping Toolkit
http://slidepdf.com/reader/full/cultural-mapping-toolkit 88/94
AGE
ULtURAL MAPPInG tooLKIt: A Parerhip ewee 00 Legaie nw a creaive ciy newrk f caaa
OPTIONAL:
Inventory number of resource Name of resource
Facility eamples:
1 Cultural centre
2 Historic theatre
3 Dance studios
Keys
Colour Function Shape* Discipline Sie Usage**
Blue Producer Church Built heritage Smallest - 1 Light
Darkgreen Presenter Circle Heritage society 2
Red Facility Pen Literary 3 Moderate
Orange Venue Camera Media arts 4
Yellow Funder Masks Theatre Largest - 5 Heavy
Black Administration Palette Visual arts
Violet Association Treble clef Music
Cyan Service Silhouette Dance
Magenta Development Star Multiple arts
Lightgreen Educator Square Research
Brown Promoter Book Literacy
Olive Media
* Note on shapes - Some of these may strike you as childish or obvious, but they are easy
to capture and they communicate!
** Note on usage - Different functions will of course entail different scales of usage. For
example, a facility such as a lm co-op will have a smaller scale of usage than an auditorium.
Legend
8/8/2019 Cultural Mapping Toolkit
http://slidepdf.com/reader/full/cultural-mapping-toolkit 89/94

8/8/2019 Cultural Mapping Toolkit
http://slidepdf.com/reader/full/cultural-mapping-toolkit 90/94
AGE
ULtURAL MAPPInG tooLKIt: A Parerhip ewee 00 Legaie nw a creaive ciy newrk f caaa
1. Eecutive Summary
• project objectives – background
• scope of the project
• summary of ndings and conclusions
• introduce map or website
• summary of recommendations
2. Obectives and Rationale
3. Cultural Mapping Eercise
• denition and use of cultural mapping
• parameters for the current exercise
• population studied
• terminology
• community participation and input
• data collection methods – surveys,
interviews, focus groups, meetings
4. Findings and Conclusions
• primary outcomes – central question
– ndings
• secondary outcomes – unanticipated
ndings
• conclusions from ndings
5. Epression of Findings
• design of map or website
• description of relationships
6. Recommendations
• based on conclusions
APPENDICES
- results of initial community meetings
- survey and interview materials – sample
questionnaires
- results of surveys and interviews
- proles of and comments by informants
- inventory grid(s)
- GIS or site map
Report OutlinePlease note that this is an example only, to get you started.
8/8/2019 Cultural Mapping Toolkit
http://slidepdf.com/reader/full/cultural-mapping-toolkit 91/94
PAG
APPEndIx d: REFERE
Appendix D:
References

8/8/2019 Cultural Mapping Toolkit
http://slidepdf.com/reader/full/cultural-mapping-toolkit 92/94
PAG
CITED IN THE TExT
City of Toronto Division of Economic
Development, Culture and Tourism. (2003).
A Map of Toronto’s Cultural Facilities.
Toronto: City of Toronto.
Clark, I., Sutherland, J., & Young, G. (1995).
Mapping Culture: A Guide for Cultural and
Economic Development in Communities.
Canberra: AGPS.
Harmon, Katherine. (2004). You Are Here:
Personal Geographies and Other Maps
of the Imagination. New York: Princeton
Architectural Press.
Martin, Joanne. (2002). Organizational
Culture: Mapping the Terrain. Thousand
Oaks, CA: Sage Publications, Foundation for
Organizational Science.
Radbourne, Jennifer. (Winter 2001).
Full House Theory: A New Theory for
Assessing Demand for Arts Centers. Journal
of Arts Management, Law and Society, 30 (4),
254-268.
United Nations Educational, Scientic and
Cultural Organization. (No Date). Cultural
Mapping. Paris: UNESCO.
Wood, Denis. (1992). The Power of Maps.
New York: The Guildford Press.
Young, Greg. (December 2003).Cultural Mapping in a Global World. A
keynote speech at the ASEAN Committee
on Culture and Information (COCI).
Adelaide, South Australian: Cultural
Mapping Symposium & Workshop.
www.fbe.unsw.edu.au/news/2004/14/1.pdf
OTHER INTERESTINGINFORMATION
UNESCO Bangkok – Cultural Mapping
www.unescobkk.org/inde.php?id=2536
ACT (Australian Capital Territory)
Government – Arts, Culture and Heritage
– Cultural Maps
www.act.gov.au/CAP/accesspoint/
sp?action=menuHome
Thurrock Council, UK –
Thames Gateway Project
www.visionarythurrock.org.uk/docs/
home/outcomes.html
Deborah Mills – Cultural Planning –
Policy Task, not Tool
www.ccd.net/pdf/art55_cultural_
planning.pdf
Vancouver Culture Guide
http://powerofdesign.aiga.org/
cultureguide/ash_content/inde.html
The University of Illinois at Urbana-
Champaign. (2005). Mapping Cultural
and Network Assets in Three Chicago
Communities.
http://sonic.ncsa.uiuc.edu/Nosh/
eternalfunded/Rockefeller.pdf
NSW Ministry for the Arts & Department
of Local Government – Cultural Planning
Guidelines for Local Government.
www.arts.nsw.gov.au/WhatsNew/CPG.htm
APPEndIx d: REFERE

8/8/2019 Cultural Mapping Toolkit
http://slidepdf.com/reader/full/cultural-mapping-toolkit 93/94
SUE STEWART
Sue Stewart has worked in arts administration and cultural delvelopment for over 20 years. She
grew up bilingual in Québec and studied literature, communications and translation in Canada
and the US. She exercised her language skills in literary publishing and theatre before becoming
a cultural administrator in municipal and federal government. Promoting the interests of minority-
language, diverse and artist-run groups has given her a grounding in local community dynamics,
and working with the Canada Council for the Arts brought a national perspective. As the Arts
Consultant for the City of Saskatoon, she conducted a pilot study on municipal cultural mappingwith the Saskatchewan Arts Board and the Manitoba Arts Council.
2010 LEGACIES NOW
2010 Legacies Now is a not-for-prot society that works in partnership with community
organizations, non-government organizations (NGOs), the private sector and all levels of
government to develop sustainable legacies in sport & recreation, arts, literacy, and volunteerism.
2010 Legacies Now actively assists communities discover and create unique and inclusive social
and economic opportunities leading up to and beyond the 2010 Olympic and Paralympic Winter Games. For more information, visit www.2010Legaciesnow.com.
CREATIVE CITY NETWORK OF CANADA
Transforming Communities Through Culture
The Creative City Network of Canada/Réseau des villes créatives du Canada (CCN) is a
national non-prot organization that operates as a knowledge-sharing, research, public
education, and professional development resource in the eld of local cultural policy, planning
and practice.
Through its work, the Creative City Network helps build the capacity of local cultural planning
professionals – and by extension local governments – to nurture and support cultural
development in their communities. By doing so, the Creative City Network aims to improve
the operating climate and conditions for artists and arts and cultural organizations across the
country, and the quality of life in Canadian communities of all sizes.
The members of the Creative City Network are local governments across Canada.
More information is available at www.creativecity.ca

8/8/2019 Cultural Mapping Toolkit
http://slidepdf.com/reader/full/cultural-mapping-toolkit 94/94