Diffusion of Innovations: Theoretical Perspectives and Future Prospects of Diffusion Studies
Chapter 17
Cultural eutrophication: perspectivesand prospects
Paul WassmannNorwegian College of Fishery ScienceUniversity of TromsøN-9037 Tromsø, [email protected]
17.1 History of cultural eu-trophication
Cultural eutrophication is old as Homo sapiens. Inparticular after the introduction of agriculture andlarger settlements eutrophication has been mansfaithful companion. During the pre-agriculturalhunting and picking stage only probably a cou-ple million humans inhabited the world and cul-tural eutrophication was negligible. The 3 ordersof magnitude increase in population has changedthis considerably. Human population growth andmans present existence is entirely based upon thedevelopment and efficiency of agriculture. Seafood
delivers only a small percentage of human foodword wide (see Chapter 15). A consequence ofthe increased population (based on agriculture)has been large-scale cultural eutrophication. Thisprocess has accompanied all major civilisations.Mesopotamia, the Golden Crescent, the Mediter-ranean cultures, central Europe, North Americaand China all have been affected/suffered from theeffects of cultural eutrophication. Some of us maydream about the good old times of the Middle ageswhen man lived closer to nature, when the wordappeared to be ‘greener’ than today and when lifewas more ‘natural’. This view is based on a mis-understanding. The present eutrophication of theBaltic and North Sea was preceded by similar oreven worse eutrophication periods caused by log-ging and the introduction of large-scale agriculturein Europe. Medieval cities were probably not onlyunsanitary, but contaminated by organic wastes,nutrients and heavy metals. The cultural eutroph-ication in major cities must have been immense,far beyond today’s imagination. A good exam-ple of the ambience of Paris in medieval times isportrayed in Patrick Suesskinds novel ‘Perfume’.Cultural eutrophication is thus not a recent phe-nomenon. It has continuously accompanied mansexistence in variable degrees. Locally cultural eu-trophication can have been far more significantthan today.
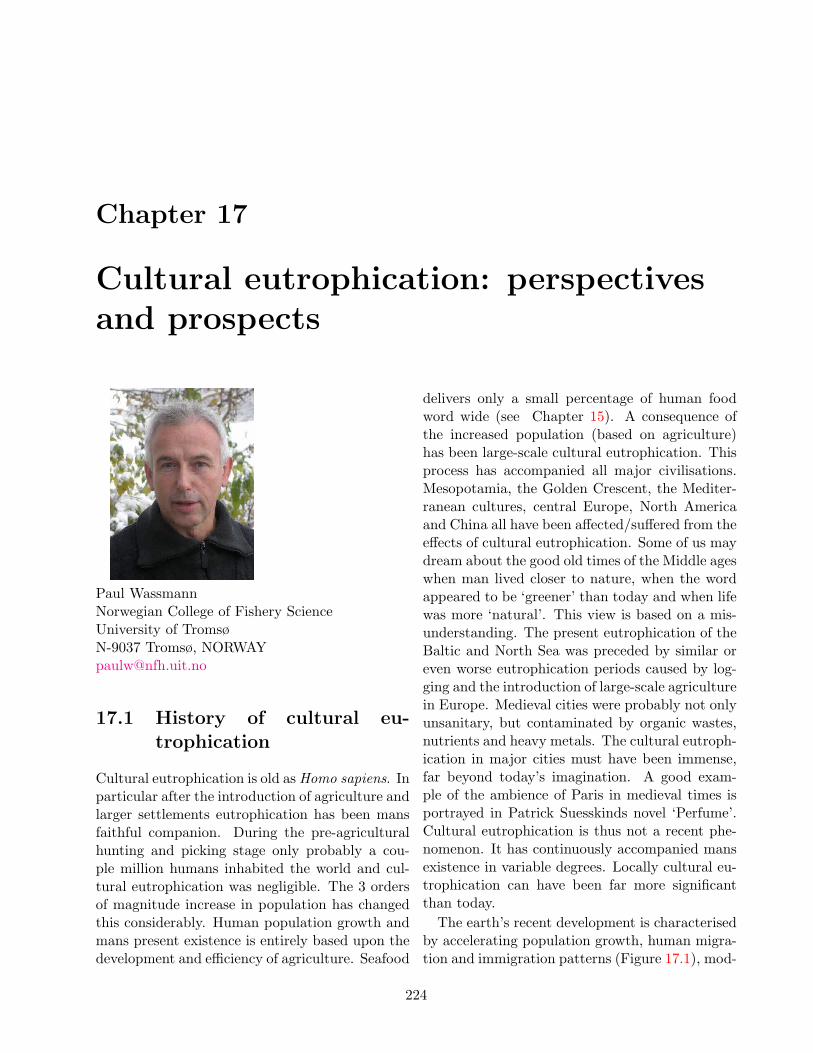
The earth’s recent development is characterisedby accelerating population growth, human migra-tion and immigration patterns (Figure 17.1), mod-
224
17.1. HISTORY 225
Figure 17.1: Upper panel. Population in 1990 (persons km-2). Lerner et al. 1988; updated to 1990 by Bouwman,based on U.N. statistics. Lower panel. Nitrogen fertilizer use in 1990 (kg N km-2 y-1). Bouwman et al. (1995) andFAO statistics. Remark the high fertilizer application in north-eastern North America and central Europe that is notaccompanied by high population density. In the case of India and China the population density is high, but the fertilizerapplication is moderate. In Africa and South America the application of fertilizers is low relative to the populationdensity.
226 CHAPTER 17. CULTURAL EUTROPHICATION: PERSPECTIVES AND PROSPECTS
ern agriculture and fundamental changes in nutri-ent and water cycles. Cultural eutrophication hasbecome a global issue, in particular due to inter-ference with the local and regional nutrient andwater cycles. Substantial amounts of nutrients aredischarged into rivers, lakes and estuaries. Theyreach the ocean more and more rapidly. Eutroph-ication is thus, in general, highest in the estuariesas nutrient concentration and population densityincreases along the rivers pathway from the inte-rior to the coastal zone.
Many industrialised countries import not onlyfertilisers but also nutrients in the form of food.Often they even import the limited resource wa-ter in the form of food. For example, 1 kg ofwheat demands 1 m3 of water; 1 kg of rice needs2 m3 of water while 1 kg of beef requires 10 m3
of water. Densely populated countries that havethe financial means to buy food from outside, e.g.the Netherlands with plenty of water, is a large-scale importer of water. Thus not only nutrientsand biomass are moved over long distances, con-nections between otherwise separated ecosystem,biogeochemical cycles and resource-limited soci-eties are established. Many of the most devel-oped countries are net-importers of nutrients, inparticular nitrogen. The nitrogen supply can beseveral times greater than the natural standingstock, and that inevitably results in eutrophica-tion. Resources from obviously resource-limitedregions (food, water, and fertilisers) are deviatedinto resource-rich ones. However, here they cancause large-scale eutrophication.
The focal point of cultural eutrophication is thefundamental changes in cycling of carbon, nutri-ents and water. The recirculation inside smallregion that was characteristic for the ecologicalsetting in earlier days when the means of trans-portation were limited, is changed and the nutri-ent and water circles are first opened (i.e. thenatural space and times scales are exceeded) andsubsequently widened to global scales. Due tothis the biogeochemical cycles are significantlychanged. Stored carbon (coal, oil, gas, wood, soil)are reassigned with the consequence that the at-mospheric CO2 concentration has increased from
Perc
en
tag
e I
ncre
ase
(re
lative
to 1
90
0 le
vels
) 100
80
60
40
20
01900 1920 1940 1960 1980 2000
Global Nitrogen Fixation
Atmospheric CO2
Year
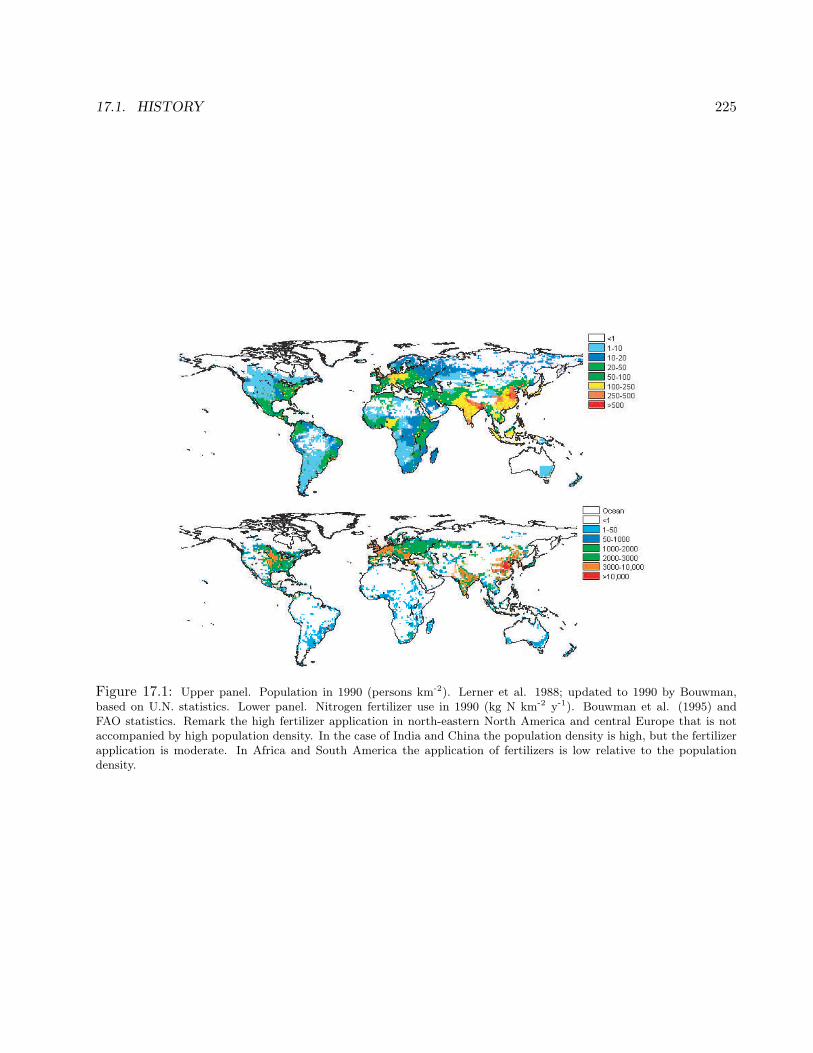
Figure 17.2: The relative change in nitrogen fixationcaused by human activities globally compared to the rel-ative increase in carbon dioxide in the atmosphere since1900. Note that humans are having greater influence on ni-trogen availability than they are on the production of car-bon dioxide, an important greenhouse gas (modified fromVitousek et al. 1997).
240 to 380 ppm since the industrial revolution(Figure 17.2). We move phosphorus in the formof apatite from the Kola Peninsula to cover theworlds needs for phosphate. We fix nitrogen gasfrom the atmosphere in similar amounts than ni-trogen fixers (Figure 17.2). We dam and channelrivers, change their discharge patterns and focussewage into sewers. By fracturing existing bio-geochemical and water cycles we change the origi-nal cycling, introducing a new, global cycling pat-tern that changes the overall functioning of theglobe. Despite that nutrient discharge can be min-imised by effective management in the drainagearea, losses inevitably occur. Human populationgrowth, altering global biogeochemical cycles, andincreased eutrophication are therefore two aspectsof the same cause.
17.2 Cultural eutrophica-tion: regions, ecosystems,changes and organisms
An important concept for cultural eutrophicationis the residence time of nutrients in the recip-ient. Low water exchange results in high resi-
17.2. CULTURAL EUTROPHICATION 227
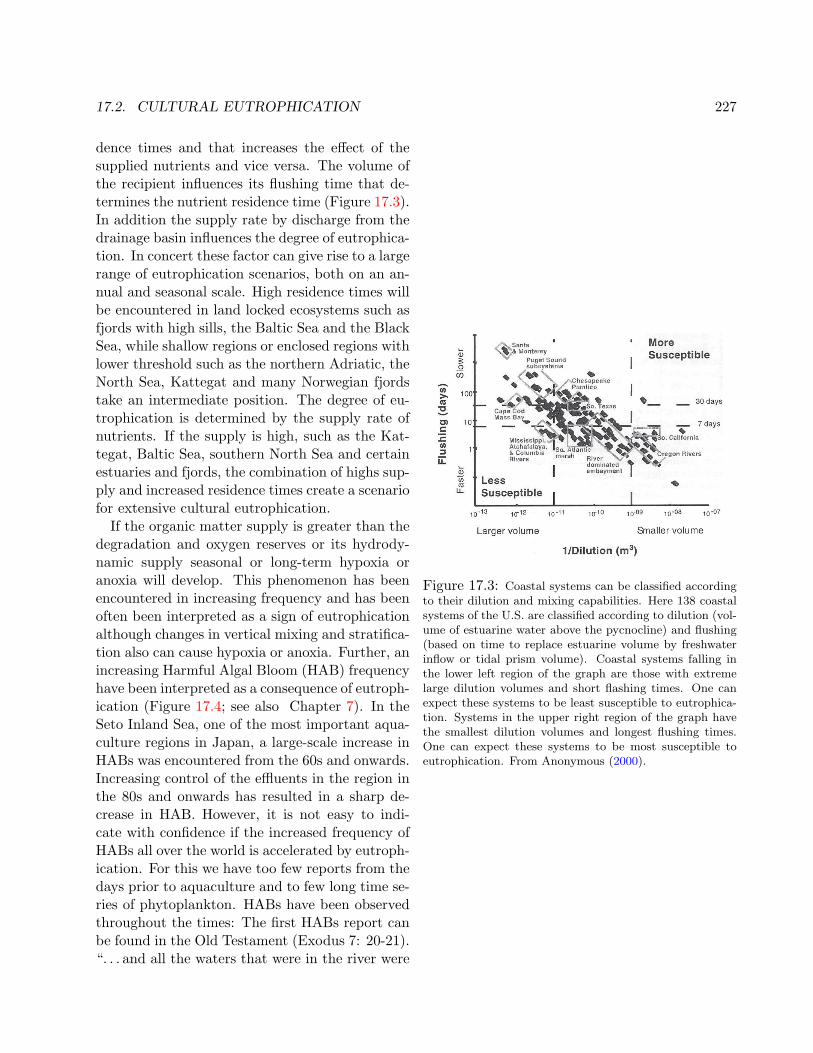
dence times and that increases the effect of thesupplied nutrients and vice versa. The volume ofthe recipient influences its flushing time that de-termines the nutrient residence time (Figure 17.3).In addition the supply rate by discharge from thedrainage basin influences the degree of eutrophica-tion. In concert these factor can give rise to a largerange of eutrophication scenarios, both on an an-nual and seasonal scale. High residence times willbe encountered in land locked ecosystems such asfjords with high sills, the Baltic Sea and the BlackSea, while shallow regions or enclosed regions withlower threshold such as the northern Adriatic, theNorth Sea, Kattegat and many Norwegian fjordstake an intermediate position. The degree of eu-trophication is determined by the supply rate ofnutrients. If the supply is high, such as the Kat-tegat, Baltic Sea, southern North Sea and certainestuaries and fjords, the combination of highs sup-ply and increased residence times create a scenariofor extensive cultural eutrophication.
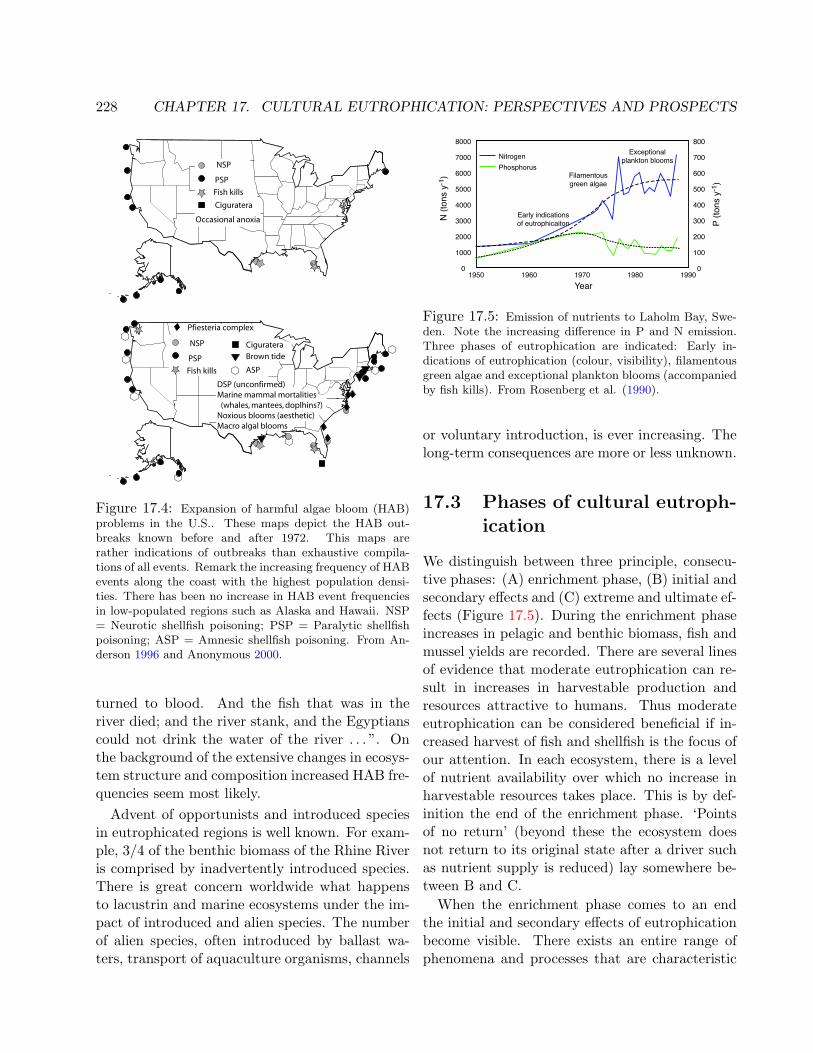
If the organic matter supply is greater than thedegradation and oxygen reserves or its hydrody-namic supply seasonal or long-term hypoxia oranoxia will develop. This phenomenon has beenencountered in increasing frequency and has beenoften been interpreted as a sign of eutrophicationalthough changes in vertical mixing and stratifica-tion also can cause hypoxia or anoxia. Further, anincreasing Harmful Algal Bloom (HAB) frequencyhave been interpreted as a consequence of eutroph-ication (Figure 17.4; see also Chapter 7). In theSeto Inland Sea, one of the most important aqua-culture regions in Japan, a large-scale increase inHABs was encountered from the 60s and onwards.Increasing control of the effluents in the region inthe 80s and onwards has resulted in a sharp de-crease in HAB. However, it is not easy to indi-cate with confidence if the increased frequency ofHABs all over the world is accelerated by eutroph-ication. For this we have too few reports from thedays prior to aquaculture and to few long time se-ries of phytoplankton. HABs have been observedthroughout the times: The first HABs report canbe found in the Old Testament (Exodus 7: 20-21).“. . . and all the waters that were in the river were
Figure 17.3: Coastal systems can be classified accordingto their dilution and mixing capabilities. Here 138 coastalsystems of the U.S. are classified according to dilution (vol-ume of estuarine water above the pycnocline) and flushing(based on time to replace estuarine volume by freshwaterinflow or tidal prism volume). Coastal systems falling inthe lower left region of the graph are those with extremelarge dilution volumes and short flashing times. One canexpect these systems to be least susceptible to eutrophica-tion. Systems in the upper right region of the graph havethe smallest dilution volumes and longest flushing times.One can expect these systems to be most susceptible toeutrophication. From Anonymous (2000).
228 CHAPTER 17. CULTURAL EUTROPHICATION: PERSPECTIVES AND PROSPECTS
NSP
PSP
Fish kills
Ciguratera
Occasional anoxia
DSP (unconfirmed)
Marine mammal mortalities
(whales, mantees, doplhins?)
Noxious blooms (aesthetic)
Macro algal blooms
NSP
PSP
Fish kills
Ciguratera
Pfiesteria complex
Brown tide
ASP
Figure 17.4: Expansion of harmful algae bloom (HAB)problems in the U.S.. These maps depict the HAB out-breaks known before and after 1972. This maps arerather indications of outbreaks than exhaustive compila-tions of all events. Remark the increasing frequency of HABevents along the coast with the highest population densi-ties. There has been no increase in HAB event frequenciesin low-populated regions such as Alaska and Hawaii. NSP= Neurotic shellfish poisoning; PSP = Paralytic shellfishpoisoning; ASP = Amnesic shellfish poisoning. From An-derson 1996 and Anonymous 2000.
turned to blood. And the fish that was in theriver died; and the river stank, and the Egyptianscould not drink the water of the river . . . ”. Onthe background of the extensive changes in ecosys-tem structure and composition increased HAB fre-quencies seem most likely.
Advent of opportunists and introduced speciesin eutrophicated regions is well known. For exam-ple, 3/4 of the benthic biomass of the Rhine Riveris comprised by inadvertently introduced species.There is great concern worldwide what happensto lacustrin and marine ecosystems under the im-pact of introduced and alien species. The numberof alien species, often introduced by ballast wa-ters, transport of aquaculture organisms, channels
8000
7000
6000
5000
4000
3000
2000
1000
0
800
700
600
500
400
300
200
100
01950 1960 1970 1980 1990
Year
N (
tons y
-1)
P (
tons y
-1)
Exceptional
plankton blooms
Filamentous
green algae
Early indications
of eutrophicaiton
Nitrogen
Phosphorus
Figure 17.5: Emission of nutrients to Laholm Bay, Swe-den. Note the increasing difference in P and N emission.Three phases of eutrophication are indicated: Early in-dications of eutrophication (colour, visibility), filamentousgreen algae and exceptional plankton blooms (accompaniedby fish kills). From Rosenberg et al. (1990).
or voluntary introduction, is ever increasing. Thelong-term consequences are more or less unknown.
17.3 Phases of cultural eutroph-ication
We distinguish between three principle, consecu-tive phases: (A) enrichment phase, (B) initial andsecondary effects and (C) extreme and ultimate ef-fects (Figure 17.5). During the enrichment phaseincreases in pelagic and benthic biomass, fish andmussel yields are recorded. There are several linesof evidence that moderate eutrophication can re-sult in increases in harvestable production andresources attractive to humans. Thus moderateeutrophication can be considered beneficial if in-creased harvest of fish and shellfish is the focus ofour attention. In each ecosystem, there is a levelof nutrient availability over which no increase inharvestable resources takes place. This is by def-inition the end of the enrichment phase. ‘Pointsof no return’ (beyond these the ecosystem doesnot return to its original state after a driver suchas nutrient supply is reduced) lay somewhere be-tween B and C.
When the enrichment phase comes to an endthe initial and secondary effects of eutrophicationbecome visible. There exists an entire range ofphenomena and processes that are characteristic
17.4. SOURCES 229
for the second phase of eutrophication. We canobserve changes in species composition, e.g. cer-tain benthic algae disappear or certain polychaetsdomiante. Similar processes can be observed forphytoplankton species. In the Southern North Seaextensive blooms of Phaeocystis globosa reflect eu-trophication (see also Chapter 20). Further, theincrease in relative contribution of flagellates tothe phytoplankton biomass is interpreted as a signof eutrophication, reflecting increased N and Psupply while that of Si declines, mainly due to damconstructions (for Si decline see also Chapter 13).Reduction in light penetration caused by increasedbloom density and turbidity decrease the depthof the euphotic zone and reduces the area wherebenthic algae prosper. The increasing frequencyof hypoxic episodes belongs also to the initial andsecondary effects of eutrophication.
The phase of extreme and ultimate effects ischaracterised by the large-scale disappearance ofsensitive species and that opportunists take over.Mass proliferation of benthic algae such as Ulvaand Cladophora are also characteristic for thisstage. Mass mortality and anoxia are the ultimatestage of eutrophication.
17.4 Evaluating the sources ofcultural eutrophication
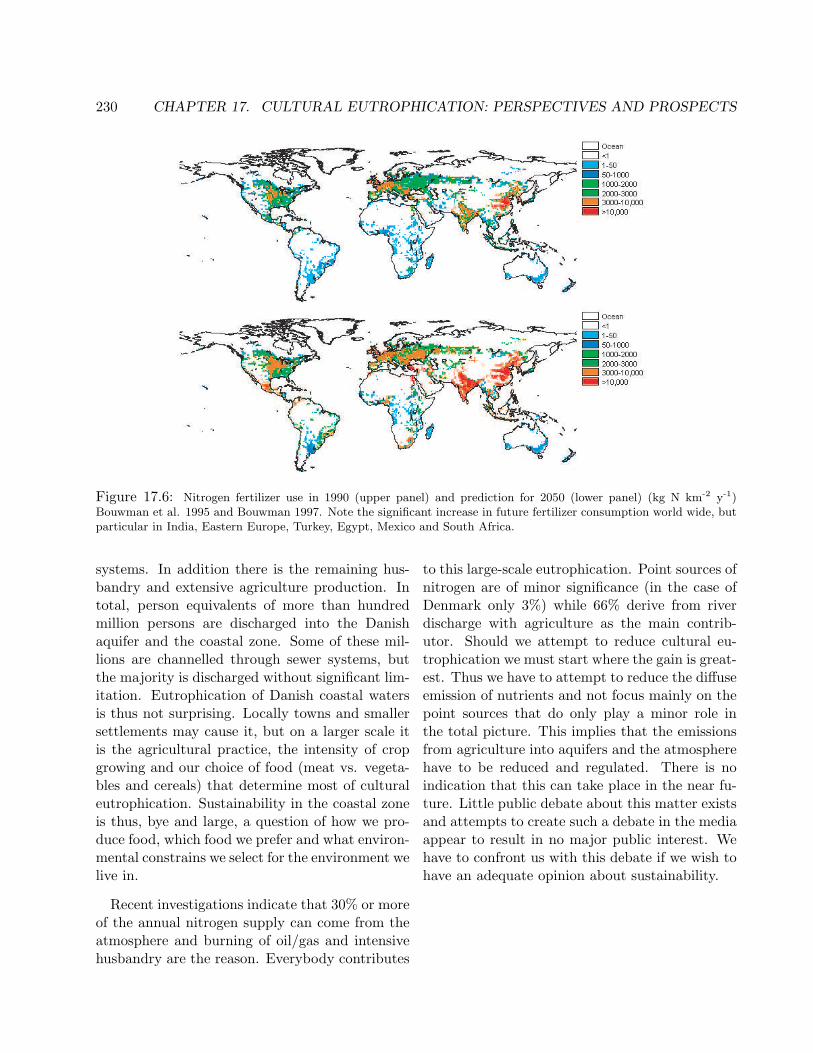
The natural sources of nutrients (streams, lakes,rivers) derived from natural (erosion) and humanactivity. Today the flux of nutrients from theirsources to the coast is strongly influenced by an-thropogenic activities. Human population growthdoes not cease in the near future and in all al-ready high agricultural production regions (suchas the U.S., central Europe, but in particular inIndia and China) the application of fertilizers willin crease (Figure 17.6). In addition, clear-cuttingtrees, drainage of wetlands, fertilising fields andmeadows, intensive husbandry, building dams andtowns, in essence all anthropogenic activities, con-tribute to the prevailing picture of cultural eu-trophication (see Chapter ). Only a small fractionof applied fertilizers ends up in human food while
Landfilled?
Denitrified
(9%)
Human
Consumption
Wastewater
4%
(26%)
Animal
Consumption
45%
Harvested
in crops
(majority
transported)
10%
(10%)
Landfilled?
Leached?
Denitrified?
Building up soil NH3
NH3
2%
100%
(13%)
29%
Leached to water
(Leached to water?)
Field
level65%
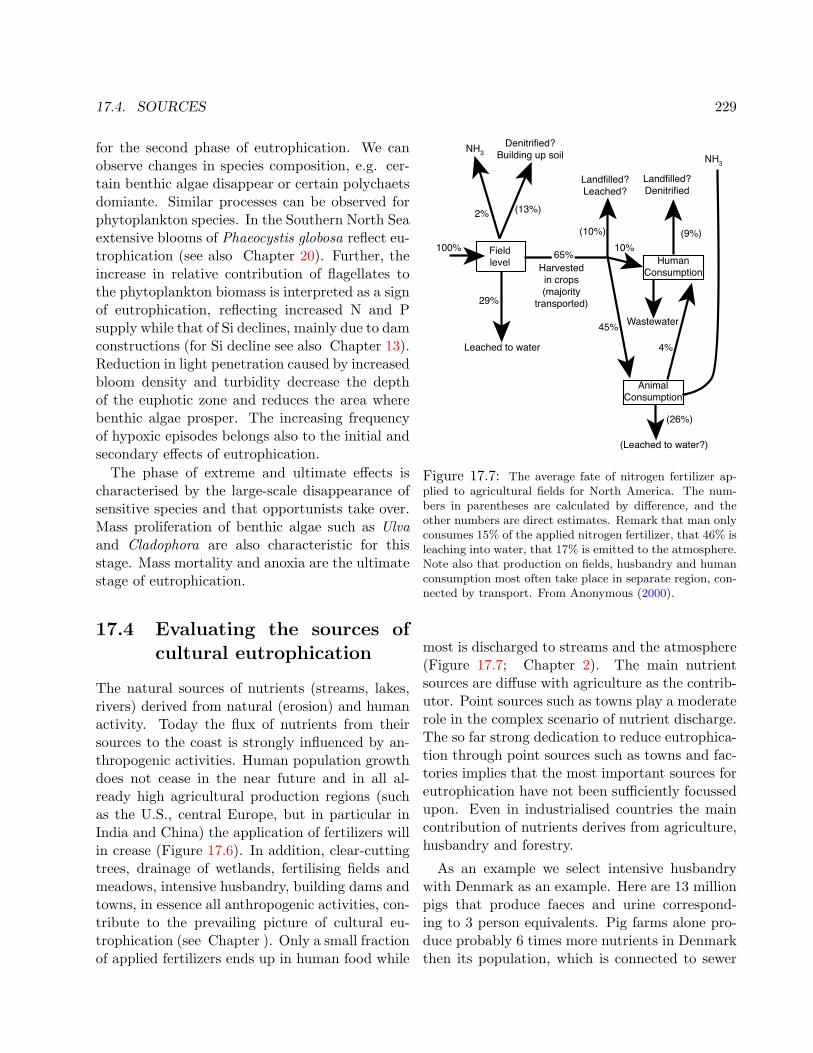
Figure 17.7: The average fate of nitrogen fertilizer ap-plied to agricultural fields for North America. The num-bers in parentheses are calculated by difference, and theother numbers are direct estimates. Remark that man onlyconsumes 15% of the applied nitrogen fertilizer, that 46% isleaching into water, that 17% is emitted to the atmosphere.Note also that production on fields, husbandry and humanconsumption most often take place in separate region, con-nected by transport. From Anonymous (2000).
most is discharged to streams and the atmosphere(Figure 17.7; Chapter 2). The main nutrientsources are diffuse with agriculture as the contrib-utor. Point sources such as towns play a moderaterole in the complex scenario of nutrient discharge.The so far strong dedication to reduce eutrophica-tion through point sources such as towns and fac-tories implies that the most important sources foreutrophication have not been sufficiently focussedupon. Even in industrialised countries the maincontribution of nutrients derives from agriculture,husbandry and forestry.
As an example we select intensive husbandrywith Denmark as an example. Here are 13 millionpigs that produce faeces and urine correspond-ing to 3 person equivalents. Pig farms alone pro-duce probably 6 times more nutrients in Denmarkthen its population, which is connected to sewer
230 CHAPTER 17. CULTURAL EUTROPHICATION: PERSPECTIVES AND PROSPECTS
Figure 17.6: Nitrogen fertilizer use in 1990 (upper panel) and prediction for 2050 (lower panel) (kg N km-2 y-1)Bouwman et al. 1995 and Bouwman 1997. Note the significant increase in future fertilizer consumption world wide, butparticular in India, Eastern Europe, Turkey, Egypt, Mexico and South Africa.
systems. In addition there is the remaining hus-bandry and extensive agriculture production. Intotal, person equivalents of more than hundredmillion persons are discharged into the Danishaquifer and the coastal zone. Some of these mil-lions are channelled through sewer systems, butthe majority is discharged without significant lim-itation. Eutrophication of Danish coastal watersis thus not surprising. Locally towns and smallersettlements may cause it, but on a larger scale itis the agricultural practice, the intensity of cropgrowing and our choice of food (meat vs. vegeta-bles and cereals) that determine most of culturaleutrophication. Sustainability in the coastal zoneis thus, bye and large, a question of how we pro-duce food, which food we prefer and what environ-mental constrains we select for the environment welive in.
Recent investigations indicate that 30% or moreof the annual nitrogen supply can come from theatmosphere and burning of oil/gas and intensivehusbandry are the reason. Everybody contributes
to this large-scale eutrophication. Point sources ofnitrogen are of minor significance (in the case ofDenmark only 3%) while 66% derive from riverdischarge with agriculture as the main contrib-utor. Should we attempt to reduce cultural eu-trophication we must start where the gain is great-est. Thus we have to attempt to reduce the diffuseemission of nutrients and not focus mainly on thepoint sources that do only play a minor role inthe total picture. This implies that the emissionsfrom agriculture into aquifers and the atmospherehave to be reduced and regulated. There is noindication that this can take place in the near fu-ture. Little public debate about this matter existsand attempts to create such a debate in the mediaappear to result in no major public interest. Wehave to confront us with this debate if we wish tohave an adequate opinion about sustainability.
17.6. REMEDIATION OF CULTURAL EUTROPHICATION 231
17.5 An adequate understand-ing of cultural eutrophica-tion
An adequate understanding of eutrophication isfor the moment not effortlessly available. Themain reason for that is the fragmentation of in-terest, education and responsibility. Despite of abasic understanding how nutrients flow throughan aquifer and into the coastal zone, there ex-ist few institutions and composite research groupsthat study the entire route and the involved pro-cesses simultaneously and from a superior perspec-tive. Eutrophication of the coastal zone, freshwa-ter, run-off from forests, agriculture, industry andsewage treatment are usually dealt with by differ-ent scientist and institutions that have few con-tacts. Education of students and scientists is sep-arate too and we have at present not the adequateexpertise and the will that binds the different sec-tors together.
While industry and citizens pay taxes for thedamages of the environment to the costs forsewage treatment plants no such costs are im-posed on the by far main contributor of culturaleutrophication, i.e. agriculture and in certain re-gions forestry. The public focus is directed topoint sources that play only a minor role. Whileindustry and cities give raise to environmentalproblems, the most significant contributors to cul-tural eutrophication are characterised as naturefriendly. Sector thinking prevents holistic solu-tions or accomplishments that are proportionalwith the environmental damage. For an environ-mental impact that has probably a most impor-tant environmental effect (Gesamp, 1991) and oc-curs virtually worldwide, this inadequacy is sur-prising. A public debate that attempts to focusupon the most important global environmentaleffect, that is not characterised by sector inter-est, and that does not hesitate to focus upon thekey problem, is indispensable. Emphasis has tobe given to normal praxis regarding negative en-vironmental impact — i.e. the polluter pays forthe negative environmental effects. The greatest
contributor to cultural eutrophication is exemptedfrom this obligation, probably because the publicis not aware of the full extent of the problem andis afraid to pay more for food. However, food hasbecome a comparatively minor cost in our bud-get. In addition, all industrialised countries sig-nificantly subsidise agriculture. It must be puz-zling that many societies subsidise activities thatcan cause anoxic bottom waters, reduced waterquality, harmful algae blooms, reduced fisheries,prevent aquaculture etc. Obviously a holistic per-spective is needed to solve this apparently incon-vincible dilemma. At the end of the day we all payfor our approach to deal with cultural eutrophi-cation, either through food costs, subsidies, envi-ronmental taxes or a negative development of theenvironment.
Assuming a connection between agriculturesubsidies and increased production, taking noticeof the lack of nutrient discharge appropriate limi-tations from agriculture and husbandry and con-sidering the consequential eutrophication, a con-nection exists between subsidies, demands for in-expensive food, decreased environmental quality,reduced fisheries and increased HAB. Can removalof agricultural subsidies give rise to increasedcostal zone environmental quality and fisheries? Itis timely to promote these type of questions andstudy the complete costs of food production andenvironmental losses.
17.6 Remediation of cultural eu-trophication
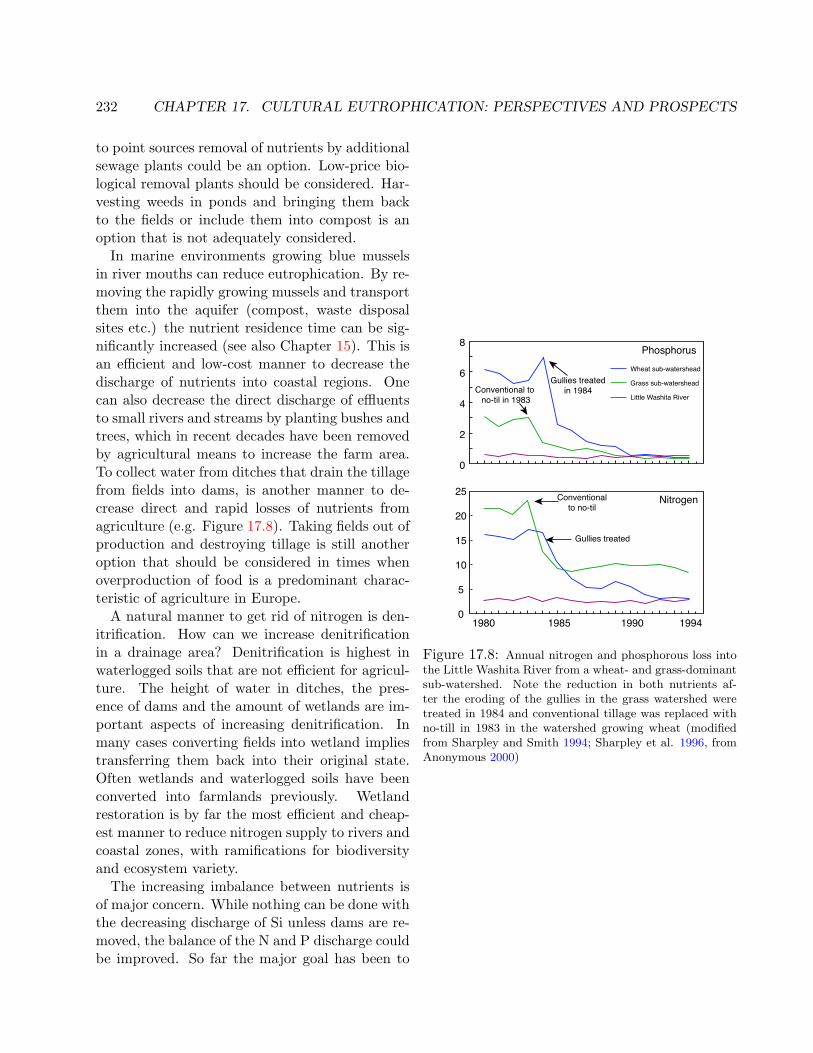
An obvious mode to reduce the effects of culturaleutrophication is reduction of resource use in thedrainage area. This could be achieved by a reduc-tion of fertilisers use and limitations of husbandry.An obvious step would be to reduce nutrient dis-charge to the aquifer. This implies that stepsare taken that effluents from fields, intensive hus-bandry towns and factories are strongly regulated.By regulating gullies and tiles in agricultural re-gions significant declines of nutrient discharge canbe achieved (Figure 17.8; Chapter 2). With regard
232 CHAPTER 17. CULTURAL EUTROPHICATION: PERSPECTIVES AND PROSPECTS
to point sources removal of nutrients by additionalsewage plants could be an option. Low-price bio-logical removal plants should be considered. Har-vesting weeds in ponds and bringing them backto the fields or include them into compost is anoption that is not adequately considered.
In marine environments growing blue musselsin river mouths can reduce eutrophication. By re-moving the rapidly growing mussels and transportthem into the aquifer (compost, waste disposalsites etc.) the nutrient residence time can be sig-nificantly increased (see also Chapter 15). This isan efficient and low-cost manner to decrease thedischarge of nutrients into coastal regions. Onecan also decrease the direct discharge of effluentsto small rivers and streams by planting bushes andtrees, which in recent decades have been removedby agricultural means to increase the farm area.To collect water from ditches that drain the tillagefrom fields into dams, is another manner to de-crease direct and rapid losses of nutrients fromagriculture (e.g. Figure 17.8). Taking fields out ofproduction and destroying tillage is still anotheroption that should be considered in times whenoverproduction of food is a predominant charac-teristic of agriculture in Europe.
A natural manner to get rid of nitrogen is den-itrification. How can we increase denitrificationin a drainage area? Denitrification is highest inwaterlogged soils that are not efficient for agricul-ture. The height of water in ditches, the pres-ence of dams and the amount of wetlands are im-portant aspects of increasing denitrification. Inmany cases converting fields into wetland impliestransferring them back into their original state.Often wetlands and waterlogged soils have beenconverted into farmlands previously. Wetlandrestoration is by far the most efficient and cheap-est manner to reduce nitrogen supply to rivers andcoastal zones, with ramifications for biodiversityand ecosystem variety.
The increasing imbalance between nutrients isof major concern. While nothing can be done withthe decreasing discharge of Si unless dams are re-moved, the balance of the N and P discharge couldbe improved. So far the major goal has been to
8
6
4
2
0
25
20
15
10
5
01980 1985 1990 1994
Conventional
to no-til
Gullies treated
Nitrogen
Conventional to
no-til in 1983
Gullies treated
in 1984
Phosphorus
Wheat sub-watershead
Grass sub-watershead
Little Washita River
Figure 17.8: Annual nitrogen and phosphorous loss intothe Little Washita River from a wheat- and grass-dominantsub-watershed. Note the reduction in both nutrients af-ter the eroding of the gullies in the grass watershed weretreated in 1984 and conventional tillage was replaced withno-till in 1983 in the watershed growing wheat (modifiedfrom Sharpley and Smith 1994; Sharpley et al. 1996, fromAnonymous 2000)
17.7. CONTROLLED CULTURAL EUTROPHICATION AND AQUACULTURE 233
reduce nutrient discharge per se. While this is afirst, important step, the next must be to figureout if the discharge of N and P could be closer tothe Redfield ratio to achieve a more environmentalfriendly composition.
The basic goal for reducing the eutrophicationin streams, lakes and coastal waters is fist of allto increase their residence time on land and omitthe present short-circuits in the nutrient cycles.This would decrease fertilizer use and result in ahigher net-utilization of nutrients by man. Re-turning marine biomass back to the drainage areaand spreading human and animal excrements effi-ciently in the drainage area is an option that hasbeen previously applied and should be reconsid-ered. Decreased meat consumption (Figure 17.8)or more spread meat production are additional op-tions that would decrease nutrient discharge.
17.7 Controlled cultural eu-trophication and aquacul-ture
Agriculture has been the backbone of human ex-istence that created the base for the 3 orders ofmagnitude increase in human population. Whileintensive agriculture often is considered negativefor the productivity in adjacent aquatic environ-ments (e.g. too high nutrient supply, major de-viations in nutrient composition, large-scale mod-ifications of water sheds and water supplies) theexploitation of aquatic ecosystems in Europe hasuntil recently been dominated by various formsof fish and shellfish. Compared to agriculture,fishery is still based on the hunter and picker ap-proach that agriculture left several thousand yearsago: wild resources are exploited rather than cul-tivated. While various aquaculture techniques, of-ten in combination with agriculture, have beenwidely applied in many countries (e.g. China andJapan), aquaculture in sea- or landbased enclo-sures first developed into a major economy in Eu-ropean countries in recent decades. Aquaculturecan now be of similar or even greater significancethan natural fish and shellfish catches. The major-
ity of marine fish aquaculture depends on feed thatderives from natural fish resources. The supply ofnutrients that causes eutrophication in coastal re-gions may support a higher fishery, but this effecthas not been quantified. One problem is that thenutrients are not added in close to Redfield ratioproportion and that pollutants such as heavy met-als, pesticides and detergents are dumped in con-cert with the nutrients. For a general discussion ofmarine production and seafood; see Chapter 15.
Is it possible to leave the ‘hunter and pickerstage’ of fisheries and introduce aquaculture inthe meaning of agriculture, i.e. fertilising a re-gion, manipulate the organisms and channel thenutrients into crops that are harvestable items ofhuman food consumption? Can we control thefertilisation of aquatic recipients by using a lim-iting resource (i.e. nutrients), which at present isdumped into what we wish to be pristine regionsor can we generate a controlled fertilisation of cer-tain regions by adding fertilisers? Could we turnthe waste of resources that result in eutrophicationinto a benefit, resources that benefit humans? Thelack of knowledge how nutrients are channelledthrough manipulated food webs prevents exten-sive sustainable aquaculture in the foreseeable fu-ture. However, it is important to investigate thebase for a future aquaculture (see Chapter 15), inparallel with the development of agriculture thattook place several thousand years ago. There isno reason to assume that aquatic environmentsare in essence so different compared to terrestrialenvironments that significant aquaculture shouldbe out of question. In particular not in a worldthat is short in food.
To build up a modern aquaculture know-howthat would allow extensive aquaculture if the needarises would be a good investment in future pros-perity of coastal populations. This knowledgewould simultaneously contribute to a better un-derstanding of eutrophication. Some attempts toobtain such knowledge have been already obtainedby the MARICULT programme (see Chapter 15).To endeavor a controlled fertilization of coastalwaters (in contradiction to our current uncon-trolled experiment) to be subsequently utilized by
234 CHAPTER 17. CULTURAL EUTROPHICATION: PERSPECTIVES AND PROSPECTS
fisheries or extensive aquaculture is an approachthat has not found wide acceptance. On the con-trary, the common attitude is rather to prevent eu-trophication of coastal water or dump nutrients atdepth. This attitude is opposed to use the alreadyand in most poor regions of the world perpetuateeutrophied coastal waters for extensive aquacul-ture, in analogy to agriculture. There exists aconflict between the wish to (a) experience non-eutrophied coastal waters, (b) to use these waterseventually for aquaculture and fertilize them and(c) todays approach to dump nutrient at large-scale without considering (a) or (b). It can bequestioned if option (b) is the best manner to copefavorably with the negative aspects of eutrophica-tion. This in order to support the sustainabilityof the coastal zone that is rapidly decreasing inmany regions (e.g. some estuaries and fjords, thesouthern North Sea or the ‘death zone’ in the Gulfof Mexico).
In Japan where aquaculture has played a vi-tal role throughout the last thousand years ex-amples exists showing that eutrophication andaquaculture can co-exist without destroying thelong-term integrity of aquatic ecosystems. Edo,the capital of Japan during the Tukagawa regime(at present Tokyo), was densely populated andtransported manure from the city to fields outsidethe town. Also, they harvested the undoubtedlyeutrophicated bight outside the city through ex-tensive aquaculture establishments (e.g. scallops,fish, seaweed etc.). The discharge and cycling ofbiomass and nutrients was so balanced that nonegative episodes of eutrophication (e.g. HAB,anoxic bottom water) have been reported. Thewisdom concealed in the case of Edo reflects a bal-anced solution, in a setting where resources (herenutrients/food) were strictly limited. The exam-ple shows that sustainable development is possibleif appropriate techniques are applied. In many re-spects eutrophication functions like the waste of alimited resource, in this case nutrients. In a phaseof our development characterised by excessive useof resources, phenomena such as eutrophicationare difficult to omit. In times to come, when thenegative consequences of our resource mismanage-
ment will become difficult to cope, and resourceand food shortage are difficult to deal with, thewaste of nutrients and the accompanied negativeeffects have to be carefully evaluated. Extensiveaquaculture combined with recycling of nutrientsback to arable land may be one option to alleviatethis conflict.
17.8 Epilogue
It is obvious that cultural eutrophication is tightlycoupled to the development of man, his tech-niques, food production and dietary habits. Cancultural eutrophication be omitted as long asHomo sapiens exists? The answer to this ques-tion is frankly no. With few exceptions (the ut-most outskirts of civilization) the surface of theearth has been transformed from nature into acultural landscape. Not so visible for the humaneye also the sea has been turned into a culturallandscape. We have various forms of marine pol-lution that can be encountered worldwide. Wereduced the number of large mammals in Homosapiens earliest days and recently also overfish-ing has taken place: Medium- and large-sized fishhave declined to about 25% of what was foundin the 50ties. The seafloor has become a depo-sition site for scrap, dredged material, construc-tions, ammunitions, chemical waste etc. Each m2
of the North Sea or Kattegat is subjected to bot-tom trawls several times a year. What we in collo-quial terms call nature is to a large extent actuallyculture, also in the ocean. And with regard to thelatter the term culture reflects a rather unculturedattitude. We think highly about the ocean, butcould not care less.
For obvious reasons, mankind is increasinglyworried about the quality of its environment.What is a clean and healthy environment in timeswhen most of the earth carries the signature of en-vironmental change, habitat destruction and pol-lution? Given the strong increase in human pop-ulations over the last 1000 and particular the last100 years, until when were our environments cleanand healthy? When did the coastal regions where
REFERENCES 235
people live, stop to be clean or healthy? In 1900,1500, 500 or 500 A.D.? There is no scientific def-inition for the terms clean and healthy. Cleanand healthy have operational definitions that wehave to generate. Most environmental standardsare rather based on ‘common sense’ than scientificreasoning. Environmental standards must includethe impact of humans, unless we wish to exter-minate ourselves for the benefit of nature per se.Prior to a clean-up of our polluted coastal zoneswe have to decide how clean they should becomeand which point in time we wish to refer to thatis acceptably clean and healthy.
Culture means alienation from nature. But cul-ture is the very base of human existence; it is whatmakes us humans. We can thus not ignore alien-ation from nature. Even an environmentalist isalienated with regard to what he/she wishes toprotect. This creates a basic problem for envi-ronmental protection that easily can result in sus-tainable development confrontations. Sustainabledevelopment implies that mans demands for nat-ural resources such as food are covered inside the‘buffer capacity’ of an ecosystem. Sustainabilityalso implies that organic matter and energy har-vesting from an ecosystem must not threaten thelong-term integrity of ecosystems. In aquatic sys-tems sustainable development is limited by newproduction, in other words the ecosystems car-rying capacity, its maximum production capacityand harvestable production. Sustainability canonly be maintained at harvest levels that are muchlower than the carrying capacity. Where this limitis to be set is the great challenge that depends onour definition of sustainability which has not ab-solute, but an operational meaning.
Ecosystems changes are a direct consequence ofour existence. There is no way to stop cultural eu-trophication. Any attempt to target a clean envi-ronment without radically reducing human popu-lations and thoroughly changing our life commodi-ties, is utterly naıve. Technology (for the edu-cated and wealthy) can only help, but does notfundamentally change the state of affairs. Thuswe can only ask “What eutrophication, how mucheutrophication and where should eutrophication
preferentially take place”? The question is notcultural eutrophication or not, but what type ofeutrophication, how much and at what price fornature and humans. Most aquatic ecosystemsare thus a cultural ‘landscape’, which cannot beturned into nature or a sanctuary without remov-ing humans from the entire watershed. And eventhis will not help as the atmosphere supplies nu-trients from adjacent regions. We have to bearthe responsibilities in a setting where we cannotrun away from the consequences, but modify ourmanagement. We live in the environment that wedeserve. And the recent growth in human popula-tion has probably resulted in that we have passedalready the Earths point of no return. Most of theEarth has developed irreversibly into a culturallandscape. Cultural eutrophication is a facet ofthis process.
References
Anderson, D. M. (ed). 1996. ECOHAB. The Ecology andOceanography of Harmful Algal Blooms. A national re-search agenda. Woods Hole, MA: Woods Hole Oceano-graphic Institution.
Anonymous. 2000. Clean Coastal Waters: Understandingand Reducing the Effects of Nutrient Pollution. Wash-ington, DC: National Academy Press.
Gesamp. 1991. The state of the marine environment. Ox-ford: Blackwell.
Rosenberg, R., Elmgren, R., Fleischer, S., Jonsson,P., Persson, G., & Dahlin, H. 1990. Marine eutroph-ication case studies in Sweden. Ambio, 19, 102–108.
Sharpley, A.N., & Smith, S.J. 1994. Effect of cover cropson surface water quality. Soil Tillage Research, 30, 33–38.
Sharpley, A.N., Smith, S.J., Zollweg, J.A., & Cole-man, G.A. 1996. Gully treatment and water quality inthe Southern Plains. Journal of Soil Water Conserva-tion, 51, 512–517.
Vitousek, P, M., Aber, J., Bayley, S.E., Howarth,R. W., Likens, G.E., Matson, P.A., Schindler,D.W., Schlesinger, W.H., & Tilman, G.D. 1997.Human alteration of the global nitrogen cycle: casuesand consequences. Ecological Issues, 1, 1:15.