CULTIVATION AND USE OF MORINGA AS A NUTRITIONAL AND ...
228
i CULTIVATION AND USE OF MORINGA AS A NUTRITIONAL AND MEDICINAL SUPPLEMENT FOR GOATS IN CENTRAL NAMIBIA A DISSERTATION SUBMITTED IN FULFILMENT OF THE REQUIREMENTS FOR THE DOCTOR OF PHILOSOPHY IN AGRICULTURE (ANIMAL SCIENCE) OF THE UNIVERSITY OF NAMIBIA BY MORLU KORSOR (201090163) APRIL, 2018 MAIN SUPERVISOR: Dr. Charles Ntahonshikira (University of Namibia) CO-SUPERVISOR: Prof. Habauka M. Kwaambwa (Namibia University of Science and Technology)
Transcript of CULTIVATION AND USE OF MORINGA AS A NUTRITIONAL AND ...

i
CULTIVATION AND USE OF MORINGA AS A NUTRITIONAL AND
MEDICINAL SUPPLEMENT FOR GOATS IN CENTRAL NAMIBIA
A DISSERTATION SUBMITTED IN FULFILMENT
OF THE REQUIREMENTS FOR THE
DOCTOR OF PHILOSOPHY IN AGRICULTURE (ANIMAL SCIENCE)
OF
THE UNIVERSITY OF NAMIBIA
BY
MORLU KORSOR
(201090163)
APRIL, 2018
MAIN SUPERVISOR: Dr. Charles Ntahonshikira (University of Namibia)
CO-SUPERVISOR: Prof. Habauka M. Kwaambwa (Namibia University of
Science and Technology)

ii
List of Publications from this Dissertation
Peer-Reviewed Journals
1. Comparative performance of Moringa oleifera and Moringa ovalifolia seeds and
seedlings establishment in central Namibia, Net Journal of Agricultural Science, Vol.
4(2), June 2016, pp. 35-44.
2. Indirect effect of Moringa oleifera supplemented diet on growth rates of pre-weaning
Boer goat kids. Bulletin of Animal Health and Production in Africa. January 2017, 65,
pp. 131–143.
2. Comparative proximate and mineral compositions of Moringa oleifera and Moringa
ovalifolia grown in Central Namibia, Sustainable Agriculture Research, Vol. 6 (4),
August 2017, pp. 31-44.
3. Comparative study of M. oleifera and M. ovalifolia survival rates in Central Namibia,
HSOA Journal of Plant Science: Current Research, United States of America, Vol.1 (1),
October 2017, pp. 2-8.
2. Anthelmintic effect of Moringa oleifera leaf supplement on gastrointestinal parasites
in Boer goats, Fort Hare Papers, South Africa, April 2017, in print.
5. Effect of Moringa oleifera Leaf-supplemented Diet on the Maintenance of Body
Weight and Body Condition Scores of Lactating Boer Goats, International Journal of
Livestock Production, January, 2018, under review.
Conference Proceedings
1. Anti-parasitic effect of Moringa oleifera leaf supplement in Boer goats, Proceedings
of the 2nd
International Conference of the African Association for the Study of

iii
Indigenous Knowledge Systems AASIKS, held 27th
-29th
October, 2016 in Maputo
Mozambique, ISBN: 978-0-620-73340-3.
2. Comparative study of M. oleifera and M. ovalifolia leaf biomass production in Central
Namibia for enhancing livestock production, Third Annual International AASIKS
Conference,
University of the Witwatersrand, Johannesburg, South Africa, 2nd
-4th
November, 2017.
Presentations at Conferences
1. Cultivation of Moringa oleifera and Moringa ovalifolia in Namibia, presented at
University of Namibia Research Day 2014 Conference, Neudamm Campus, 26th
September, 2014.
2. Anti-parasitic effect of Moringa oleifera leaf supplement in Boer goats, presented at
University of Namibia Research Day 2016 Conference, University of Namibia School of
Medicine, 22nd
October, 2016.
3. The effect of Moringa oleifera supplemented diet on growth rates of pre-weaning
Boer goat kids, presented at 4th
Science Conference, University of Namibia and National
Commission on Research Science and Technology (NCRST), University of Namibia,
Windhoek, 16th
-17th
November, 2016.
4. Cultivation of moringa in Central Namibia: Research collaboration with UNAM
library, presented at Systematic Review Workshop, University of Namibia, Windhoek,
13th–16
th June, 2017.
5. Field establishment, survival and yield of Moringa oleifera and Moringa ovalifolia in
semi-arid environment: A case of Central Namibia rangeland, present at
Multidisciplinary Research Conference, University of Namibia, 26th
-28th
July, 2017.

iv
6. Comparative study of M. oleifera and M. ovalifolia leaf biomass production in central
Namibia for enhancing livestock production, paper presented at the 5nd
Annual Science
Research Conference, 15th–16
th November, 2017 at the University of Namibia,
Windhoek.
7. Field Growth Performance of Moringa oleifera and Moringa ovalifolia in Semi-arid
Environment: A Comparative Study of Central Namibia, paper presented at the 5nd
Annual Science Research Conference, 15th–16
th November, 2017 at the University of
Namibia, Windhoek.

v
Table of Contents
No. Contents Page
Preliminaries…………………………………………………………………………… i - xviii
i List of Publications from this Research …………………………………………. i - iii
Ii Table of Contents…………………………………………………………………. iv - viii
iii List of Tables……………………………………………………………………... ix - xii
iv List of Figures…………………………………………………………………….. xiii - xiv
v List of Abbreviations/Acronyms.………………………………………................ xv - xvi
vi Acknowledgement………………………………………………………………… xvii
vii Dedication ………………………………………………………………………... xviii
viii Declarations……………………………………………………………................ xix
Chapter 1: Introduction………………………………………………………………. 1 - 12
1.1 Summary of Chapters..…………………………………………………................ 1
1.2 Orientation of the Study.…………………………………………………............. 1 - 4
1.3 Problem Statement.………………………...……………………………………... 5 - 6
1.4 Objectives of the Study……....…………………………………………………… 6
1.5 Hypotheses of the Study..………………………………………………................ 7 - 8
1.6 Significance of the Study.………………………………………………………… 9
1.7 Limitations of the Study …………………………………………………............. 9
References………………………………………………………………………… 10 - 12
Chapter 2: Comparative Performance of Moringa oleifera and Moringa ovalifolia
Seeds and Seedlings Establishment in Central Namibia……………….
13 - 37
2.1 Abstract…………………………………………………………………………… 13 - 14
2.2 Introduction……………………………………………………………………….. 14 - 16
2.3 Materials and Methods…………………………………………………………..... 17
2.3.1 Study Area………………………………………………………………………… 17
2.3.2 Experimental Design……………………………………………………………… 17 - 18
2.3.3 Preparation of Moringa Nursery and Management of Seedlings……………….... 18 - 19
2.3.4 Procedures for Data Collection…………………………………………………… 19 - 20
3.3.4 Data Analysis……………………………………………………………………... 20
2.4 Results and Discussion………………………………………………………….... 20 - 21

vi
2.4.1 Seedling Emergence and Establishment………………………………................. 21 - 25
2.4.2 Seedling Extent of Endurance and Mortality……………………………………... 25 - 26
2.4.3 Growth Performance of M. ovalifolia and M. oleifera Seedlings………………… 27 - 32
2.5 Conclusion………………………………………………………………………… 32 - 33
References………………………………………………………………………… 33 - 37
Chapter 3: Field Establishment, Extent of Endurance and Yield of Moringa
oleifera and Moringa ovalifolia in Semi-arid Environment: A Case of
Central Namibia Rangeland……………………………………………..
38 - 87
3.1 Abstract…………………………………………………………………………… 38 - 39
3.2 Introduction………………………………………………………………............. 39 - 42
3.3 Materials and Methods……………………………………………………………. 42
3.3.1 Study Area………………………………………………………………............... 42 - 43
3.3.2 Experimental Design……………………………………………………………… 43
3.3.3 Field Preparation and Transplantation of Seedlings……………………………… 43 - 45
3.3.4 Soil Composition of the Experimental Field……………………………………… 45 - 46
3.3.5 Weeds and their Control ………………………………………………………….. 46 - 47
3.3.6 Pests of Moringa oleifera and Moringa ovalifolia……………………….............. 47 - 51
3.3.7 Data Collection Procedures…………………………………………….................. 51 - 52
3.3.8 Data Analysis…………………………….……………………………….............. 52
3.4 Results and Discussion……………………………………………………………. 52
3.4.1 M. oleifera and M. ovalifolia Heights Increase (cm) for 2014/15 and 2015/16
Summer Seasons………………………………………….....................................
53 - 60
3.4.2 Comparison of M. oleifera and M. ovalifolia Sprouting and Extent of Endurance. 61 - 75
3.4.3 Comparison of M. oleifera and M. ovalifolia Leaf-Dry-Matter Yield……………. 75 – 81
3.5 Conclusion…………………………….………………………………………….. 81 - 82
References…………………………….…………………………………………... 82 - 87
Chapter 4: Comparative Proximate and Mineral Composition of Moringa oleifera
and Moringa ovalifolia Grown in Central Namibia……………………. 88 - 124
4.1 Abstract…………………………….……………………………………………... 88 - 89
4.2 Introduction…………………………….…………………………………………. 89 - 91
4.3 Materials and Methods……………………………………………………………. 91

vii
4.3.1 Sample Collection…………………………….…………………………………... 91 - 92
4.3.2 Sample Preparation…………………………….…………………………............ 92
4.3.3 Nutritional Analysis Procedures………………………………………………….. 93 - 97
4.3.4 Data Analysis…………………………….……………………………………….. 97
4.4 Results and Discussion…………………………………………………................ 97 - 98
4.4.1 Nutrient Composition of M. oleifera and M. ovalifolia…………………………... 98 - 103
4.4.2 Comparison of M. oleifera Nutritional Compositions at Different Treatment
Levels…………………………………………………………………………….. 104 - 109
4.4.3 Proximate and Mineral Composition M. oleifera from Different Regions of
Namibia and Africa………………………………………………………………..
109 - 114
4.4.4 Comparison of M. ovalifolia Nutrient Compositions at Different Treatment
Levels…………………………………………………………...............................
114 - 118
4.5 Conclusion…………………………….………………………………………….. 118 - 119
References…………………………….…………………………………………... 119 - 124
Chapter 5: Assessment of Anthelmintic Effect of Moringa oleifera Leaf-
Supplemented Diet on Gastrointestinal Parasites in Boer Goats………
125 - 163
5.1 Abstract…………………………….……………………………………………... 125
5.2 Introduction…………………………….…………………………………………. 126 - 128
5.3 Materials and Methods……………………………………………………............. 128
5.3.1 Study Area…………………………….…………………………………………... 128 - 129
5.3.2 Research Design…………………………….………………………….................. 129 - 131
5.3.3 Data Collection Procedures……………………………………………………..... 132 - 133
5.3.4 Data Analysis…………………………….……………………………………….. 133
5.4 Results and Discussion……………………………………………………............. 134
5.4.1 Adjustment Period and Parasite Prevalence………………………………............. 134 - 135
5.4.2 Infestation by Trichostrongylid Helminths……………………………………….. 136 - 140
5.4.3 Infestation by Coccidia Species…………………………………………………... 140 - 144
5.4.4 Infestation by Trichuris Species…………………………………………………... 145 - 148
5.4.5 Infestation by Moniezia Species………………………………………………….. 148 - 151
5.4.6 Infestation by Strongyloides papillosus………………………………………….. 152 - 156
5.5 Conclusion…………………………….………………………………………….. 156 - 157

viii
References…………………………….…………………………………………... 157 - 163
Chapter 6: Indirect Effect of a Moringa oleifera Leaf-supplemented Diet on
Growth Rates of Pre-weaning Boer Goat Kids…………………………
164 - 201
6.1 Abstract…………………………….……………………………………………... 164 - 165
6.2 Introduction…………………………….………………………………................. 165 - 167
6.3. Materials and Methods…………………………………………………................. 168
6.3.1 Study Area…………………………….…………………………………………... 168
6.3.2 Study Design…………………………….………………………………………... 168 - 171
6.3.3 Experimental Animals…………………………….…………………………......... 171 - 172
6.3.4 Data Collection Procedures……………………………………………….............. 172 - 173
6.3.5 Data Analysis……………………………………………………………………... 163
6.4 Results and Discussion………………………………………………………........ 163 -174
6.4.1 Adjustment Period of Does and Kids‘ Birth Types and Sex……………………… 164 - 175
6.4.2 Heart Girths of the Kids……..…………………………………………................ 175 - 179
6.4.3 Body Lengths of Kids…………….……..………………………………………... 179 - 183
5.4.4 Body Weight Gain of Kids……..…………………………………………............. 184 - 188
6.4.5 Body Condition Scores of the Kids……………………………………….............. 188 - 192
6.4.6 Growth Differences Between and Within Sex and Birth Types……….................. 192 - 195
6.5 Conclusion…………………………….…………………………………………... 196
References…………………………….…………………………………………... 197 - 201
Chapter 7: Conclusions and Recommendations……………………………………... 202 - 2
7.1 Conclusions…………………………….…………………………………………. 202
7.1.1 Chapter 2 Conclusion …………………………………………………………….. 202 -203
7.1.2 Chapter 3 Conclusion……………………………………………………………... 203
7.1.3 Chapter 4 Conclusion….………………………………………………………….. 203 - 204
7.1.4 Chapter 5 Conclusion….………………………………………………………….. 204
7.1.5 Chapter 6 Conclusion….………………………………………………………….. 204 - 205
7.2 Recommendations…………………………….…………………………………... 206
7.2.1 Chapter 2 Recommendations…….……………………………………………….. 206
7.2.2 Chapter 3 Recommendations…….……………………………………………….. 206 - 207
7.2.3 Chapter 4 Recommendations…….……………………………………………….. 207

ix
7.2.4 Chapter 5 Recommendations…….……………………………………………….. 207
7.2.5 Chapter 6 Recommendations.…………………………………………………….. 208

x
List of Tables
No. Title Pages
Chapter 1
1.1 Specific objectives, hypotheses and their associated chapters…………………........ 8
Chapter 2
2.1 Daily and cumulative seedling emergence of M. ovalifolia……………………........ 22
2.2 Daily and cumulative seedling emergence of M. oleifera…………………………... 23
2.3 Moringa species seedling emergence over time (days)…………………………….. 23
2.4 Moringa species seedling emergence over time (days)…………………………….. 24
2.5 Independent sample test of Moringa species emerged seedlings………………….... 25
2.6 Cumulative mortality of Moringa seedlings……………………………………....... 26
2.7 Independent t-test for Moringa species seedling mortality differences….………..... 26
2.8 Descriptive statistics of Moringa species seedling mortality differences….………. 26
2.9 Descriptive statistics of Moringa species weekly LSB heights…………………….. 29
2.10 Independent sample test of Moringa species weekly LSB heights…………………. 30
Chapter 3
3.1 Soil nutrients properties and characteristics……………………………………........ 46
3.2 Pairwise comparisons of Moringa species monthly heights increments (cm) for
2014/15 and 2015/16………………………………………………………………... 56
3.3 Monthly differences in heights (cm) of Moringa species in 2014/2015 and
2015/2016…………………………….……………………………………………... 58
3.4 Descriptive statistics for Moringa species monthly LSB height increments (cm) for
2014/15 and 2015/16…………………………….………………………………….. 60
3.5 Descriptive statistics of Moringa species EoE differences after 2014 winter season. 65
3.6 Independent sample t-test of Moringa species EoE after 2014 winter season……... 66
3.7 Distribution of independent sample mean of Moringa species…………………….. 66
3.8 Descriptive statistics of Moringa species EoE differences after 2015 winter season 69
3.9 Independent sample t-test of Moringa species EoE after 2015 winter season…….. 69
3.10 Distribution of independent sample mean of Moringa species……………………. 70
3.11 Descriptive statistics of Moringa species EoE differences after 2016 winter season 72
3.12 Independent sample t-test of Moringa species EoE after 2016 winter season…….. 72

xi
3.13 Distribution of independent sample mean of Moringa species in 2016….………... 73
3.14 Independent sample t-test of Moringa species and seasonal leaf-dry-matter yield
kg/ha………………………………………………………………………………… 79
3.15 Descriptive statistics of Moringa species seasonal leaf-dry-matter yields in kg/ha.. 80
3.16 Distribution of independent sample mean of Moringa species leaf-dry-matter
yields based on seasons……………………………………………………………... 80
Chapter 4
4.1 Descriptive statistics for Moringa species leaves proximate composition…………. 100
4.2 Independent sample t-test of M. oleifera and M. ovalifolia leaves proximate
composition…………………………….…………………………………………… 100
4.3 Descriptive statistics for Moringa species leaf mineral composition………………. 102
4.4
Independent sample t-test for M. ovalifolia and M. oleifera leaves mineral
composition…………………………………………………………………………. 102
4.5 Total digestible nutrients, digestible energy, metabolisable energy and tannin
contents in M. oleifera and M. ovalifolia leaves….……………………………........ 103
4.6 Proximate composition of M. oleifera leaves in different treatments………………. 105
4.7 Mineral composition of M. oleifera leaves in different treatments...……………….. 106
4.8 Proximate composition of M. oleifera leaves at different fertilizer treatment levels.. 107
4.9 Mineral composition of M. oleifera leaves at different fertilizer treatment levels…. 108
4.10 Organic and inorganic leaf and flower nutrient compositions of M. oleifera………. 109
4.11 Proximate composition of M. oleifera leaves from four locations of Namibia……... 110
4.12 Mineral composition of M. oleifera leaves from four locations of Namibia……….. 111
3.13 Proximate composition of M. oleifera leaves from different African regions…….... 112
4.14 Mineral composition of M. oleifera leaves from different African regions................ 114
4.15 Proximate composition of M. ovalifolia leaves at different treatment levels……...... 115
4.16 Mineral composition of M. ovalifolia leaves at different treatment levels…………. 116
4.17 Proximate and mineral composition of M. ovalifolia leaves at different treatment
levels…………………………………………………………………....................... 118
Chapter 5
5.1 Nutrient compositions of feeds and lick block fed to the goats…..………………… 131
5.2 Parasite prevalence in the experimental goats ………………………………........... 135

xii
5.3 Before and during treatment means of trichostrongyle-type egg load………............ 138
5.4 Chi-Square tests of M. oleifera levels on trichostrongyle-type eggs over time
(weeks)…………………………………………………........................................... 139
5.5 Before and during treatment means of coccidia oocyst load………….…………… 132
5.6 Chi-Square Tests of M. oleifera levels on coccidia oocysts over time (weeks)........ 143
5.7 Regression analysis of M. oleifera on coccidia oocysts……………………………. 144
5.8 Before and during treatment means of Trichuris species load………….…………... 146
5.9 Chi-Square Test of M. oleifera levels on Trichuris species over time (weeks)......... 147
5.10 Regression analysis of M. oleifera levels on Trichuris species in study goats…….. 148
5.11 Before and during treatment means of Moniezia species load…………………....... 150
5.12 Chi-Square Tests of M. oleifera levels on Moniezia species over time (weeks)........ 151
5.13 Regression analysis of M. oleifera on Moniezia species eggs……...………………. 151
5.14 Before and during treatment means of Strongyloides papillosus load…………........ 154
5.15 Chi-Square Test of M. oleifera on Strongyloides papillosus over time (weeks)........ 155
5.16 Regression analysis of M. oleifera on Strongyloides papillosus……..……………... 155
Chapter 6
6.1 Basic information about study goats………………………………………………... 169
6.2 Nutrient compositions of feeds and lick block fed to the goats…………………….. 170
6.3 Experimental layout of M. oleifera supplementation to lactating does…………….. 171
6.4 Result of regression analysis on factors influencing kids‘ heart girth..…………….. 177
6.5 Duncan‘s multiple range tests for weekly growth in kids‘ heart girth (cm)……....... 178
6.6 Descriptive statistics of weekly growth in kids‘ heart girth (cm)….……………….. 179
6.7 Result of regression analysis of factors influencing kids‘ body length..………......... 181
6.8 Duncan‘s multiple range tests for weekly growth in kids‘ body lengths (cm)…....... 183
6.9 Descriptive statistics of weekly growth in kids‘ body length (cm)…………………. 183
6.10 Result of regression analysis on factors influencing kids‘ body weight (kg)…......... 185
6.11 Duncan‘s multiple range tests for weekly growth in kids‘ body weight gains (kg).... 187
6.12 Descriptive statistics of weekly growth in kids‘ body weight gains (kg)…...……… 188
6.13 Result of regression analysis on factors influencing kids‘ body condition scores….. 190
6.14 Duncan‘s multiple range tests for weekly growth in kids‘ body condition scores…. 192
6.15 Descriptive statistics of weekly growth in kids‘ body condition scores……………. 192
xiii
6.16 Average growth parameters of kids by birth type and sex.…………………………. 193
6.17 Pairwise comparisons of M. oleifera effect on kids‘ growth parameters by sex……. 194
6.18 Pairwise comparisons of M. oleifera effect on kids growth parameters by birth type 195

xiv
List of Figures
No. Title Pages
Chapter 2
2.1 Emergence of M. ovalifolia (day 12)………………………………………….. 27
2.2 Emergence of M. oleifera (day 12) …………………………………………… 28
2.3 Performance of M. ovalifolia seedlings at day 25 …………………………...... 28
2.4 Performance of M. oleifera seedlings at day 25……………………………...... 28
2.5 Average weekly growth in heights of the two Moringa species….…………… 31
2.6 Special ―tuberous‖ roots of M. ovalifolia at 4 months………………………… 32
Chapter 3
3.1 Hemiptera (bugs) on trees leaves……………………………………………… 48
3.2 A. discoidalis (A and B) and P. morbillosus (C) feeding on buds and leaves
Moringa species…………………………………………………….................. 49
3.3 Effect of A. discoidalis and caterpillar feeding M. oleifera trees……………... 50
3.4 M. ovalifolia trees showing little or no pest damage………………………….. 50
3.5 M. oleifera (A) and M. ovalifolia (B) roots dug and eaten by animals………... 51
3.6 Monthly average increase in LSB heights of Moringa species for 2014/15 and
2015/16………………………………………………………………………… 55
3.7 World Humidity Index Zone showing the study area….…………….………... 62
3.8 M. oleifera at the beginning (A) and at the end (B) of 2015 winter………….... 62
3.9 M. ovalifolia at the beginning (A) and at the end (B) of 2015 winter………..... 63
3.10 Moringa trees‘ sprouting and EoE differences after 2014 winter season……... 65
3.11 Mean distribution of Moringa species‘ EoE after 2014 winter season……….. 67
3.12 Moringa trees‘ sprouting and EoE differences after 2015 winter season……... 68
3.13 Mean distribution of Moringa species EoE differences after 2015 winter
season……………………………………………………………………….. 70
3.14 Moringa trees‘ species sprouting and EoE differences after 2016 winter
season…………………………………………………………………………. 71
3.15 Mean distribution of Moringa species EoE differences after 2016 winter
season…………………………………………………………………………. 73
3.16 M. oleifera (A) and M. ovalifolia (B) sprouting in middle of 2016 winter….... 74

xv
3.17 Well-established roots of M. oleifera (A) and M. ovalifolia (B) after 2016
winter……………............................................................................................. 74
3.18 Moringa species seasonal leaf-dry-matter yields in kg/ha per treatment levels. 78
3.19 Mean distribution of Moringa species leaf-dry-matter yield in kg/ha for
2014/2015……………………………………………………………………… 80
3.20 Mean distribution of Moringa species leaf-dry-matter yield in kg/ha for
2015/2016……………………………………………………………………… 81
Chapter 5
5.1 Infestation level of trichostrongyle-type eggs in study goats..………………… 138
5.2 Distribution of trichostrongyle-type eggs in study goats...…………………… 140
5.3 Infestation levels of coccidia oocysts in study goats…………..…………….... 141
5.4 Distribution of coccidia oocysts in study goats………………………………... 144
5.5 Infestation of study goats by Trichuris species………………...……………… 145
5.6 Infestation levels of Moniezia species eggs in study goats…...……………….. 149
5.7 Infestation levels of Strongyloides papillosus in study goats………………….. 153
Chapter 6
6.1 Distribution of kids by birth types and sex…..………………………………... 175
6.2 Kids‘ average heart girths at different M. oleifera inclusion levels…….……... 176
6.3 Overall average weekly growth in kids‘ heart girth…………...………………. 178
6.4 Kids‘ average body length at different M. oleifera inclusion levels……...…… 180
6.5 Overall average weekly growth in kids‘ body length…….……………………. 182
6.6 Kids‘ average body weight gains at different M. oleifera inclusions...……….. 184
6.7 Overall average weekly growth in kids‘ body weight gain………..…………... 186
6.8 Kids‘ average body condition scores at different M. oleifera inclusion levels... 189
6.9 Overall average weekly growth in kids‘ body condition scores………………. 191

xvi
List of Abbreviations/Acronyms
AES ……………………………….. Atomic Emission Spectroscopy
AgriLASA ………………………… Agri-Laboratory Association of Southern Africa
ANOVA …………………………… Analysis of Variance
AOAC ……………………………... Association of Official Agricultural Chemists
BGBSN ……………………………. Boer Goat Breeders‘ Society of Namibia
CHN ……………………………..… Carbon Hydrogen Nitrogen
CRD ……………………………….. Completely Randomized Design
DE ………………………………..... Digestible Energy
DM ……………………………..….. Dry Matter
DW …………………………….….. Dry Weight
EDTA ……………………………... Ethylenediaminetetraacetic acid
EoE………………………….……... Extent of endurance
FAO …………………………….…. Food and Agriculture Organization
GIP ……………………………..….. Gastrointestinal Parasites
GLM …………………………….… General Linear Model/Generalised Linear Model
GSB………………………………... Life stages by
IFAD ………………………………. International Fund for Agricultural Development
ICP …………………………….…... Inductively Coupled Plasma
IU …………………………….……. International Unit
LSD …………………………….…. Least Significant Difference
ME …………………………….…... Metabolisable Energy
m/v…………………………………. Mass Per Volume

xvii
n.d. ……………….………………... No Date
NDF …………………………….…. Neutral Detergent Fibre
NDFIP …………………………….. Neutral Detergent Fiber Insoluble Protein
NEU ……………………………..… Neudamm
Spp. …..…………………………..... Species
SPSS ………………………………. Statistical Package for Social Sciences
TDN ……………………………….. Total Digestible Nutrients
WFP ……………………………..… World Food Program

xviii
Acknowledgement
First and foremost, I would like to thank the Almighty God who enabled me obtain this
scholarship among many highly qualified Liberians. Secondly, my thanks go to the
Governments of Liberia and Namibia for providing this scholarship to study in Namibia
based on the bilateral agreement between the two sister countries. As per agreement, the
Government of Namibia fully supported my education in Namibia from Master‘s degree
to PhD studies without much hindrance through the Namibia Students Financial
Assistance Fund (NSFAF). In addition, the Namibia-South Africa Bilateral Research
Agreement, through the National Commission on Research Science and Technology
(NCRST), provided the funds for fencing the moringa orchard and for leaves nutrient
analysis. Further, my special gratitude goes to Mrs. Esther L. Kwaambwa who first
suggested to me M. oleifera as a research topic; and then, Ms Robin Denney, an
American Episcopal Missionary and M. oleifera promoter in Africa who also
contributed in the development of the research topic. In addition, I would like to
acknowledge the efforts of Dr. Emmanuel Lutaaya (PhD) and Ms Maria Shipandeni who
helped in the editing of the proposal; and, Prof. Adetokunbo Borishade (PhD), Dr.
Alison L. Weightman and Mrs. Sally Kaukuma who edited the dissertation for
grammatical errors, sentence structures and paragraphing. Finally, special thanks and
appreciations go to Prof. Haruna M. Bello (PhD), Dr. Charles Ntahonshikira (PhD) and
Prof. Habauka M. Kwaambwa (PhD) who mentored me throughout the research process
from the beginning to the end. This work could have not been possible without them.
This dissertation is an outcome of a PhD research undertaken at the University of
Namibia, Faculty of Agriculture and Natural Resources, Department of Animal Science.

xix
Dedication
This dissertation is dedicated to my mother, Fenio Korsor who stood firm for my
education under unbearable and unbelievable circumstances. She deserves all the praises
and honours for this achievement that had rocky journey, but was strengthened by her
real and true support. My late father (R.I.P), Mr. Korsor Karma also deserves an honour
for exposing me to early education, where the interest was catapulted.
Furthermore, it is dedicated to my precious wife, Sarah J.F. Ndomahun-Korsor, who has
lived lonely while I was away for my studies and to my children who sacrificed their
fatherly care for me to come and study in a distant country without seeing them growing
up and guiding them along their paths. Although the scabs will ever remain in their lives,
I believe that they will reap the fruits of this sacrifice and find a consoling and
encouraging reward upon my return to Liberia.
It is also dedicated to my entire family, Sister Christine Wollie-Josiah and Peter M.
Zulon, Francis Nyeekpee my mentors and strongest supporters; Sister Sarah T.
Hammond-Korsor, all brothers and sisters. The TUDA Community which has always
been there to remove any hindrance affecting my support in Liberia and the Anglican
Diocese of Namibia (St. George Cathedral Parish) are acknowledged.

xx
Declaration
I, Morlu Korsor, hereby declare that this study is my own work and is a true reflection
of my research, and that this work, or any part thereof has not been submitted for a
degree at any other institution.
No part of this dissertation may be reproduced, stored in any retrieval system, or
transmitted in any form, or by any means (e.g. electronic, mechanical, photocopying,
recording or otherwise) without prior permission of the author, or the University of
Namibia in that behalf.
I, Morlu Korsor, grant the University of Namibia the right to reproduce this thesis in
whole or in part, in any manner or format, which the University of Namibia may deem
fit for academic purpose.
Morlu Korsor March 6, 2018
…………………… ……………………… ………….…………
Name of Student Signature Date

1
Chapter 1
Introduction
1.1 Summary of Chapters
This dissertation is organized into seven chapters. Chapter 1 is an introduction to the
study, which includes the orientation of the study, the problem statement, objectives,
hypotheses, the significance and the limitations of the study. Chapter 2 deals with the
nursery establishment of Moringa oleifera (M. oleifera) and Moringa ovalifolia (M.
ovalifolia), and compares the performance of their seeds and seedlings in terms of
emergence and establishment. This chapter serves as a preliminary chapter to chapter 3,
which elucidates on the life stages by (LSB) heights and leaf-dry-matter yields of M.
oleifera and M. ovalifolia on the field for two summer seasons (2014/2015 and
2015/2016) as well as their extent of endurance (EoE) after three winter seasons.
Chapter 4 explains the determination of the proximate and mineral compositions of M.
oleifera and M. ovalifolia grown in Namibia. Chapter 5 assesses the efficacy of M.
oleifera in treating gastrointestinal parasites in Boer goats, in comparison with the drug
ecomectin® (ECO Animal Health Southern Africa (Pty) Ltd. in Faerie Glen) with a
composition of ivermectin 0.08% m/v). Chapter 6 on the other hand, evaluates the
indirect effects of feeding M. oleifera supplements on growth rates in pre-weaning kids.
Finally, chapter 7 closes with the conclusions and recommendations of this study.
1.2 Orientation of the Study
Goats (Capra aegarus hircus) are small ruminants found in almost all parts of the world
reared by both rural subsistence and commercial farmers as a sustainable source of

2
household income and protein-food supply. About 480 million goats exist across the
world, about 75% of which are found in developing countries (Boer Goat Breeder‘s
Society of Namibia, 2008). Goats can be classified in a number of ways, but the simplest
classification is by animal products. The three major classifications are (1) dairy, (2)
fibre and (3) meat. The two other major classifications include pets or companions and
goatskin breeds. Furthermore, some breeds are dual-purpose from which two products
can be obtained, such as meat and milk (Flanders & Gillespie, 2015).
Much of southern and western Namibia is used for small-stock farming in which goats
predominate in many communal farming districts. Among the 2.5 million goats in
Namibia, about 40% are Boer goats and 60% belong to indigenous breeds, and, over
65% of all goats are found in communal areas (Mendelsohn, 2006; Kruger & Lammerts-
Imbuwa, 2008). Although goats are predominantly browsers that do not seem to
compete with cattle and sheep when roaming freely in the natural veld (Rothauge &
Engelbrecht, 2000), it is critical to feed and supplement their rations, especially during
lactation, for improved production. Lactating Boer goats need 400 g of lucerne, 150 g
maize and 150 g broiler litter per day, or 100 g of brewer grains supplement daily during
winter (Smith, 2006). In Namibia, goats are mostly reared for meat, when the owner is
too poor to own cattle. Goats, which are more popular than sheep, are milked for
domestic purposes, slaughtered for household consumption and sold in times of cash
needs (Schneider, 1994).
Namibia is one of the most arid countries in sub-Saharan Africa, with low rainfall and a
high occurrence of drought as a natural phenomenon (Kruger & Lammerts-Imbuwa,

3
2008). These conditions reduce the potential of grazing lands. Hence, the inclusion of
fodder and medicinal trees in the rangeland will improve productivity. Locally available
and easily accessible ethno-veterinary medicinal plants provide a cheaper treatment,
compared to use of western drugs (Galav et al., 2010), which serve as remedies for goats
and other livestock treatment in Namibia. The incorporation of tree and shrub species in
animal production systems can be a viable alternative for improving the utilization of
land and at the same time improving the diet of ruminants (Sanchez et al., 2006).
The M. oleifera tree is native to India but has been planted around the world and is
naturalized in many countries. It has a high growth rate and capacity to produce large
quantities of fresh biomass (Sanchez et al., 2006; Prince, 2007). The plant is commonly
known as horse-radish or drumstick tree in English and belongs to the family
Moringaceae. It is used as an ethno-medicinal plant and livestock feed in many tropical
and subtropical countries. It is a rapidly growing deciduous tree that takes 4-5 months to
mature and be ready for use, even in poor soils (Prince, 2007; Radovich, 2007;
Alhakman, Kumar, & Khan, 2013). The plant is considered a miracle tree because, it
contains a high proportion of nutrients such as protein, minerals, vitamins,
carbohydrates, and fats (Moringa Mission Trust, 2005) that are essential for improving
performance of both animals and humans (Prince, 2007).
Moringa ovalifolia, which also belongs to the Moringaceae family, is a native tree of
Namibia and Angola. It grows in the wild in both countries. As with M. oleifera, the
fruits, leaves and roots of M. ovalifolia are edible (Curtis & Mannheimer, 2005). The
two Moringa species (M. oleifera and M. ovalifolia) are important because they can

4
grow and endure under harsh environmental conditions like those of Namibia and have
the propensity to improve rangeland productivity and subsequent livestock production
( Fuglie, 2001; Olson, 2007; Adegun & Ayodele, 2015).
Improving goat, as well as other livestock production would increase household income
and animal food supply. This would minimize the malnutrition problem among
Namibian inhabitants, where one million people (33.9% of population) have been
identified as undernourished (FAO, WFP, & IFAD, 2012). Being a semi-arid country,
livestock production is regarded as the primary farming activity in Namibia over crop
production. Schneider (1994) affirmed that more than 90% of the 690,000 km2 of land
for agriculture use in Namibia is utilized for extensive livestock farming: cattle ranging
48%, mixed cattle/small-stock ranging 14.50% and small-stock ranging 37.50%. Even
though commercial farmers provide nutritional supplements and medications to their
animals, subsistence rural communal farmers cannot afford to do so, and/or many of
them are even not aware of this practice. The unawareness and unavailability of
nutritional supplements and medications for their animals leads to poor productivity of
rural subsistence farmers‘ livestock (Namibia Broadcasting Corporation TV, 2017).
Moringa is not only a source of feed, but also has medicinal properties (Fuglie, 2001;
Moyo, Masika, Hugo, & Muchenje, 2010); however, it is still unexploited due to
unawareness and unavailability to livestock farmers.

5
1.3 Problem Statement
The main problems faced by many livestock farmers in Namibia are related to the
purchasing of feed, nutritional supplements, and medication to maintain their animals‘
health and enhance productivity, especially during winter when herbage is in short
supply in the natural veld. Research shows that poor growth rates, lower weaning
weights, and 90% of deaths of young animals are due to inadequate feed, nutritional
supplements and poor healthcare for lactating animals and their offspring, especially in
communal areas (Mendelsohn, 2006; De Lange, 2008). Kuvare et al. (2008) concurred
that both communal and, chiefly, commercial livestock farmers of Namibia use
commercial supplementary feeds for livestock. The second problem facing goat
production is the infestation of animals by parasites, especially internal parasites that
result from their grazing behaviour and susceptibility. Stehman and Smith (2004),
reported that goats are very sensitive to the effects of internal parasitism (such as
anaemia and low blood protein), which can cause decreased fertility, abortion,
unthriftiness, increased susceptibility to disease, and death.
Kuvare et al. (2008) pointed out that as a coping strategy, animal disease management is
done through indigenous and scientific techniques among farmers in Namibia. Fuglie
(2001) revealed that M. oleifera leaves are known to have anthelmintic properties when
they are used as animal feed or supplement. Moreover, there is limited forage in the veld
during winter with poor nutrient content. This requires the production of fodder crops
such as moringa trees for feed supplementation of animals for proper productivity as
described by the Pace Project (n.d.). Therefore, this study investigated the adaptability of
M. oleifera, along with M. ovalifolia (native to Namibia and Angola), grown under the
6
central Namibian climatic conditions from nursery and field establishments; their
proximate and mineral compositions; the indirect effect of M. oleifera leaves as a
nutritional supplement on Boer goat kids‘ growth parameters; and, the effect of M.
oleifera leaves on gastrointestinal parasites as an anthelmintic ethno-medicinal plant.
1.4 Objectives of the Study
1.4.1 General Objective
The general objective of this study was to determine how to improve goat production at
Neudamm Experimental Farm, and Namibia at large, through the production and use of
two moringa tree species as a nutritional and medicinal supplement by livestock farmers.
1.4.2 Specific objectives
The specific objectives of the study were:
1. To compare seedling emergence, establishment and extent of endurance of M.
oleifera and M. ovalifolia;
2. To measure the establishment, life stages by heights in terms of growth and yield
of M. oleifera and M. ovalifolia and their extent of endurance after winter season;
3. To determine the proximate and mineral compositions of M. oleifera and M.
ovalifolia;
4. To assess the efficacy of M. oleifera in treating gastrointestinal parasites of
goats;
5. To evaluate the indirect effects of feeding M. oleifera supplements on the growth
rates of pre-weaning kids.

7
1.5 Hypotheses of the Study
H01: M. oleifera and M. ovalifolia do not significantly differ in seedling emergence and
life stages by heights and extent of endurance;
H02: M. oleifera and M. ovalifolia do not significantly differ in life stages by heights,
leaf dry matter yields and extent of endurance after the winter season;
H03: M. oleifera and M. ovalifolia do not significantly differ in proximate and mineral
compositions;
H04: M. oleifera does not have anthelmintic properties.
H05: Feeding M. oleifera as a supplement to lactating goats does not directly affect the
growth rate parameters of their pre-weaning kids.
Although the objectives and hypotheses are given, for the purpose of associating them to
their respective chapters of discussion, a tabular summary is incumbent. Therefore,
Table 1.1 presents the specific objectives and hypotheses of the study in accordance to
their associated stand-alone chapters.

8
Table 1.1 Specific objectives, hypotheses and their associated chapters
No Objective Hypothesis Stand-alone chapter
1. To compare seedling
emergence, establishment
and EoE of M. oleifera
and M. ovalifolia
H01: M. oleifera and M.
ovalifolia do not
significantly differ in
seedling emergence and
LSB heights and EoE
Chapter 2: Comparative
Performance of M. oleifera
and M. ovalifolia Seeds and
Seedlings Establishment in
Central Namibia
2.
To measure the
establishment, LSB
height and yield of M.
oleifera and M. ovalifolia
and their EoE after winter
season
H02: M. oleifera and M.
ovalifolia do not
significantly differ in
LSB height, leaf dry
matter yields and EoE
after the winter season
Chapter 3:
Field Establishment, EoE
and Yield of M. oleifera
and M. ovalifolia in a
Semi-arid Environment:
The Case of Central
Namibia Rangeland
3.
To determine the
proximate and mineral
compositions of M.
oleifera and M. ovalifolia
H03: M. oleifera and M.
ovalifolia do not
significantly differ in
proximate and mineral
compositions
Chapter 4:
Comparative Proximate
and Mineral Compositions
of M. oleifera and M.
ovalifolia Grown in Central
Namibia
4. To assess the efficacy of
M. oleifera in treating
gastrointestinal parasites
of goats
H04: M. oleifera does not
have anthelmintic
properties.
Chapter 5:
Assessment of the
Anthelmintic Effect of M.
oleifera Leaf-supplemented
Diet on Gastrointestinal
Parasites in Boer Goats
5. To evaluate the indirect
effects of feeding M.
oleifera supplements on
the growth rates of pre-
weaning kids.
H05: Feeding M. oleifera
as a supplement to
lactating goats does not
directly affect the growth
rate parameters of their
pre-weaning kids.
Chapter 6:
Indirect Effect of a M.
oleifera Leaf-
Supplemented Diet on
Growth Rates of Pre-
Weaning Boer Goat Kids

9
1.6 Significance of the Study
Moringa oleifera has great potential as a sustainable means of improving livestock
productivity and reducing internal parasite infestation of goats, because of its health
improving properties. It has the potential of increasing households‘ animal-protein food
supply as well as household income when goats are healthy. Moreover, since veterinary
services are expensive and limited in rural Namibia, the use of M. oleifera for both
nutritional and ethno-medicinal purposes in small ruminants would serve as an
indigenous sustainable way for not only improving animal productivity, but also for
socio-economic development of rural communities. Cultivation or growing of both M.
oleifera and M. ovalifolia would provide ensiled fodder and supplement for livestock
especially during winter when grasses and browse are limited. Ecologically, since
moringa are fast-growing trees, their roots enhance the soil and prevent soil erosion
while the falling leaves decompose and add fertility to the soil in the form of green
manure as discussed by (Prince, 2007).
1.7 Limitations of the Study
Due to limited research fund, the costs of proximate and mineral analyses of moringa
leaves as well as that of coprological analysis were limiting factors for this study. The
sourcing of M. oleifera was another challenge due to long winter seasons that affect its
leaf production; however, it was sourced from Kaisosi in Rundu where winter is less
intense, while some leaves were sourced from the Neudamm Campus moringa orchard.

10
References
Adegun, M., & Ayodele, O. (2015). Growth and yield of Moringa oleifera as influenced
by spacing and organic manures in South-Western Nigeria. International Journal
of Agronomy and Agricultural Research (IJAAR), 6(6), 30–37.
Alhakman, F., Kumar, S., & Khan, S. (2013). Estimation of total phenolic content, in-
vitro antioxidant and anti-inflammatory activity of flowers of Moringa oleifera.
Asian Pacific Journal of Tropical Biomedicine, 3(8), 623–627.
https://doi.org/10.1016/S2221-1691(13)60126-4
Arora, D., Onsare, J., & Kaur, H. (2013). Bioprospecting of moringa (Moringaceae):
Microbiological Perspective. Journal of Pharmacognosy and Phytochemistry,
1(6), 193–215.
Boer Goat Breeder‘s Society of Namibia. (2008, June). The ennobled: Boer goat of
Namibia. Boer Goat Breeders‘ Society of Namibia.
Curtis, B., & Mannheimer, C. (2005). Tree Atlas of Namibia. Windhoek, Namibia: The
National Botanical Institute.
De Lange, D. (2008). Small stock management. (L. Meeser, Ed.). Windhoek, Namibia:
Joint Presidency Committee. Retrieved from
www.agrinamibia.com.na/index.php?module=Downloads func...
FAO, WFP, & IFAD. (2012). State of food insecurity in the world 2012: Economic
growth is necessary but not sufficient to accelerate reduction of hunger and
malnutrition (State of food insecurity in the world) (pp. 9, 47). Rome, Italy:
FAO.
Flanders, F., & Gillespie, J. (2015). Modern livestock and poultry production (9th ed.).
United States of America: Cengage Learning.

11
Fuglie, L. (2001). The miracle tree: the multiple attributes of Moringa. Dakar, Senegal:
CTA.
Galav, P., Jain, A., Katewa, S., & Nag, A. (2010). Animal healthcare practices by
livestock owners at Pushkar animal fair, Rajasthan. Indian Journal of Traditional
Knowledge, 9(3), 181–184.
Kruger, B., & Lammerts-Imbuwa, L. (2008). Namibia National Farmers Union (NNFU):
Training Manual. NNFU. Retrieved from
www.nnfu.org.na/download.php?fl id=30
Kuvare, U., Maharero, T., & Kamupingene, G. (2008, July). Research on farming
systems change to enable adaptation to climate change. University of Namibia.
Mendelsohn, J. (2006). Farming systems in Namibia. Windhoek, Namibia: RAISON
(Research & Information Services of Namibia).
Moringa Mission Trust. (2005). Moringa facts: Moringa oleifera nutritional values of
leaves and pods [http://moringahope.com/moringa_Facts.html].
Moyo, B., Masika, P., Hugo, A., & Muchenje, V. (2010). Nutritional characterization of
moringa (Moringa oleifera Lam.) leaves. African Journal of Biotechnology,
10(60), 12925–12933.
Namibia Broadcasting Corporation TV. (2017, July 9). Green Horizons. Livestock
Farming as a business. Windhoek, Namibia: Namibia Broadcasting Corporation.
Olson, M. E. (2007). Wood ontogeny as a model for studying heterochrony, with an
example of paedomorphosis in moringa (Moringaceae). Systematics and
Biodiversity, 5(2), 145–158.

12
Pace Project. (n.d.). Planting fodder banks for livestock. Pace Project, 37. Retrieved
from http://www.doc-developpement-durable.org/file/programmes-de-
sensibilisations/forets-protection/planting_fodder_PACE.pdf
Prince, M. (2007). ECHO Technical Note: The moringa tree, 1–19.
http://chenetwork.org/files_pdf/moringa.pdf
Radovich, T. (2007). Farm and forestry production and marketing profile for Moringa
oleifera. WSTERN AND PAR. https://doi.org/47001-03798
Rothauge, A., & Engelbrecht, J. (2000). Forage preference of Boer goats in the highland
savanna of Namibia during dry season. AGRICOLA.
Sanchez, N., Ledin, S., & Ledin, I. (2006). Biomass production and chemical
composition of Moringa oleifera under different management regimes in
Nicaragua. Springer, 66, 231–242. https://doi.org/10.1007/s10457-005-8847-y
Schneider, H. (1994). Animal health and veterinary medicine in Namibia. Windhoek,
Namibia: AGRIVET.
Smith, B. (2006). The farming handbook. South Africa: University of KwaZulu-Nata
Press.
Stehman, S., & Smith, M. (2004, September). Goat parasites: Management and control.
Retrieved from www.ansci.cornell.edu/goats/.

13
Chapter 2
Comparative Performance of Moringa oleifera and Moringa ovalifolia Seeds and
Seedlings Establishment in Central Namibia
2.1 Abstract
Trees and shrubs can serve as fodder to supplement shortages of feed for livestock,
particularly in arid and semiarid environments where palatable grasses or browse plants
could be limited due to low rainfall pattern and constant droughts. However, in Namibia
moringa tree species (spp.) have the potential to curb shortage of feeds for livestock. A
completely randomized design (CRD) was used in this study to compare the
performance of M. ovalifolia and M. oleifera with respect to seedling emergence and
seedling establishment. Seeds of the two Moringa species were sown in a nursery in 253
polythene bags (149 for M. oleifera and 104 for M. ovalifolia) at two centimetre uniform
sowing depths. Seedling emergence were recorded and the life stages by (LSB) heights
of seedlings were measured from the ground surface to the tip of the plant leaves, using
a 30-centimeter ruler with the ruler placed vertically along-side the plant. The
parameters measured were seedling emergence difference and seedling LSB height.
Moringa ovalifolia had a higher seedling emergence of 99.03% (206 out of 208 seeds)
compared to M. oleifera that had 15.06% (75 out of 298 seeds). Also, M. ovalifolia
emerged faster (started emergence on the 7th
day and completed on the 18th
day) than M.
oleifera (started on the 11th
day and completed on the 28th
day). Conversely, M. oleifera
had faster seedling establishment, with an overall average height of 18.77 cm compared
to M. ovalifolia which had slower LSB height over time with 13.25cm average height.
An independent sample t-test results revealed that M. oleifera and M. ovalifolia mean of

14
seedling emergence and emergence days were significantly different (P < 0.05), which
indicated that the two Moringa species had differences in emerged seedlings and number
of days. Furthermore, LSB heights per week of the two Moringa species were
significantly different (p < 0.05). Therefore, from the results, the null hypothesis (H01)
that Moringa species were not different in emergence and LSB heights was rejected.
Keywords: Emergence, LSB height, Moringa oleifera, Moringa ovalifolia, nursery
2.2 Introduction
The incorporation of tree and shrub species in livestock production systems is a viable
alternative that could improve the utilization of land resources and the quality of feeds
for livestock species particularly for ruminants (Sanchez et al., 2006). Further, fodder
trees and shrubs are quite essential in livestock farming, particularly in semi-arid
environments where palatable grasses or browsers are scarce predominantly during
times of drought (Franzel et al., 2014). However, the moringa tree species show the
potential to prevent the shortage of feed for livestock.
Moringa oleifera is a native tree to India but has been planted worldwide. It is
naturalized in many countries with a high LSB height and capacity to produce large
quantities of biomass even in poor soils (Alhakman et al., 2013). The leaves have high
nutritional and medicinal benefits and are readily eaten by cattle, sheep, goats, pigs and
rabbits. The leaves contain a high proportion of nutrients such as protein, minerals,
vitamins, carbohydrates, and fats (Olson, 2001; Fuglie, 2001; Moringa Mission Trust,
2005) that are essential for improving the performance of both animals and humans
(Prince, 2007; Thurber & Fahey, 2009; Philips, 2014). Furthermore, Moringa ovalifolia,

15
which also belongs to the Moringaceae family and is described as a bottle tree because
of the shape off its trunk, is native to Namibia and Angola. This species is generally
uncommon but widespread in western Namibia, as far south as 26o S; in scattered
localities in the Karstveld; occasionally in the south; and common in the central areas. It
grows in the wild in both countries (Curtis & Mannheimer, 2005; Van Wyk, Van Wyk,
& Van Wyk, 2011; Makita, Chimuka, Steenkamp, Cukrowska, & Madala, 2016).
Moringa ovalifolia is a small deciduous tree with a distinctive, squat, swollen stem and
branches and is also commonly known as ―ghost tree‖ or ―phantom tree‖. The roots,
bark and wood are eaten by goats; the leaves are also browsed by giraffe (Olson, 2001;
Curtis & Mannheimer, 2005; Van Wyk et al., 2011). However, M. ovalifolia and M.
oleifera are yet to be cultivated, and the agronomical information for their cultivation is
not available in Namibia. This information is vital in order to enable farmers to
understand the appropriate methods required for the cultivation of different species of
moringa as fodder for livestock, particularly during droughts when feedstuffs are most
scarce. Starting with a trial for germination and establishment, could pave a way for the
cultivation of Moringa species for livestock consumption in the country.
Therefore, to fill these gaps, a comparative study was conducted to assess the
performance of M. ovalifolia and M. oleifera for seed germination and seedling
establishment. It was hypothesized that the performance of M. ovalifolia and M. oleifera
in seed germination and seedling establishment do not differ significantly and can adapt
similarly to diverse environmental conditions.

16
With seed propagation, tree and shrub cultivation begins with the sowing of seeds and
raising of seedlings either in the nursery or in the fields. For faster germination, a forced
scarification has to be done on seeds to weaken the seed coats for moisture penetration
under favourable oxygen and temperature conditions. This was done using several
methods, including soaking the seeds in water (Haferkamp, Kissock, & Webster, 1984;
Evans & Blazich, 1999). A germination research study conducted by Saeed and Thanos
(2006) revealed that seed germination were faster when scarification was done before
sowing. Using this method, the final germination was achieved within two weeks. Plants
that have not been domesticated like M. ovalifolia need germination and/or seedling
emergence experimentations to establish the level of scarification, germination,
emergence and the LSB height.
Moringa oleifera is a new and exotic species in Namibia, while M. ovalifolia only grows
in the wild. To the best of our knowledge, there is no known study comparing the
propagation of these two species in Namibia. Therefore, the objective of this study was
firstly to document the agronomy of M. ovalifolia and M. oleifera propagated by seeds
in the nursery and to compare their seedling emergence and LSB heights of both species
under the Namibian conditions. Second, the study aimed to compare their EoE and
adaptability differences at nursery level, since M. ovalifolia was only known to grow in
the wild, while M. oleifera was just being introduced into Namibia. Finally, this research
was undertaken to establish the seedling emergence differences of M. ovalifolia in
comparison to M. oleifera using the same scarification (seed coat treatment) to reduce or
eliminate germination inhibitors as suggested by Haferkamp, Kissock & Webster
(1984).

17
2.3 Materials and Methods
2.3.1 Study Area
This study was conducted from November 2013 to January 2014 at the Neudamm
Campus of the University of Namibia, about 30 km east of Windhoek with an area of 10,
187 hectares of land on the agronomy site of the campus. Neudamm Campus is located
at 22° 30′ 07″ S and at 17° 22′ 14″ E, and at an altitude of 1762 meters above sea level.
Neudamm Experimental Farm‘s temperature ranges between a minimum of -7°C and a
maximum of 44°C (University of Namibia, 2011) and received an annual average
rainfall of 498 mm in the 2013/2014 summer season (P. Beukes, 2017).
The vegetation of Neudamm Experimental Farm is classified as highland savannah
(semi-arid savannah) and is characterized by grasses, shrubs and trees that are well
spread over the farm. An annual grass like Melinis repens and perennial grasses like
Schmidtia pappophoporoides, Anthephora pubescens and Brachiaria nigropedata are
well represented on the farm. Different types of trees like Acacia brownii, Acacia
erioloba, Acacia mellifera as well as shrubs like Grevia flava are found on this farm.
The estimated carrying capacity is about 12 hectares per large stock unit or 45 kg per
hectare biomass (Kahumba, 2010; Kapu, 2012; A. Beukes, 2017).
2.3.2 Experimental Design
A completely randomized design (CRD) was used for the experiment in which seed of
the two species were used for sowing in their shells. The seeds of the two species of
moringa seeds were sown in two plots of 104 polythene bags of M. ovalifolia and 149

18
polythene bags of M. oleifera in rows of 10. The unequal number of polythene bags and
seeds sown was due to the available number of seeds of each Moringa species. From
each moringa type emerged seedling counts were made and height measurements were
randomly taken from 20 seedlings at weekly intervals, as described by Manh, Dung and
Ngoi (2005). Mean were used to determine any differences in seedling emergence and
the seedling LSB heights of both M. oleifera and M. ovalifolia. An independent sample
t-test was used to analyse the data, and parameters such as standard error of means,
standard deviation, means, minimum, maximum, and number of cases were calculated in
the current study. The independent sample t-test was used to determine if there was a
significant difference in seedling emergence and the LSB height of the two Moringa
species. The null hypothesis (H01) that there were no significant differences in the
seedling emergence and LSB height in M. oleifera and M. ovalifolia were tested.
2.3.3 Preparation of Moringa Nursery and Management of Seedlings
In this study, both M. oleifera and M. ovalifolia were propagated by seeds in the nursery
as recommended by Prevost and Le Glorus (1997). The pit soil, river sand, and cow
manure at a ratio of 6:2:3 were thoroughly mixed and filled in one-litre polythene bags
as suggested by Fuglie and Sreeja (2001). Thereafter, the polythene bags were placed in
a wire mesh enclosure to protect them from animals. The filled polythene bags were
watered 24 hours before the seeds were sown. Moringa oleifera and M. ovalifolia seeds
were soaked in hot water that was cooled for 5 minutes after boiling at 100oC, and
overnight as a treatment of the seedcoats before being sown the following day as
described by Haferkamp et al. (1984) and Pace Project (n.d.). Two seeds of each
Moringa species were sown in each polythene bag, as suggested by Sanchez et al.

19
(2006). Seeds are usually planted in nurseries, either bare-rooted or in polythene pots.
Although bare-rooted seedlings cost less to produce than potted seedlings, Franzel et al.
(2014) argued that they are more susceptible to drought after transplanting. Polythene
bags are therefore very important in nursery-making in order to avoid future losses; that
is why they were used in the current study. The seedlings were watered twice a week.
After seedling emergence, the seedlings were thinned to reduce the number of seedlings
to one in each polythene bag. The process of thinning was done after watering the
seedlings for easy uprooting and transplanting of thinned seedlings in other polythene
bags with the same soil content mixture. The transplanted seedlings were placed in the
shade for a week to avoid sun stress after transplanting.
2.3.4 Procedures for Data Collection
The seedling emergence of both Moringa species was thoroughly monitored and
recorded on daily and weekly in the nursery. Moringa ovalifolia seedling emergence
started on the seventh day with two shoots. However, growth measurement only started
on the eleventh day when the shoots had completely surfaced with at least two leaves.
On the other hand, seedling emergence of M. oleifera started on the twelfth day and was
also only measured after it had fully surfaced with two leaves. The EoE of thinned
seedlings was monitored and recorded to determine their adaptability. This was done by
monitoring them on a daily basis to see if there was any mortality until they had properly
recovered and were well established. In this study, heights of M. ovalifolia and M.
oleifera seedlings were measured to determine their LSB heights at nursery level. The
heights of seedlings were measured using the method suggested by Heady (1957): from

20
the ground surface to the tip of the plant leaves, using a 30-centimeter ruler with the
ruler placed vertically along-side the plant. The heights of 20 seedlings were measured
for each Moringa species on a weekly basis, as suggested by Manh et al. (2005).
Average heights were determined during each set of measurement.
2.3.4 Data Analysis
Independent sample t-tests were used for data analysis using Statistical Package for
Social Sciences (SPSS® version 23) and determined differences between M. oleifera and
M. ovalifolia seedling emergence and height increments. All statistical analyses were
only considered significantly different at the alpha levels of p ≤ 0.05, and all p-values
above these alpha levels were considered non-significant. Microsoft Office Excel®
2010
was used to derive averages of emerged seedlings and height increments that were used
for all data analyses as well as the figure.
2.4 Results and Discussion
The results of the present study indicated that both M. ovalifolia seeds and M. oleifera
seeds started to emerge in the second week; however, M. ovalifolia seeds started to
emerge earlier — on day 7, while M. oleifera seeds only started to emerge from day 11
after sowing. The results agree with those reported by Fuglie & Sreeja (2001) who found
that M. oleifera starts to germinate and emerge within 5-12 days. They are also in
agreement with the findings of a study conducted in Malawi and a review which
reported that viable M. oleifera seeds germinate within two weeks (Nalivate et al.,
2011; Leone et al., 2015). The early seedling emergence of M. ovalifolia observed in the
present study could probably be attributed to the quality of its seeds. Further, the results

21
showed that on the 11th
day, the percentage of emerged seedlings of M. ovalifolia in
polythene bags was higher (72%) than that of M. oleifera (only 3.8%). The results
revealed that M. ovalifolia ended seedling emergence earlier—in the 3rd
week (day 18),
with a higher overall emergence rate (99.03%), whereas M. oleifera ended relatively
late—in the 4th week (day 28) with a lower overall seedling emergence rate of 25.17%.
These results are in disagreement with those reported by KOMEHO Namibia (2015) that
obtained a 98% seedling emergence rate for M. oleifera seeds. This discrepancy
probably could be attributed to differences in harvesting time of the seeds (possibly
immature seeds) and/or poor storage conditions (Fuglie & Sreeja, 2001). Another reason
for the discrepancy might be attributed to the long-time storage of the seeds. In fact,
Leone et al. (2015) discussed that M. oleifera seed viability decreases if they remain at
ambient temperature and high relative humidity, their germination rate dropping to
7.50% after three months. On the other hand, out of the 97 M. ovalifolia thinned
seedlings, only 18 (18.55%) died while out of 8 M. oleifera thinned seedlings, 2 (25%)
died.
2.4.1 Seedling Emergence and Establishment
The seeds of both Moringa species were soaked in hot water overnight and sown the
following day. According to the Pace Project (n.d.), the following method would get the
seeds to germinate quickly. That is, boil some water, cool it for 5 minutes and then soak
the seeds overnight, using at least three times more water than seeds to cover the seeds
completely. Scarification, which is considered to be safer under semi-arid conditions as
is the case of Namibia, also speeds up the seed germination and seedling emergence
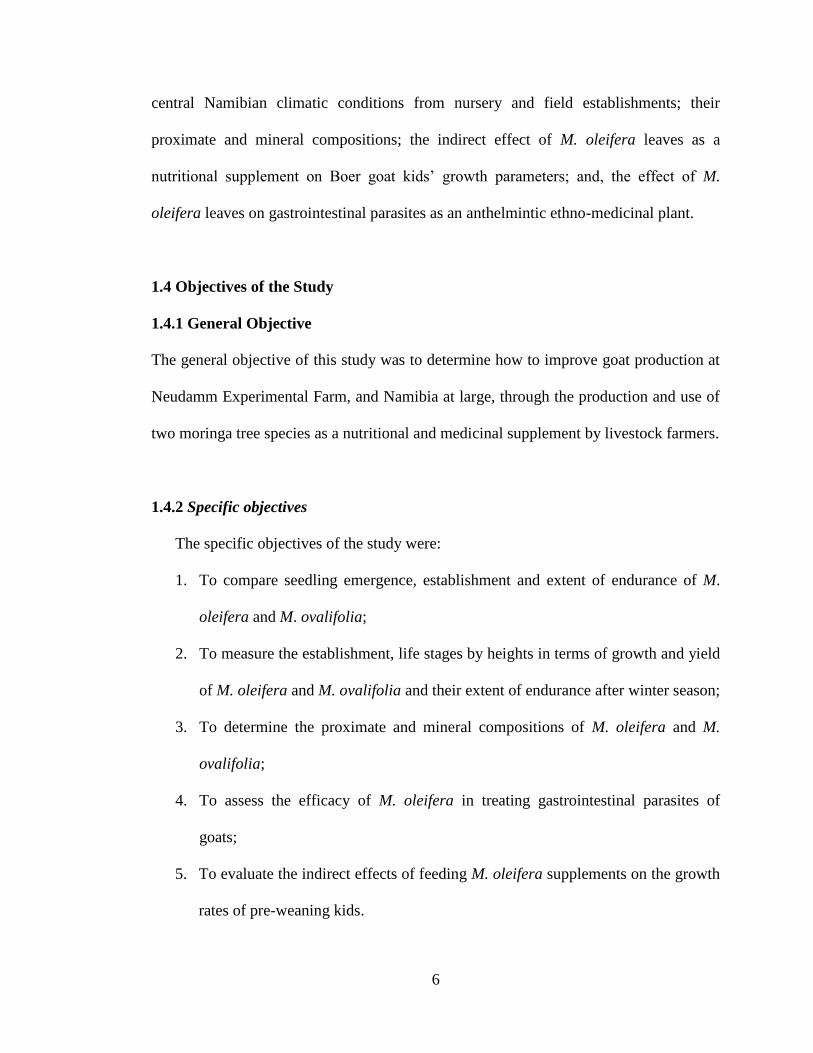
processes. Tables 2.1 and 2.2 show the results of M. ovalifolia and M. oleifera
22
cumulative seedling emergence per polythene bag over a period of time. Accordingly,
M. ovalifolia started emerging on the 7th
day, with two shoots (0.96%) while for M.
oleifera seedling emergence started on the 11th
day with 4 shoots (1.34%). Furthermore,
M. ovalifolia emerged more rapidly within 18 days (3 weeks) of sowing with a 99.03%
seedling emergence rate (208 seeds sown in 104 polythene bags). All the 104 (100%)
polythene bags had emerged seedlings. Conversely, M. oleifera emerged slowly within
28 days (4 weeks) with a 15.06% seedling emergence rate (75 out of 298 seeds).
Seventy-four out of 149 (49.66%) polythene bags had emerged seedlings.
A germination test conducted by Haferkamp et al. (1984) showed that final germination
was more than 75%, although the speed of germination was slower. Germination was
considered completed when there were no additional seeds germinated, as described by
Saeed & Thanos (2006). Besides the viability of the seeds, M. ovalifolia seeds are
smaller with softer seed coats when compared to M. oleifera seeds. This also may have
contributed to the faster and more rapid seed germination and seedling emergence rate of
M. ovalifolia.
Table 2.1: Daily and cumulative seedling emergence of M. ovalifolia
Emergence
after sowing
(days)
Emerged
seedlings
(cumulative)
Difference in
seedlings‘
emergence
Emergence
rate (%)
Number of
polythene bags
Percent of
polythene bags
7 2 2 0.96 2 0.96
9 50 48 24.04 30 28.84
11 113 63 54.34 75 72.11
13 136 23 65.38 100 96.15
16 203 67 97.59 104 100.00
18 206 3 99.03 104 100.00

23
Table 2.2: Daily and cumulative seedling emergence of M. oleifera
Emergence
after sowing
(days)
Emerged
seedlings
(cumulative)
Difference in
seedlings‘
emergence
Emergence
rate (%)
Number of
polythene bags
Percent of
Polythene bags
7 0 0 0.00 0 0.00
9 0 0 0.00 0 0.00
11 4 4 1.34 4 2.68
13 20 16 6.71 19 12.75
16 32 12 10.74 29 19.46
18 53 21 17.79 47 31.54
25 55 2 18.46 50 33.56
28 75 20 25.17 74 49.66
Table 2.3 presents the descriptive statistics for seedling emergence. From the means of
the two species, M. ovalifolia had a higher number of seedlings that emerged (118.33),
whereas the number of M. oleifera seedlings that emerged was relatively lower (29.88)
but could still be placed in the maximum column. In addition, the mean statistical
analysis result of the cumulative number of seeds that emerged and emergence days can
be found in Table 2.4.
Table 2.3: Moringa species seedling emergence over time (days)
Moringa seeds
N
Mean
Standard
Deviation
Standard
Error Mean
Minimum
Maximum
M. ovalifolia 6 118.33 81.73 33.37 2.00 67.00
M. oleifera 8 29.88 28.68 10.14 0.00 21.00
Note: mean of emerged seedlings

24
Table 2.4: Emergence of Moringa species over time (days)
Emerged seedlings
Time
(Days)
Mean
Emergence
Moringa
spp.
Standard
Deviation
Standard Error
of Mean Minimum Maximum
7 1.00 2 1.41 1.00 0.00 2.00
9 25.00 2 35.36 25.00 0.00 50.00
11 58.50 2 77.07 54.50 4.00 113.00
13 78.00 2 82.02 58.00 20.00 136.00
16 117.50 2 120.92 85.50 32.00 203.00
18 129.50 2 108.19 76.50 53.00 206.00
25 55.00 1 0.00 0.00 55.00 55.00
28 75.00 1 0.00 0.00 75.00 75.00
Note: Mean emerged seedlings
An independent sample t-test (Table 2.5) was used to compare the means of M.
ovalifolia and M. oleifera‘s emerged seedlings. The result of the analysis revealed that
there was a mean difference of 88.46 emerged seedlings, which led to a significant
difference (P < 0.05) in emerged seedlings between the two Moringa species. The results
of the statistical analysis thus support the information on seedling emergence presented
in Table 2.3 in which M. ovalifolia had a mean of 118.33 emerged seedlings while M.
oleifera had 29.88 emerged seedlings. Tables 2.1 and 2.2 also occurred with the
difference between the two Moringa species emerged seedlings. The difference in seed
germination and seedling emergence between the two Moringa species may rather be
attributed to the thinness of their seedcoats than to the number of days. M. ovalifolia
seedcoats are thinner and softer than M. oleifera seed coats. They may therefore
germinate and emerge faster due to their permeability and gaseous exchange ability.
This was demonstrated by Saeed and Thanos (2006), who observed that thin and soft
seed coats are readily permeable to water and gaseous exchange in the first few days of
imbibition when seeds are in ―activation‖ stages, with an increased requirement for
oxygen, which speeds up germination. Hence, the null hypothesis that there is no
significant difference between Moringa species seedling emergence is rejected.

25
Table 2.5: Independent sample test of Moringa species emerged seedlings
Moringa species
Mean
Difference
Pooled
Standard Error
Difference
t
df Sig. (2-tailed)
Emerged seedlings 88.46 30.85 2.87 12 0.014*
Note: Mean difference in emerged seedlings; * = significant at 0.05 alpha levels
2.4.2 Seedling Extent of Endurance and Mortality
These results show that emergence is higher around days 16 and 18 (week 3) with means
of 117.5 and 129.5 respectively. Seedling mortality of M. oleifera and M. ovalifolia in
the current study due to cold (frost), pests, thinning effect and waterlog are presented in
Tables 2.6, 2.7 and 2.8, respectively. During the period under study, 38 (18.44%)
seedlings died out of 206 of M. ovalifolia seedlings which had emerged and 5 (6.66%)
out of 75 M. oleifera seedlings, which brings the total mortality cases to 43 out of 281
total seedlings (15.30%). Overall, M. ovalifolia had 81.56% of EoE while M. oleifera‘s
EoE was 93.33%, which gives a total cumulative EoE of 84.70%. This indicates that M.
oleifera had greater EoE and adaptability compared to M. ovalifolia. Since seedling
mortality was due to cold, waterlog, thinning effect and pests, the EoE‘s difference of
the two species may be attributed to the difference between the diameters of their shoots,
as observed. Indeed, M. oleifera shoots had larger diameters and circumferences than M.
ovalifolia, giving them an EoE and adaptability edge in this harsh environment that gets
either too cold or too hot at any given time. Hassan and Ibrahim (2013) stated that M.
oleifera tree is tolerant to light frosts, but as a perennial crop, cannot survive under
freezing conditions. Bey (2010) supported that M. oleifera is found in many tropical and
sub-tropical regions, and can be grown in even the harshest and driest of soils, where
barely anything else will grow. It was emphasized that one of the nicknames of M.

26
oleifera is ―never-die‖ due to its incredible ability to survive harsh weather including
droughts, which is typical of Namibian climatic conditions. Statistically, an independent
t-test of Moringa species seedling mortality (Table 2.7) results showed no significant
difference (P > 0.05) between M. ovalifolia and M. oleifera, which is buttressed in Table
2.8 that presents the descriptive statistics where there was mean mortality for M.
ovalifolia 7.8, while that of M. oleifera was 1.00.
Table 2.6: Cumulative mortality of moringa seedlings
Moringa
species
Mortality
after
emergence
Mortality
due to cold
(frost)
Mortality
due to pests
Mortality
after
thinning
Mortality due
to waterlog
(rain)
Total
mortality
Mortality
(%)
M. ovalifolia 5 4 2 18 9 38 18.45
M. oleifera 1 2 0 2 0 5 6.67
Total 6 6 2 20 9 43 15.30
Table 2.7: Independent t-test for Moringa species seedling mortality differences
Levene's Test for
Equality of
Variances
t-test for Equality of Means
Mortality F Sig. t df
Sig.
(2-tailed)
Mean
Difference
Standard
Error
Difference
95%
Confidence
Interval of the
Difference
Lower Upper
Equal variances
assumed 5.48 0.047* 2.41 8 0.042 6.80 2.82 0.30 13.30
Equal variances
not assumed 2.41 4.21 0.070ns 6.80 2.82 -0.87 14.48
Note: Mean difference of dead seedlings; ns = non-significant; * = significant at 0.05 alpha level
Table 2.8: Descriptive statistics of Moringa species seedling mortality
differences
Moringa species N Mean
Standard
Deviation
Standard
Error Mean
Mortality M. ovalifolia 5 7.80 6.22 2.78
M. oleifera 5 1.00 1.00 0.45
Note: Mean of dead seedlings
27
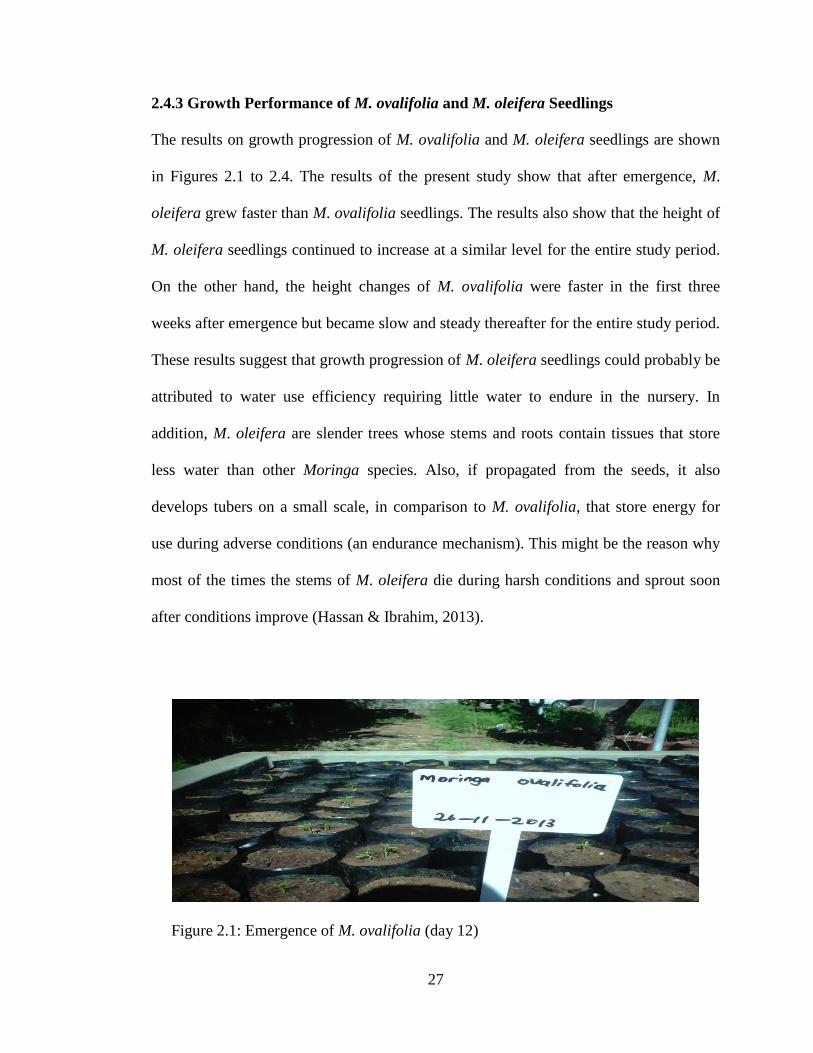
2.4.3 Growth Performance of M. ovalifolia and M. oleifera Seedlings
The results on growth progression of M. ovalifolia and M. oleifera seedlings are shown
in Figures 2.1 to 2.4. The results of the present study show that after emergence, M.
oleifera grew faster than M. ovalifolia seedlings. The results also show that the height of
M. oleifera seedlings continued to increase at a similar level for the entire study period.
On the other hand, the height changes of M. ovalifolia were faster in the first three
weeks after emergence but became slow and steady thereafter for the entire study period.
These results suggest that growth progression of M. oleifera seedlings could probably be
attributed to water use efficiency requiring little water to endure in the nursery. In
addition, M. oleifera are slender trees whose stems and roots contain tissues that store
less water than other Moringa species. Also, if propagated from the seeds, it also
develops tubers on a small scale, in comparison to M. ovalifolia, that store energy for
use during adverse conditions (an endurance mechanism). This might be the reason why
most of the times the stems of M. oleifera die during harsh conditions and sprout soon
after conditions improve (Hassan & Ibrahim, 2013).
Figure 2.1: Emergence of M. ovalifolia (day 12)

28
Figure 2.2: Emergence of M. oleifera (day 12)
Figure 2.3: Performance of M. ovalifolia seedlings at day 25
Figure 2.4: Performance of M. oleifera seedlings at day 25

29
The descriptive statistics of M. oleifera and M. ovalifolia weekly LSB heights showing
mean, standard deviation and standard error of mean are presented in Table 2.9. The
result showed a continuous weekly growth in heights for both Moringa species, except
for week two when M. oleifera seedlings had not emerged properly for measurement of
heights. This resulted in the zero heights of M. oleifera for week two. However, M.
oleifera grew faster than M. ovalifolia in LSB heights even though the later emerged
earlier.
Table 2.9: Descriptive statistics of Moringa species weekly LBS heights
Weeks Moringa species N Mean
Standard
Deviation
Standard
Error Mean
2
M. ovalifolia 20 2.48 0.44 0.10
M. oleifera 20 0.00 0.00 0.00
3
M. ovalifolia 20 4.38 0.46 0.10
M. oleifera 20 4.00 0.00 0.00
4
M. ovalifolia 20 7.43 1.13 0.25
M. oleifera 20 8.20 1.67 0.37
5
M. ovalifolia 20 8.83 1.57 0.35
M. oleifera 20 10.33 1.10 0.25
6
M. ovalifolia 20 9.28 1.09 0.25
M. oleifera 20 12.00 0.76 0.17
7
M. ovalifolia 20 9.35 1.09 0.24
M. oleifera 20 16.13 1.22 0.27
Note: Mean of seedling heights
Table 2.10 presents an independent sample test of the two Moringa species weekly LSB
heights. The result of the analysis showed highly significant differences (P < 0.05)
between M. oleifera and M. ovalifolia weekly growth in LSB heights, except for week 4
that had no difference. This means that the two species grew at different levels over time
as seen in Table 2.9. Moringa oleifera grew faster and increased more in weekly LSB
heights than M. ovalifolia, even though it emerged later. Thus, the null hypothesis that
there was no significant difference between M. oleifera and M. ovalifolia in weekly LSB

30
heights was rejected. Literature concurs with the faster growth of M. oleifera, suggesting
that it is based on one of its active substances known as Zeatin, a plant hormone from
the cytokines group that supports faster plant growth. This may account for the faster
growth of M. oleifera in comparison to its counterpart M. ovalifolia (Bey, 2010; Leone
et al., 2015).
Table 2.10: Independent sample test of Moringa species weekly LSB
heights
Weeks
Mean
Difference
Pooled Standard
Error Difference
t
df
Sig. (2-tailed)
2 -2.48 0.10 -24.96 38 0.000***
3 -0.38 0.10 -3.68 38 0.001***
4 0.78 0.45 1.72 38 0.094ns
5 1.50 0.43 3.50 38 0.001***
6 2.73 0.30 9.15 38 0.000***
7 6.78 0.37 18.50 38 0.000***
Note: Mean difference in seedling heights; ns = non-significant at 0.05; *** =
extremely significant to ≤ 0.001 alpha levels
Figure 2.5 shows the average heights of M. oleifera and M. ovalifolia over time in
weeks. It was noticed that M. ovalifolia grew faster at first and slowed down later.
Besides emergence that was slower, M. oleifera grew at the same level throughout the
research period. This contributed to M. oleifera‘s increase in elongation compared to M.
ovalifolia. The result shows that the highest LSB heights attainment was observed in M.
ovalifolia seedlings from 2 week till week 5. This could be due to the development of its
sprout. Height increase is most active during the first months of the cycle under
favourable environmental conditions as suggested by Prevost and Le Glorus (1997).
The LSB height observed in M. ovalifolia seedlings between week five and week seven

31
after emergence in the present study could probably be due to roots development into
tubers to serve as a support for its further elongation.
Figure 2.5: Average weekly growth in heights of the two Moringa species
As a semi-arid climatic plant, M. ovalifolia develops tubers as early as possible for
energy storage (Figure 2.6). Energy is being accumulated into the developed tuberous
roots as an endurance mechanism against harsh environmental limiting factors such as
winter or drought that affect light, temperature, atmosphere, water as well as nutrients
which are contributing factors to plant productivity (Haferkamp, 1988). Besides the
absorption of water and nutrients needed by the roots, they produce growth substances
that are used for the normal functioning of the plant. In addition, they serve as storage of
food materials as in the case of root crops such as cassava and carrot (AVRDC, 1990).
This is also the case with M. oleifera roots on a lesser scale in comparison to M.
ovalifolia roots, because M. oleifera contains stems within their roots while M. ovalifolia
roots are complete tubers (no stems). Further, M. ovalifolia belongs to bottle trees which
0
4.00
8.2
10.33
12.00
16.13
2.48
4.38 7.43
8.83 9.28 9.35
0
2
4
6
8
10
12
14
16
18
2 3 4 5 6 7
Gro
wth
in h
eights
(cm
)
Growing weeks
M. oleifera
M. ovalifolia

32
are filled with pulpy water-storing tissues (Olson, 2001) which helps them to endure in
dry environments.
Figure 2.6: Special ―tuberous‖ roots of M. ovalifolia at 4 months
2.5 Conclusion
In conclusion, this study was able to reveal that M. oleifera seeds had a lower emergence
than M. ovalifolia seeds, which might be attributed to differences in harvesting time and
post-harvest storage. However, M. oleifera seedlings had higher LSB heights than M.
ovalifolia that had lower LSB height extension over time. The thinned and transplanted
seedlings of M. oleifera had higher EoE of 93.33% and lower mortality of 6.67%
compared to M. ovalifolia that had 81.56% and 18.44% for EoE and mortality,
respectively. Based on its fast growth, M. oleifera cultivation can be encouraged in
Namibia, which is predominantly semi-arid. In addition, M. oleifera being a ―never-die‖
tree has the ability to withstand the drought and water shortages that are frequent in
Namibia. Due to its fast LSB height increase, M. oleifera has a high leaf-dry matter

33
production ability which can be used as animal feed or supplement. Similarly, M.
ovalifolia cultivation should be encouraged since it is indigenous to Namibia, grows in
the wild and has the ability to endure on its own with little care. Ecologically, due to its
adaptability to this region, it will have an edge of endurance over M. oleifera, which is
exotic to Namibia. Although it grows more slowly and produces little leaf-dry matter at
first, once established, it can grow into a bigger tree with more leaf-dry matter. This can
even be enhanced by domestication of this species since it is an endangered species.
However, the major challenge to the cultivation of M. oleifera in Namibia is its
susceptibility frost. Nevertheless, the cultivation of both Moringa species is important
for the dry environmental conditions of Namibian.
References
Alhakman, F., Kumar, S., & Khan, S. (2013). Estimation of total phenolic content, in-
vitro antioxidant and anti-inflammatory activity of flowers of Moringa oleifera.
Asian Pacific Journal of Tropical Biomedicine, 3(8), 623–627.
https://doi.org/10.1016/S2221-1691(13)60126-4
AVRDC. (1990). Vegetable production training manual. Asian Vegetable Research and
Development Center (AVRDC). Retrieved from
http://pdf.usaid.gov/pdf_docs/PNABG526.pdf
Beukes, A. (2017, March 15). Vegetation of Neudamm Experimental Farm.
Beukes, P. (2017). Average annual rainfall of Neudamm Experimental Farm from 1974
to 2016 (Meteorological) (pp. 1–2). Namibia: University of Namibia.
Bey, H. (2010). All things moringa: the story of an amazing tree of life.
Http://Www.allthingsmoringa.com/eBook.pdf, 1–40.

34
Curtis, B., & Mannheimer, C. (2005). Tree Atlas of Namibia. Windhoek, Namibia: The
National Botanical Institute.
Evans, E., & Blazich, F. (1999, January). Overcoming seed dormancy: Trees and shrubs.
North Carolina State University College of Agriculture & Life Sciences.
Retrieved from http://content.ces.ncsu.edu/overcoming-seed-dormancy-trees-
and-shrubs
Franzel, S., Carsan, S., Lukuyu, B., Sinja, J., & Wambugu, C. (2014). Fodder trees for
improving livestock productivity and smallholder livelihoods in Africa. Elsevier
Inc. on ScienceDirect, 6, 98–103.
Fuglie, L. (2001). Introduction to the multiple uses of moringa. In The miracle tree: The
multiple attributes of Moringa (pp. 7–10). Dakar, Senegal: CTA and CWS.
Fuglie, L., & Sreeja, V. (2001). Cultivation of moringa. In The miracle tree: The
multiple attributes of moringa (pp. 153–158). Dakar, Senegal: CTA and CWS.
Haferkamp, M. (1988). Environmental factors affecting plant productivity. Montana
Agri. Exp. Sta., Bozeman, 132.
Haferkamp, M., Kissock, D., & Webster, R. (1984). Impact of presowing seed
treatments, temperature and seed coats on germination of Velvet Bundleflower.
Journal of Range Management, 37(2). Retrieved from
http://oregonstate.edu/dept/eoarc/sites/default/files/publication/273.pdf
Hassan, F., & Ibrahim, M. (2013). Moringa oleifera: Nature is most nutritious and multi-
purpose Tree, 3(4). Retrieved from www.ijsrp.org
Heady, H. (1957). The measurement and value of plant height in the study of herbaceous
vegetation. Ecological Society of America (JSTOR), 38(2), 313–320.

35
Kahumba, A. (2010, November). Comparison of the rehabilitative effects of mechanical
and chemical methods of bush control on degraded Highland Savanna
rangelands in Namibia. University of Namibia, Windhoek, Namibia.
Kapu, N. (2012). Assessment of rangeland condition and evaluation of the nutritional
value of common grass and browse species at the Neudamm Experimental Farm,
Namibia. University of Namibia, Windhoek, Namibia. Retrieved from
www.unam.na
KOMEHO Namibia. (2015, April 30). Unleashing the potential of improving rural
incomes and nutrition through cultivation and use of the moringa tree.
Leone, A., Spada, A., Battezzati, A., Schiraldi, A., Aristil, J., & Bertoli, S. (2015).
Cultivation, genetic, ethnopharmacology, phytochemistry and pharmacology of
Moringa oleifera leaves: An overview. International Journal of Molecular
Science, 16, 12791–12835. https://doi.org/10.3390/ijms160612791
Makita, C., Chimuka, L., Steenkamp, P., Cukrowska, E., & Madala, E. (2016).
Comparative analyses of flavonoid content in Moringa oleifera and Moringa
ovalifolia with the aid of UHPLC-qTOF-MS fingerprinting. South African
Journal of Botany on Science Direct, 105, 116–122.
Manh, L., Dung, N., & Ngoi, T. (2005). Introduction and evaluation of Moringa oleifera
for biomass production and as feed for goats in the Mekong Delta. Livestock
Research for Rural Development, 17(9). Retrieved from
http://www.lrrd.org/lrrd17/9/manh17104.htm
Moringa Mission Trust. (2005). Moringa facts: Moringa oleifera nutritional values of
leaves and pods [http://moringahope.com/moringa_Facts.html].

36
Nalivate, P., Kachamba, D., Mtethiwa, A., Njoloma, J., Makumba, W., Mwase, W., …
Jeng, A. (2011, March). Biofuel crops production in Malawi: Principles and crop
management practices. Bunda College of Agriculture (Malawi). Retrieved from
http://www.bioforsk.no/ikbViewer/page/tjenester/publikasjoner/publikasjon?p_d
ocument_id=87360
Olson, M. E. (2001). Introduction to the moringa family. In L. Fuglie (Ed.), The miracle
tree: The multiple attributes of Moringa (pp. 11–28). Dakar, Senegal: CTA and
CWS.
Pace Project. (n.d.). Planting fodder banks for livestock. Pace Project, 37. Retrieved
from http://www.doc-developpement-durable.org/file/programmes-de-
sensibilisations/forets-protection/planting_fodder_PACE.pdf
Philips, L. (2014, May 23). Moringa: superfood for the hungry. Farmer’s Weekly, 54–
56.
Prevost, P., & Le Glorus, P. (1997). Fundamentals of modern agriculture. United States
of America: Science Publishers, Inc.
Prince, M. (2007). ECHO Technical Note: The moringa tree, 1–19.
Saeed, M., & Thanos, C. (2006). The effect of seeds coat removal on seed germination
of pinus gerardiana Wallich ex D. Don. Chilogoza pine. J. App. Em. Sc., 1(3),
174–177.
Sanchez, N., Ledin, S., & Ledin, I. (2006). Biomass production and chemical
composition of Moringa oleifera under different management regimes in
Nicaragua. Springer, 66, 231–242. https://doi.org/10.1007/s10457-005-8847-y

37
Thurber, M., & Fahey, J. (2009). Adoption of Moringa oleifera to combat under-
nutrition viewed through the lens of the ―Diffusion of Innovations‖ theory. Ecol
Food Nutr, 48(3), 212–225. https://doi.org/10.1080/03670240902794598
University of Namibia. (2011). Neudamm Agricultural College Farm. University of
Namibia. Retrieved from http://digital.unam.na/handle/11070.1/4461?show=full
Van Wyk, B., Van Wyk, P., & Van Wyk, B. (2011). Photo guide to trees of southern
Africa (Vol. 1). Pretoria, South Africa: Briza Publications.

38
Chapter 3
Field Establishment, Extent of Endurance and Yield of Moringa oleifera and
Moringa ovalifolia in a Semi-arid Environment: The Case of Central Namibia
Rangeland
3.1 Abstract
The objectives of this chapter were to study the life stages by (LSB) height, leaf-dry-
matter yields and extent of endurance (EoE) of Moringa oleifera and Moringa ovalifolia
grown in central Namibia rangeland. Since this central part of Namibia is semi-arid, the
growing of drought-resistant fodder trees to aid in the provision of animal fodder or
supplement is essential and of paramount importance to livestock farmers. It is upon this
background that both Moringa species were grown to evaluate their LSB heights and
EoE as well as their leaf-dry-matter yields. If these fodder plants are proven to withstand
the harsh environmental conditions; namely, cold winter and constant drought, they may
be used to boost the animal production sector of Namibia. The results of statistical
analyses revealed that M. oleifera and M. ovalifolia LSB heights, EoE and leaf-dry-
matter yields were significantly different (P < 0.05) even though they are from the same
family and were grown under the same conditions. Thus, M. oleifera grew faster (224.90
cm and 281.45 cm) in LSB heights and yielded more leaf-dry matter (482.93
kg/ha/season and 297.60 kg/ha/season) in the two summer seasons (2014/2015 and
2015/2016). On the other hand, M. ovalifolia had LSB heights of 78.80 cm and 113.20
cm and yields of 94.67 kg/ha/season and 76.81 kg/ha/season, respectively for the
indicated seasons, although M. ovalifolia is an indigenous tree of Namibia. For the EoE,
M. ovalifolia had a higher EoE of 81.25% after winter in the first season (2014/2015)

39
than M. oleifera that had 70.83%; however, M. oleifera (97.50%) surpassed M.
ovalifolia (82.69%) in the second season (2015/2016) due to its faster root-system
establishment. Hence, M. oleifera would serve as a better alternative for improving
rangeland productivity under these adverse climatic and environmental conditions, since
it can produce enough leaf-dry matter and has a higher EoE after winter than M.
ovalifolia. Therefore, the hypothesis (H02) that M. oleifera and M. ovalifolia do not vary
in LSB heights and leaf-dry-matter yields and EoE after winter in central Namibia is
rejected because they differ in all parameters.
Keywords: Extent of endurance, life stages by height, leaf-dry-matter yield, Moringa
oleifera, Moringa ovalifolia
3.2 Introduction
There are 13 known species of moringa trees belonging to the Moringaceae family.
These species are divided into three groups based on the shapes of their trunks: slender
trees, bottle trees and tuberous shrubs. The slender trees are: Moringa oleifera of India,
Moringa concanensis of India, Pakistan and Bangladesh, and Moringa peregrina of
Arabia, the Red Sea area, Egypt, Sinai, Israel and Sudan. The bottle trees include:
Moringa ovalifolia of Namibia and Angola, Moringa drouhardii and Moringa
hildebrandtii of Madagascar; and Moringa stenopetala of Ethiopia and Kenya. The
tuberous shrubs and trees of northeast Africa comprise the last group: Moringa Arborea
of Kenya; M. rivae of Kenya and Ethiopia; Moringa borziana of Kenya and Somalia,
Moringa pygmaea of Somalia; Moringa longituba of Kenya, Ethiopia and Somalia; and
Moringa ruspoliana of Kenya, Ethiopia and Somalia (Fuglie, 2001; Olson, 2001; Prince,
2007). Although there are many Moringa species, M. oleifera is the plant most adapted

40
worldwide, compared to the other species; it is also the most widely known and studied
species (Prince, 2007; Leone et al., 2015). Many research studies have been done on its
uses and numerous beneficial properties in the plant kingdom (Edward, Chamshama,
Ngaga, & Mndolwa, 2014; Fuglie, 2001).
Moringa oleifera is a fast-growing and drought-resistant tree that is native to the
southern foothills of the Himalayas in northern India (Fuglie, 2001; Radovich, 2007). It
is commonly known as horse-radish or drumstick tree in English (Moringa Mission
Trust, 2005). It grows rapidly even in poor soils, and arid-lands (Alhakman et al., 2013;
Morton, 1991). Although native to India, it has been planted around the world and is
naturalized in many countries (Sanchez et al., 2006; Sanchez-Machado, Núñez-
Gastélum, Reyes-Moreno, Ramírez-Wong, & López-Cervantes, 2010). For instance, it is
commonly cultivated throughout Senegal as a living fence around compounds in villages
(Ojukwu, 2012). Other examples of moringa growing in African countries showed that
the seeds germinate within 5 to 12 days and are transplanted at the height of 60 to 90 cm.
Moringa oleifera can tolerate up to 6 months of dry season reasonably well; however,
prolonged stress from lack of water can lead to loss of leaves (Fuglie, 2001; Sanchez et
al., 2006). It grows rapidly and has the capacity to produce large quantities of fresh
biomass (Sanchez et al., 2006). A research study done at the International
Trypanotolerance Centre in Banjul (The Gambia) showed that M. oleifera could yield
biomass in excess of 15 tonnes dry matter/hectare (DM/ha) in a 60-day growing cycle
(Akinbamijo et al., n.d.).

41
On the other hand, M. ovalifolia, which is described as a bottle tree because of the shape
of its trunk, is native to Namibia and Angola. This species is uncommonly found in the
central areas of Namibia, and is widespread in western region as far south as 26o S.
However, it is generally uncommon in many other areas of Namibia. Moringa ovalifolia
can be found in scattered localities in the Karstveld and occasionally in the south. It
grows in the wild in both Namibia and Angola. It is a deciduous tree with a distinctive,
squat, swollen stem and branches and is commonly known as ―ghost tree or phantom
tree‖. The roots, bark and wood are eaten by goats and the leaves are also browsed by
giraffe (Curtis & Mannheimer, 2005; Olson, 2001; Van Wyk et al., 2011). Under
cultivation, M. ovalifolia grows fast in height in the first three weeks of development at
nursery level, after which growth becomes slower for root development (Korsor et al.,
2016).
The problem is that Namibia is both an arid and a semi-arid country with low rainfall
and persistent drought occurrences that adversely affect rangeland productivity and
livestock production. (Agra Professional Services, 2013; Van Schalkwyk, 2014)
described Namibia as a country with the driest climate in sub-Saharan Africa. Sijssens
(2014) concluded that the production of additional fodder from dry-land, cultivated grass
pastures and plantations of drought-tolerant fodder shrubs should become a priority in
Namibia; hence, emphasizing that livestock production should no longer be dependent
solely on highly sensitive native rangeland but should also include other sources of
fodder. Therefore, M. oleifera, which is known to be a fast-growing and drought-tolerant
fodder and medicinal tree, could serve the purpose of Namibia‘s rangeland improvement
through its incorporation into rangelands along with M. ovalifolia, which is to some

42
extent slower growing in LSB height and less productive at first, but has proved to be a
highly drought-tolerant tree.
3.3 Materials and Methods
3.3.1 Study Area
A moringa orchard of 0.21 hectares (0.11 hectares for M. oleifera and 0.10 hectares for
M. ovalifolia) was established in 2014 at the Neudamm Experimental Farm of the
University of Namibia, about 30 km east of Windhoek, with an area of 10, 177 hectares.
It was carried out over two summer-growing seasons of 2014/2015 and 2015/2016 for
LSB height and leaf-dry-matter yield, and three winter seasons of 2014, 2015 and 2016
for EoE, starting from February 2014 and ending in January 2017. Neudamm Campus is
located at 22° 30′ 07″ S and 17° 22′ 14 E, and at an altitude of 1762 meters above sea
level. The farm‘s temperature ranges between a minimum of -7°C and a maximum of
44°C (University of Namibia, 2011), and received annual average rainfall of 229 mm,
247.8 mm and 368 mm in 2014/2015, 2015/2016 and 2016/2017 summer seasons,
respectively (P. Beukes, 2017).
The vegetation of Neudamm Farm is classified as highland savannah (semi-arid
savannah) and characterized by grasses, shrubs and trees that are well spread over the
farm. An annual grass like Melinis repens and perennial grasses like Schmidtia
pappophoporoides, Anthephora pubescens and Brachiaria nigropedata are well
represented on the farm. Different types of trees like Acacia brownii, Acacia erioloba,
Acacia mellifera as well as shrubs like Grevia flava, are found on Neudamm

43
Experimental Farm. The estimated carrying capacity is about 12 hectares per large stock
unit or 45 kg per hectare biomass (Kahumba, 2010; Kapu, 2012; A. Beukes, 2017).
3.3.2 Experimental Design
A completely randomized design (CRD) was used for this study for both M. oleifera and
M. ovalifolia. In February 2014, 120 M. oleifera and 64 M. ovalifolia two-months old
seedlings were transplanted on the field at spacing distances of 2.5 m x 2.5 m and 3 m x
3 m for M. oleifera, as suggested by Fuglie and Sreeja (2001) and Radovich (2007), and
distances of 3 m x 3 m, 3.5 m x 3.5 m, 4 m x 4 m and 4.5 m x 4.5 m for M. ovalifolia
between rows and plants, respectively. The four spacing distances for M. ovalifolia were
meant to determine the appropriate spacing distances since there is no knowledge of its
domestication. For M. oleifera, the field was divided into two plots with four microplots
within each plot. Fifteen seedlings were transplanted into each microplot, which
amounted to 120 trees. Moringa ovalifolia, on the other hand, had four spacing distances
with four microplots which had 16 plants each, amounting to 64 seedlings. Moringa
oleifera had more seedlings transplanted than M. ovalifolia due to the limited number of
available M. ovalifolia seedlings at the time of planting although the study intended to
have equal of trees planted for both Moringa species.
3.3.3 Field Preparation and Transplanting of Seedlings
The field was an old cereal production site that had no trees or stumps to uproot.
Clearing of grass and ploughing were done concurrently on the field using a tractor,
which incorporated the grass into the soil. Since it was a rainy season, the field was left
for the grass to rot within a month before transplanting as suggested by Onwueme and

44
Sinha (1991). After a month, holes of 50 cm diameter were dug to a depth of 50 cm for
the purpose of loosening the soil and retaining moisture in root zones, as well as
enabling the roots of seedlings to develop rapidly. The holes were left open to receive
rain, after which seedlings were transplanted the following day in the morning and at
sunset to avoid sun stress. Five kilograms (kg) of cow manure was thoroughly mixed
with topsoil for use during the transplanting of the seedlings in the field (Fuglie and
Sreeja, 2001). The seedlings were about 60 days old with average LSB heights of 19 cm
for M. oleifera and 13 cm for M. ovalifolia at transplanting time. Transplanting was
completed within two weeks.
Watering was done once a week during the first growing season (2014/2015) summer,
and once fortnightly during the second growing season (2015/2016) summer. Watering
was done weekly for the first growing season because the trees were younger, with
shallow root systems and needed water at shorter intervals compared to the second
growing season, when the trees were bigger with established tap roots, thus, needed less
water to survive. During winter, watering was done biweekly for both the first and
second seasons (2014 winter and 2015 winter) to avoid freezing of the trees and
subsequent mortality. Fuglie and Sreeja (2001) stated that M. oleifera trees do not need
much watering, except in very dry conditions when it must be done regularly for the first
two months and afterwards only when the trees are obviously suffering.
Superphosphate fertilizer with a P content of 83 g/kg (Wonder superphosphate granular,
AGRO-SERVE (Pty) Ltd., Bryanston, South Africa) and nitrogen fertilizer with an N
content of 280 g/kg (Limestone Ammonium Nitrate - LAN), from WONDER

45
HORTICULTURAL PRODUCTS (Pty) Ltd., Silverton, South Africa were applied at the
rate of 0 g, 100 g, 200 g and 300 g a month after transplanting to boost the root system
development as well as the leaves (Radovich, 2007), since winter was about to begin in
two months. Both Moringa species were cultivated in the same field of 0.21 hectares but
the field was divided into two parts in which the M. oleifera site had dimensions of 73 m
x 15 m = 1,096m2 (0.11 ha), while the M. ovalifolia area was 60.4 m x 15 m = 906m
2
(0.10 ha) in size.
3.3.4 Soil Composition of the Experimental Field
The results of soil analysis for the determination of the amount of nutrients and their
properties are found in Table 3.1. The analysis was done at the Ministry of Agriculture,
Water and Forestry soil laboratory in Windhoek. These results include the soil pH,
electrical conductivity or soluble salts (EC), organic matter (OM), phosphorus (P),
potassium (K), calcium (Ca), magnesium (Mg), sodium (Na) and soil texture. The 30-60
cm soil depth range had higher nutrient contents than the 0-30 cm soil depth range,
except for OM and P levels, which were higher, with values of 0.87% and 24.60 ppm,
respectively. Johnston and Steen (2013) stated that adequate and readily available
reserves of P must be available in the soil; however, most un-manured soils contain too
little of this plant micronutrient readily available to meet the large demand of crops,
particularly during certain growth periods such as root development of seedlings and
flowering of plants. Therefore, fertilizers containing P must be added to the soil to boost
plant growth, development and yield. The soil analysis results show that the soil was
slightly basic with pH values of 7.22 and 7.67 for 0-30 cm and 30-60 cm depths,
respectively. Fuglie and Sreeja (2001) emphasized that moringa tolerates a wide range of

46
soil conditions, but prefers a neutral to slightly acidic pH of 6.3-7.0. The particle size
analysis revealed that the soil is sandy (84.2% at 0-30 cm depth and 82.1% at 30-60 cm
depth), with low silt and clay (< 10% each).
Table 3.1: Soil nutrient properties and characteristics
Type of Analysis
Sample No.
Units 0-30 cm depth 30-60 cm depth
pH
7.22 7.67
Electrical Conductivity or Soluble
Salts (EC) mS/cm 80 87
Organic Matter (OM) % 0.87 0.65
Phosphorus (P) ppm 24.60 12.30
Potassium (K) ppm 295 384
Calcium (Ca) ppm 572 586
Magnesium (Mg) ppm 95 107
Sodium (Na) ppm 5 8
Texture ---- Loamy sand Loamy sand
Sand % 84.2 82.1
Silt % 8.2 9.7
Clay % 7.6 8.1
3.3.5 Weeds and their Control
As with all cultivated plants, weeds were a major challenge to the moringa orchard.
Weeding was done manually by hoeing, hand pulling, and brushing of the field at
regular weeding intervals, as suggested by Ojiako et al. (2012). In this study, weeds
were only a problem during the summer season (October to May) when rain was falling
and temperatures were optimum for plant growth; no weeding was done in winter.
Ojiako et al. (2012) noted that weeding has to be done at intervals to prevent weeds from
competing with the crops for nutrients. During the winter season, many plants, including
grasses, become dormant, thus minimizing their growth and development. Both M.
oleifera and M. ovalifolia grew well in a weeded/cleaned environment.

47
Moringa oleifera is very sensitive to weeds in that weeds foster pests such as insects
(crickets, bugs and caterpillars) which in turn feed on moringa leaves and shoots causing
it to lose leaves and growth vigour. Field observation showed that in un-weeded
conditions, M. ovalifolia maintained proper growth and development despite the weeds
and insects, while M. oleifera was negatively affected by the insect infestations. Ojiako
et al. (2012) also argues that pest attacks are reduced through weeding because weeds
may serve as hosts to insect pests.
3.3.6 Pests of M. oleifera and M. ovalifolia
Although at different extent, M. oleifera and M. ovalifolia are vulnerable to pests such as
crickets, locusts, bugs and caterpillars that tend to feed on the leaves and shoots. Pest
attacks cause the plants to lose their leaves and growth vigour. Sometimes the trees even
die. Also, wild animals such as rodents feed on the roots of both species of moringa
trees, killing them.
Moringa, like other plants, have natural enemies that obstruct their growth and survival.
They are normally attacked in the early life stages of their growth, from seedlings to
three months of age. One order of insects that affects moringa is Hemiptera, which
consists of bugs. They are of the phylum Arthropoda, class Insecta and sub-class
Pterygota (winged insects). Many hemipterans pierce plant tissues to feed on the sap,
while others use the same organ to suck the juices of other animals. Because of their
sucking habit, they are potential pests, especially when they are vectors for viruses,
bacteria and fungi that cause diseases in crop and garden plants (Callaghan & Fellowes,
2017; Picker, Griffiths, & Weaving, 2004). They colonize the plants and feed on the sap

48
of the young plants, which weaken the trees and consequently cause them to die off. The
sap is responsible for transporting plant nutrients to all parts of the tree. When tree sap is
drained off by insects, the flow of nutrients becomes limited, leading to the drying out of
leaves and the eventual death of the trees. Figure 3.1 shows some of the bugs found on
moringa trees during this study.
Figure 3.1: Hemiptera (bugs) on tree leaves
The infestation by insects was mostly noticed from October 2014 to January 2015 due to
the attractive sprouting of young shoots after winter. Also, during this time, young plants
growing from directly-sown seeds in the field are targeted by those insects which may
kill the plants if left unnoticed within two-to-five days.
The second order of insects that affected moringa plants was Orthoptera (family of
Tettigoniidae and subfamily of Hetrodinae), especially the Acanthoplus discoidalis (A.
discoidalis) species commonly known as armoured bush crickets or armoured ground
crickets and the common milkweed locusts (Phymateus moribillosus) (Figure 3.2 A and
B and C). This species is more abundant in arid and semi-arid zones, and it is native to
parts of Namibia, Botswana, Zimbabwe and South Africa (Mosupi, 2003; Picker et al.,
Bagrada bug Antestia bug Ladybird bug

49
2004; Wikipedia, 2017). A few of A. discoidalis were noticed on the field around late
January 2017 but they had less effect by then. On the other hand, P moribillosus were
seen on trees throughout the period under study (2014 to 2017), but their damage to
plants was unnoticeable, in comparison to other insects.
It was observed that A. discoidalis fed on the leaves and buds of M. oleifera trees,
causing 95 to 100 percent loss of leaves (Figure 3.3) from around February to May;
however, they had little or no impact on M. ovalifolia trees (Figure 3.4). Mosupi (2003)
confirmed that nymphs and young adults of A. discoidalis feed mainly on the vegetative
parts of grasses and broadleaf plants as well as crop fields flowering panicles and
developing grain until April and early May. The locusts had less impact on both species
of moringa leaves. In the current study, young moringa trees in the field were affected
by bugs while older trees were affected by A. discoidalis.
Figure 3.2: A. discoidalis (A and B) and P. moribillosus (C) feeding on buds and leaves
of Moringa species
A C
Armoured bush crickets Common milkweed locust
B

50
Figure 3.3: Effect of A. discoidalis and caterpillar feeding on M. oleifera trees
Figure 3.4: M. ovalifolia trees showing little or no pest damage
Beside insects, other pests such as wild animals, especially rodents were also major
challenge. While the insects feed on the leaves, these animals uprooted the trees and fed
on the roots; thus, killing the trees completely (Figure 3.5). The only control used for
this was fencing off the entire field perimeter with wire mesh and attaching barbed wire
at the ground-level of the fence to prevent the animals‘ access into the orchard.

51
Figure 3.5: M. oleifera (A) and M. ovalifolia (B) roots dug and eaten by animals
Insects caused more damage on M. oleifera compared to M. ovalifolia. This may be
caused by M. ovalifolia‘s adaptability to its environment as an indigenous tree of
Namibia, giving it an edge over M. oleifera. Hand-picking of insects was used as a
natural control method, which worked well when the plants where younger but as they
got older, it became difficult and resulted in M. oleifera being damaged by the insects.
3.3.7 Data Collection Procedures
Data collected included tree heights, dry-matter yields of leaves harvested during
summer seasons and trees‘ counts for the EoE after winter. Heights were measured for a
random sample of 20 M. oleifera and 20 M. ovalifolia trees at 30-day intervals in
2014/2015 and 60-day intervals in 2015/2016 to determine the LSB heights during the
growing seasons in summer, at which time the leaves were harvested to evaluate the
leaf-dry-matter yields concurrently. Harvested leaves were thinly spread on plastic
sheets in the farmhouse for shade drying for 2-3 weeks without turning. Harvesting was
A B

52
done in summer because 99% of rainfall occurs in the summer months in Namibia
(Pallett, 1994), which is considered as the growing season for plants in Namibia. After
summer, winter sets in and causes all the moringa trees to go into dormancy. After
winter, all trees were counted to determine their EoE and sprouting differences for both
species of moringa.
3.3.8 Data Analysis
Statistical Package for Social Sciences (SPSS® version 23) and Microsoft Excel
®
(version 13) were used to do all the analyses. A generalized linear model (GLM) and
independent sample t-tests were used to analyse LSB heights and leaf-dry-matter yields
of M. oleifera and M. ovalifolia, in which heights of trees and weights of leaf-dry matter
were used as dependent variables, while months and years were used as independent
variables. It is worth noting that all statistical analyses were only considered
significantly different at the alpha levels of p ≤ 0.05, and all p-values above these alpha
levels were considered non-significant. A column chart in Excel was used to compare
the two Moringa species‘ EoE.
3.4 Results and Discussion
The results presented and discussed here include M. oleifera and M. ovalifolia growth as
measured by LSB heights and harvested leaf-dry-matter yields for two summer seasons
of 2014/2015 and 2015/2016 as well as the EoE of trees for three winter seasons (2014,
2015, 2016). Despite the scarcity of water, both species are drought-resistant trees and
do quite well when fully established, as described by Morton (1991). However, tolerance
to cold and freezing winter weather had not yet been established in Namibia.

53
3.4.1 M. oleifera and M. ovalifolia Height Increase (cm) for 2014/15 and 2015/16
Summer Seasons
Figure 3.6 shows the average LSB heights of trees for each summer growing season. In
the orchard, M. oleifera had greater maximum LSB height (224.90 cm) than M.
ovalifolia (77.03 cm) in the month of April, whereas the lowest LSB heights were 36.75
cm and 5.40 cm, respectively, in November 2014/2015. The lowest LSB heights were
observed in November because the plants sprouted late, after the 2014 winter dormancy.
In 2015/2016, M. oleifera had an average best LSB height of 281.45 cm in March,
compared to that of M. ovalifolia (113.20 cm) in April; while the minimum heights of
70.05 cm and 22.00 cm for the two species, respectively, were observed in October.
Moringa oleifera had an overall average best and greatest LSB heights of 130.50 cm and
194.06 cm, while M. ovalifolia measured 40.77 cm and 66.74 cm in the 2014/2015 and
2015/2016 growing seasons, respectively. Moringa oleifera is an extremely fast-growing
tree and can reach a height of 400 cm in a year, and, eventually, 600 to 1500 cm (Prince,
2007; Radovich, 2007). However, the results of this study for both species had lower
heights due to the shorter growing summer seasons (September to April) as discussed by
Pallett (1994). The highest LSB heights in 2015/2016 can be attributed to the already
established root systems of the trees in comparison to the 2014/2015 season when the
trees were younger with shallow root system establishments.
Central Namibia being an arid and semi-arid region, plants grow more rapidly during
summer seasons (October to April), after which winter (May to September) sets in and
negatively affects the plants‘ growth. This could explain the minimum heights observed
in October (a transition month) 2015 for both species. According to Billings (1987), all

54
environments and all stressors do not have the same effects on plant growth and
reproduction. Likewise, all kinds of plants do not adapt equally to environmental
changes, nor do they have the same level of coping with stress factors.
Seasonally, Figure 3.6 shows that both M. oleifera and M. ovalifolia grew taller in terms
of LSB height in the second summer-growing season (2015/2016) compared to the first
summer-growing season (2014/2015). This means that between the two growing-
summer seasons, the lowest heights were observed in the first season (2014/2015), while
the highest heights were in the second season (2015/2016). Within species, LSB heights
were lower in each species in the first growing season than in the second season. In the
2015/2016 growing season, M. oleifera had the highest average LSB heights (cm) of
281.45 cm against 224.90 cm in the 2014/2015 growing season. Moringa ovalifolia
likewise elongated faster in 2015/2016, with a maximum of 113.20 cm in the month of
April, while 2014/2015 had a maximum of 77.025 cm in the same month. Just as in the
highest, the lowest LSB heights (cm) for M. oleifera were observed during the
2014/2015 growing season as 36.75 cm recorded in November 2014 while for the
2015/2016 season, a minimum height of 70.05 cm was recorded in October 2015.
Similarly, the lowest LSB heights (cm) of M. ovalifolia were 5.40 cm in November 2014
and 22 cm in October 2015, which clearly indicates that the more the trees mature, the
faster they sprout and elongate after the winter season.
These differences in LSB heights between the two summer-growing seasons can be
attributed to two factors; namely, the ages of the trees and the cutting and/or harvesting
interval. That is, in the first growing season (2014/2015), trees were younger/smaller and

55
measured at 30-day intervals after which they were harvested and cut back for regrowth.
This may have affected the elongation of the young trees. In the second growing season
(2015/2016), trees were older/bigger and measured and harvested and/or cut at 60-day
intervals for regrowth. This may have contributed to the highest LSB heights for
2015/2016. Besides the differences between the 30-day and 60-day harvesting and
cutting intervals, the differences in LSB heights between the two growing seasons can
also be attributed to the root systems becoming better established; that is, roots of young
trees are shallow in the soil compared to roots of older trees that are deeply rooted,
which enables them to elongate faster, thus promoting more vegetative growth. Fuglie
(2001) reported that in the first year, M. oleifera will grow up to 500 cm in LSB height
and if left alone, it subsequently reaches 1200 cm in height, with a trunk of 30 cm
circumference over the years.
Figure 3.6: Monthly average increase in LSB heights of Moringa species in 2014/15 and
2015/16
0
36.75
108.90
162.70 171.10
209.15 224.90
0 5.40 20.02
45.73 58.40
78.80 77.03
70.05
123.55
182.90
221.35 227.10
281.45
252.05
22 34.70
60.80 68.65 70.95
96.90 113.20
0
50
100
150
200
250
300
Oct. Nov. Dec. Jan. Feb. Mar. Apr.
Gro
wth
in h
eights
(cm
)
Growth months
M. oleifera 2014/15
M. ovalifolia2014/15
M. oleifera 2015/16
M. ovalifolia 2015/16

56
The results of a general linear model (GLM) analysis of variance test of Moringa
species‘ monthly LSB height with an F(1, 38)-value of 548.60 for the 2014/2015 and
2015/2016 summer-growing seasons showed a highly significant difference (P < 0.001)
in mean monthly increase in heights between M. oleifera and M. ovalifolia for the two
seasons. Table 3.2 presents the results of the Pairwise Multiple Comparisons test of
Moringa species monthly increase in heights (cm) for the 2014/2015 and 2015/2016
summer growing seasons. The analysis reveals that both M. oleifera and M. ovalifolia
had a highly significant difference (P < 0.001) in mean monthly LSB height increments
over the two seasons. This implies that the two species had different LSB heights in the
two seasons. Hence, the hypothesis (H02) that M. oleifera and M. ovalifolia do not vary
in LSB heights is rejected because they differ in heights significantly.
Table 3.2: Pairwise comparisons of Moringa species monthly height increments
(cm) for 2014/15 and 2015/16 seasons
(I)
Moringa spp.
(J)
Moringa spp.
Mean
Difference
(I-J)
Standard
Error
Sig.b
95% Confidence
Interval for Differenceb
Lower
Bound
Upper
Bound
M. oleifera M. ovalifolia 116.88 4.99 0.000*** 106.77 126.98
M. ovalifolia M. oleifera -116.88 4.99 0.000*** -126.98 -106.77
Based on estimated marginal means
***. The mean difference is highly significant at the 0.001 level.
b. Adjustment for multiple comparisons: Least Significant Difference (equivalent to no
adjustments).
The GLM analysis used to test monthly differences of Moringa species and their LSB
heights for 2014/2015 and 2015/2016 summer seasons is shown in Tables 3.3. The test
results showed that mean monthly LSB height increments (cm) contrasts were
significantly different (P < 0.05) within most of the months, that is, from November
2014 to April 2016. This was with the exception of January versus February 2015,

57
March versus April 2015, January versus February 2016 and March versus April 2016,
that were not significantly different (P > 0.05) in LSB heights. For the contrasts in LSB
heights of the Moringa species, there was a mean significant difference in height
(P < 0.05) within 2014; M. ovalifolia‘s LSB heights in 2014 had no significant
differences (P > 0.05) within November versus December 2014, December 2014 versus
January 2015, April versus October 2015, October versus November 2015, November
versus December 2015 and March versus April 2016 LSB height increments,
respectively. On the other hand, there were no significant differences (P > 0.05) within
January versus February 2015, December 2015 versus January 2016, January versus
February 2016 and February versus March 2016 in LSB height increments and Moringa
species, respectively, as presented in the discussion of Table 3.4.

58
Table 3.3: Monthly differences in LSB heights (cm) of Moringa species in 2014/2015
and 2015/2016
Source Heights (cm)
Type III Sum
of Squares df
Mean
Square F P-values
Heights (cm) Nov.‘14 vs. Dec.‘14 75281.65 1 75281.65 147.53 0.000***
Dec. ‗14 vs. Jan. ‗15 63218.40 1 63218.40 46.23 0.000***
Jan. ‗15 vs. Feb. ‗15 4441.56 1 4441.56 1.98 0.167ns
Feb. ‗15 vs. Mar. ‗15 34164.03 1 34164.03 9.83 0.003***
Mar. ‗15 vs. Apr. ‗15 1953.01 1 1953.01 1.17 0.286ns
Apr. ‗15 vs. Oct. ‗15 440475.16 1 440475.16 185.28 0.000***
Oct. ‗15 vs. Nov. ‗15 43824.40 1 43824.40 23.34 0.000***
Nov. ‗15 vs. Dec. ‗15 73017.03 1 73017.03 48.48 0.000***
Dec. ‗15 vs. Jan. ‗16 21436.90 1 21436.90 4.91 0.033*
Jan. ‗16 vs. Feb. ‗16 648.03 1 648.03 0.21 0.647ns
Feb. ‗16 vs. Mar. ‗16 64480.90 1 64480.90 21.94 0.000***
Mar. ‗16 vs. Apr. ‗16 1716.10 1 1716.10 0.29 0.594ns
Heights*Moringa
species
Nov.‘14 vs. Dec.‘14 33102.76 1 33102.76 64.87 0.000***
Dec. ‗14 vs. Jan. ‗15 7890.48 1 7890.48 5.77 0.021*
Jan. ‗15 vs. Feb. ‗15 182.76 1 182.76 0.08 0.777ns
Feb. ‗15 vs. Mar. ‗15 3115.23 1 3115.23 0.90 0.350ns
Mar. ‗15 vs. Apr. ‗15 3071.26 1 3071.26 1.84 0.183ns
Apr. ‗15 vs. Oct. ‗15 99650.31 1 99650.31 41.92 0.000***
Oct. ‗15 vs. Nov. ‗15 16646.40 1 16646.40 8.87 0.005**
Nov. ‗15 vs. Dec. ‗15 11055.63 1 11055.63 7.34 0.010**
Dec. ‗15 vs. Jan. ‗16 9363.60 1 9363.60 2.15 0.151ns
Jan. ‗16 vs. Feb. ‗16 119.03 1 119.03 0.04 0.844ns
Feb. ‗16 vs. Mar. ‗16 8065.60 1 8065.60 2.74 0.106ns
Mar. ‗16 vs. Apr. ‗16 20884.90 1 20884.90 3.51 0.069ns
Error (Heights) Nov.‘14 vs. Dec.‘14 19390.14 38 510.27
Dec. ‗14 vs. Jan. ‗15 51964.12 38 1367.48
Jan. ‗15 vs. Feb. ‗15 85114.94 38 2239.87
Feb. ‗15 vs. Mar. ‗15 132057.75 38 3475.20
Mar. ‗15 vs. Apr. ‗15 63418.99 38 1668.92
Apr. ‗15 vs. Oct. ‗15 90341.79 38 2377.42
Oct. ‗15 vs. Nov. ‗15 71342.70 38 1877.44
Nov. ‗15 vs. Dec. ‗15 57229.35 38 1506.04
Dec. ‗15 vs. Jan. ‗16 165807.50 38 4363.36
Jan. ‗16 vs. Feb. ‗16 115325.95 38 3034.89
Feb. ‗16 vs. Mar. ‗16 111685.50 38 2939.09
Mar. ‗16 vs. Apr. ‗16 226145.00 38 5951.18
Note: ns = non-significant at 0.05; * = significant at 0.05; ** = highly significant at 0.01;
*** = Extremely significant to ≤ 0.001 alpha levels

59
Tables 3.4 indicates the GLM descriptive statistics results for two Moringa species‘
mean monthly LSB height increments (cm) for the 2014/2015 and 2015/2016 summer
seasons. The descriptive statistics showed that the lowest means were observed in
November 2014 for both M. oleifera (36.75 cm) and M. ovalifolia (5.40 cm), while the
highest heights were obtained in March 2016, with M. oleifera measuring 281.45 cm and
April 2016 for M. ovalifolia, with a height of 113.20 cm as captured in Figure 3.6.
Based on the field observations, M. oleifera grew faster on average than M. ovalifolia,
and this was statistically significant. The slower LSB height of M. ovalifolia might be
attributed to the first focus on underground growth of the roots into tubers to preserve
energy for rough conditions (winter/drought) as described by Korsor et al. (2016).

60
Table 3.4: Descriptive statistics for Moringa species monthly LSB height
increments (cm) for 2014/15 and 2015/16
Moringa Species heights (cm)
N Mean
Standard
Deviation
Standard Error
of Mean
November 2014
M. oleifera 20 36.75 23.34 5.22
M. ovalifolia 20 5.40 4.96 1.11
Total 40 21.08 23.01 3.64
December 2014
M. oleifera 20 108.90 26.78 5.98
M. ovalifolia 20 20.02 8.67 1.94
Total 40 64.46 49.11 7.77
January 2015
M. oleifera 20 162.70 33.37 7.46
M. ovalifolia 20 45.73 15.56 3.48
Total 40 104.21 64.57 10.21
February 2015
M. oleifera 20 171.10 49.62 11.10
M. ovalifolia 20 58.40 20.14 4.50
Total 40 114.75 68.22 10.79
March 2015
M. oleifera 20 209.15 50.00 11.18
M. ovalifolia 20 78.80 27.58 6.17
Total 40 143.98 77.11 12.19
April 2015
M. oleifera 20 224.90 51.96 11.62
M. ovalifolia 20 77.03 25.82 5.77
Total 40 150.96 85.13 13.46
October 2015
M. oleifera 20 70.05 30.88 6.92
M. ovalifolia 20 22.00 12.23 2.74
Total 40 46.03 33.61 5.31
November 2015
M. oleifera 20 123.55 43.10 9.64
M. ovalifolia 20 34.70 12.93 2.89
Total 40 79.13 54.87 8.68
December 2015
M. oleifera 20 182.90 58.73 13.13
M. ovalifolia 20 60.80 25.56 5.72
Total 40 121.85 76.30 12.06
January 2016
M. oleifera 20 221.35 71.35 15.95
M. ovalifolia 20 68.65 30.69 6.86
Total 40 145.00 94.43 14.93
February 2016
M. oleifera 20 227.10 39.70 8.88
M. ovalifolia 20 70.95 25.58 5.72
Total 40 149.03 85.67 13.55
March 2016
M. oleifera 20 281.45 83.51 18.68
M. ovalifolia 20 96.90 31.51 7.05
Total 40 189.18 112.31 17.76
April 2016
M. oleifera 20 252.05 77.81 17.40
M. ovalifolia 20 113.20 41.35 9.25
Total 40 182.62 93.41 14.77
Mean: LSB heights

61
3.4.2 Comparison of M. oleifera and M. ovalifolia Sprouting and Extent of
Endurance
All environments are stressful to plants in one way or another. The significance of stress
to plant extent of endurance (EoE) depends on how long an environment has existed
and, therefore, on how long plant taxa have to evolve adaptations to the environmental
stressor (Billings, 1987). moringa trees are widely adapted to the tropics and subtropics
(Radovich, 2007; Nouman et al., 2013; Leone et al., 2015). The climate plays an
important role in the growth, development and endurance of plants. It governs the
plants‘ area of distribution and sets limits for their EoE. This is seen on a large scale in
the global distribution of the various types of vegetation according to zonal climate and
soil type, and on a smaller scale, in the distribution of plant species and communities
according to local conditions (Larcher, 1995). Since Namibia is a semi-arid and drought-
prone country (Pallett, 1994), drought-resistant plants like M. oleifera, which Morton
(1991) described as a boon to arid lands, can grow and survive in such environments.
Moringa oleifera is a fast-growing drought-resistant tree that is native to the southern
foothills of Himalayas in northern India (Fuglie, 2001). Moringa ovalifolia, a tree native
to Namibia and Angola, is physiologically well adapted to its native semi-arid and
drought-prone environment, as can be seen in its roots systems as discussed by Korsor et
al. (2016) and Ministry of Agriculture, Water and Forestry (n.d.). Figure 3.7 shows a
global humidity index map in which Namibia is shown as a semi-arid and arid country.

62
Figure 3.7: World Humidity Index Zone showing the study area (Source: United Nations
Environment Program), Retrieved on November 10, 2016 from
https://www.google.com.na/search?q=global+humidity+index+map&safe=active&sourc
e=lnms&sa=X&sqi=2&pjf=1&ved=0ahUKEwiQpPC5k9PSAhUpIMAKHWGZAh0Q_
AUIDCgA&biw=1920&bih=901&dpr=1
Figure 3.8 shows the effect of winter on M. oleifera at the beginning and the end of 2015
winter, while Figure 3.9 displays M. ovalifolia at the beginning and the end of the same
2015 winter season. These pictures are a clear indication of how much damage winter
frosts can cause to the trees every season. Obviously, such damage, depending on the
severity can lead to the death of many trees after winter.
Figure 3.8: M. oleifera at the beginning (A) and at the end (B) of winter 2015
A B
Namibia

63
Figure 3.9: M. ovalifolia at the beginning (A) and at the end (B) of winter 2015
Figure 3.10 presents the EoE of M. oleifera and M. ovalifolia trees after the 2014 winter
season. Although all 120 M. oleifera and 64 M. ovalifolia seedlings were transplanted
from the nursery to the field in early 2014 (late January to February), they were all
affected by winter (May to September) frost. Afterwards, summer sets in from October
to April (Pallett, 1994) and temperatures rise to the level that could support both
Moringa species‘ growth and development, as discussed by Metcalfe and Elkins (1980)
and Larcher (1995). Sprouting was thoroughly observed in October 2014 in which M.
oleifera had 66 sprouted trees (55%) compared to M. ovalifolia with 10 sprouted trees
(15.63%). The sprouting process continued up to January 2015 with the highest count of
85 for M. oleifera (70.83%) and 45 for M. ovalifolia trees (70.31%) respectively. As
newly planted trees, many of their roots were not fully established and therefore the trees
succumbed to the winter frost to which they are susceptible. Metcalfe and Elkins (1980)
agreed that plants are dependent on the root systems, for water and nutrients, as well as
for anchorage in the soil for their very life.
A B

64
Moringa oleifera had higher EoE in the four months (55% in October, 57.5% in
November, 63.33% in December and 70.83% in January), and M. ovalifolia had lower
EoE of 10 (15.63%) in October, 29 (45.31%) in November, 50 (78.13%) in December
and 52 (81.25%) in January. Comparatively, M. oleifera had an average EoE of 61.67%
and a mortality of 38.34%, while M. ovalifolia had an average EoE of 55.08% and a
mortality of 44.92%. McDowell et al. (2008) agreed that longer winter minimum
temperatures can lead to trees mortality, and Parker (1969) concurred that freezing
temperatures can retard plant growth. This clearly indicates that M. oleifera had a higher
EoE than M. ovalifolia during 2014/2015 summer season, which supports Morton (1991)
and Fuglie (2001)‘s statement that M. oleifera is a drought-resistant plant and thus a
boon in arid lands. At the end of the 2014 winter season, 46 out of 120 M. oleifera trees
had died, but they were all replaced through direct sowing of seeds. Twelve out of 64 M.
ovalifolia trees died but were not replaced due to a lack of seeds. Thus, a total of 52 M.
ovalifolia trees survived and could be found on the field. It was observed that winter in
2014 started with a sudden drop in temperature, affecting almost all the trees, which may
have contributed to the high mortality of trees. Metcalfe and Elkins (1980) agreed that a
rapid drop in temperature frequently kills plants.

65
Figure 3.10: Moringa trees‘ sprouting and EoE differences after 2014 winter season
The descriptive statistics for M. oleifera and M. ovalifolia EoE after the 2014 winter
season are found in Table 3.5. M. oleifera had a mean of 61.67 with a maximum of
70.83% EoE, while M. ovalifolia had a mean of 55.08 with a maximum of 81.25% EoE.
A study conducted by Korsor et al. (2016) with M. oleifera and M. ovalifolia seedlings
had the EoE of 81.56% for M. ovalifolia and 93.33% for M. oleifera, which is consistent
with the present study‘s M. ovalifolia EoE, but higher than the EoE for M. oleifera in
this study.
Table 3.5: Descriptive statistics of Moringa species EoE differences after
2014 winter season
Moringa spp. N Mean Standard Deviation Standard Error Mean
M. ovalifolia 4 55.08 30.92 15.46
M. oleifera 4 61.67 7.04 3.52
Note: Mean of sprouted and/or endured trees
55 57.5 63.33
70.83
15.63
45.31
78.13 81.25
0
20
40
60
80
100
October November December January
Sp
routi
ng p
erce
nta
ges
Sprouting and extent of endurance months (October 2014 to January 2015)
M. oleifera
M. ovalifolia

66
An independent sample test was conducted to determine the statistical difference
between the EoE of M. oleifera and M. ovalifolia after the 2014 winter season (Table
3.6). The sprouted trees were used as dependent variables while the two Moringa species
were used as independent variables for the analysis. The analysis shows that M. oleifera
had a higher mean difference of 6.59 sprouted trees (see Table 3.5), which was not
statistically significantly different (P > 0.05) from M. ovalifolia‘s sprouted trees after
2014 winter season. This is an indication that both Moringa species had similar
endurance as seen in Figure 3.10. Table 3.7 shows the distribution of independent
sample mean of the two Moringa species. Diagrammically, the distribution of the
independent sample mean are presented in Figure 3.11.
Table 3.6: Independent sample t-test of Moringa species EoE after 2014
winter season
Moringa spp.
Mean
Difference
Pooled Standard
Error Difference t df Sig.(2-tailed)
Sprouted trees 6.59 15.86 0.42 6 0.692n.s
Mean difference in extent of endurance rate; note: n.s = non-significant at 0.05 alpha level
Table 3.7: Distribution of independent sample mean of Moringa species
Moringa spp.
Posterior 95% Credible Interval
Mode Mean Variance Lower Bound Upper Bound
Sprouted/endured trees 6.59 6.59 0.75 4.89 8.28
Note: Mean difference of sprouted and/or endured trees

67
Figure 3.11: Mean distribution of Moringa species EoE differences after 2014 winter
season
The EoE of M. oleifera and M. ovalifolia trees after the 2015 winter season is presented
in Figure 3.12. Moringa oleifera had 117 out of 120 trees that sprouted, which
corresponds to a 97.50% EoE with 2.50% total mortality at the end of October 2015.
The situation remained unchanged until the end of January 2016 when it was noticed
that three trees, which did not sprout had died of winter frost, and they were replaced
immediately. A research study with M. oleifera in Ihumwa and Ruvu, Tanzania
assessing 30-month old trees showed extent of endurance rates of 98.67% and 92%
respectively (Edward et al., 2014). The present study concurs with their research
findings, even though the period of this research in Namibia was under complete
drought with winter spell conditions. Moringa ovalifolia trees had a gradual sprouting
and EoE of 30 (57.69%), 36 (69.23%), 40 (76.92%) and 43 (82.69%) out of 52 trees in
four months (October 2015 to January 2016 respectively), with an average mortality of
28.37%. The extent of endurance rates of the two Moringa species after the 2015 winter
season were carefully monitored from October 2015 to January 2016, and it was noticed
that sprouting was faster compared to 2014/2015 when the trees were younger and had

68
only started sprouting in November. Larcher (1995) pointed out that perennial plants in
the first year form a rosette and underground storage organs to ensure a rapid start for
development in the second year. It was observed that M. ovalifolia trees can take longer
(6 to 10 months) in consequential dormancy than M. oleifera (4 to 6 months) and still
sprout. This extent of endurance ability might be attributed to M. ovalifolia‘s tuberous-
root system that stores food for its future uses during stress. Billings (1987) reported that
most perennial plants, both dicotyledonous and monocotyledonous, have large
underground root and rhizome systems in which carbohydrates and other compounds are
stored. Besides the issue of root development, winter in 2015 set in slowly and affected
the trees gradually, which may have contributed to the low mortality rates compared to
2014. Metcalfe and Elkins (1980) noted that plant roots often also perform an important
function in storing food for future use. They also emphasized that a gradual drop in
temperature kills fewer plants.
Figure 3.12: Moringa trees‘ sprouting and EoE differences after 2015 winter season
97.5 97.5 97.5 97.5
57.69
67.23
76.92 82.69
0
20
40
60
80
100
120
October November December January
Sp
routi
ng p
erce
nta
ges
Sprouting and extent of endurance months (October 2015 - January 2016)
M. oleifera
M. ovalifolia

69
The descriptive statistics of the two Moringa species‘ EoE after the 2015 winter season
are found in Table 3.8. The statistics for EoE show the means of 97.50 and 71.63
endured trees for M. oleifera and M. ovalifolia, respectively. Moringa oleifera sprouted
in one month in 2015, causing it to have zero standard deviation and standard error of
the mean, while M. ovalifolia had a gradual sprouting with 10.81 standard deviation and
5.40 standard error of the mean.
Table 3.8: Descriptive statistics of Moringa species EoE differences after 2015
winter season
Moringa spp. N Mean Standard Deviation Standard Error Mean
M. ovalifolia 4 71.63 10.81 5.40
M. oleifera 4 97.50 0.00 0.00
Note: Mean of sprouted trees
Table 3.9 presents an independent sample test of two Moringa species‘ EoE after the
2015 winter season. The test result reveals that M. oleifera had a mean difference of
25.87 endured trees (see Table 3.8), resulting into a significant difference (P < 0.01)
from M. ovalifolia in EoE. Although planted in the same orchard and environmental
conditions, each Moringa species endured the 2015 winter season at different level (see
Figure 3.12). Table 3.10 indicates the distribution of the independent sample mean of
sprouted Moringa species, which are diagrammatically represented in Figure 3.12.
Table 3.9: Independent sample t-test of Moringa species EoE after 2015 winter
season
Moringa spp.
Mean
Difference
Pooled Standard
Error Difference
t
df
Sig. (2-tailed)
Sprouted trees 25.87 5.40 4.79 6 0.003**
Mean of difference in extent endurance rate; note: ** = extremely significant to ≤ 0.001 alpha
level

70
Table 3.10: Distribution of independent sample mean of Moringa species
Moringa spp.
Posterior 95% Credible Interval
Mode Mean Variance Lower Bound Upper Bound
Sprouted trees 25.87 25.87 0.75 24.17 27.56
Note: Mean of sprouted trees
Figure 3.13: Mean distribution of Moringa species EoE differences after 2015
winter season
The sprouting and EoE of M. oleifera and M. ovalifolia trees after the 2016 winter
season are found in Figure 3.14. This winter season came in the middle of a severe
drought that started in 2015 and continued through 2016, which created a scarcity of
water and affected annual and some perennial plant feed sources for wild and domestic
animals‘ grazing and browsing. Moringa ovalifolia roots, being more succulent (no
stems) than M. oleifera, were subject to wild animals, mainly rodents, uprooting them as
a source of food and water (23 trees were uprooted in total). Haferkamp (1988)
emphasized that water is required by all living organisms. In this case, only 20 trees
were left on the field out of the 43 trees that endured the 2015 winter season.

71
The result in Figure 3.14 shows earlier sprouting and EoE of M. oleifera and M.
ovalifolia species starting in September with 93.33% and 42.11%, October 99.17% and
89.47%, and November 99.17% and 100%, respectively. These earlier sprouting and
higher EoE of both Moringa species after the 2016 winter season are an indication that
older trees have higher endurance capacity and faster sprouting rates compared to
younger trees. As observed on the field, older trees (three years old) sprouted within
three to five days whenever temperatures improved even in the middle of the winter
season, and died off when temperatures worsened. It implies that optimum temperatures
are of cardinal importance to plants‘ growth and EoE, as well as moisture, as stated by
Haferkamp (1988).
Figure 3.14: Moringa trees‘ species sprouting and EoE differences after 2016
winter season
Table 3.11 presents descriptive statistics of the two Moringa species‘ EoE after the 2016
winter season. The two Moringa species had equal EoE after the 2016 winter season
when M. ovalifolia had a mean of 57.90 sprouted trees with a maximum of 99.19 % tree
93.33 99.17 99.17
42.11
89.47
100
0
20
40
60
80
100
120
September October November
Sp
routi
ng p
erce
nta
ges
Sprouting and endurance months (September to November 2016)
M. oleifera
M. ovalifolia

72
endurance, while M. oleifera had a mean of 72.92 sprouted trees with a maximum of
100% tree endurance.
Table 3.11: Descriptive statistics of Moringa species EoE differences after 2016
winter season
Moringa spp. N Mean
Standard
Deviation
Standard Error
Mean
Minimum Maximum
M. ovalifolia 4 57.90 46.08 23.04 0.00 99.17
M. oleifera 4 72.92 48.69 24.34 0.00 100
Note: Mean of sprouted trees
An independent sample t-test of Moringa species EoE after 2016 winter season is seen
in Table 3.12. During the analysis, the endured (sprouted) trees were used as dependent
variables, while the two Moringa species were used as independent variables. The test
result shows a mean difference of 15.02 sprouted trees that led to no statistical
significant difference (P > 0.05) between M. oleifera and M. ovalifolia EoE after the
2016 winter season (see Table 3.11). This may be attributed to the ages of the trees (see
Figure 3.14) in comparison to the first and second winter (2014 and 2015) seasons when
the trees were younger, with less roots system establishment, as discussed by Foth
(1990) and Larcher (1995). Table 3.13 shows the distribution of the independent sample
mean of Moringa species‘ sprouted trees in 2016. Figure 3.15 reveals the
diagrammatically distribution of the independent sample mean of the endured trees.
Table 3.12: Independent sample t-test of Moringa species EoE after 2016
winter season
Moringa spp.
Mean
Difference
Pooled Standard
Error Difference t df Sig. (2-tailed)
Sprouted trees 15.02 33.52 0.45 6 0.670ns
Mean difference in extent of endurance rate; note: n.s = non-significant at 0.05 alpha level

73
Table 3.13: Distribution of independent sample mean of Moringa species
in 2016
Moringa spp.
Posterior 95% Credible Interval
Mode Mean Variance Lower Bound Upper Bound
Sprouted trees 15.02 15.02 0.75 13.32 16.72
Note: Mean of sprouted trees
Figure 3.15: Mean distribution of Moringa species EoE differences after 2016
winter season
Figure 3.16 presents sprouting of M. oleifera (A) and M. ovalifolia (B) in the middle of
the 2016 winter season, while Figure 2.17 shows well-established roots of M. oleifera
(A) and M. ovalifolia (B) after the 2016 winter. As the trees grew older and bigger with
firm root-system establishment in 2016, they were less affected by winter and whenever
temperatures improved, they sprouted immediately even in the middle of winter, which
reduced the mortality rates.

74
Figure 3.16: Sprouting of M. oleifera (A) and M. ovalifolia (B) in the middle of 2016
winter
Figure 3.17: Well-established roots of M. oleifera (A) and M. ovalifolia (B) after 2016
winter
The sprouting ability of M. oleifera and M. ovalifolia showed no significant differences
(P > 0.05) after the 2014 and 2016 winter seasons, but there was a significant difference
after 2015 winter season, which is an indication that both species of moringa have the
ability to endure in the harsh environmental conditions of central Namibia. For this
reason, the hypothesis (H02) that M. oleifera and M. ovalifolia do not differ in the EoE
differences after winter seasons partially failed to be rejected because only in 2015 the
two species were significantly different, but they do not differ significantly in 2014 and
A B
A B

75
2016. In the two seasons (2014 and 2016) where there was no significance between the
two species of moringa in endurance might be due to the abrupt setting of winter
compared to 2015 when winter set in gradually.
3.4.3 Comparison of M. oleifera and M. ovalifolia Leaf-Dry-Matter Yield
Almost all parts of moringa tree are used for food, oil, fiber, and/or medicine. The leaves
are readily eaten by cattle, sheep, goats, pigs, chickens and rabbits and can also be used
as food for fish (Radovich, 2007; Van Wyk et al., 2011) as well as humans. This creates
a huge demand for leaves biomass production to meet the demand for human food and
medicine as well as for animal fodder and ethno-veterinary medicine, as pointed out by
Adegun and Ayodele (2015). In this research, a moringa plantation was established, in
which two-months-old seedlings of M. oleifera and M. ovalifolia were transplanted into
a field of 0.21 hectares. The field was divided into two parts, one for M. oleifera (0.11
ha) and the other for M. ovalifolia (0.10 ha). The field layout and experimental design
are discussed in section 3.2.2. At transplanting, the soil was mixed with 5 kg cow
manure and used to fill planting pits, as suggested by Fuglie and Sreeja (2001). One
month after transplanting, phosphorus and nitrogen fertilizer treatments were applied as
in the following sequence: treatment1 (control – 0 g), treatment2 (100 g), treatment3
(200 g) and treatment4 (300 g), respectively. Fuglie and Sreeja (2001) and Radovich
(2007) recommended both fertilizer and irrigation for maximum productivity. Lea-dry-
matter yield in this study was assessed on the four fertilizer treatment levels (1= 0 g, 2 =
100 g, 3 = 200 g and 4 = 300g) that were applied on the two Moringa species trees. The
yields obtained from the two summer growing and harvesting seasons of 2014/2015 and
2015/2016 were all presented on a kilogram (kg) per hectare (ha) basis.

76
Figure 3.18 presents Moringa species average leaf-dry-matter yields in kg/ha for
2014/2015 and 2015/2016 summer harvesting seasons according to the four fertilizer
treatment levels. For M. oleifera‘s leaf-dry-matter yield in kg/ha, the control treatment1
(0 g) had the highest yield of 379.36 kg/ha, followed by treatment2 (100 g) with 315.13
kg/ha, treatment3 (200 g) with 246.43 kg/ha while treatment4 (300 g) had the lowest
yield of 207.73 kg/ha for the 2015/2016 summer growing and harvesting season. The
control treatment yielding more leaf-dry matter is an indication that M. oleifera can
grow and yield more leaves with little or no fertilizers. Fuglie and Sreeja (2001)
confirmed that M. oleifera trees will generally grow well without adding much fertilizer.
For the 2014/2015 summer harvesting season, treatment2 (100 g) had the highest yield
of 289.55 kg/ha, followed by treatment1 (0 g) with 241.53 kg/ha, treatment4 (300 g)
with 191.85 kg/ha and the lowest was treatment3 (200 g) with 110.98 kg/ha. These leaf-
dry-matter yields per hectare obtained for M. oleifera‘s leaf-dry-matter yields in the
present research are much lower compared to those in tropical countries like the Gambia
where 15 tonnes/ha dry matter were obtained (Akinbamijo et al., n.d.). This can be
attributed to the short growing season in the semi-arid climate of Namibia (October to
April summer season) as discussed by Pallett (1994), coupled with the fact that the trees
were very young and not fully established for proper comparison with well-established
plantations.
On the other hand, the leaf-dry-matter yield in kg/ha for M. ovalifolia during the two
summer growing and harvesting seasons of 2014/2015 and 2015/2016 are also presented
in Figure 3.18. Moringa ovalifolia, like M. oleifera had four fertilizer treatment levels

77
presented as follow: treatment1, the control (0 g), treatment2 (100 g), treatment3 (200 g)
and treatment4 (300 g), respectively. The result showed that treatment4 (300 g) yielded
the highest leaf-dry matter of 94.67 kg/ha. The second highest was treatment2 (100 g)
that yielded 74.69 kg/ha, and successively followed by treatment1 (0 g) that yielded
31.25 kg/ha and treatment3 (200 g) that yielded the lowest of 27.68 kg/ha in 2014/2015.
For 2015/2016 growing season, treatment1 (0 g) had the highest yield of 76.81 kg/ha,
followed by treatment2 (100 g) that yielded 60.63 kg/ha, treatment4 (300 g) that yielded
58.82 kg/ha while treatment3 (200 g) yielded the lowest of 41.97 kg/ha. Unlike
2014/2015 season, M. ovalifolia‘s yields also declined as the fertilizer treatment levels
increased in 2015/2016 as was the case with M. oleifera, an evidence that both Moringa
species do not need much fertilizer to increase leaf-dry matter production.
Concerning the requirement for fertilizers, M. oleifera and M. ovalifolia can yield well
even without phosphorus and nitrogen fertilizers since the control treatment yielded
more leaf-dry matter compared to treatments where fertilizers were applied. Fuglie and
Sreeja (2001) and Radovich (2007) stated that moringa trees will generally grow well
without adding much fertilizer; however, they recommended that compost can be used
during planting. Taking into consideration the 2.5 m x 2.5 m spacing, a hectare would
contain 4,000 M. oleifera trees while 3 m x 3 m spacing would allow 3333 trees; thus,
yielding more leaf-dry matter per summer season. Moringa ovalifolia on the other hand
had four treatment levels with four different plant spacings but same plant densities. As
a baseline study for M. ovalifolia, the different spacings were meant to determine the
appropriate spacing for domestication purposes. The spacings were 4.5 m x 4.5 m, 4 m x
4 m, 3.5 m x 3.5 m and 3 m x 3 m to which phosphorus and nitrogen fertilizer treatments

78
were applied consecutively: control treatment (0 g), treatment2 (100 g), treatment3 (200
g) and treatment4 (300 g), respectively. At all fertilizer treatment levels and both
2014/2015 and 2015/2016 summer growing and harvesting seasons, M. oleifera yielded
more leaf-dry-matter in kg/ha than M. ovalifolia, which can be attributed to its fast
growth as described by many literature (Sanchez et al., 2006; Prince, 2007; Radovich,
2007; Isah, Bello, & Zarumaye, 2014).
Figure 3.18: Moringa species seasonal leaf-dry-matter yields in kg/ha per treatment
levels
An independent sample t-test was conducted to compare the two Moringa species and
their harvesting seasons (Table 3.14), which showed that M. oleifera‘s leaf-dry-matter
yields had extremely significant differences (P < 0.001) from M. ovalifolia‘s yields with
mean differences of 162.38 kg/ha in 2014/2015 and 227.61 kg/ha in 2015/2016. These
large statistical mean differences in leaf-dry-matter yields between the two species for
both seasons supports the results in Figure 3.18 in which M. oleifera had higher average
241.53 kg/ha 268.53 kg/ha
175.89 kg/ha 191.85 kg/ha
379.36 kg/ha
315.13 kg/ha
246.43 kg/ha
207.73 kg/ha
31.25 kg/ha
74.69 kg/ha
27.68 kg/ha
94.67 kg/ha 76.81 kg/ha
60.63 kg/ha 41.96 kg/ha
58.82 kg/ha
0
50
100
150
200
250
300
350
400
0 g 100 g 200 g 300 g
Dry
mat
ter
yie
ld i
n k
g/h
a
Fertilizer treatment levels
M. oleifera 2014/2015
M. oleifera 2015/2016
M. ovalifolia 2014/2015
M. ovalifolia 2015/2016

79
leaf-dry-matter yields in kg/ha than M. ovalifolia at all treatment levels. This can be
attributed to M. oleifera fast growth and development as pointed out by many authors
(Sanchez et al., 2006; Prince, 2007; Radovich, 2007; Isah, Bello, & Zarumaye, 2014).
Hence, the hypothesis (H02) that M. oleifera and M. ovalifolia do not significantly differ
in leaf-dry-matter yields is rejected because the two species of moringa significantly
differ yields at all treatment levels and seasons.
Table 3.14: Independent sample t-test of Moringa species and seasonal leaf-
ry-matter yield in kg/ha
Summer seasons
Mean
Difference
Pooled Standard
Error Difference
t
df
Sig. (2-
tailed)
2014/2015 162.38 27.10 5.99 6 0.001***
2015/2016 227.61 38.58 5.90 6 0.001***
Mean difference in leaf-dry-matter yield; note: *** = extremely significant to ≤ 0.001
alpha level
Table 3.15 presents the descriptive statistics of Moringa species as well as 2014/2015
and 2015/2016 summer seasons‘ leaf-dry-matter yields in kg/ha. Comparing the means
on the seasonal basis, M. oleifera produced 287.16 kg/ha and 219.45 kg/ha for
2015/2016 and 2014/2015 summer harvesting seasons, respectively, while M. ovalifolia
had lower means of 59.55 kg/ha and 57.07 kg/ha. The distribution of the independent
sample mean of Moringa species‘ leaf-dry-matter yields based on 2014/2015 and
2015/2016 summer-harvesting seasons are presented in Table 3.16, which are
diagrammatically shown in Figures 3.19 and 3.20, respectively.

80
Table 3.15: Descriptive statistics of Moringa species seasonal leaf-dry-
matter yields kg/ha
Summer seasons Moringa spp. N Mean
Standard
Deviation
Standard Error
Mean
2014/2015 M. ovalifolia 4 57.07 32.94 16.47
M. oleifera 4 219.45 43.04 21.52
2015/2016 M. ovalifolia 4 59.55 14.25 7.12
M. oleifera 4 287.16 75.83 37.92
Note: Mean difference in leaf-dry-matter yield
Table 3.16: Distribution of independent sample mean of Moringa species
leaf-dry-matter yields based on seasons
Summer
seasons
Posterior 95% Credible Interval
Mode Mean Variance Lower Bound Upper Bound
2014/2015 162.38 162.38 0.75 160.68 164.08
2015/2016 227.61 227.61 0.75 225.91 229.31
Note: Mean difference in leaf-dry-matter yield
Figure 3.19: Mean distribution of Moringa species leaf-dry-matter yield in
kg/ha for 2014/2015
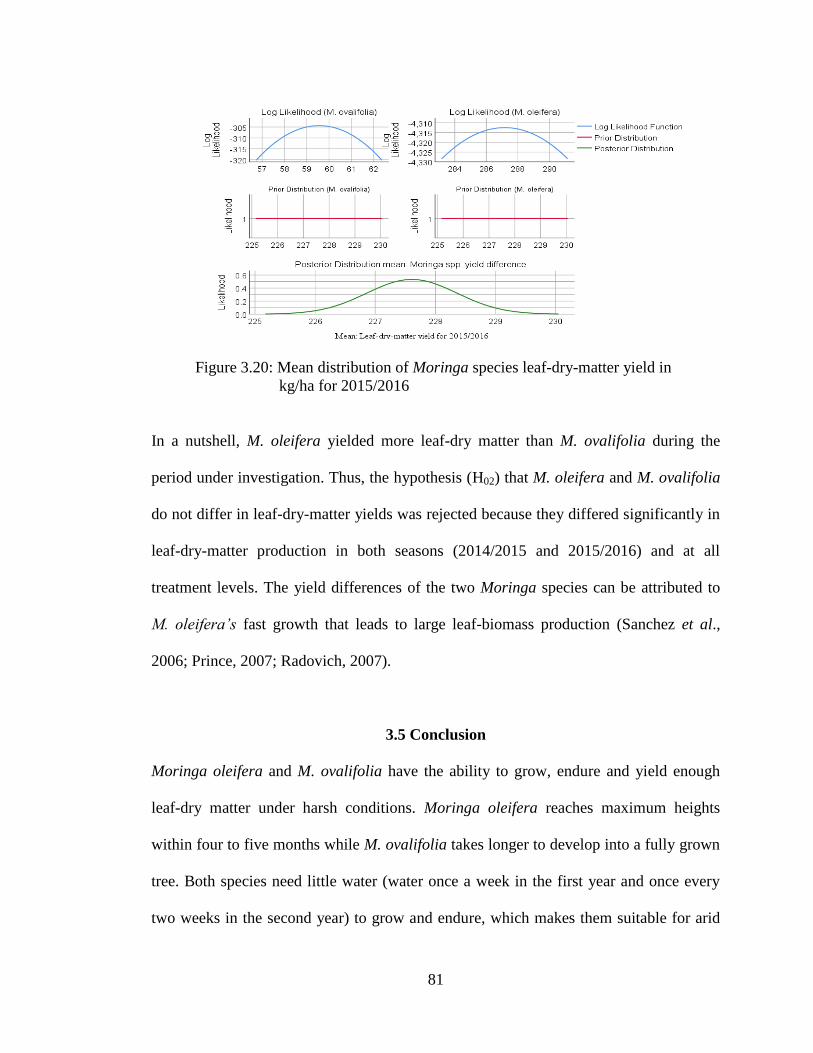
81
Figure 3.20: Mean distribution of Moringa species leaf-dry-matter yield in
kg/ha for 2015/2016
In a nutshell, M. oleifera yielded more leaf-dry matter than M. ovalifolia during the
period under investigation. Thus, the hypothesis (H02) that M. oleifera and M. ovalifolia
do not differ in leaf-dry-matter yields was rejected because they differed significantly in
leaf-dry-matter production in both seasons (2014/2015 and 2015/2016) and at all
treatment levels. The yield differences of the two Moringa species can be attributed to
M. oleifera’s fast growth that leads to large leaf-biomass production (Sanchez et al.,
2006; Prince, 2007; Radovich, 2007).
3.5 Conclusion
Moringa oleifera and M. ovalifolia have the ability to grow, endure and yield enough
leaf-dry matter under harsh conditions. Moringa oleifera reaches maximum heights
within four to five months while M. ovalifolia takes longer to develop into a fully grown
tree. Both species need little water (water once a week in the first year and once every
two weeks in the second year) to grow and endure, which makes them suitable for arid

82
and semi-arid climates like Namibia. Although many trees in this central part of
Namibia, including moringa, are affected by winter frost annually, both species are able
to endure, sprout, and produce abundant leaf-dry matter quickly after winter seasons.
Moringa oleifera had an EoE of 97.50% against 71.63% for M. ovalifolia in the
2015/2016 summer season. During summer season, species of moringa both can yield a
considerable amount of leaf-dry matter that may be used as a feed supplement. Moringa
oleifera had maximum yields of 379.36 kg/ha and 268.53 kg/ha for 2015/2016 and
2014/2016, while M. ovalifolia‘s maximum yields were 94.67 kg/ha and 76.81 for
2014/2014 and 2015/2016 seasons. Therefore, M. oleifera (especially) and M. ovalifolia
are possible alternative trees species that can be planted to improve rangeland
productivity in terms of fodder especially when allowed to grow into full capacity.
References
Isah, A., Bello, A., & Zarumaye, S. (2014). Effects of cutting heights and interval of
cutting on the yield of Moringa oleifera (horse raddish). International Journal of
Development and Sustainability, 3(5), 1147–1151.
Adegun, M., & Ayodele, O. (2015). Growth and yield of Moringa oleifera as influenced
by spacing and organic manures in South-Western Nigeria. International Journal
of Agronomy and Agricultural Research (IJAAR), 6(6), 30–37.
Agra Professional Services. (2013). Namibia livestock catalogue. Windhoek, Namibia:
Ministry of Agriculture, Water and Forestry.
Akinbamijo, O., Adediran, S., Nouala, S., & Saecker, J. (n.d.). Moringa fodder in
ruminant nutrition in The Gambia. Moringa News, 5.

83
Alhakman, F., Kumar, S., & Khan, S. (2013). Estimation of total phenolic content, in-
vitro antioxidant and anti-inflammatory activity of flowers of Moringa oleifera.
Asian Pacific Journal of Tropical Biomedicine, 3(8), 623–627.
https://doi.org/10.1016/S2221-1691(13)60126-4
Beukes, A. (2017, March 15). Vegetation of Neudamm Experimental Farm.
Beukes, P. (2017). Average annual rainfall of Neudamm Experimental Farm from 1974
to 2016 (Meteorological) (pp. 1–2). Namibia: University of Namibia.
Billings, W. (1987). Constraints to Plant Growth, Reproduction, and Establishment in
Arctic Environments. INSTAAR, University of Colorado, 19(4), 357–365.
Callaghan, A., Fellowes, M. (2017). The Royal Entomological Society‘s introduction
to insect science: garden entomology. The University of Reading. Retrieved from
www.reading.ac.uk/biosci
Curtis, B., & Mannheimer, C. (2005). Tree Atlas of Namibia. Windhoek, Namibia: The
National Botanical Institute.
Edward, E., Chamshama, S., Ngaga, Y., & Mndolwa, M. (2014). Survival, growth and
biomass production of Moringa oleifera provenances at Gairo inland plateau and
Ruvu Coastal Region in Tanzania. African Journal of Plant Science, 8(1), 54–64.
Foth, H. D. (1990). Fundamentals of soil science (8th ed.). Singapore: John Wiley &
Sons.
Fuglie, L. (2001). The miracle tree: the multiple attributes of Moringa. Dakar, Senegal:
CTA.
Fuglie, L., & Sreeja, V. (2001). Cultivation of Moringa. In The miracle tree: The
multiple attributes of Moringa (pp. 153–158). Dakar, Senegal: CTA and CWS.

84
Haferkamp, M. (1988). Environmental factors affecting plant productivity. Montana
Agri. Exp. Sta., Bozeman, 132.
Johnston, A., & Steen, I. (2013, December). Understanding phosphorus and it use in
agriculture. European Fertilizer Manufacturers Association (EFMA). Retrieved
from www.efma.org
Kahumba, A. (2010, November). Comparison of the rehabilitative effects of mechanical
and chemical methods of bush control on degraded Highland Savanna
rangelands in Namibia. University of Namibia, Windhoek, Namibia.
Kapu, N. (2012). Assessment of rangeland condition and evaluation of the nutritional
value of common grass and browse species at the Neudamm Experimental Farm,
Namibia. University of Namibia, Windhoek, Namibia. Retrieved from
www.unam.na
Korsor, M, Ntahonshikira, C., Kwaambwa, H., & Bello, H. (2016). Comparative
performance of Moringa oleifera and Moringa ovalifolia seeds and seedlings
establishment in central Namibia. Net Journal of Agricultural Science, 4(2), 35–
44.
Korsor, Morlu, Ntahonshikira, C., Kwaambwa, H. M., & Bello, H. M. (2016).
Comparative performance of Moringa oleifera and Moringa ovalifolia seeds and
seedlings establishment in central Namibia. Net Journal of Agricultural Science,
4(2), 35–44. https://doi.org/2315-9766
Larcher, W. (1995). Physiological plant ecology: Ecophysiology and stress physiology
of functional groups (3rd ed.). Tokyo, Japan: Springer.
Leone, A., Spada, A., Battezzati, A., Schiraldi, A., Aristil, J., & Bertoli, S. (2015).
Cultivation, genetic, ethnopharmacology, phytochemistry and pharmacology of

85
Moringa oleifera leaves: An overview. International Journal of Molecular
Science, 16, 12791–12835. https://doi.org/10.3390/ijms160612791
Metcalfe, D., & Elkins, D. (1980). Crop production: Principles and practices (4th ed.).
United States of America: MACMILLAN PUBLISHING CO., INC.
Ministry of Agriculture, Water and Forestry. (n.d.). Moringa ovalifolia. Ministry of
Agriculture, Water and Forestry. Retrieved from
http://www.explorelifeonearth.org/ovalifolia.html
Moringa Mission Trust. (2005). Moringa facts: Moringa oleifera nutritional values of
leaves and pods [http://moringahope.com/Moringa_Facts.html].
Morton, J. (1991). The Horseradish Tree, Moringa pterygosperma (Moringaceae): A
Boon to Arid Lands? New York Botanical Garden Press on Springer, 45(3),
318–333.
Mosupi, P. (2003). Chemical and cultural control of armoured bush criket, Acanthoplus
discoidalis (Walker) (Orthoptera: Tettigoniidae: Hetrodinae), in sorghum in
Botswana (Dissertation). University of Pretoria, Pretoria, South Africa. Retrieved
from
http://www.repository.up.ac.za/bitstream/handle/2263/29424/00front.pdf?sequen
ce=1
Nouman, W., Basra, S., Siddiqui, M., Yasmeen, A., Gull, T., & Alcayde, M. (2013).
Potential of Moringa oleifera L. as livestock fodder crop: a review. Turk J Agric
For, 38, 1–14. https://doi.org/10.3906/tar-1211-66
Ojiako, F., Enwere, E., Dialoke, S., hejirika, G., Adikuru, N., & Okafor, O. (2012).
Nursery insect pests of Moringa oleifera Lam in Owerri Area, Imo State,

86
Nigeria. International Journal of Agriculture and Rural Development, 15(3),
1322–1328.
Ojukwu, A. (2012, January). Moringa as livestock feed. West Africa Insight.
Olson, M. E. (2001). Introduction to the Moringa family. In L. Fuglie (Ed.), The miracle
tree: The multiple attributes of Moringa (pp. 11–28). Dakar, Senegal: CTA and
CWS.
Onwueme, I., & Sinha, I. (1991). Field crop production in tropical Africa. Ede, The
Netherlands: CTA.
Pallett, J. (1994). Understanding the Oshana environment. Windhoek, Namibia:
Gamsberg Macmillan Publishers Ltd.
Picker, M., Griffiths, C., & Weaving, A. (2004). Field guide to insects of Southern
Africa. Cape Town, South Africa: Struik Nature.
Prince, M. (2007). ECHO Technical Note: The Moringa tree, 1-19. Retrieved from
http://chenetwork.org/files_pdf/Moringa.pdf
Radovich, T. (2007). Farm and forestry production and marketing profile for Moringa
oleifera. WSTERN AND PAR. https://doi.org/47001-03798
Sanchez, N., Ledin, S., & Ledin, I. (2006). Biomass production and chemical
composition of Moringa oleifera under different management regimes in
Nicaragua. Springer, 66, 231–242. https://doi.org/10.1007/s10457-005-8847-y
Sanchez-Machado, D., Núñez-Gastélum, J., Reyes-Moreno, C., Ramírez-Wong, B., &
López-Cervantes, J. (2010). Nutritional quality of edible parts of Moringa
oleifera. Food Analytical Methods, 3, 175–180. https://doi.org/10.1007/s12161-
009-9106-z

87
Sijssens, P. (2014). Evaluation of MCA Namibia’s Livestock Support Activity (Final
Report No. MCA/COM/RCQ/5E01001) (p. 48). Namibia. Retrieved from
http://www.mcanamibia.org/files/files/Final%20Report%20LS.pdf
University of Namibia. (2011). Neudamm Agricultural College Farm. University of
Namibia. Retrieved from http://digital.unam.na/handle/11070.1/4461?show=full
Van Schalkwyk, R. (2014). Introduction to plant products in Namibia. Windhoek,
Namibia: Venture Publications.
Van Wyk, B., Van Wyk, P., & Van Wyk, B. (2011). Photo guide to trees of southern
Africa (Vol. 1). Pretoria, South Africa: Briza Publications.
Wikipedia. (2017, April 4). Wikipedia: The free Encyclopedia. In Acanthoplus
discoidalis. Wikipedia. Retrieved from
https://en.wikipedia.org/wiki/Acanthoplus_discoidalis

88
Chapter 4
Comparative Proximate and Mineral Compositions of Moringa oleifera and
Moringa ovalifolia Grown in Central Namibia
4.1 Abstract
The objective of this study was to compare the proximate and mineral compositions of
Moringa oleifera and Moringa ovalifolia grown together at Neudamm Experimental
Farm of the University of Namibia in central Namibia. Moringa oleifera (M. oleifera),
which is well known for its rich nutritional value was compared to the nutritional value
of Moringa ovalifolia (M. ovalifolia), a native plant of Namibia and Angola, which is
less studied. Because Namibia is arid and semi-arid climates, many plants in the
rangelands are low in nutrients essential for livestock nutrition. This creates the
necessity for planting fodder trees like moringa that withstand the harsh climatic
conditions and retain their nutritional quality for sustainment of livestock production
through supplementation. Leaves of both Moringa species were harvested together with
twigs and twiglets, along with M. oleifera flowers, and samples were taken to the
Ministry of Agriculture‘s Nutrition Laboratory for proximate and mineral analyses.
Statistically, M. oleifera nutrient values were significantly different (P < 0.05) in
moisture, ash, crude protein (CP) and crude fibre (CF) from those of M. ovalifolia, but
there were no significant differences (P > 0.05) in fat, acid detergent fibre (ADF) and
neutral detergent fibre (NDF). Additionally, M. oleifera was significantly different (P <
0.05) from M. ovalifolia in potassium (K), magnesium (Mg), copper (Cu) and zinc (Zn),
but there were no significant differences in calcium (Ca), sodium (Na), phosphorus (P),
iron (Fe) and manganese (Mn) values. The almost equal nutrient values of the two

89
Moringa species, suggests that M. ovalifolia could serve as an alternative supplement for
livestock since there is known human and livestock competition for M. oleifera, and M.
ovalifolia being native and well adapted to the Namibian environmental conditions.
Hence, the hypothesis (H03) that M. oleifera and M. ovalifolia do not significantly differ
in proximate and mineral compositions was partially rejected because the two Moringa
species significantly differ in Ca, Mg and Zn but do not differ in K, Na, P, Cu, Fe and
Mn nutrient values.
Keywords: Moringa oleifera, Moringa ovalifolia, proximate composition, mineral
composition
4.2 Introduction
The diversification and production of quality feeds and fodders that are of high
metabolisability and that possess a good balance of macro- and micro-nutrients which
cost-effectively support animal production are important for achieving economically
sustainable animal production systems. For this diversification of feed and fodder
production, M. oleifera tree foliage is one of the best options to replace concentrates in
the diet of farm animals (Huque & Sarker, 2014), as its leaves are used as a high protein
forage (Radovich, 2007). In the tropics, it is used as forage for livestock, and in many
countries as a vegetable that has the potential to improve nutrition, boost food security,
foster rural development and support sustainable land care (Foidl, Makkar, & Becker,
2001; Joshua & Vasu, 2013). Moringa oleifera‘s nutritional properties have the potential
to alleviate malnutrition and starvation (Bey, 2010) in both humans and livestock
populations. Although scarce, M. ovalifolia is a drought-resistant and fodder tree eaten
by both humans and animals (Van Wyk et al., 2011).

90
Moringa oleifera leaves are highly nutritious, and are also a source of beta-carotene,
vitamin C, protein, iron and potassium (Makkar & Becker, 2007). Phytochemical
analyses of M. oleifera have shown that its leaves are particularly rich in potassium,
calcium, phosphorous, iron, and vitamins A and D, as well as in essential amino acids
(Mbikay, 2012). Research shows that every 100 grams of M. oleifera contains protein,
vitamins, minerals, carbohydrates, fats, and so on in the following amounts: 6.70 g of
protein in leaves, 2.50 g of protein in pods, 27.10 g of protein in leaf powder, 259 mg of
mineral potassium (K) in leaf power, 259 mg K in pods, 1,324 mg of K in leaf powder,
and 6.8 mg of vitamin A in leaves, 0.11 mg in pods and 16.3 mg in leaf powder (Prince,
2007). In another study, the chemical composition (of dry leaves) ranged from 19.34%
to 22.42% for protein, 1.28% to 4.96% for lipids, 7.62% to 14.60% for ash, and 30.97%
to 46.78% for dietary fibre. The leaves and flowers are a protein source with an adequate
profile of amino acids and ash, while the immature pods show a high content of dietary
fibre and low lipid content (Sánchez-Machado et al., 2009).
Moringa oleifera leaves have a high potential as a protein source supplement for
ruminants and their feeding value is similar to that of the widely used soybean meal and
rapeseed meal (Soliva et al., 2005). Its protein (25-35% in leaves) is of high quality
having significant quantities of all the essential amino acids, which is very unusual in
plant foods (Radovich, 2007). The crude protein content of extracted and unextracted M.
oleifera leaves was 43.50 and 25.10%, respectively, suggesting that both the extracted
and unextracted leaves are good sources of protein for livestock (Foidl et al, 2011).
Moringa oleifera has high energy values and can be a significant source of high crude

91
protein supplement for small ruminants and non–ruminants (Bridgemohan,
Bridgemohan, & Mohamed, 2014). It has proven to be a valuable supplement for
animals in other countries (Mendieta et al., 2007), and is readily eaten by animals as
fodder (Foidl et al., 2011). On the other hand, M. ovalifolia tree roots, bark and wood
are eaten by goats, while trees are also browsed by giraffe (Curtis & Mannheimer, 2005;
Van Wyk et al., 2011).
Moringa oleifera has long been considered a panacea for improving the nutrition of poor
communities in the tropics and subtropics (Radovich, 2007). Moringa has traditionally
been used both as a food for human consumption and as feed or fodder for animals.
However, whether used as human food or feed for livestock, the benefits of moringa
have become increasingly obvious and this demands concerted national action (Ojukwu,
2012). It is upon this background that this study was aimed at comparing the proximate
and mineral compositions of M. oleifera, which has been widely researched, with that of
M. ovalifolia which has been scantily researched and less reported in the literature.
4.3 Materials and Methods
4.3.1 Sample Collection
Thirty-day-old leaves of M. oleifera and M. ovalifolia were randomly collected with all
their twigs in March 2016 from the moringa orchard established in 2014 at the
agronomic section at the Neudamm Experimental Farm of the University of Namibia,
about 30 km east of Windhoek. Moringa oleifera is an extremely fast-growing tree and
grows and matures faster than M. ovalifolia (Prince, 2007), and it flowers within 4-5

92
months after planting (Radovich, 2007). At harvesting, M. oleifera had flowers, which
were also harvested from the grown trees. Moringa ovalifolia had not yet produced
flowers within that time frame. Leaves were randomly harvested from each block for
both Moringa species, while flowers were harvested from blocks where inorganic
fertilizers were applied and where only manure (organic fertilizer) was applied, in order
to compare their effects on the chemical and nutritional composition of the plants. Data
were collected during summer seasons when both species of moringa trees had leaves
and M. oleifera had flowers because of its early maturation and flowering. In Namibia,
summer extends from September to April of the following year, when more than 99% of
annual rainfall occurs (Pallett, 1994) and temperatures are optimal for plant growth.
Harvested leaf and flower samples were conveyed to the nutrition laboratory of the
Ministry of Agriculture, Water and Forestry in Windhoek for analysis.
4.3.2 Sample Preparation
Moringa leaves and flowers were shade-dried for two weeks, as described by Madukwe,
Ezeugwu and Eme (2013), and taken to the nutrition laboratory of the Ministry of
Agriculture, Water and Forestry in Windhoek, where subsequent preparation and
analysis were done. Moringa oleifera leaves and flowers and M. ovalifolia leaf samples
were ground to pass through a sieve with circular openings of 1mm diameter, and stored
in clean plastic bottles, labelled [Agri-Laboratory Association of Southern Africa
(AgriLASA, 1993)]; [Association of the Official Agricultural Chemists (AOAC, 1996)]
and subsequently used for all analyses.

93
4.3.3 Nutritional Analysis Procedures
Moringa oleifera and M. ovalifolia leaf and flower samples were analysed for
nutritional composition such as dry matter (DM), ash, fat, crude fibre (CF), crude protein
(CP), acid detergent fibre (ADF), neutral detergent fibre (NDF), carbohydrate, total
digestible nutrients (TDN), digestible energy (DE), metabolisable energy (ME), calcium
(Ca), phosphorus (P), sodium (Na), potassium (K), magnesium (Mg), manganese (Mn),
iron (Fe), zinc (Zn), copper (Cu) and water soluble tannins, using the procedures of
AgriLASA (1993) and AOAC (1996).
Protein content was determined through a combustion method in a CHN628 machine.
Approximately 0.1 g of a sample was weighed into a foil cup and placed in a CHN628
Leco Machine. Samples were burned at 950oC in the presence of oxygen, and then the
released gases were separated by helium. The released nitrogen was measured in a
thermal conductivity cell and the reading was sent automatically to the screen. Percent
protein was calculated by multiplying the reported nitrogen by 6.25.
Ethylenediaminetetraacetic acid (EDTA) was used for quality control during analysis
(AgriLASA, 1993; AOAC, 1996).
Crude fibre was determined using Weende method (AgriLASA, 1993), in which a FIWE
Raw Fibre Extractor was used. A ground sample of approximately 1g was weighed in
glass crucibles and inserted into the extractor to which 150 mL of diluted and preheated
sulfuric acid (H2SO4) was added, followed by 4 drops of antifoam agent (n-octanol) and
boiled for 30 minutes. Afterwards, filtering of the remaining reagent was done and
washed 3 times with de-ionized hot water. Thereafter, 150 mL of sodium hydroxide was

94
added followed by 4 drops of n-octanol and the mixture was boiled for another 30
minutes. Then, the reagent was filtered out and washed 3 times with de-ionized hot
water. The remaining residues were dried at 105oC for five hours in a conventional oven,
cooled in a desiccator and weighed to obtain the crude fibre content. The percentage of
crude fibre was calculated using the following formula:
F1−F2÷F0 x 100 (1)
where F0 = weight of sample, F1 = crude fibre plus ash content and F2 = sample plus
crucible. This same formula was used for crude fibre, acid detergent fibre and neutral
detergent fibre calculations. Ash content was determined by placing dried residues from
crude fibre in a muffle furnace at a temperature of 550oC for 5 hours, cooled it in a
desiccator and weighed to obtain the ash content (AgriLASA, 1993; AOAC, 1996).
Acid detergent fibres (ADF) were determined using the Weende method in which a
FIWE Raw Fibre Extractor (VELP Science, Italy) was used. A ground sample of
approximately 1 g was weighed in a glass crucible and inserted into the extractor, to
which 100 mL of cetyltrimethylammonium bromide technical grade (C19H42BrN) and
sulfuric acid (H2SO4) with 4 drops of n-octanol were added, and then left to boil for one
hour. Afterwards, filtering of the remaining reagent was done and it was washed 3 times
with de-ionized hot water. The remaining residues were dried at 105oC to constant
weight in a conventional oven, cooled in a desiccator and weighed to obtain the acid
detergent fibre content. The ADF was calculated using the formula:
ADF % = xs
r
w
w 100 (2)

95
where wr and ws are the weights of the residue after heating and ws is the weight of the
sample (AgriLASA, 1993; AOAC, 1996).
Neutral detergent fibres (NDF) were determined using the Weende method in which a
FIWE Raw Fibre Extractor was used. A ground sample of approximately 1g was
weighed in glass crucible, inserted into the extractor machine, then 100 mL of sodium
borate decahydrate (Na2B4O7.10H2O), disodium ethylenediaminetetraacetate (DTA,
C10H14Na2O8), sodium lauryl sulfate neutral (C12H25NaO4S), 2-ethoxyethanol (Ethylene
glycol monoethyl ether, cellosolve, C4H10O2), and disodium phosphate anhydrous
(Na2HPO4) with 4 drops of n-octanol (antifoam agent). The mixture was allowed to boil
for one hour. The boiled mixture was filtered and washed 3 times with de-ionized hot
water. The washed residue was dried at 105oC to constant weight in a conventional
oven, cooled in desiccator and weighed to obtain the neutral detergent fibre content. The
NDF was calculated using equation (2) used for ADF above.
Moisture was determined by heating samples in a vacuum oven at a temperature of
105oC to constant weight and cooling them in a desiccator as used by Sanchez et al.
(2006). Then the weight lost from the heated samples were used to calculate the
moisture content as
Moisture (%) = W2 –W3 x 100 (3)
W2 –W1
where W1 is the dish (without lid) weight, W2 is the sample plus dish and W3 is the
sample plus dish after drying (AgriLASA, 1993).

96
Fat content was determined using the Solvent Extractor Machine (VELP Scientifica,
Italy). Three grams of sample were weighed in the extraction thimbles and hooked into
the Solvent Extractor Machine. Beakers were weighed with a boiling stone in each of
them and 60 mL of petroleum ether was added and then put in the extractor machine in
which the extraction thimbles were submerged. The tap was open for condensation and
the machine knob was moved to level one (immersion) and boiled at 110oC temperature
for an hour, then the knob was moved to level two (washing) for another hour of boiling
and finally, the knob was moved to level three (recovery) for the last one-hour of
boiling. A boiling stone was used to create a calm boiling process. After boiling, the
beakers with the recovered samples were placed in a conventional oven at 105oC
temperature to dry for 30 minutes. Subsequently, beakers were removed and placed in a
desiccator, cooled and weighed, and the fat content was calculated as
Crude fat (%) = MFR – MF x 100 (4)
m
where m, MF and MFR represent mass of sample used, mass of flask, and mass of flask
with extracted reside, all in grams, respectively (AgriLASA, 1993; AOAC, 2006).
Mineral analysis was determined by the Atomic Emission Spectroscopy (AES) method
using an Inductively Coupled Plasma (ICP) instrument, Thermo Fisher Scientific,
United Kingdom. Calcium, phosphorus, sodium, potassium, magnesium, manganese,
iron, zinc and copper content were analysed. This analytical method allows the isolation
of minerals from organic matter by first ashing samples prior to the analysis. The ashed
samples were digested consecutively by hydrochloric and nitric acids to decompose
them. The digested samples were filtered before being diluted with de-ionized water.

97
The sample diluents were injected into ICP-MS instrument for analysis, which gave the
concentration of individual minerals.
Water soluble tannins were determined using an in-house method of aqueous extraction,
followed by colorimetric determination (Folin and Ciocalteu‘s phenol regent). Non-
structural carbohydrates were determined using calculated differences; total digestible
nutrients, digestible energy and metabolisable energy were also determined by
calculation (AOAC, 1996; Galyean, 2010).
4.3.4 Data Analysis
An independent sample t-test analysis was used to compare M. oleifera and M. ovalifolia
nutrient composition. A one-sample t-test was used to compare individual species of
moringa based on fertilizer treatment levels in which the means of the control treatment
nutrient composition were compared to those of fertilized treatment levels using the
Statistical Package for Social Sciences (SPSS® version 23). All statistical analyses were
only considered significantly different at the alpha levels of p ≤ 0.05 and all p-values
above these alpha levels were considered non-significant. Means of treatments were
derived using the Microsoft Office Excel® program that compared the nutrient
composition of M. oleifera and M. ovalifolia.
4.4. Results and Discussion
The results from this research include the proximate and mineral compositions of M.
oleifera leaves and flowers and those of M. ovalifolia leaves obtained in the analysis.
The results for moisture, ash, fat, crude fibre, crude protein, acid detergent fibre, neutral

98
detergent fibre, calcium, phosphorus, potassium, sodium, magnesium were presented in
percent dry weight (% DW), while copper, iron, manganese and zinc were in parts per
million (ppm), with total digestible nutrients g/100g, digestible energy MJ/kg,
metabolisable energy MJ/kg and water-soluble tannins g/100g and results are presented
on ―as is‖ basis as discussed by Barnhart & Hoyer (2010) and Mason (n.d.).
4.4.1 Nutrient Composition of M. oleifera and M. ovalifolia
Tables 4.1 and 4.2 present the proximate composition of M. oleifera and M. ovalifolia
leaves in a descriptive statistics and an independent sample t-test analysis. The results
(Table 4.1) show that for both Moringa species CP levels were the highest, followed by
NDF, ADF, ash, CF, fat, and moisture in this order among the two species. M. oleifera
had a higher overall mean value in CP (30.99%) than M. ovalifolia (28.68%). Crude
protein in both Moringa species in this research was higher than 27.10% and 18.49% as
reported by Fuglie (2001) and Mutiara, Estiasih and Sriwahyuni (2013), respectively for
M. oleifera. According to Mpofu (2004), a CP content of less than 7% is known to limit
forage intake and small ruminant performance, which normally occurs during dry
months, leading to the search for alternative protein sources. The CP content in the two
Moringa species was 28.86-30.99%; thus, making both of these species good alternative
sources for protein supplements. Foidl et al. (2011) pointed out that due to the high
crude protein content of M. oleifera leaves (43.50%), it is a good source of protein for
livestock. However, M. ovalifolia was higher in NDF (13.92%), ADF (11.78%) and ash
(11.32%) than M. oleifera, which makes M. ovalifolia more suitable for animal feed
supplement. Tisch (2006) explained that structural carbohydrate, measured as NDF,
constitutes the cell wall of a plant and includes the fibre fractions of cellulose,

99
hemicellulose, lignin and neutral detergent fibre insoluble protein (NDFIP). When a
feedstuff‘s ADF is high, however, it will be of low digestibility to animals. Moringa
oleifera leaves‘ proximate analysis results showed that CP had higher nutrient value of
43.53% than of all other nutrients (Fagwalawa et al., 2014). On the other hand, the
nutrient values obtained were higher than those obtained in Nigeria with M. oleifera
leaves by Ogbe and Affifu (2011). Moisture contents of 6.200% and 6.025% for M.
ovalifolia and M. oleifera were lower than the 7.50% reported by Fuglie (2001) for M.
oleifera. Moisture (6.98%) and Fat (4.19%) of M. oleifera as reported by Romuald et al.
(2016) were in concurrence with the present study result but CP (25.8%) was lower;
however, CP (43.53%) reported by Fagwalawa et al. (2014) was much higher than the
levels found in this study in both species of moringa. Ash and CP contents (4.48%) and
(15.93%) respectively, reported by Fayomi et al. (2014) were much lower compared to
those found in the current study, but CF was comparatively higher (11.84%).
Statistically (Table 4.2), M. oleifera‘s proximate nutrient values of DM, ash, fat, CP, CF,
ADF and NDF had no significant differences (P > 0.05) from those of M. ovalifolia.
This means that proximate nutrient values are similar in both Moringa species. Thus, the
hypothesis (H03) that M. oleifera and M. ovalifolia do not significantly differ in
proximate compositions was accepted because both Moringa species do not differ
nutrient values.

100
Table 4.1: Descriptive statistics for Moringa species leaves proximate
composition
Nutrients Moringa spp. N Mean
Standard
Deviation
Standard Error
Mean
Moisture M. oleifera 4 6.03 0.19 0.09
M. ovalifolia 4 6.20 0.27 0.13
Ash M. oleifera 4 10.65 0.37 0.18
M. ovalifolia 4 11.32 1.40 0.70
Fat M. oleifera 4 6.61 1.23 0.61
M. ovalifolia 4 5.80 0.88 0.44
CP M. oleifera 4 30.99 0.22 0.11
M. ovalifolia 4 28.68 3.50 1.75
CF M. oleifera 4 8.12 0.18 0.09
M. ovalifolia 4 8.46 1.45 0.73
ADF M. oleifera 4 10.96 1.48 0.74
M. ovalifolia 4 11.78 1.25 0.63
NDF M. oleifera 4 12.84 2.23 1.11
M. ovalifolia 4 13.92 2.98 1.49
Note: Mean of nutrient contents
Table 4.2: Independent sample t-test of M. oleifera and M. ovalifolia leaves
proximate composition
Nutrients
Mean
Difference
Pooled Standard
Error Difference
t
df P-values
Moisture 0.18 0.16 1.07 6 0.326ns
Ash 0.67 0.72 0.92 6 0.394ns
Fat -0.81 0.77 -1.08 6 0.323ns
CP -2.31 1.75 -1.32 6 0.235ns
CF 0.34 0.73 0.47 6 0.655ns
ADF 0.81 0.97 0.84 6 0.434ns
NDF 1.08 1.86 0.58 6 0.582ns
Moist=Moisture, CP = Crude protein, CF = Crude fibre, ADF = Acid detergent fibre and
NDF = Neutral detergent fibre and measured in g/100 g DM. Results are presented ‗as is‘.
Note: Mean difference of nutrient contents; ns = non-significant at 0.05 alpha level
Tables 4.3 and 4.4 present a descriptive statistics and an independent sample t-test of M.
oleifera and M. ovalifolia leaves‘ mineral composition in which analysis was done for
Ca, P, K, Mg, Na as macro-nutrients and Cu, Fe, Mn and Zn as micro-nutrients. Macro-
minerals are needed in relatively larger amounts in animal diets, while the micro-
minerals (trace elements) are needed in very small amount in diets (Jurgens et al., 2012).
Among micro-nutrients, Fe had the highest mean, with 174.70 ppm and 177.11 ppm,

101
followed by Zn (13.51 ppm and 20.50 ppm) and Cu (13.10 ppm and 15.10 ppm).
Manganese (0.001 ppm and 0.36 ppm) was found to be the least for M. oleifera and M.
ovalifolia. Iron (28.20) and Cu (0.57) values reported by Fuglie (2001) were lower than
the values found in this study (see Table 4.3). However, Ca, K, Mg and P were higher in
this study than those found in the current research. For macro-nutrients, Ca (1.71% and
1.26%) for M. ovalifolia and M oleifera had the highest values, while P, K, Mg and Na
were all < 1% for both species. An elemental composition of M. oleifera leaves from
Chad reported by Mbailao et al. (2014) showed the following values: Na (0.08%), K
(1.73%), Ca (1.23%), Mg (0.39%), P (0.32%), Fe (97.12 ppm), Mn (29.33 ppm), Zn
(19.14 ppm) and Cu (9.07 ppm), which are concurrent with the present research
findings, except for Fe and Cu which were much lower in value compared to the current
findings (see Table 4.3). However, Mn was higher than that was found in that previous
work. Statistically, M. oleifera was significantly different (P < 0.05) from M. ovalifolia
in Ca, Mg and Zn content, but there were no differences (P > 0.05) in K, Na, P, Cu, Fe
and Mn mineral values (Table 4.4). This implies that both Moringa species have a
similar quantity of Na, P, Fe and Mn in their leaf tissues. The differences in mineral
nutrient values can be attributed to the higher ash content of M. ovalifolia as compared
to M. oleifera, because it is an approximation of the total mineral (inorganic) portion of
the feed sample as defined by Tisch (2006). Therefore, the hypothesis (H03) that M.
oleifera and M. ovalifolia do not significantly differ in mineral compositions was
rejected because both Moringa species differ in Ca, Mg and Zn content; but, the same
hypothesis was accepted because both species of moringa do not differ in K, Na, P, Cu,
Fe and Mn mineral values.

102
Table 4.3: Descriptive statistics for Moringa species leaf mineral
composition
Nutrients
Moringa spp. N Mean
Standard
Deviation
Standard Error
Mean
Macro-nutrients (% DM)
Ca M. oleifera 4 1.21 0.36 0.18
M. ovalifolia 4 1.71 0.18 0.09
K M. oleifera 4 0.58 0.21 0.10
M. ovalifolia 4 0.80 0.08 0.04
Mg M. oleifera 4 0.07 0.03 0.01
M. ovalifolia 4 0.18 0.08 0.04
Na M. oleifera 4 0.66 0.97 0.49
M. ovalifolia 4 0.22 0.14 0.07
P M. oleifera 4 0.27 0.13 0.06
M. ovalifolia 4 0.37 0.07 0.04
Micro-nutrients (ppm)
Cu M. oleifera 4 15.09 1.25 0.62
M. ovalifolia 4 13.10 2.93 1.47
Fe M. oleifera 4 177.11 4.21 2.11
M. ovalifolia 4 174.73 22.85 11.43
Mn M. oleifera 4 0.36 0.72 0.36
M. ovalifolia 4 0.001 0.00 0.00
Zn M. oleifera 2 20.35 0.51 0.36
M. ovalifolia 4 13.51 1.01 0.50
Note: mean of nutrient values
Table 4.4: Independent sample t-test for M. ovalifolia and M. oleifera
leaves mineral composition
Nutrients
Mean
Difference
Pooled Standard
Error Difference t df P-values
Macro-nutrients (% DM)
Ca 0.51 0.20 2.52 6 0.046*
K 0.22 0.11 1.97 6 0.097ns
Mg 0.11 0.04 2.67 6 0.037*
Na -0.43 0.49 -0.88 6 0.413ns
P 0.10 0.07 1.42 6 0.207ns
Micro-nutrients (ppm)
Cu -2.00 1.59 -1.25 6 0.257ns
Fe -2.37 11.62 -0.20 6 0.845ns
Mn -0.36 0.36 -1.00 6 0.356ns
Zn -6.84 0.79 -8.69 4 0.001***
Ca = Calcium, P = Phosphorus, K = Potassium, Mg=Magnesium, Na=Sodium = % and
Cu = Copper, Fe = Iron, Mn = Manganese, Zn = Zinc = ppm, DM = Dry Matter (g/100 g DW).
Results are presented ‗as is‘. Note: ns = non-significant 0.05; * = significant at 0.05; *** =
extremely significant to ≤ 0.001 at alpha levels; mean difference of nutrient values

103
Table 4.5 reveals TDN, DE, ME and Tannin contents in M. oleifera and M. ovalifolia
leaves. The results obtained showed that M. oleifera leaves had higher TDN content
(67%) and ME content (11 MJ/kg), while DE (12 MJ/kg) was equal in both species of
moringa, which is higher than 9.20 MJ/kg of ME from an extracted M. oleifera leaves as
reported by Makkar and Becker (1996). Tannin (tannic acid) content was higher in M.
ovalifolia leaves (4.40%) than in M. oleifera leaves (3.90%). Total digestible nutrient
had the highest means and standard error of the mean (SEM) (64.50% and 2.50%
respectively), followed by DE mean (12% MJ/kg), ME mean and SEM contents
(10.50% and 0.50% respectively). However, M. ovalifolia had a higher tannin mean
(4.40 g/100g) than M. oleifera (3.90 g/100g), with a total mean of 4.15 g/100g. The
tannins of M. oleifera (3.90 g/100g) in this study concurred with the condensed tannins
result (3.20%) of M. oleifera leaves analysed by Moyo et al. (2010) from South Africa.
A study of M. oleifera leaves and soft twigs by Kakengi et al. (2005) found a low tannin
concentration of ≤ 2%, lower than the results of both Moringa species in this study.
Ojiako's (2014) study on quantitative analysis of phytochemical compounds present in
the leaf extract of M. oleifera shows an 8.22% tannin content, which is higher than that
obtained in either Moringa species in the current study.
Table 4.5: Total digestible nutrients, digestible energy, metabolisable energy
and tannin contents in M. oleifera and M. ovalifolia leaves
Nutrients (g/100 g) M. oleifera M. ovalifolia
Total
Mean
Standard
Deviation SEM
Total digestible nutrients 67 62 64.50 3.54 2.50
Digestible energy 12 12 12.00 0.00 0.00
Metabolisable energy 11 10 10.50 0.71 0.50
Tannins (tannic acid) 3.90 4.40 4.15 0.35 0.25
TDN = Total Digestible Nutrients g/100g; DE = Digestible Energy MJ/kg; and ME =
Metabolisable Energy MJ/kg; Tannins = Tannic Acid. Results are presented ‗as is‘. Note:
mean of nutrient values

104
4.4.2 Comparison of M. oleifera Nutritional Compositions at Different Treatment
Levels
Table 4.6 shows the proximate composition of M. oleifera leaves, in which all the
fertilizer treatment levels (treatment2, treatment3 and treatment4)‘s means were
compared with the treatment1 (control)‘s means to determine the mean differences in
nutrient values. Moringa oleifera seedlings were transplanted into two plots and four
microplots with four fertiliser treatment levels. The treatment levels were treatment1 (0
g), treatment2 (100 g), treatment3 (200 g) and treatment4 (300 g) of superphosphate
fertilizer with a P content of 83 g/kg (Wonder superphosphate granular, AGRO-SERVE
(Pty) Ltd., Bryanston, South Africa was applied for root development. Also, Nitrogen
fertilizer with an N content of 280 g/kg (Limestone Ammonium Nitrate - LAN),
WONDER HORTICULTURAL PRODUCTS (Pty) Ltd., Silverton, South Africa, was
applied at the aforementioned treatment levels for leaves and canopy development. The
results of the proximate composition show that the means of moisture (6.04%), fat
(6.91%), ADF (11.26%) and CP (31%) were higher for treatment2, treatment3 and
treatment4 than for the control treatment; it similarly reveals a progressive increment as
the level of applied fertilizers increased. On the contrary, CF (8.15%), ash (10.78%) and
NDF (15.73%) were higher in the control treatment, an indication that M. oleifera
naturally contains high CF, ash and NDF without fertilizer application as discussed by
Fuglie (2001). Crude fibre in this study was lower than 11.84% reported by Fayomi et
al. (2014); however, CP and ash were higher in this study than what they reported
(15.93% and 4.89% against 31% and 10.78%). The moisture and ash contents 6.98%
and 8.35% reported by Romuald et al. (2016) from Ivory Coast concur with the results
of this research, but the CP they reported was lower (25.81% against 31.00%).

105
Statistically, only NDF was significantly different (P < 0.05) from the control treatment,
which might be attributed to either M. oleifera‘s naturally high level of NDF or fertilizer
effect.
Table 4.6: Proximate composition of M. oleifera leaves at different treatments
Nutrients
(% DM)
Mean
Standard
Deviation
Standard
Error Mean
t
P-values
Control
treatment
Fertilizer
treatments
Moisture 5.98 6.04 0.23 0.13 0.51 0.661n.s
Ash 10.78 10.61 0.44 0.25 -0.64 0.585ns
Fat 5.70 6.91 1.30 0.75 1.62 0.247n.s
CP 30.95 31.00 0.27 0.15 0.33 0.775n.s
CF 8.15 8.10 0.22 0.12 -0.38 0.743n.s
ADF 10.06 11.26 1.66 0.96 1.26 0.334n.s
NDF 15.73 11.87 1.34 0.77 -4.98 0.038*
Moist = Moisture, CP = Crude protein, CF = Crude fibre, ADF = Acid detergent fibre and
NDF = Neutral detergent fibre, DM = Dry Matter (g/100 g DW). Results are presented
‗as is‘. Note: ns = non-significant at 0.05; *= significant at 0.05 alpha levels.
Table 4.7 shows the mineral composition of M. oleifera leaves in which the fertilizer
treatment levels (treatment2, treatment3 and treatment4) means were compared with the
control (treatment1) mean to determine the mean differences in nutrient values. The
means of Mg (0.08%), Mn (0.48 ppm), K (0.58%), Cu (15.26 ppm), and Zn (21.01 ppm)
mineral nutrient values were higher for treatments where fertilizers were applied in
comparison with the control (treatment1). Phosphorus (0.29%), Ca (1.42%), Na (2.11%)
and Fe (181.72%) were higher in the control treatment. Statistically, Mg was highly
significantly different (P < 0.001) from the control treatment.

106
Table 4.7: Mineral composition of M. oleifera leaves at different treatment
levels
Nutrient
Mean
Standard
Deviation
Standard
Error Mean
t
P-values Control
treatment
Fertilizer
treatments
Macro-nutrients (% DM)
Ca 1.42 1.14 0.40 0.23 -1.22 0.347ns
P 0.29 0.26 0.15 0.09 0.07 0.951ns
K 0.57 0.58 0.25 0.15 0.86 0.482ns
Mg 0.06 0.08 0.03 0.02 -35.37 0.001***
Na 2.11 0.17 0.10 0.06 -0.33 0.773ns
Micro-nutrients (ppm)
Cu 14.59 15.26 1.47 0.85 0.80 0.508ns
Fe 181.72 175.57 3.52 2.03 -3.03 0.094ns
Mn 0.001 0.48 0.83 0.48 1.00 0.423ns
Zn 18.96 21.01 1.21 0.70 -1.22 0.098ns
Ca = Calcium, P = Phosphorus, K = Potassium, Mg=Magnesium, Na=Sodium = % & Cu =
Copper, Fe = Iron, Mn = Manganese, Zn = Zinc = ppm, DM = Dry Matter (g/100 g DW).
Results are presented ‗as is‘. Note: ns = non-significant at 0.05; *** = extremely significant
to ≤ 0.001 alpha levels.
Table 4.8 shows the comparison of proximate composition of M. oleifera treatment
levels (treatment1, treatment2, treatment3 and treatment4). Phosphorus and N fertilizers
were applied as treatments as follows: treatment1 (0 g), treatment2 (100 g), treatment3
(200 g) and treatment4 (300 g), in which treatment1 served as a control. The results for
proximate composition show that CP was the highest followed by NDF, ADF and ash
while the DM, fat and CF nutrient values were < 9%. Among the four treatments, CP
values were almost the same; in treatment3 (30.70), treatment1 (30.95), treatment2
(31.10) and treatment4 (31.20), which indicates that M. oleifera needs little or no
inorganic fertilizers to maintain its protein content level. NDF was indirectly
proportional to fertilizer levels as it had declining values as the fertilizer levels
increased. This means that the higher the amount of applied fertilizers, the lesser
nutrients it yields. For ADF, treatment3 had the highest nutrient value (13.18%) which
was followed by treatment4 (10.31%), treatment2 (10.31%) and treatment1 (10.06%)
respectively. The highest Ash content was found in leaves from treatment2 (11.07),

107
followed by those from treatment1 (10.78%), from treatment4 (10.57%) and from
treatment3 (10.20%), respectively. Ash is the total mineral content of plants or animals
(Jurgens et al., 2012).
Table 4.8: Proximate composition of M. oleifera leaves at different fertilizer
treatment levels
Fertilizer treatment
levels Moist Ash Fat CP CF ADF NDF
Treatment1 (0 g) 5.98 10.78 5.70 30.95 8.15 10.06 15.73
Treatment2 (100 g) 6.19 11.07 6.11 31.10 8.03 10.31 13.42
Treatment3 (200 g) 5.78 10.20 8.42 30.70 8.35 13.18 11.20
Treatment4 (300 g) 6.16 10.57 6.21 31.20 7.94 10.31 11.00
Moist=Moisture, CP = Crude protein, CF = Crude fibre, ADF = Acid detergent fibre and
NDF = Neutral detergent fibre and measured in g/100 g DW. Results are presented ‗as is‘.
Table 4.9 presents the comparison of the mineral composition of M. oleifera leaves
harvested from microplots with four levels of phosphorus and nitrogen fertilizer
treatments (treatment1= 0 g, treatment2 = 100 g, treatment3 = 200 g and treatment4 =
300 g) each. The results revealed that Fe had the highest values among the minerals,
followed by Zn and Cu, while Ca, K, Mg, Na, P and Mn were < 3% in values. The
control treatment (treatment1) had the highest content of Fe (181.72 ppm), followed by
treatment4 (178.97 ppm), treatment2 (175.80% ppm) and treatment3 (171.93 ppm),
consecutively. This implies that M. oleifera naturally contains Fe in large quantity and
fertilizer application may have little or no effect at all. Interestingly, Zn was the second
highest mineral component, increased in values as the levels of fertilizers increased
according to treatment levels, that is, treatment1 (18.96 ppm), treatment2 (19.99 ppm),
treatment3 (20.71 ppm) and treatment4 (22.34 ppm). This means that an increase in
fertilizer levels resulted in an increment in Zn values. Like Fe, Cu increased randomly;

108
treatment2 (16.89 ppm), treatment3 (14.86 ppm), treatment1 (14.59 ppm) and treatment4
(14.04 ppm). Minerals make up only a relatively small amount of the diet of animals.
Nevertheless, they are vital to the animals‘ diet, and their supplementation is required in
most situations for high-producing animals (Church, 1991).
Table 4.9: Mineral composition of M. oleifera leaves at different fertilizer
treatment levels
Fertilizer treatment
levels
C
a P K Mg Na Cu Fe Mn Zn
Macro-nutrients (% DM) Micro-nutrients (ppm)
Treatment1 (0 g) 1.42 0.29 0.57 0.06 2.11 14.59 181.72 <0.001 18.96
Treatment2 (100 g) 1.30 0.43 0.76 0.12 0.21 16.89 175.80 <0.001 19.99
Treatment3 (200 g) 1.43 0.22 0.69 0.05 0.25 14.86 171.93 1.43 20.71
Treatment4 (300 g) 0.67 0.13 0.29 0.07 0.06 14.04 178.97 <0.001 22.34
Note: g/100 g DW
Table 4.10 compares the proximate and mineral composition of flowers and leaves from
M. oleifera fertilized with organic (cow manure) and inorganic (P and N) compounds.
The proximate compositions analysis considered moisture, Ash, Fat, CP, CF, ADF and
NDF while the mineral composition analysis targeted Ca, P, K, Mg, Na, Cu, Fe, Mn and
Zn. In comparison, M. oleifera leaves from inorganic fertilizer treatments and from
organic fertilizer treatments had higher nutrient values in NDF (55.68% and 33.28%),
CP (33.90% and 33.90%) and Ash (10.39% and 10.78%), respectively. Flowers from
plants fertilized with inorganic and organic compounds were higher in Fe (295.71 ppm
and 270.44 ppm), Zn (41.65 ppm and 34.07 ppm) and Cu (13.73 ppm and 15.79 ppm)
micro-nutrients. Even though the content of many minerals was higher in flowers, leaves
had higher Mn (34.48 ppm and 25.22 ppm) than flowers (0.001 ppm and 0.001 ppm).
Macro-nutrients such as Ca, P, K and Mg were quite high in the manured M. oleifera
plants leaves Ca (5.08%), P (3.01%) and K (2.86%) sequentially. As observed from the

109
nutrient values, M. oleifera leaves are higher in proximate values than flowers; on the
other hand, flowers are richer in minerals than in leaves. Among the minerals, micro-
minerals (Fe, Cu, Zn and Mn) had higher values than macro-minerals (Ca, P, K, Mg and
Na).
Table 4.10: Organic and inorganic leaf and flower nutrient compositions of
M. oleifera
Nutrients Inorganic flower Inorganic leaves Organic leaves Organic flowers
Moisture 6.12 4.18 4.24 5.98
(%DM)
Ash 8.08 10.39 10.78 7.83
Fat 5.57 0.92 1.69 3.71
CP 22.90 33.90 33.90 21.10
CF 10.47 10.90 8.47 8.36
ADF 15.49 17.17 12.35 17.06
NDF 21.08 55.68 33.28 21.08
Macro-nutrients (%DM)
Ca 1.5810 1.54 5.08 2.04
P 0.38 1.42 3.01 0.45
K 0.74 1.18 2.86 0.91
Mg 0.12 0.34 1.01 0.12
Na 0.15 0.001 0.04 0.20
Micro-nutrients (ppm)
Cu 13.73 7.19 8.21 15.79
Fe 295.72 95.02 104.97 270.44
Mn 0.001 34.48 25.22 0.001
Zn 41.65 10.66 10.63 34.07
Moist=Moisture, CP = Crude protein, CF = Crude fibre, ADF = Acid detergent fibre and
N DF = Neutral detergent fibre and measured in g/100 g DM. Ca=Calcium, P=Phosphorus,
K=Potassium, Mg=Magnesium, Na=Sodium = % & Cu=Copper, Fe=Iron, Mn=Manganese,
Zn=Zinc (g/100 g DW). Results are presented ‗as is‘.
4.4.3 Proximate and Mineral Composition of M. oleifera from Different Regions of
Namibia and Africa
Table 4.9 shows the manured grown M. oleifera leaf proximate composition which were
collected from four locations in Namibia: the Neudamm (NEU.) cultivated field, the
Neudamm Campus, Rundu (Kaisosi), and Windhoek city. The Neudamm Field is an
agronomic field about 1.5 km outside the Neudamm Campus where moringa was

110
cultivated. The Neudamm Campus itself has three old M. oleifera trees. Kaisosi is a
location in Rundu Town, and Windhoek is the capital city of Namibia. The parameters
considered were DM, Ash, Fat, CP, CF, ADF and NDF. Moringa oleifera leaves from
the Neudamm cultivated field had the highest values in NDF (14.77%) and CP
(30.95%), followed by the leaves harvested from the Neudamm Campus trees in Fat
(5.81%), CF (9.73%) and NDF (13.88%). Leaves from Windhoek City had a higher
content of moisture (6.30%) and were second in CP (29%), while leaves from Rundu
(Kaisosi) had the highest content of NDF (16.39%).
Table 4.11: Proximate composition of M. oleifera leaves from four locations
of Namibia
Locations Moisture Ash Fat CP CF ADF NDF
NEU. Field 5.98 10.78 5.70 30.95 8.15 10.06 15.73
NEU. Trees 6.16 13.55 5.81 21.90 9.73 13.88 14.77
Rundu (Kaisosi) 6.11 10.64 5.64 27.20 7.76 8.91 16.39
Windhoek 6.30 15.50 4.45 29.00 8.15 8.70 15.52
Moist=Moisture, CP = Crude protein, CF = Crude fibre, ADF = Acid detergent fibre and
NDF = Neutral detergent fibre and measured in g/100 g DW. Results are presented ‗as is‘.
Table 4.10 shows the mineral compositions of M. oleifera from four locations in
Namibia, which were Neudamm cultivated field, Neudamm Campus, Rundu (Kaisosi)
and Windhoek city. Iron, Zn, Cu and Mn had high values among the micro-minerals.
Neudamm Campus trees had the highest Fe content (196.84 ppm), followed by those
from Rundu, Kaisosi (182.97 ppm), then from Neudamm cultivated field (181.72 ppm),
and finally from Windhoek City (150.50). The highest values for Cu were found in
leaves from Windhoek City (14.59 ppm). This was followed by leaves from Neudamm
cultivated field (12.37 ppm), Rundu, Kaisosi (10.51 ppm), and Neudamm Campus had
the least content (9.40 ppm). Concerning Zn values, leaves collected from Neudamm

111
Campus trees had 10.60 ppm, leaves from Neudamm cultivated field - 18.96 ppm, leaves
from Windhoek City - 20.50 ppm and leaves from Kaisosi, Rundu - 20.71 ppm. On the
other hand, M. oleifera leaves from Neudamm trees had higher Mn value of 76.50 ppm
as an outlier while leaves from other locations had less than 0.001 ppm of Mn. As seen
in Table 3.9, M. oleifera leaves from trees found in the four locations of Namibia have
quite similar nutrient profiles. Among macro-minerals such as Ca, P, K, Mg and Na,
Windhoek City had the highest P value of 2.11% while Neudamm Campus had the
lowest Na value of 0.05%. This means that location has very little or no impact on their
nutrient contents. Statistically, there were no significant differences (P > 0.05) in M.
oleifera leaves nutrient values although leaves were collected from different locations of
Namibia.
Table 4.12: Mineral composition of M. oleifera leaves from four locations of
Namibia
Locations
Macro-nutrients (% DM) Micro-nutrients (ppm)
Ca P K Mg Na Cu Fe Mn Zn
NEU. field 1.76 0.32 0.70 0.17 0.13 12.37 182.97 <0.001 20.71
NEU. trees 0.83 0.31 1.76 0.65 0.05 9.40 150.50 76.50 20.50
Rundu 1.92 0.38 0.78 0.14 0.15 10.51 196.84 <0.001 10.60
Windhoek 1.42 2.11 0.29 0.57 0.06 14.59 181.72 <0.001 18.96
Ca=Calcium, P=Phosphorus, K=Potassium, Mg=Magnesium, Na=Sodium = % &
Cu=Copper, Fe=Iron, Mn=Manganese, Zn=Zinc in g/100 g DW. Results are presented ‗as is‘.
Moringa oleifera tree has a very high concentration of nutrients. It is native to India, but
has been planted around the world. Thus, this tree has become naturalized in many
countries, of which Africa is no exception (Fuglie, 2001; Sanchez et al., 2006; Prince,
2007). Table 4.11 presents M. oleifera leaves proximate composition from four regions
of Sub-Saharan Africa, namely: Central (Chad), East (Ethiopia), South (Namibia), and
West (Nigeria). Moisture ranges from 3.21% to 6.16%, with leaves from Nigeria having

112
less moisture percentage than those from Namibia, while leaves from Chad had 20.92%
moisture content. Leaves from Namibia and Ethiopia had the highest content of ash
(13.55% and 13.20% respectively), with those from Chad having the least ash content
(6.73%). Leaves from Ethiopia and Namibia had the highest Fat content (6.73% and
5.81% respectively) with those from Chad and Nigeria having 2.11% and 2.34% fat
content, respectively. Leaves from Chad and Ethiopia had higher CP (32.06% and
28.90%), while those from Namibia and Nigeria were lower (21.90% and 17.01%).
Leaves‘ crude fibre had similar content across the four regions, ranging from 7.09% to
9.73%, with leaves from Namibia having the highest content and Nigeria, the least.
Leaves from Namibia had higher ADF contents (13.88%) and NDF (14.77%) than those
from Ethiopia (8.49% and 11.40% for ADF and NDF, respectively). These results were
reported by Melesse (2011) from Ethiopia; Ogbe and Affifu (2012) from Nigeria; and
Mbailao et al. (2014) from Chad. Leaves from Namibia were the highest in most
proximate composition except for fat and CP, for which Ethiopia and Chad had the
highest contents correspondingly. Among the four regional nations, leaves from Nigeria
had the lowest nutrient values.
Table 4.13: Proximate composition of M. oleifera leaves from different
African regions
Locations Moisture Ash Fat CP CF ADF NDF
Chad 20.92 (DM) 6.73 2.34 32.06 8.07 --- ---
Ethiopia --- 13.20 6.73 28.90 8.51 12.10 16.70
Namibia 6.16 13.55 5.81 21.90 9.73 13.88 14.77
Nigeria 3.21 7.93 2.11 17.01 7.09 ---- ----
Nutrients were measured in (g/100g DW) for all analyses
Source: Melesse (2011) from Ethiopia; Ogbe and Affifu (2012) from Nigeria; and Mbailao et
al. (2014) from Chad.

113
The mineral composition of M. oleifera leaves from the four regions of Sub-Saharan
Africa which include Central (Chad), East (Ethiopia), South (Namibia) and West
(Nigeria) is summarised in Table 4.12. It shows M. oleifera leaves‘ composition in terms
of macronutrients (Ca, P, K, Mg and Na) and micronutrients (Cu, Fe, Mn and Zn). These
results were reported by the same authors as for the proximate analysis of M. oleifera
leaves (see Table 4.10), while the data for Namibia were generated by the current
research. The results presented show that moringa leaves from Nigeria had the highest
content of macro-nutrients such as Ca (1.91%), P (30.15%) and Na (192.95%), while
leaves from Chad, Ethiopia and Namibia had quite similar values. Concerning micro-
nutrient contents, leaves from Nigeria also had the highest values of Mn (81.65 ppm)
and Zn (60.06 ppm), and leaves from Namibia had the highest content of Fe (150.50
ppm). On the other hand, leaves from Chad and Namibia had the higher values of Cu
(9.07 ppm and 9.40 ppm) respectively, while those from Nigeria had the lowest Cu
values. Moringa leaves from Ethiopia were not analysed for micro-nutrients. The slight
differences in mineral composition might be attributed to soil nutrient compositions at
production sites, as discussed by Grusak (2001). However, M. oleifera maintains its
nutritional values at almost the same level despite regional ecological differences among
the four countries.

114
Table 4.14: Mineral composition of M. oleifera leaves from different African
regions
Locations
Macro-nutrients Micro-nutrients
Ca P K Mg Na Cu Fe Mn Zn
Chad 1.23 0.32 1.73 0.39 0.08 9.07 97.12 29.33 29.14
Ethiopia 2.62 0.43 2.00 0.56 0.03 -- -- -- --
Namibia 0.83 0.31 1.76 0.65 0.05 9.40 150.50 76.50 20.50
Nigeria 1.91 30.15 0.79 0.38 192.95 6.18 107.48 81.65 60.06
In Namibia, Ca=Calcium, P=Phosphorus, K=Potassium, Mg=Magnesium, Na=Sodium = % &
Cu=Copper, Fe=Iron, Mn=Manganese, Zn=Zinc = ppm (g/100 g DW); Nigeria, Ca = %, P = ppm, K =
ppm, Mg = ppm, Na =% & Cu =ppm, Fe = ppm, Mn = ppm, Zn = ppm; Ethiopia, Ca, P, K, Mg, Na = %
& Cu, Fe, Mn, Zn = % DM; and Chad, Ca, P, K, Mg, Na = % DM; Cu, Fe, Mn, Zn =ppm. Source:
Melesse (2011) from Ethiopia; Ogbe and Affifu (2012) from Nigeria; and Mbailao et al. (2014) from
Chad
4.4.4 Comparison of M. ovalifolia Nutrient Compositions at Different Treatment
Levels
The comparison of M. ovalifolia leaf proximate composition within fertilizer treatment
levels using the control treatment mean as a test value in a one-sample t-test is found in
Table 4.15. Just as M. oleifera, M. ovalifolia was transplanted in plots with four fertilizer
treatment levels in which treatment1 was the control (0 g); treatment2 received 100 g,
treatment3 - 200 g and treatment4 - 300 g phosphorus and nitrogen fertilizer application.
The analysis of the results shows that leaves from the control (treatment1) had higher
moisture content (6.37%), ash (12.61%), fat (6.17%), CP (31.50%), CF (10.08%) ADF
(12.87%) and NDF (16.72%) values in comparison to experimental treatments
(treatment2, treatment3 and treatment4). The higher proximate composition of leaves
from control treatment is a clear indication that M. ovalifolia needs neither phosphorus,
nor nitrogen fertilizers to produce quality/nutrient-rich leaf biomass. Moringa ovalifolia,
like M. oleifera, contains a high level of CP under organic production, which makes it a
better alternative feed supplement for animals without human-livestock conflict and high
cost. Church (1991) and Tisch (2006) emphasized that protein sources for livestock

115
rations are more expensive than carbohydrate sources and the most costly component of
a finished feed. The same author mentioned that most plant sources of CP (beans,
alfalfa, coconut, sunflower, and so on) range from 20% to 40+ %, and the CP content in
both Moringa species confirms this rule with 31.00% and 31.50% for M. oleifera and M.
ovalifolia, respectively. There were no significant differences (P > 0.05) between the
control treatment and the experimental treatments in all nutrient values, which is in
agreement with the findings of Fuglie and Sreeja (2001) Radovich (2007) that moringa
needs little or no fertilizers.
Table 4.15: Proximate composition of M. ovalifolia leaves at different
treatment levels
Nutrient
Treatment Means Standard
Deviation
Standard
Error Mean
t
P-values Control Fertilized
Moist 6.37 6.1430 0.30 0.17 -1.32 0.317ns
Ash 12.61 10.89 1.35 0.78 -2.20 0.158ns
Fat 6.17 5.67 1.04 0.60 -0.83 0.492ns
CP 31.50 27.73 3.61 2.08 -1.81 0.212ns
CF 10.08 7.92 1.18 0.68 -3.17 0.087ns
ADF 12.87 11.41 1.25 0.72 -2.03 0.180ns
NDF 16.72 12.98 2.84 1.64 -2.28 0.150ns
Moisture = % Dry Matter; CP = % Crude Protein; CF = % Crude Fibre; ADF = % Acid
Detergent Fibre; NDF = % Neutral Detergent Fibre; Fat = % Fat; Ash = % Ash (100 –
Ash) = Organic Matter (g/100 g DW). Results are presented ‗as is‘. Note: ns = non-significant
at 0.05 alpha levels.
The comparison of M. ovalifolia leaves‘ mineral analysis within treatments is found in
Table 4.16. The results reveal that mineral values of Ca (1.77%), K (0.82%), P (0.37%),
Na (0.25%), and Zn (13.80 ppm) were higher in leaves from the experimental treatments
(treatments 2, 3 and 4) than the values in the leaves from the control treatment
(treatment1). However, Mg (0.27%), Fe (184.83 ppm), and Cu (15.11 ppm) were higher
in the control treatment, while Mn had the same value of 0.001 ppm in both

116
experimental and control treatments. Statistically, there were no significant differences
(P > 0.05) between the control and the other treatments levels.
Table 4.16: Mineral composition of M. ovalifolia leaves at different
treatment levels
Nutrient
Treatment Means Standard
Deviation
Standard Error
Mean
t
P-values Control Fertilized
Ca 1.54 1.77 0.17 0.10 2.29 0.149ns
P 0.36 0.37 0.09 0.05 1.74 0.225ns
K 0.74 0.82 0.08 0.05 -3.90 0.060ns
Mg 0.27 0.15 0.06 0.03 1.19 0.356ns
Na 0.14 0.25 0.16 0.09 0.16 0.889ns
Cu 15.11 12.43 3.19 1.84 -1.46 0.283ns
Fe 184.83 171.37 26.75 15.44 -0.87 0.475ns
Mn 0.001 0.001 0.00 0.00 1.96 0.189ns
Zn 12.65 13.80 1.01 0.59 2.29 0.149ns
Ca = % calcium; Na = % Sodium; K = %Potassium; Mg = %Magnesium; P = % Phosphorous;
Mn = Manganese (ppm); Cu = Copper (ppm); Fe = Iron (ppm); Zn = Zinc (ppm) (g/100 g DW).
Results are presented ‗as is‘. Note: ns = non-significant at 0.05 alpha level.
Table 4.17 compares the proximate and mineral composition of M. ovalifolia leaves
within treatments as the nitrogen and phosphorus fertilizers were applied. The same
experimental design was used as in the case of M. oleifera (see Table 4.6). Moringa
ovalifolia seedlings were transplanted in plots with four treatment levels: treatment1 (0
g), treatment2 (100 g), treatment3 (200 g) and treatment4 (300 g) of superphosphate
fertilizer with a P content of 83 g/kg (Wonder superphosphate granular, AGRO-SERVE
(Pty) Ltd., Bryanston, South Africa) and nitrogen fertilizer with an N content of 280
g/kg (Limestone Ammonium Nitrate – LAN, WONDER HORTICULTURAL
PRODUCTS (Pty) Ltd., Silverton, South Africa) for root and leaf development. The
proximate composition analysis of M. ovalifolia leaves shows that leaves from
treatment1 had the highest values in ash (12.61%), CP (31.50%), CF (10.08%), ADF
(12.87%) and NDF (16.72%). Leaves from treatment2 had the second highest content of

117
moisture (6.47%), ash (12.45%), CP (9.16%) and NDF (16.12%). These were followed
by leaves from treatment3: fat content (6.48%), CF content (7.78%) and ADF content
(12.85%), while leaves from treatment4 had the least nutrient values. The high
proximate values in leaves from treatment1 is an indication that M. ovalifolia, like its
counterpart M. oleifera, is a nutrient-rich plant source with low demand for fertilizers
and can serve as a suitable supplement for ruminants. In addition, CF showed declining
nutrient values as the fertilizer levels increased (treatment1 =10.08, treatment2 = 9.16,
treatment3 = 7.78 and treatment4 = 6.81). Since leaves from the control (treatment1) had
the highest content of nutrients besides fat and moisture, it is evident that M. ovalifolia
can be grown without phosphorus and nitrogen fertilizers and still maintain high nutrient
content for use as an animal supplement, as suggested by Fuglie (2001).
Moreover, the comparison of the mineral composition of M. ovalifolia leaves within
treatments shows a quite random distribution. The minerals considered in this analysis
were Ca, P, K, Mg, Na, Cu, Fe, Mn and Zn. Among these, only Fe, Cu and Zn were
found in large quantities while Ca was less than 2%; K, Mg, Na and P were less than 1%
and Mn was less than 0.001 ppm for all treatments (treatment1, treatment2, treatment3
and treatment4). Leaves from treatment3 had the highest mineral contents of Fe (201.83
ppm) and Cu (15.22 ppm), followed by treatment1 with Fe (184.83 ppm) and Cu (15.11
ppm). Leaves from treatment4 had the highest content only in Zn (14.66 ppm), while
those from treatment2 had the lowest content of these elements. Zinc had increasing
values as the fertilizer levels increased: treatment1 = 12.65%, treatment2 = 12.68%,
treatment3 =13.05% and treatment4 = 14.66%, respectively. This implies that Zn
composition could be dependent on the levels of fertilizers.

118
Table 4.17: Proximate and mineral composition of M. ovalifolia leaves at
different treatment levels
Nutrients
Treatment1
(0 g)
Treatment2
(100 g)
Treatment3
(200 g)
Treatment4
(300 g)
Moisture (% DM) 6.37 6.47 5.89 6.07
Ash 12.61 12.45 10.06 10.15
Fat 6.17 4.50 6.48 6.03
CP 31.50 24.00 31.20 28.00
CF 10.08 9.16 7.78 6.81
ADF 12.87 10.75 12.85 10.63
NDF 16.72 16.12 10.58 12.24
Macro-nutrients (% DM)
Ca 1.54 1.57 1.88 1.86
P 0.36 0.27 0.42 0.43
K 0.74 0.72 0.87 0.86
Mg 0.27 0.20 0.09 0.16
Na 0.14 0.17 0.15 0.44
Micro-nutrients (ppm)
Cu 15.11 8.95 15.22 13.11
Fe 184.83 151.71 201.83 160.57
Mn <0.001 <0.001 <0.001 <0.001
Zn 12.65 12.68 14.05 14.66
Moist = % Moisture (100 - Moisture) = % Dry Matter); CP = % Crude Protein; CF = %
Crude Fibre; ADF = % Acid Detergent Fibre; NDF = % Neutral Detergent Fibre; Fat = %
Fat; Ash = % Ash (100 – Ash) = Organic Matter). Ca = % calcium; Na = % Sodium; K =
%Potassium; Mg = %Magnesium; P = % Phosphorous; Mn = Manganese (ppm); Cu =
Copper (ppm); Fe = Iron (ppm); Zn = Zinc (ppm) (g/100 g DW). Results are presented ‗as
is‘.
4.5 Conclusion
Moringa plant species contain almost all the essential nutrients and minerals needed by
humans and livestock for growth and development. Substantial amounts of macro- and
micro-nutrients were found in both Moringa species, showing them to be fit to be used
as feed supplements. Their proximate analysis showed nutrients desirable for animal
feeds. Although there is a possible human-livestock conflict in the use of Moringa
species (especially M. oleifera), if adopted by livestock farmers, both Moringa species
have the potential to eliminate the need for purchasing of protein and mineral feed
supplements for their animals, since they contain almost all essential nutrients and
minerals. Hence, its availability on the farms for supplementation during periods of low-

119
nutrient grasses and browse species in rangelands (i.e., winter and drought) will improve
livestock production. Moringa leaves from different African regions and different
regions of Namibia have proved to contain closely similar nutritional values despite the
geographical or ecological conditions in which they were cultivated. Therefore,
cultivation of moringa trees as nutrient-rich plant species should be encouraged,
principally for their uses as food/feedstuff for both humans and livestock. Amino acid
tests and vitro digestibility trials are recommended for future studies with the leaf
biomass of the same moringa trees.
References
AgriLASA. (1993). Agri-Laboratory Association of Southern Africa (AgriLASA).
AgriLASA.
AOAC (Ed.). (1996). Official Methods of Analysis of AOAC International (16th ed.,
Vol. 1). Arlington, Virginia, USA: AOAC International.
Barnhart, S., & Hoyer, S. (2010, December). Interpreting your forage test report. Iowa
Beef Centre, Iowa State University. Retrieved from
http://www.iowabeefcenter.org/information/IBC51.pdf
Bey, H. (2010). All things moringa: the story of an amazing tree of life.
Http://www.allthingsmoringa.com/eBook.pdf, 1–40.
Bridgemohan, P., Bridgemohan, R., & Mohamed, M. (2014). Chemical composition of a
high protein animal supplement from Moringa oleifera. African Journal of Food
Science and Technology, 5(5), 125–128.
https://doi.org/http:/dx.doi.org/10.14303/ajfst.2014.041
Church, D. (1991). Livestock feeds and feeding. Prentice Hall, New Jersey.

120
Curtis, B., & Mannheimer, C. (2005). Tree Atlas of Namibia. Windhoek, Namibia: The
National Botanical Institute.
Fagwalawa, L., Yahaya, S., & Umar, D. (2014). A comparative proximate analysis of
bark, leaves and seeds of Moringa oleifera. International Journal of Basic and
Applied Chemical Sciences, 5(4), 56–62.
Fayomi, A., Ahmed, A., Musa, U., Salami-Shinaba, J., Ogedegbe, S., & Akanni, K.
(2014). moringa multi-nutrient blocks: formulation, production, and feeding trial
under a tropical environment. International Journal of Science, Environment and
Technology, 3(1), 67–84.
Foidl, N., Makkar, H., & Becker, K. (2001). The Miracle tree: The multiple uses of
moringa. Netherlands, 45–76.
Foidl, N., Makkar, H., & Becker, K. (2011). The potential of Moringa oleifera for
agricultural and industral uses. Retrieved from
http://www.empaeg.com/UserFiles/File19947.pdf
Fuglie, L. (2001). The miracle tree: the multiple attributes of moringa. Dakar, Senegal:
CTA.
Galyean, M. (2010, May). Laboratory procedures in animal nutrition research. Texas
Tech University, Lubbock. Retrieved from
https://www.depts.ttu.edu/afs/home/mgalyean/lab_man.pdf
Grusak, M. (2001). Plant Macro- and Micronutrient Minerals. Nature Publishing Group.
Retrieved from http://rubisco.ugr.es/fisiofar/pagwebinmalcb/contenidos/Tema11/
macro%20y%20micronutrient.pdf

121
Huque, K., & Sarker, N. (2014). Feeds and feeding of livestock in Bangladesh:
performance, constraints and options forward. Bangladesh Journal of Animal,
43(1), 1–10.
Joshua, R., & Vasu, V. (2013). Characteristics of stored rain water and its treatment
technology using moringa seeds. International Journal of Life Sciences
Biotechnology and Pharma Research, 2(1), 155–174.
Jurgens, M., Bregendahl, K., Coverdale, J., & Hansen, S. (2012). Animal feeding and
nutrition. United States of America: Kendall Hunt Publishing Company.
Kakengi, A., Shem, M., Sarwatt, S., & Fujihara, T. (2005). Can Moringa oleifera be
used as a protein supplement for ruminants? Asian-Aust. Journal of Animal
Science, 18(1), 42–47.
Madukwe, E., Ezeugwu, J., & Eme, P. (2013). Nutrient composition and sensory
evaluation of dry Moringa oleifera aqueous extract. International Journal of
Basic & Applied Sciences, 13(03), 100–102.
Makkar, H, & Becker, K. (2007). Nutrients and anti-quality factors in different
morphological parts of the Moringa oleifera tree. Cambridge University Press,
123, 311–322.
Makkar, HPS, & Becker, K. (1996). Nutritional value and antinutritional components of
whole and ethanol extracted Moringa oleifera leaves. Animal Feed Science and
Technology on Elsevier, 63, 211–228.
Mason, S. (n.d.). Understand your feed analysis report. Alberta Dairy Management.
Retrieved from http://www.agromedia.ca/ADM_Articles/content/feedanal.pdf
Mbailao, M., Mianpereum, T., & Albert, N. (2014). Proximal and Elemental
Composition of Moringa oleifera (Lam) Leaves from Three Regions of Chad.

122
Journal of Food Resource Science, 3, 12–20.
https://doi.org/10.3923/jfrs.2014.12.20
Mbikay, M. (2012). Therapeutic potential of Moringa oleifera leaves in chronic
hyperglycemia and dyslipidemia: a review. Frontiers in Pharmacology.
https://doi.org/10.3389/fphar.2012.00024
Melesse, A. (2011). Comparative assessment on chemical compositions and feeding
values of leaves of Moringa stenopetala and Moringa oleifera using in vitro gas
production method. Ethiopia Journal of Applied Science Technology, 2(2), 31–
41.
Mendieta, B., Reyes, N., & Rodriquez, R. (2007, June 25). Successful experiences of on
the use of Moringa oleifera in animal feeding. Retrieved from
http://redmarango.una.edu.ni/
documentos/20-Bryan-Moringa-pres-Vietnam-final-version.pdf
Moyo, B., Masika, P., Hugo, A., & Muchenje, V. (2010). Nutritional characterization of
moringa (Moringa oleifera Lam.) leaves. African Journal of Biotechnology,
10(60), 12925–12933.
Mpofu, I. (2004). Applied animal feed science and technology. (L. Mutewa & C.
Vengesai, Eds.). Upfront Publishing Ltd., Leicestershire.
Mutiara, T., Estiasih, H., & Sriwahyuni, E. (2013). Effect of Blanching Treatments
against Protein Content and Amino Acid Drumstick Leaves (Moringa oleifera).
Journal of Food Research, 2(1). https://doi.org/10.5539/jfr.v2n1p101
Ogbe, A., & Affifu, J. (2011). Proximate study, mineral and anti-nutrient composition of
Moringa oleifera leaves harvested from Lafia, Nigeria: Potential benefits in

123
poultry nutrition and health. Journal of Microbiology, Biotechnology and Food
Sciences, 1(3), 296–308.
Ojiako, E. (2014). Phytochemical analysis and antimicrobial screening of Moringa
oleifera leaves extract. The International Journal of Engineering and Science,
3(3), 32–35.
Ojukwu, A. (2012, January). Moringa as livestock feed. West Africa Insight.
Pallett, J. (1994). Understanding the Oshana environment. Windhoek, Namibia:
Gamsberg Macmillan Publishers Ltd.
Prince, M. (2007). ECHO Technical Note: The moringa tree, 1–19.
Radovich, T. (2007). Farm and forestry production and marketing profile for Moringa
oleifera. WSTERN AND PAR. https://doi.org/47001-03798
Romuald, M., Ysidor, K., Daouda, S., Adama, C., Pierre, E., Olivier, C., & Marius, B.
(2016). Nutritive compounds from leaves of Moringa oleifera L. and beans of
Vigna unguiculata W. for improvement of the meal deriving with new shoots of
Borassus aethiopum M. in Côte d‘Ivoire. International Journal of Environmental
& Agriculture Research, 2(6), 64–74.
Sanchez, N., Ledin, S., & Ledin, I. (2006). Biomass production and chemical
composition of Moringa oleifera under different management regimes in
Nicaragua. Springer, 66, 231–242. https://doi.org/10.1007/s10457-005-8847-y
Sánchez-Machado, D., Núñez-Gastélum, J., Reyes-Moreno, C., Ramírez-Wong, B., &
López-Cervantes, J. (2009). Nutritional Quality of Edible Parts of Moringa
oleifera. Food Anal. Methods, 3, 175–180. https://doi.org/10.1007/s12161-009-
9106-z
124
Soliva, C., Kreuzer, M., Foidl, G., Machmuller, A., & Hess, H. (2005). Feeding value of
whole and extracted Moringa oleifera leaves for ruminants and their effects on
ruminal fermentation in vitro. Animal Feed Science and Technology, 118, 47–62.
https://doi.org/10.1016/j.anifeedsci.2004.10.005
Tisch, D. (2006). Animal feeds, feeding and nutrition, and ration evaluation. United
States: Thomson Delmar Learning. Retrieved from
http://www.delmarlearning.com
Van Wyk, B., Van Wyk, P., & Van Wyk, B. (2011). Photo guide to trees of southern
Africa (Vol. 1). Pretoria, South Africa: Briza Publications.

125
Chapter 5
Assessment of the Anthelmintic Effect of Moringa Oleifera Leaf-supplemented Diet
on Gastrointestinal Parasites in Boer Goats
5.1 Abstract
The objective of this study was to compare the efficacy of Moringa oleifera (M.
oleifera) leaf supplements with the drug ecomectin® on the reduction of the
gastrointestinal parasites (GIP) load of Boer goats for 74 days at Neudamm
Experimental Farm. A completely randomized design (CRD) was used for this
experiment, in which 16 lactating does were randomly selected from 51 lactating does.
The experiment used four M. oleifera leaf-supplemented treatment levels (0%, 10%,
20% and 30%) and randomly assigned four goats to each treatment level. The quasi-
control group (0%) was given ecomectin to compare the efficacy with that of M. oleifera
as an ethno-medicinal treatment. The results revealed that M. oleifera leaf supplements
had anthelmintic effects against trichostrongyle worms, coccidia, Monezia, Trichuris
and Strongyloides species. Statistical analysis showed significant differences (P > 0.001)
at 10%, 20% and 30% inclusion levels for trichostrongyle-type eggs, coccidia oocysts,
Trichuris species, Moniezia species and Strongyloides papillosus in the goats‘ faeces.
Therefore, the hypothesis (H04) that M. oleifera does not have anthelmintic properties
was rejected because M. oleifera has anthelmintic properties and reduced GIPs in goats.
However, a further research is needed to investigate if GIPs in goats will develop
resistance against M. oleifera leaves as an ethno-anthelmintic supplement.
Keywords: Boer goats, ecomectin drug, ethno-anthelmintic drug, helminthes, lucerne,
Moringa oleifera

126
5.2 Introduction
Goats are found in almost all parts of the world, reared by both rural subsistence and
commercial farmers as a sustainable source of household income and protein-food
supply [Boer Goat Breeder‘s Society of Namibia (BGBSN, 2008)]. About 913,999
thousand heads of goats and kids are found worldwide and about 263,474 thousand
heads of goats and kids are found in Africa (FAO, 2013). Livestock production is the
second largest agricultural activity in Namibia next to crop production in which 39% of
agricultural households are engaged with the total of 872,228 cattle, 1618,204 goats and
163,905 sheep [Namibia Statistics Agency (NSA, 2015)]. Goats are very sensitive to the
effects of internal parasitism which can cause decreased fertility, abortion, unthriftiness,
increased susceptibility to disease and death (Jansen & Burg, 2004; Stehman & Smith,
2004). Some commonly found helminths in ruminants include, but are not limited to
nematodes (roundworms), trematodes (flukes) and protozoa (unicellular organisms)
(Hendrix & Sirois, 2007). It has been confirmed that coccidiosis is a common and
damaging illness of sheep, goats, and cattle, particularly of young lambs, kids, and
calves (Coffey, 2014). Trichostrongylosis (trichostrongyliasis), a disease caused by
Trichostrongylus species has also been cited in much of the literature (Machen et al.,
1993; Sleeman et al., 2000; Kumba et al., 2003). These parasites have developed
resistance to many dewormers due to overuse and improper use of the available
anthelmintics, and they have become difficult to control (Roeber et al., 2013). In this
light, livestock producers are no longer relying on drugs alone to control internal
parasites. Instead, they tend to employ an integrated approach that relies on sustainable
methods (Hale, 2006) such as stringent hygiene of stables, rotational grazing and ethno-
veterinary medicines.

127
Moringa oleifera is considered to be effective in the treatment of many diseases
(Caceres et al., 1991). The roots, leaves and pods are said to have medicinal properties
and contain antimicrobial and antioxidant substances that are important for both humans
and animals (Alhakman et al., 2013; Hassan & Ibrahim, 2013). The curative effect of M.
oleifera may explain its extensive use for nutritional and health benefits (Prince, 2007;
Moyo et al., 2012). The medicinal characteristics of M. oleifera make it a potential
source for improving small ruminants and other livestock production in Namibia and the
world at large. The problems faced by many small ruminant farmers in this regard are
the availability of anthelmintics, as well as parasites‘ developed resistance to commonly
used conventional drugs, due to repeated use (Hepworth et al., 2006). The in vitro
studies of an anthelminthic activity of M. oleifera leaf extracts at five different
concentrations (0.625, 1.25, 2.50, 3.75 and 5 mg/ml) against Haemonchus contortus and
gastrointestinal trichostrongyle-type eggs in goats showed that at 0.625, ethanolic extract
inhibited 51.7% egg embryonation, reaching 92.80%, at 5 mg/ml; infused and macerated
aqueous extracts also inhibited embryonation with mean efficacy of 69% and 94.50% at
5 mg/ml; macerated aqueous extract and ethanol extract inhibited more than 60% egg
hatch at 2.50 mg/ml, reaching 90.20% and 99% at 5 mg/ml; the infused aqueous extract
inhibited 69.2% and 97.9% egg hatch at 3.75 and 5 mg/ml, respectively. For larvicidal
activity, infused aqueous extract showed weak activity on L1 larvae, inducing only
50.50% mortality at 5 mg/ml. However, macerated aqueous extract induced 89.60% at 5
mg/ml while at the same concentration ethanolic extract registered 98.8% L1 larva
mortality (Abreu et al., 2014; Tayo et al., 2014).

128
Goats suffer from gastrointestinal parasites (GIPs) which can be treated using different
approaches. Moringa oleifera is one of the ethno-veterinary medicinal plants which can
be used for the treatment of GIPs in animals. The purpose of this study was therefore to
determine the anthelmintic effect of M. oleifera on GIPs of Boer goats in Namibia. In
Namibia, little is known in terms of documented studies about the controlled use of
herbs in the fight against goats‘ internal parasites as well as their nutritional values.
Therefore, this study was aimed at assessing the use of M. oleifera leaf supplement as an
ethno-anthelmintic drug as demonstrated by Abreu et al. (2014) and Tayo et al. (2014)
in comparison to ecomectin (ivermectin 0.08% m/v), the medicine that is conventionally
used for goats as a dewormer.
5.3. Materials and Methods
5.3.1 Study Area
This study was conducted from October 2015 to January 2016 at the Neudamm Campus
of the University of Namibia, about 30 km east of Windhoek, with an area of 10, 187
hectares. Neudamm Campus is located at 22° 30′ 07″ S and 17° 22′ 14″ E, and at an
altitude of 1762 meters above sea level. The farm‘s temperature ranges between a
minimum of -7°C in winter and a maximum of 44°C in summer (University of Namibia,
2011), and received an annual average rainfall of 247.8 mm in 2015/2016 summer
season (P. Beukes, 2017).
The vegetation of Neudamm Farm is classified as highland savannah (semi-arid
savannah) and characterized by grasses, shrubs and trees that are well spread over the

129
farm. An annual grass like Melinis repens and perennial grasses like Schmidtia
pappophoporoides, Anthephora pubescens and Brachiaria nigropedata are well
represented on the farm. Different types of trees like Acacia brownii, Acacia erioloba,
Acacia mellifera, as well as shrubs like Grevia flava, are found on Neudamm
Experimental Farm. The estimated carrying capacity is about 12 hectares per large stock
unit or 45 kg per hectare biomass (Kahumba, 2010; Kapu, 2012; A. Beukes, 2017).
5.3.2 Research Design
A completely randomized design (CRD) consisting of a one-way treatment structure was
used to test statistical differences at different levels of inclusion of M. oleifera leaf
supplement. The M. oleifera leaves were harvested from an organic M. oleifera farm in
Rundu, Namibia (about 714 km from Windhoek), at 30-day intervals and shade-dried
over plastic sheets within two weeks. Four treatment levels of M. oleifera inclusion were
used, with four replicates in each (0%, 10%, 20%, and 30%) in isocaloric and
isonitrogenous diets. The four treatment levels were decided to develop levels at which
M. oleifera leaves would sustainably serve as ethno-anthelminthic doses as well as
nutritional supplemental levels in goats suggested by Gebregiorgis, Negesse and Nurfeta
(2011). Sixteen (16) lactating Boer goats with the age range of 12–50 (29.38 ± 11.15)
months old and body weight range of 27.6 - 50.5 (37.06 ± 6.62) kg were used in this
study to assess the effect of M. oleifera leaf supplement on intestinal parasites, in
comparison to the ecomectin drug. Taking into consideration an average weight of 37 kg
per goat, the percentages of inclusion translated into 0% (0 g), 10% (150 g), 20% (300 g)
and 30% (450 g) of M. oleifera dry leaves per day. The four goats in the quasi-control
group (0%) were treated with ecomectin® [ECO Animal Health Southern Africa (Pty)

130
Ltd., Faerie Glen, South Africa] with a composition of ivermectin 0.08% m/v as a
conventional dewormer, for comparison of the efficacy of M. oleifera as an ethno-
medicinal treatment. Dry lucerne (Medicago sativa) was used as a basal diet for all goats
supplemented with 300 g Ram-Lamb-Ewe pellets, and mineral licks were fed ad libitum
throughout the research period. For the lactating goats, the total daily feed (M. oleifera,
lucerne and pellets) given to each was 4% of its average body weight, considering the
wastes during feeding as recommended by Coffey (2006). At the Neudamm
Experimental Farm, lucerne is being used as a sole feed to lactating goats during winter
or drought and is supplemented with Ram-Lamb-Ewe Pellets® [Feedmaster (Pty) Ltd.,
Windhoek, Namibia]. The nutritional compositions of the feed and mineral lick block
fed to study goats are shown in Table 5.1.
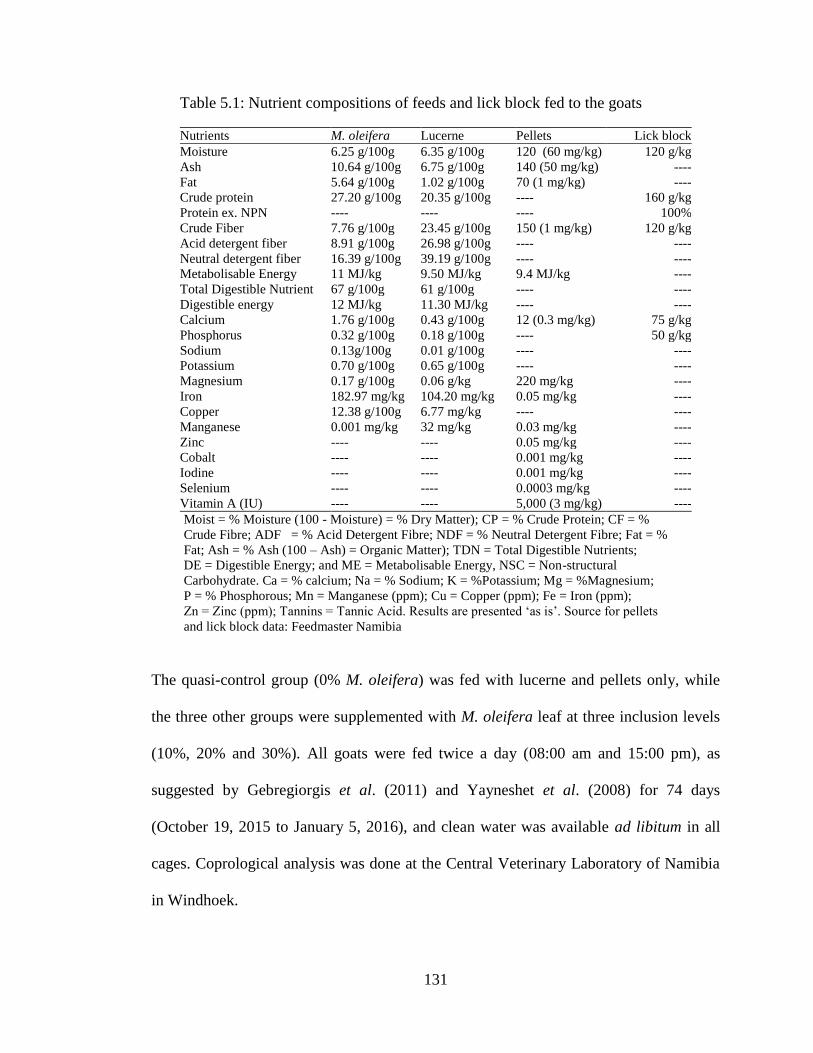
131
Table 5.1: Nutrient compositions of feeds and lick block fed to the goats
Nutrients M. oleifera Lucerne Pellets Lick block
Moisture 6.25 g/100g 6.35 g/100g 120 (60 mg/kg) 120 g/kg
Ash 10.64 g/100g 6.75 g/100g 140 (50 mg/kg) ----
Fat 5.64 g/100g 1.02 g/100g 70 (1 mg/kg) ----
Crude protein 27.20 g/100g 20.35 g/100g ---- 160 g/kg
Protein ex. NPN ---- ---- ---- 100%
Crude Fiber 7.76 g/100g 23.45 g/100g 150 (1 mg/kg) 120 g/kg
Acid detergent fiber 8.91 g/100g 26.98 g/100g ---- ----
Neutral detergent fiber 16.39 g/100g 39.19 g/100g ---- ----
Metabolisable Energy 11 MJ/kg 9.50 MJ/kg 9.4 MJ/kg ----
Total Digestible Nutrient 67 g/100g 61 g/100g ---- ----
Digestible energy 12 MJ/kg 11.30 MJ/kg ---- ----
Calcium 1.76 g/100g 0.43 g/100g 12 (0.3 mg/kg) 75 g/kg
Phosphorus 0.32 g/100g 0.18 g/100g ---- 50 g/kg
Sodium 0.13g/100g 0.01 g/100g ---- ----
Potassium 0.70 g/100g 0.65 g/100g ---- ----
Magnesium 0.17 g/100g 0.06 g/kg 220 mg/kg ----
Iron 182.97 mg/kg 104.20 mg/kg 0.05 mg/kg ----
Copper 12.38 g/100g 6.77 mg/kg ---- ----
Manganese 0.001 mg/kg 32 mg/kg 0.03 mg/kg ----
Zinc ---- ---- 0.05 mg/kg ----
Cobalt ---- ---- 0.001 mg/kg ----
Iodine ---- ---- 0.001 mg/kg ----
Selenium ---- ---- 0.0003 mg/kg ----
Vitamin A (IU) ---- ---- 5,000 (3 mg/kg) ----
Moist = % Moisture (100 - Moisture) = % Dry Matter); CP = % Crude Protein; CF = %
Crude Fibre; ADF = % Acid Detergent Fibre; NDF = % Neutral Detergent Fibre; Fat = %
Fat; Ash = % Ash (100 – Ash) = Organic Matter); TDN = Total Digestible Nutrients;
DE = Digestible Energy; and ME = Metabolisable Energy, NSC = Non-structural
Carbohydrate. Ca = % calcium; Na = % Sodium; K = %Potassium; Mg = %Magnesium;
P = % Phosphorous; Mn = Manganese (ppm); Cu = Copper (ppm); Fe = Iron (ppm);
Zn = Zinc (ppm); Tannins = Tannic Acid. Results are presented ‗as is‘. Source for pellets
and lick block data: Feedmaster Namibia
The quasi-control group (0% M. oleifera) was fed with lucerne and pellets only, while
the three other groups were supplemented with M. oleifera leaf at three inclusion levels
(10%, 20% and 30%). All goats were fed twice a day (08:00 am and 15:00 pm), as
suggested by Gebregiorgis et al. (2011) and Yayneshet et al. (2008) for 74 days
(October 19, 2015 to January 5, 2016), and clean water was available ad libitum in all
cages. Coprological analysis was done at the Central Veterinary Laboratory of Namibia
in Windhoek.

132
5.3.3 Data Collection Procedures
At the commencement of this study, all the does and their kids were treated with
COOPERS SUPADIP®
(Cooper Ltd., Isando, South Africa) at a dilution ratio of 50 mL :
10 L of water against ectoparasites. The COOPERS SUPADIP® contains
chlorfenvinphos 30% m/v. The 16 lactating does were clinically examined, and
temperature, pulse and respiratory rates were taken fortnightly throughout the research
period before faecal sample collection, as described by Rumosa-Gwaze et al. (2012).
Initial faecal samples were collected from the rectum of each goat before the
introduction of the M. oleifera leaf-supplemented diets. All four goats in the control
group (0% M. oleifera) were injected with ecomectin® (10 mL per doe and 2 mL per
kid), based on their body weights, while the 12 goats in the other three groups (10%,
20% and 30%) were given a M. oleifera leaf-supplemented diet for the purpose of
comparison.
A 14-day adaptation/adjustment period was observed, after which fortnightly faecal
samples were collected in containers from the rectum by 7:00 am, which were then
placed in a cooler box and taken within an hour to the Central Veterinary Laboratory of
Namibia in Windhoek for analysis. In the laboratory, combined sedimentation and
flotation techniques were used (Pancholy, Carter, Thomas, & Donald, 2007; Reinemeyer
& Nielsen, 2013) to determine faecal egg count.
Ninety-six (96) faecal samples were collected from the 16 Boer goats at two-week
intervals over the 74 days for the assessment of GIP infestation. For faecal analysis,
three grams (3 g) of faeces was measured on an electronic balance, put in a mortar,

133
mashed and mixed thoroughly with a pestle. One hundred mL of water was added to the
mashed faeces and filtered through strainer into a cylindrical container. A period of 30
minutes was allowed for the sediments to settle at the bottom of the container.
Afterwards, the water was poured out leaving the sediment at the bottom of the
containers. The containers were then shaken and the sediments were poured into labelled
test tubes. The test tubes were then filled to the brim with sugar solution and covered
with cover slides. Finally, the eggs were allowed to float over the sugar solution for
another 30 minutes and then stuck onto the cover slides. Then, the cover slides were
taken and placed on new microscope slides for examination under a light microscope at
a magnification of x40.
5.3.4 Data Analysis
Regression and Chi-Square analyses were used to analyse the collected data for
statistical differences. The quadratic and linear regression functions were used to
determine the inclusion level at which M. oleifera leaf supplementation was efficient in
treating helminths in the goats under study. The Chi-Square test was used to determine
the mean difference of M. oleifera leaf supplementation and time effect on GIPs. In the
analysis, parasite eggs or oocysts were used as dependent variables while M. oleifera
leaf inclusion levels were used as independent variables. Statistical Package for Social
Sciences (SPSS® version 23), as well as Microsoft Excel
® (version 13) were used for all
analyses at the alpha levels of p ≤ 0.05 and all p-values above these alpha levels were
considered non-significant.

134
5.4. Results and Discussion
The results of the faecal samples analysis conducted during the entire research period of
74 days detected trichostrongyle-type eggs, coccidia oocysts, Trichuris species,
Moniezia species and Strongyloides papillosus present in the gastro-intestinal tracts of
goats on the Neudamm Experimental Farm. However, the two most common types of
GIPs found in all 16 goats were trichostrongyle-type eggs and coccidia oocysts,
meaning that they had the highest infestation rates, as observed by Pancholy et al.
(2007). On the other hand, Trichuris species, Moniezia species and Strongyloides
papillosus were found in only a few goats. As suggested by Turner and Getz (2010),
this study observed parasites‘ eggs and oocysts in their taxonomic groupings in order to
avoid identification errors; therefore, trichostrongyle-type eggs, coccidia oocysts,
Trichuris species, Moniezia species were not identified further to species levels.
5.4.1 Adjustment Period and Parasite Prevalence
During the 14 day adaptation/adjustment period, it was observed that 15 out of the 16
goats showed a liking for M. oleifera leaves within less than a week, and consumed
their entire ration. Only one goat resisted immediate adjustment to M. oleifera leaves,
but gradually began to eat them. This quick adaptation of goats to the M. oleifera leaf-
supplemented diet serves as an advantage for using it as an alternative to hay,
nutritional supplement, or anthelmintic drug for goats and other livestock, as reported in
several literary studies (Sanchez, Sporndly, & Ledin, 2005; Bey, 2010; Jain et al., 2013;
Akinbamijo, Adediran, Nouala, & Saecker, n.d.).
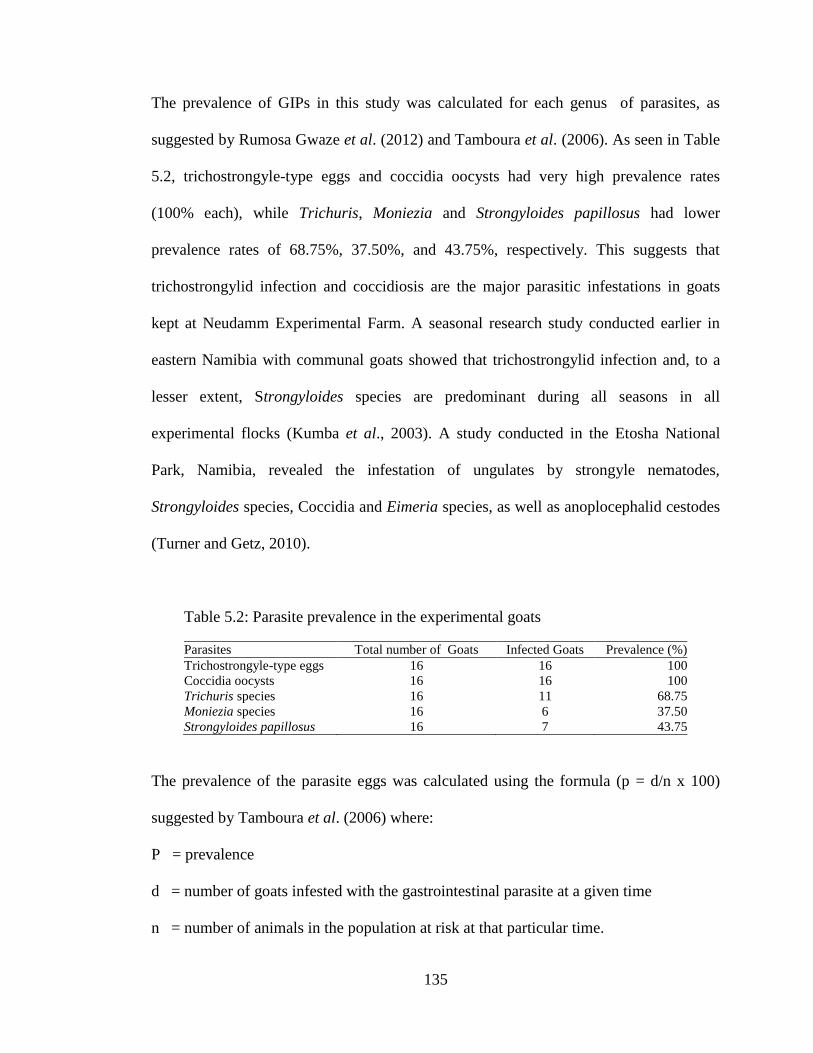
135
The prevalence of GIPs in this study was calculated for each genus of parasites, as
suggested by Rumosa Gwaze et al. (2012) and Tamboura et al. (2006). As seen in Table
5.2, trichostrongyle-type eggs and coccidia oocysts had very high prevalence rates
(100% each), while Trichuris, Moniezia and Strongyloides papillosus had lower
prevalence rates of 68.75%, 37.50%, and 43.75%, respectively. This suggests that
trichostrongylid infection and coccidiosis are the major parasitic infestations in goats
kept at Neudamm Experimental Farm. A seasonal research study conducted earlier in
eastern Namibia with communal goats showed that trichostrongylid infection and, to a
lesser extent, Strongyloides species are predominant during all seasons in all
experimental flocks (Kumba et al., 2003). A study conducted in the Etosha National
Park, Namibia, revealed the infestation of ungulates by strongyle nematodes,
Strongyloides species, Coccidia and Eimeria species, as well as anoplocephalid cestodes
(Turner and Getz, 2010).
Table 5.2: Parasite prevalence in the experimental goats
Parasites Total number of Goats Infected Goats Prevalence (%)
Trichostrongyle-type eggs 16 16 100
Coccidia oocysts 16 16 100
Trichuris species 16 11 68.75
Moniezia species 16 6 37.50
Strongyloides papillosus 16 7 43.75
The prevalence of the parasite eggs was calculated using the formula (p = d/n x 100)
suggested by Tamboura et al. (2006) where:
P = prevalence
d = number of goats infested with the gastrointestinal parasite at a given time
n = number of animals in the population at risk at that particular time.

136
5.4.2 Infestation by Trichostrongylid Helminths
The notations used at the Central Veterinary Laboratory of Namibia in Windhoek where
the samples were analysed have the following interpretations: 0 (no parasite eggs
detected), 1+ (very low infestation), 2+ (low to moderate infestation), 3+ (moderate to
high infestation) and 4+ (very high to heavy infestation). Trichostrongyle-type eggs
were the second largest infestation, after coccidia oocysts, in all 16 goats, and ranged
from very low to very high infestation rates. From 96 faecal samples collected, 34
samples had zero (35.40%), 22 samples (22.90%) had 1+, 16 (16.70%) had 2+, 18
(18.80%) had 3+ and 6 samples (6.30%) had 4+ infestation rates, respectively. This
indicates that the overall infestation levels were around 1+, 3+ and 2+, representing
22.90%, 18.80% and 16.70%, which means that the entire herd was moderately infested
with trichostrongylid species eggs (Figure 5.1). Hendrix and Sirois (2007) discussed that
bovine trichostrongylids, which are in the group of roundworms, are composed of
several genera of nematodes that infest the abomasum and the small and large intestine
of cattle and other ruminants.
The genera that produce trichostrongyle-type eggs are Bunostomum, Cooperia,
Chabertia, Haemonchus, Oesophagostomum, Ostertagia, and Trichostrongylus. These
seven genera (and others) produce oval, thin-shelled eggs that contain four or more cells
and are 70 to 120 µm long. Some of these ova may be identified to their respective
genera; however, identification is usually difficult because mixed infections of bovine
trichostrongylids are quite common. Many literatures concurred that nematodes produce
trichostrongyle-type eggs that are similar, and difficult to distinguish and egg shapes
range from 64-100 µm x 27-55 µm ( Sleeman et al., 2000; Indre et al., 2010).

137
Figure 5.1: Infestation level of trichostrongyle-type eggs in study goats
Table 5.3 presents mean of the trichostrongyle-type eggs load before and during
treatment with M. oleifera and ecomectin. Day one (before treatment) faecal analytical
result for the means showed high infestation rates of trichostrongyle-type eggs among
all 16 goats (2.75+, 2.75+, 2.75+ and 3+). This is an indication that all 16 goats were
highly infested with trichostrongyle-type eggs (also see Table 5.2) at the
commencement of this research. The infestation gradually dropped after ecomectin was
given to quasi-control group and M. oleifera leaf was supplemented to the three
experimental groups. The results also showed that M. oleifera had a higher efficacy rate
at 10% and 20% than ecomectin, as seen in the faecal analysis results on days 16, 30, 59
and 73, respectively. Thus, there was an equal reduction in the infestation rates for both
ecomectin- and M. oleifera-treated goats, which signifies that M. oleifera leaves have
anthelmintic properties. However, as time went by, there was a slight rise in the
infestation rates as seen in faecal analysis results on days 59 and 73.
34
22
16 18
6
35.40%
22.90%
16.70% 18.80%
6.30%
0
5
10
15
20
25
30
35
40
0 1+ 2+ 3+ 4+
Fre
quen
cy &
per
centa
ge
of
infe
stat
ion
Infestation levels
Frequency
percentage

138
Table 5.3: Before and during treatment means of trichostrongyle-type egg load
Faecal collection days
0% M. oleifera
(ecomectin)
10% M.
oleifera
20% M.
oleifera 30% M. oleifera
1 (before treatment) 2.75 3.00 2.75 2.75
16 1.50 0.50 0.00 0.25
30 1.00 0.75 1.25 1.25
44 0.00 0.00 0.00 0.00
59 1.75 2.00 1.50 2.00
73 2.25 1.75 1.50 2.25
The Chi-Square analysis using the Pearson Chi-Square and Likelihood Ratio test was
carried out using M. oleifera inclusion levels over time in weeks (Table 5.4). The results
showed that M. oleifera leaf supplement had a mean significant difference (P < 0.05) at
all three levels of inclusion (10%, 20% and 30%). The Chi-Square test is a function of
trichostrongyle-type eggs, M. oleifera leaf inclusion levels and time (weeks), which
showed that as time passed, there was a mass reduction of trichostrongyle-type eggs in
comparison with the quasi-control group that was dewormed with ecomectin, a
conventional anthelmintic drug.

139
Table 5.4: Chi-Square tests of M. oleifera levels on trichostrongyle-type eggs
over time (weeks)
Inclusion level (%)
Chi-Square
Value df
Asymptotic Significance
(2-sided)
0
(Ecomectin)
Pearson Chi-Square 26.83b 20 0.140ns
Likelihood Ratio 29.29 20 0.082ns
N of Valid Cases 24
10
Pearson Chi-Square 45.33c 20 0.001***
Likelihood Ratio 45.41 20 0.001***
N of Valid Cases 24
20
Pearson Chi-Square 36.00b 20 0.015*
Likelihood Ratio 41.04 20 0.004***
N of Valid Cases 24
30
Pearson Chi-Square 36.64b 20 0.013*
Likelihood Ratio 38.31 20 0.008**
N of Valid Cases 24
Total N of Valid Cases 96
a. 24 cells (80.0%) have expected count less than 5. The minimum expected count is 1.00.
b. 30 cells (100.0%) have expected count less than 5. The minimum expected count is .17.
c. 30 cells (100.0%) have expected count less than 5. The minimum expected count is .33.
Note: ns = non-significant at 0.05; * = significant at 0.05; ** = highly significant at 0.01;
*** = extremely significant to ≤ 0.001 alpha level
The histogram (Figure 5.2) shows the frequency distribution of trichostrongyle-type
eggs in the studied goats. It presents a positively skewed distribution of parasites in the
research goats. That is, although the concentration of parasites is around 0 to ±1, some
parasites were dispersedly found around +3 in a positive row of the histogram
indicating an uneven distribution of parasites.

140
Figure 5.2: Distribution of trichostrongyle-type eggs in study goats
5.4.3 Infestation by Coccidia Species
Coccidia oocysts were the largest occurring parasite eggs found from the 96 faecal
samples collected in the 74-day study period. The result shows that out of the 96 faecal
samples collected, 27(28.10%) had zero coccidia oocysts, 30(31.30%) had 1+,
18(18.80%) had 2+, 12(12.50%) had 3+, and 9(9.40%) had 4+ infestation levels,
respectively. Coccidia, just as trichostrongyles-type eggs, constitute major problems on
this farm and need to be controlled continuously. Levels one plus (1+) and two plus (2+)
were the largest infestation rates of coccidia oocysts, although on the overall, infestation
ranged from very low to very heavy infestation rates (Figure 5.3). The very high and
heavy infestation rates were observed at the initial stages of this research. Coccidiosis is
a disease of intensification due to the build-up of sporulated oocysts in accumulated
faeces, facilitating ingestion of large infective doses. A further factor is
immunosuppression of the host, due to stress (Junker et al., 2015). Despite the high GIPs
intensity, goats were in good body conditions, as M. oleifera leaf supplement built up

141
their immune systems. The fact that coccidia and trichostrongylid worms were the most
common GIPs in this study on goats is supported by the findings of Regassa et al.
(2006), who stated that the most frequent combination of parasites in goats, sheep and
cattle were trichostrongyle-type eggs and Eimeria species. Although there are two
genera of the subclass coccidia (Eimeria and Cryptosporidium), Cryptosporidium
species infest cattle, sheep and goats while Eimeria species affect mainly cattle (Hendrix
and Sirois, 2007).
Figure 5.3: Infestation levels of coccidia oocysts in study goats
Table 5.5 presents the means of coccidia oocyst load before and during treatments with
M. oleifera. The control group (0% M. oleifera) was not considered because ecomectin
drug does not treat coccidia oocysts. The three groups (10%, 20% and 30%) given M.
oleifera-leaf supplement as a natural anti-coccidia treatment were observed for the
reduction of coccidia load. The treatment with M. oleifera and ecomectin was done as
described earlier as seen in Table 5.3. On day one (before treatment), the mean faecal
27
30
18
12
9
28.10%
31.30%
18.80%
12.50%
9.40%
0
5
10
15
20
25
30
35
0 1+ 2+ 3+ 4+
Fre
quen
cy &
per
centa
ge
of
infe
stat
ion
Infestation levels
Frequency
Percentage

142
sample analysis result showed a high to heavy infestation rates of coccidia oocysts
among all the 16 goats (3+, 3.25+ and 3+); which is an indication that coccidia oocysts
had the highest infestation rate among all the parasites found. With time, the infestation
rate dropped considerably after M. oleifera leaf was given as a supplement, as the results
have shown over time. Although there was reduction at all M. oleifera inclusion levels,
30% M. oleifera treatment level had greater efficacy in coccidia oocyst load-reduction
rate than 10% and 20% in the research goats. This clearly revealed that M. oleifera leaf
as a medicinal plant has higher efficacy against coccidia oocysts and could be very
useful as a treatment against coccidiosis in goats.
Table 5.5: Before and during treatment means of coccidia oocyst load
Faecal collection days 10% M. oleifera 20% M. oleifera 30% M. oleifera
1 (before treatment) 3.00 3.25 3.00
16 1.25 0.75 0.75
30 1.00 1.75 2.25
44 0.75 1.50 1.75
59 2.00 0.75 0.75
73 1.00 1.00 0.75
Chi-Square test analysis of coccidia oocyst infestation rates in interaction with M.
oleifera leaf inclusion levels over time in weeks indicated that M. oleifera had
significant differences (P < 0.05) in reducing coccidia oocysts at all levels over time
(Table 5.6). The Chi-Square test is a function of coccidia oocysts, M. oleifera leaf
inclusion levels and time in weeks. This means that using M. oleifera leaf meal inclusion
as an anti-coccidia supplement was able to reduce the load of coccidia oocysts at all
three inclusion levels (10%, 20% and 30%). It is important to note that ecomectin drugs
do not retreat coccidia oocysts; therefore, comparison was only done among the three

143
moringa treatment levels. There was a great reduction in parasite loads as weeks
progressed throughout the duration of the study.
Table 5.6: Chi-Square Tests of M. oleifera levels on coccidia oocysts over
time (weeks)
Level of inclusion (%) Value df
Asymptotic Significance
(2-sided)
10
Pearson Chi-
Square 39.00c 25 0.037*
Likelihood Ratio 39.86 25 0.030*
20
Pearson Chi-
Square 34.76b 20 0.021*
Likelihood Ratio 36.44 20 0.014*
30
Pearson Chi-
Square 32.49b 20 0.038*
Likelihood Ratio 36.44 20 0.014*
Total N of Valid Cases 96
a. 30 cells (83.3%) have expected count less than 5. The minimum expected count is .17.
b. 30 cells (100.0%) have expected count less than 5. The minimum expected count is .33.
c. 36 cells (100.0%) have expected count less than 5. The minimum expected count is .17.
Note: * = significant at 0.05; *** = extremely significant to ≤ 0.05 alpha level; n = 24
Table 5.7 presents a linear regression of coccidia oocysts as dependent variable and M.
oleifera leaf supplement inclusions as independent variables. Moringa oleifera had no
significant mean difference (P < 0.05) at all inclusion levels. Although M. oleifera leaf-
inclusion levels were non-significant statistically on coccidia oocysts, 150 g (10%) and
300 g (20%) inclusion levels had equal efficacy with p-values of 0.052 and 0.052,
respectively, but had a decline at 450 g (30%) with a p-value of 0.069. This is an
indication that M. oleifera leaf supplement inclusion levels at 150 g and 300 g may serve
as a natural anthelmintic substance for Boer goats holding all other parameters constant.
However, a marginal change by one per cent increase led to decline in parasite load
reduction.

144
Table 5.7: Regression analysis of M. oleifera on coccidia oocysts
M. oleifera inclusion level, g (%)
Standardized Coefficients
t
P-value Beta
150 g (10) -0.22 -1.97 0.052ns
300 g (20) -0.22 -1.97 0.052ns
450 g (30) -0.20 -1.84 0.069ns
R square = 0.067; F – statistic = 2.196 and n = 96; ns = significant at 0.05; ***= extremely
significant to ≤ 0.001 alpha level
Figure 5.4 is a histogram that shows the frequency distribution of coccidia oocysts in the
16 goats. Coccidia oocysts being the largest infestation on this farm, the histogram
shows a normal distribution of coccidia oocysts infestation among the study animals.
This means that they evenly occurred in almost all the goats tested. Therefore, the
hypothesis (H04) that states that M. oleifera had no significant effect on the reduction of
trichostrongyle-type eggs and coccidia oocysts parasite loads over time is rejected based
on the results presented in Tables 5.4 and 5.6.
Figure 5.4: Distribution of coccidia oocysts in study goats

145
5.4.4 Infestation by Trichuris Species
Figure 4.5 indicates the frequencies and percentages of each infestation level of
Trichuris species for the entire research period. Out of 96 faecal samples collected, 80
(83.30%) faecal samples had zero infestation rate, 5 (5.20%) had 1+, 2+ and 3+ with the
exception of 1(1%) that had 4+ infestation levels. Therefore, Trichuris species
infestation rates range from very low to very high but in a very small number of goats at
Neudamm Experimental Farm compared to trichostrongylid species and coccidia
oocysts.
Figure 5.5: Infestation of study goats by Trichuris species
Table 5.8 presents the means of Trichuris species load before and during treatments with
M. oleifera and ecomectin. As mentioned in Tables 5.2 and 5.3 for other species of
GIPs, Trichuris species had very low infestation among a few goats (0.00+, 0.75+,
0.75+, and 1.75+). This means that Trichuris species was not a major parasite problem
of goats on the Neudamm Experimental Farm during this study period. Although they
80
5 5 5 1
83.3%
5.20% 5.20% 5.2% 1%
0
10
20
30
40
50
60
70
80
90
0 1+ 2+ 3+ 4+
Fre
quen
cy &
per
centa
ge
of
infe
stat
ion
Infestation levels
Frequency
Percentage

146
were not among the major helminthic problems on the farm, the 5% infestation rate was
completely minimized after ecomectin was given to the control group and M. oleifera
leaf was supplemented to the three experimental groups. On scale, M. oleifera leaf
supplement and ecomectin treatments had equal efficacies on Trichuris species load
reduction rate in the studied goats. This is an indication that M. oleifera leaf would serve
as an ethno-medicinal treatment against Trichuris species as well as ecomectin, the
conventional treatment.
Table 5.8: Before and during treatment means of Trichuris species load
Faecal collection days
0% M. oleifera
(ecomectin)
10% M.
oleifera
20% M.
oleifera
30% M.
oleifera
1(before treatment) 1.75 0.75 0.00 0.75
16 0.00 0.25 0.25 0.75
30 1.50 1.25 0.00 1.00
44 0.50 0.00 0.50 0.00
59 0.00 0.00 0.00 0.00
73 0.00 0.00 0.00 0.00
Table 5.9 presents a Pearson Chi-Square Test in which the Likelihood Ratio of M.
oleifera leaf inclusion levels and time had no significant differences (P > 0.05) in
Trichuris species. However, the infestation rate at the beginning of the research was
moderate, but as time passed (weeks 8 and 10), Trichuris species eggs were totally
absent in all faecal samples. Although Trichuris species occurred very moderately
during the entire research, the M. oleifera leaf-supplemented diet led to a load reduction
of this parasite to zero. This Chi-Square test triangulates the result obtained from the
regression analysis (Table 5.10) very well. Though, the infestation rate was very low at
the beginning of the research, it was completely reduced to an undetectable level as time

147
passed. This further shows the efficacy of M. oleifera as an ethno-veterinary-medicinal
treatment for GIPs in goats.
Table 5.9: Chi-Square Test of M. oleifera levels on Trichuris species over
time (weeks)
M. oleifera inclusion level (%) Value df
Asymptotic Significance
(2-sided)
0
(ecomectin)
Pearson Chi-Square 20.67b 20 0.417ns
Likelihood Ratio 19.04 20 0.519ns
10 Pearson Chi-Square 21.16
c 15 0.132ns
Likelihood Ratio 17.80 15 0.273ns
20 Pearson Chi-Square 10.36
d 10 0.409ns
Likelihood Ratio 7.54 10 0.673ns
30 Pearson Chi-Square 10.00
d 10 0.440ns
Likelihood Ratio 9.09 10 0.524ns
Total N of Valid Cases 96
a. 24 cells (80.0%) have expected count less than 5. The minimum expected count is .17.
b. 30 cells (100.0%) have expected count less than 5. The minimum expected count is .17.
c. 24 cells (100.0%) have expected count less than 5. The minimum expected count is .17.
d. 18 cells (100.0%) have expected count less than 5. The minimum expected count is .17.
Note: ns = non-significant at 0.05 alpha level; n = 24
Table 5.10 presents the results of a regression analysis of Trichuris species and M.
oleifera inclusion levels in which Trichuris species was a dependent variable while M.
oleifera was an independent variable. The result indicates that Trichuris species had no
significant difference (P > 0.05) at all M. oleifera leaf inclusion levels (10%, 20% and
30%), which proves the very small number of goats infested on this farm. The quasi-
control group which was treated with ecomectin and to which no M. oleifera leaves were
supplemented (0% inclusion level) was highly significantly different (P < 0.05) in
helminth load reduction. This might be attributed to a very moderate infestation rate by
Trichuris species among experimental animals, making it difficult to notice the effect of
M. oleifera on parasite load reduction. Similarly, a Chi-Square test (Table 5.9) with
Trichuris species, M. oleifera and weeks result showed no significant difference (P >

148
0.05) statistically. This might be attributed to the low prevalence rate of Trichuris
species (see Table 5.2) among experimental animals on this farm.
Table 5.10: Regression analysis of M. oleifera levels on Trichuris species in
study goats
M. oleifera Inclusion level g (%)
Standardized Coefficients
t
P-value Beta
0 (ecomectin) 0.521 3.59 0.001***
150 (10) -0.110 -0.97 0.336ns
300 (20) -0.170 -1.50 0.138ns
450 (30) -0.095 -0.84 0.406ns
R square = 0.027; F – statistic = 0.840 and n = 96; ns = non-significant at 0.05; *** = highly
significant to ≤ 0.05 alpha level
5.4.5 Infestation by Moniezia Species
Out of 96 faecal samples collected, 90 (93.80%) faecal samples had zero eggs of
Moniezia species (0% infestation rate). This means that only 6.20% of faecal samples
were infected in the following sequence: 4 (4.20%) had 2+, 1 (1%) had 3+ and 1 (1%)
had 4+ (see figure 4.6). This is a clear indication of a very low prevalence rate of
37.50% of the Moniezia species in 6 goats (Figure 5.1), possibly due to the mature age
of goats used in this study. Indeed, it has been reported that young goats are particularly
susceptible to tapeworm infestation in which the mature worms are found in the small
intestines. However, animals only get sick when infestation is severe, especially if they
are malnourished or already have a bacterial infection (Jansen and Burg, 2004).
Furthermore, it was found that the most common tapeworm of sheep is Moniezia
expansa. This parasite is found in the intestine and grows to around one meter long.
Despite their size, tapeworms are generally regarded as relatively harmless.

149
The other tapeworms of major importance in small ruminants are hydatid parasites such
as Echinococcus granulosis and Taenia ovis (Southwell et al., 2008). Moniezia species
are tapeworms (cestodes) found in all intestines of cattle, sheep and goats. The common
two species of Moniezia are Moniezia benedeni in cattle and Moniezia expansa in cattle,
sheep and goats. The eggs of M. expansa appear triangular and measure 56 to 67µm in
diameter, while those of M. benedeni are square and approximately 75 µm in diameter
with a prepatent period of approximately 40 days (Hendrix and Sirois, 2007). There is
not much literature on the infestation of goats by Moniezia species in comparison to
other GIPs.
Figure 5.6: Infestation levels of Moniezia species eggs in study goats
Table 5.11 presents the means of Moniezia species load before and during treatments
with M. oleifera. At the commencement of this study, only one goat was infected with
Moniezia species among the 16 goats (0.00+, 0.00+, and 0.75+). Moniezia species, like
Trichuris species, were not a major parasite problem among goats on the Neudamm
90
4 1 1
93.80%
4.20% 1% 1%
0
10
20
30
40
50
60
70
80
90
100
0 2+ 3+ 4+
Fre
quen
cy &
per
centa
ge
of
infe
stat
ion
Infestation levels
Frequency
Percentage

150
Experimental Farm. They occurred sparsely (4.2%) from the beginning of the research
and were completely minimized at days 44, 59 and 73 of the experiment based on the
faecal analytical results for M. oleifera leaf-supplemented goats. Possibly, the complete
minimization of Moniezia species in the middle part of the research might be due to the
efficacy of M. oleifera leaf-supplemented treatment. Just as coccidia oocysts, ecomectin
drug does not treat Moniezia parasites.
Table 5.11: Before and during treatment means of Moniezia species load
Faecal collection days 10% M. oleifera 20% M. oleifera 30% M. oleifera
1 (before treatment) 0.75 0.00 0.00
16 0.00 0.00 1.00
30 0.00 0.50 0.00
44 0.00 0.00 0.00
59 0.00 0.00 0.00
73 0.00 0.00 0.00
A Chi-Square test (Table 5.12) and linear regression analysis (Table 5.13) results show
that M. oleifera inclusion levels (10%, 20% and 30%) over time in weeks had no
significant effect (P > 0.05) at all on Moniezia species. Fewer goats (6 samples out of
96) were infested with Moniezia species as compared to trichostrongyle-type eggs and
coccidia oocysts. This very low presence of Moniezia eggs in faeces might be attributed
to the age-associated resistance of goats used in this study to Moniezia species (15
months to 4 years); that is, older goats are more resistant than younger ones. A research
conducted with nine Angora goats in South Africa found that eight goats between the
ages of 3 and 5 months were infected with M. expansa, and one was infected with other
cestode species. It was observed that the virtual absence of cestodes in kids older than 6
months indicates an age resistance to infection in Angora goats (Horak et al., 2001).

151
Another study conducted in southern Nigeria concurred that Moniezia infection in goats
and sheep was common in young animals between ages zero to four and four to eight
months. However, after eight months, the presence of Moniezia eggs in faeces
diminished drastically (Fagbemi and Dipeolu, 2011). Although more research needs to
be done, these results show that M. oleifera leaf supplement could help reduce the
number of Moniezia eggs over time. Overall, this means that the M. oleifera leaf-
supplemented diet had some effect on the Moniezia parasites.
Table 5.12: Chi-Square Tests of M. oleifera levels on Moniezia species
over time (weeks)
Level of inclusion (%) Value df
Asymptotic Significance
(2-sided)
10 Pearson Chi-Square 5.22
c 5 0.390ns
Likelihood Ratio 3.82 5 0.576ns
20 Pearson Chi-Square 5.22
c 5 0.390ns
Likelihood Ratio 3.82 5 0.576ns
30 Pearson Chi-Square 5.22
c 5 0.390ns
Likelihood Ratio 3.82 5 0.576ns
Total N of Valid Cases 96
a. 18 cells (75.0%) have expected count less than 5. The minimum expected count is .17.
b. 12 cells (100.0%) have expected count less than 5. The minimum expected count is .50.
c. 12 cells (100.0%) have expected count less than 5. The minimum expected count is .17.
Note: ns = non-significant at 0.05 alpha level; n = 24
Table 5.13: Regression analysis of M. oleifera on Moniezia species eggs
Level of inclusion, g (%)
Standardized Coefficients
t
P-value Beta
M. oleifera 150 (10) -0.17 -1.51 0.136ns
M. oleifera 300 (20) -0.11 -0.94 0.348ns
M. oleifera 450 (30) -0.07 -0.60 0.553ns
R square = 0.03; F – statistic = 0.82 and n = 96; ns = non-significant at 0.05; * =
significant at 0.05 alpha level

152
5.4.6 Infestation by Strongyloides papillosus
No eggs of Strongyloides papillosus (0% infestation) were found in 88 (92%) of faecal
samples, while 6 (6%) had 1+, 1(1%) had 2+ and 1(1%) had 3+ infestation rates,
respectively. This means that only 8 (8.30%) of the 96 faecal samples collected were
infested by Strongyloides papillosus (Figure 5.7). Similar to Trichuris species and
Moniezia species, Strongyloides papillosus had low prevalence rate (43.70%), with a
moderate infestation rate. Kumba et al. (2003) detected Strongyloides in communal
goats in all seasons in eastern Namibia, though to a lesser extent compared to the present
study. Love and Hutchinson (2003) pointed out that Strongyloides papillosus eggs are
often seen in faecal counts in sheep, but this parasite is of doubtful significance.
Their importance if any is overshadowed by parasites such as Ostertagia and
Trichostrongylus species. Strongyloides papillosus can infect animals through ingestion,
skin penetration in wet conditions, and through milk for lactating ewes. Such infects are
common during the wet season. Hendrix and Sirois (2007) pointed out that
Strongyloides papillosus is often referred to as the ―intestinal threadworm‖. These
nematodes are unique in that only a parthenogenetic female (female that lays eggs
without copulating with a male) is parasitic in the host.

153
Figure 5.7: Infestation levels of Strongyloides papillosus in study goats
Table 5.14 presents the means of Strongyloides papillosus load infestation before and
during treatments with M. oleifera and ecomectin. The research goats had very low
infestation rates of Strongyloides papillosus (0.00+, 0.00+, 0.00+, and 0.75+) before
treatment and had only an 8.2% infestation rate (see Figure 7) throughout the research
period. Infestations were rare from the beginning of the research and was completely
absent at days 59 and 73 as M. oleifera leaf supplemented to the three experimental
groups and ecomectin given to the quasi-control group. The elimination of Strongyloides
papillosus might be due to the low infestation rate at the start, coupled with the efficacy
of the M. oleifera leaf-supplemented diet, as well as the ecomectin treatments.
88
6 1 1
92%
6% 1% 1%
0
10
20
30
40
50
60
70
80
90
100
0 1+ 2+ 3+
Fre
quen
cy &
per
centa
ge
of
infe
stat
ion
Infestation levels
Frequency
Percentage

154
Table 5.14: Before and during treatment means of Strongyloides papillosus
load
Faecal collection days
0% M. oleifera
(ecomectin)
10%
M. oleifera
20%
M. oleifera
30%
M. oleifera
1 (before treatment) 0.00 0.75 0.00 0.00
16 0.50 0.00 0.00 0.25
30 0.25 0.00 0.50 0.00
44 0.50 0.50 0.50 1.00
59 0.00 0.00 0.00 0.00
73 0.00 0.00 0.00 0.00
The Chi-Square test (Table 5.15) and linear regression analysis (Table 5.16) of the effect
of a M. oleifera leaf-supplemented diet on Strongyloides papillosus indicated that M.
oleifera had no significant difference (P > 0.05) on the Strongyloides papillosus
infestation rate over time. This might be attributed to the low prevalence rate (Figure
5.1) among the 16 goats used for this research at the Neudamm Experimental Farm. A
research study conducted in Namibia reported no severe cases of Strongyloides
papillosus among goats (Kumba et al., 2003) just as in the present study. Therefore, the
hypothesis (H04) that states that M. oleifera inclusion has no significant effect on the
reduction of Trichuris species, Moniezia species and Strongyloides papillosus parasite
loads over time failed to be rejected.

155
Table 5.15: Chi-Square Test of M. oleifera on Strongyloides papillosus over
time (weeks)
Level of inclusion (%) Value df
Asymptotic Significance
(2-sided)
0 Pearson Chi-Square 5.217 5 0.390ns
Likelihood Ratio 3.815 5 0.576ns
10 Pearson Chi-Square 10.909 5 0.053ns
Likelihood Ratio 8.223 5 0.144ns
20 Pearson Chi-Square 10.909 10 0.365ns
Likelihood Ratio 8.223 10 0.607ns
30 Pearson Chi-Square 10.000 10 0.440ns
Likelihood Ratio 9.088 10 0.524ns
Total N of Valid Cases 96
a. 18 cells (75.0%) have expected count less than 5. The minimum expected count is .17.
b. 12 cells (100.0%) have expected count less than 5. The minimum expected count is .17. c. 12 cells (100.0%) have expected count less than 5. The minimum expected count is .33. d. 18 cells (100.0%) have expected count less than 5. The minimum expected count is .17 Note: ns = non-significant at 0.05 alpha level; n = 24
Table 5.16: Regression analysis of M. oleifera on Strongyloides papillosus
Level of Inclusion, g (%)
Standardized Coefficients
t
P-value Beta
M. oleifera 0 (ecomectin) 0.03 0.43 0.667ns
M. oleifera 150 (10) 0.07 0.61 0.545ns
M. oleifera 300 (20) 0.12 1.07 0.288ns
M. oleifera 450 (30) 0.20 1.74 0.085ns
R square = 0.04; F – statistic = 1.10 and n = 96; ns = non-significant at 0.05 alpha level
To a great extent, as deduced from the results, this study was able to address the research
question posed at the beginning of the study. Moringa oleifera leaf supplement had a
significant effect on infestation reduction (P < 0.05) at 300 g (20%) and 450 g (30%).
The efficacy of M. oleifera leaf supplement as an anthelmintic substance is apparent at
450 g (30%) inclusion level, at which the greatest reduction was observed on
trichostrongyle-type eggs. Furthermore, the analysis revealed that M. oleifera had a
significant mean difference (P < 0.05) in the reduction of coccidia oocyst infestation.
Interestingly for coccidia oocysts, M. oleifera leaf-supplement inclusion had an equal
efficacy at 150 g (10%) and 300 g (20%), respectively, with a decline at 450 g (30%).

156
This suggests that M. oleifera leaf supplement inclusion levels at 150 g or 300 g may
serve as an anthelmintic drug for Boer goats, holding all things constant. Economically
speaking, an inclusion rate of 150 g may suffice for reduction of coccidia oocyst
infestation. Thus, from this study, M. oleifera can serve as an ethno-veterinary medicinal
plant for the treatment of GIPs in goats. Coincidentally, M. oleifera has been used by
many researchers as an animal feed supplement (Sanchez et al., 2005; Soliva, Kreuzer et
al., 2005; Adegun, Aye, & Dairo, 2011); therefore, with the outcome of this study,
farmers may now use M. oleifera not only as a feed supplement but also as an
anthelmintic treatment for various gastrointestinal infestations. Henceforth, the
hypothesis (H04) that M. oleifera does not have anthelmintic properties was rejected
because M. oleifera contains anthelmintic properties as it reduced GIPs in goats.
5.5 Conclusion
This study revealed that M. oleifera has the ability to reduce GIP loads in Boer goats to a
large extent, in comparison to the ecomectin drug. Moringa oleifera leaf supplement
significantly reduced trichostrongyle-type eggs, coccidia oocyst, Trichuris species,
Moniezia species eggs and, to a lesser extent, Strongyloides parasite species in goats.
Goats like M. oleifera leaves, so feeding it to these animals would cause no difficulty.
Although M. oleifera is an exotic plant in Namibia and mainly unfamiliar to animals, its
leaves were easily accepted by the goats, which adapted to it as feed very easily. Feeding
about 300 g (20%) and 450 g (30%) to goats would serve as an anthelmintic drug. Since
M. oleifera is in high demand for both human and animal consumption, it needs to be
used carefully just for its purpose. Finally, M. oleifera would serve as a good natural
remedy and supplement for goats in the fight against gastrointestinal helminths,

157
especially since they have developed resistance to many commercial anthelmintics over
the years. A further research is needed for investigating if GIPs in goats will develop
resistance against M. oleifera leaf-ethno-anthelmintic supplement of over time.
References
Abreu, M., García, J., Leyva, Y., Roche, Y., Molina, M., Sanavria, A., & Da Fonseca, A.
(2014). Efecto in vitro de extractos acuosos de Moringa oleifera y Gliricida
sepium en el desarrollo de las fases exógenas de estrongílidos gastrointestinales
de ovinos. Rev. Salud Anim., 36(1), 28–34.
Adegun, M., Aye, P., & Dairo, F. (2011). Evaluation of Moringa oleifera, Gliricidia
sepium and Leucaena leucocephala - based multinutrient blocks as feed
supplements for sheep in South West Nigeria. Agriculture and Biology Journal
of North America, 2(11), 1395–1401. https://doi.org/10.5251
Akinbamijo, O., Adediran, S., Nouala, S., & Saecker, J. (n.d.). Moringa fodder in
ruminant nutrition in The Gambia. Moringa News, 5.
Alhakman, F., Kumar, S., & Khan, S. (2013). Estimation of total phenolic content, in-
vitro antioxidant and anti-inflammatory activity of flowers of Moringa oleifera.
Asian Pacific Journal of Tropical Biomedicine, 3(8), 623–627.
https://doi.org/10.1016/S2221-1691(13)60126-4
Beukes, A. (2017, March 15). Vegetation of Neudamm Experimental Farm.
Beukes, P. (2017). Average annual rainfall of Neudamm Experimental Farm from 1974
to 2016 (Meteorological) (pp. 1–2). Namibia: University of Namibia.
Bey, H. (2010). All things moringa: the story of an amazing tree of life.
http://www.allthingsmoringa.com/eBook.pdf, 1–40.

158
Boer Goat Breeder‘s Society of Namibia. (2008, June). The ennobled: Boer goat of
Namibia. Boer Goat Breeders‘ Society of Namibia.
Caceres, A., Cabrera, O., Morales, O., Mollinedo, P., & Mendia, P. (1991).
Pharmacological properties of Moringa oleifera Preliminary screening of
antimicrobial activity. Journal of Ethnopharmacol, 36, 233–237.
Coffey, L. (2006). Meat goats: Sustainable production. ATTRA. Retrieved from
www.attra.ncat.org
Coffey, L. (2014). Coccidiosis: Symptoms, Prevention, and Treatment in Sheep, Goats,
and Calves. National Center for Appropriate Technology, 1–8. https://doi.org/1-
800-346-9140
Fagbemi, B., & Dipeolu, O. (2011). Moniezia infection in the dwarf breeds of small
ruminants in Southern Nigeria. Veterinary Quarterly, 5(2), 75–80.
FAO. (2013). World Statistical Compendium for raw hides and skins, leather and leather
footwear 1993-2012. FAO. Retrieved from
http://www.fao.org/fileadmin/templates/est/COMM_MARKETS_MONITORIN
G/Hides_Skins/Documents/COMPENDIUM2013.pdf
Gebregiorgis, F., Negesse, T., & Nurfeta, A. (2011). Feed intake and utilization in sheep
fed graded levels of dried moringa (Moringa stenopetala) leaf as a supplement to
Rhodes grass hay. Trop Anim Health Prod in Springer Science, 44, 511–517.
https://doi.org/10.1007/s11250-011-9927-9
Hale, M. (2006). Managing internal parasites in sheep and goats. National Center for
Appropriate Technology (NCAT). Retrieved from https://attra.ncat.org/attra-
pub/livestock/

159
Hassan, F., & Ibrahim, M. (2013). Moringa oleifera: Nature is most nutritious and multi-
purpose tree, 3(4). Retrieved from www.ijsrp.org
Hendrix, C., & Sirois, M. (2007). Laboratory procedures for veterinary technicians (5th
ed.). St. Louis, Missouri: Mosby Elsevier.
Hepworth, K., Neary, M., & Hutchens, T. (2006). Animal Sciences: Managing internal
parasitism in sheep and goats. Purdue Extension, 9.
Horak, I., Macivor, K., & Greeff, C. (2001). Parasites of domestic and wild animals in
South Africa. XXXIX. Helminth and arthropod parasites of Angora goats in the
southern Karoo. Onderstepoort Journal of Veterinary Research, 68, 27–35.
Indre, D., Dărăbuş, G., Oprescu, I., Morariu, S., Mederle, N., Ilie, M., … Imre, M.
(2010). Morphometrical studies on some eggs of gastrointestinal nematodes from
sheep. Lucrări Ştiinłifice Medicină Veterinară, XLIII(1). Retrieved from
http://www.usab-tm.ro/vol10MV/5_vol10.pdf
Jain, P., Singh, S., Singh, S., Verma, S., Kharva, M., & Solanki, S. (2013). Anthelmintic
potential of herbal drugs. International Journal of Research and Development in
Pharmacy and Life Sciences, 2(3), 412–427.
Jansen, C., & Burg, K. (2004). Goat keeping in the tropics. (R. Corner, Ed.).
Wageningen, The Netherlands: Agromisa Foundation and CTA. Retrieved from
www.agromisa.org
Junker, K., Horak, I., & Penzhorn, B. (2015). History and development of research on
wildlife parasites in southern Africa, with emphasis on terrestrial mammals,
especially ungulates. International Journal for Parasitology: Parasites and
Wildlife on ScienceDirect, 4, 50–70.

160
Kahumba, A. (2010, November). Comparison of the rehabilitative effects of mechanical
and chemical methods of bush control on degraded Highland Savanna
rangelands in Namibia. University of Namibia, Windhoek, Namibia.
Kapu, N. (2012). Assessment of rangeland condition and evaluation of the nutritional
value of common grass and browse species at the Neudamm Experimental Farm,
Namibia. University of Namibia, Windhoek, Namibia. Retrieved from
www.unam.na
Kumba, F., Katjivena, H., Kauta, G., & Lutaaya, E. (2003). Seasonal evolution of faecal
egg output by gastrointestinal worms in goats on communal farms in eastern
Namibia. Onderstepoort Journal of Veterinary Research, 70, 265–271.
Love, S., & Hutchinson, G. (2003). Pathology and diagnosis of internal parasites in
ruminants. In Gross Pathology of Ruminants, Proceedings 350 (pp. 309–338).
Sydney: University of Sydney.
Machen, R., Graddock, F., Graig, T., & Fuchs, T. (1993). A Haemonchrus contortus
management plan for sheep and goats in Texas. AgriLIFE EXTENSION Texas
A&M System. Retrieved from http://animalscience.tamu.edu/wp-
content/uploads/sites/14/2012/04/L5095-haemonchus.pdf
Moyo, B., Oyedemi, S., Masika, P., & Muchenje, V. (2012). Polyphenolic content and
antiozidant properties of Moringa oleifera leaf extracts and enzymatic activity of
liver from goats supplemented with Moringa oleifera leaves/sunflower seed
cake. Meat Science on Elsevier, 91, 441–447.
https://doi.org/10.1016/j.meatsci.2012.02.029
Namibia Statistics Agency. (2015). Namibia Census of Agriculture 2013 2104 -
Communal Sector Report (Agriculture) (pp. 1–120). Windhoek, Namibia:

161
Namibia Statistics Agency (NSA). Retrieved from
https://cms.my.na/assets/documents/NAC_2013.pdf
Pancholy, S., Carter, L., Thomas, V., & Donald, S. (2007, July). Practical Management
of internal parasites in goats. Florida A & M University. Retrieved from
www.famu.edu/cesta/main/assets/file
Prince, M. (2007). ECHO Technical Note: The moringa tree, 1–19.
Regassa, F., Sori, T., Dhuguma, R., & Kiros, Y. (2006). Epidemiology of
Gastrointestinal Parasites of Ruminants in Western Oromia, Ethiopia.
International Journal of Applied Research in Veterinary Medicine, 4(1), 1–7.
Reinemeyer, C., & Nielsen, M. (2013). Handbook of equine parasite control. USA: John
Wiley & Sons Inc.
Roeber, F., Lex, A., & Gasser, R. (2013). Advances in the diagnosis of key
gastrointestinal nematode infections of livestock with an emphasis on small
ruminants. Elsevier Inc on SienceDirect, 31, 1135–1152.
Rumosa Gwaze, F., Chimonyo, M., & Dzama, K. (2012). Effect of season and age on
blood minerals, liver enzyme levels, and faecal egg counts in Nguni goats of
South Africa. Czech Journal of Animal Science, 57, 443–453.
Sanchez, N., Sporndly, E., & Ledin, I. (2005). Effect of feeding different levels of
foliage of Moringa oleifera to creole dairy cows on intake, digestibility, milk
production and composition. Elsevier.
https://doi.org/10.1016/j.livprodsci.2005.09.010
Sleeman, Meader, L., Mudakikwa, A., Foster, J., & Patton, S. (2000). Gastrointestinal
Parasites of Mountain Gorillas (Gorilla gorilla beringei) in the Parc National des
Volcans, Rwanda. Journal of Zoo and Wildlife Medicine, 31(3), 322–328.

162
Soliva, C., Kreuzer, M., Foidl, N., Foidl, G., Machmuller, A., & Hess, H. (2005).
Feeding value of whole and extracted Moringa oleifera leaves for ruminants and
their effects on ruminanal fermentation in vitro. Animal Feed Science and
Technology on WLSEVIRE, 118, 47–62.
Southwell, J., Fisk, C., & Sallur, N. (2008). Internal parasite control in sheep reference
manual. (D. Maxwell, Ed.). Sheep CRC Ltd. Retrieved from
www.sheepcrc.org.au/ipcs
Stehman, S., & Smith, M. (2004, September). Goat parasites: Management and control.
Retrieved from www.ansci.cornell.edu/goats/.
Tamboura, H., Banga-Mboko, H., Maes, D., Youssao, I., Traore, A., Bayala, B., &
Dembele, M. (2006). Prevalence of common gastrointestinal nematode parasites
in scavenging pigs of different ages and sexes in eastern centre province, Burkina
Faso. Onderstepoort Journal of Veterinary Research, 73, 53–60.
Tayo, G., Poné, J., Komtangi, M., Yondo, J., Ngangout, A., & Mbida, M. (2014).
Anthelminthic Activity of Moringa oleifera leaf extracts evaluated in vitro on
four developmental stages of Haemonchus contortus from Goats. American
Journal of Plant Sciences, 5(11). https://doi.org/10.4236/ajps.2014.511185
Turner, W., & Getz, W. (2010). Seasonal and demographic factors influencing
gastrointestinal parasitism in ungulates of Etosha National Park. Journal of
Wildllife Disease, 46(4), 1108–1119.
University of Namibia. (2011). Neudamm Agricultural College Farm. University of
Namibia. Retrieved from http://digital.unam.na/handle/11070.1/4461?show=full

163
Yayneshet, T., Eik, L., & Moe, R. (2008). Feeding Acacia etbaica and Dichrostachys
cinerea fruits to smallholder goats in northern Ethiopia improves their
performance during the dry season. Elsevier on Science Direct, 119, 31–41.

164
Chapter 6
Indirect Effect of a Moringa oleifera Leaf-Supplemented Diet on Growth Rates of
Pre-Weaning Boer Goat Kids
6.1 Abstract
The objective of this study was to evaluate the indirect effects of feeding a Moringa
oleifera (M. oleifera) leaf-supplemented diet on growth rates in pre-weaning Boer goat
kids. Because Namibia is semi-arid and the driest country in Africa south of the Sahel,
lactating does in Namibia are challenged with acquiring the required amount of forage in
the rangelands to meet milk production and nutritional needs for their kids. This scarcity
of forage, along with the low nutritional quality of the available grasses and/or browses,
creates the need to supplement lactating does with nutritionally-rich fodders.
A completely randomized design (CRD) was used for this experiment in which a total of
16 lactating does with their 20 kids (four does had twins) were randomly selected from
51 lactating goats. The experiment used four M. oleifera leaf supplemented treatment
levels (0%, 10%, 20% and 30%) and randomly assigned four goats to each treatment
level to assess if different levels of M. oleifera have an effect on growth parameters of
Boer goat‘s kids. The results revealed that there were significant differences (P < 0.05)
in heart girth, body length and weight of kids, which were measured as growth rate
parameters along with body condition scores (BCS). Although Boer goats are known for
their fast growth under favourable conditions, feed supplementation of pregnant and
lactating does could be advantageous for maximum milk production to support their
kids‘ healthy early growth and development, especially under unfavourable conditions

165
such as during winter and drought. Therefore, in a semi-arid and persistently drought-
affected country like Namibia, M. oleifera would bring a possible solution for animal
supplementation during adverse climatic conditions, since it grows very fast and
produces a lot of leaf-dry matter per hectare; thus, alleviating the farmers‘ stress of
purchasing feed-supplements during the pregnancy and lactation period.
Finally, the hypothesis (H05) that feeding M. oleifera as a supplement to lactating goats
does not affect the growth rate parameters of their pre-weaning kids was rejected
because it does have a significant effect on all growth parameters of pre-weaning kids.
Keywords: Boer goat kids, growth rates, lactating does, Moringa oleifera, supplemented
diet
6.2 Introduction
Goats are very important in areas where feed resources are limited because they can
consume a wide variety of plant species and parts and have a great ability to select high
quality diets in these circumstances (Huston & Hart, 2002; Mpofu, 2004). Namibia has
about 2 million goats nationwide, most of which are found in communal areas and they
play an important economic role for sustainability of subsistence farming. Officially,
200,000 to 250,000 goats are marketed annually, of which 95% is exported to South
Africa. Boer goat breed is one of the breeds found in Namibia and is considered to be
most resilient small stock breed, with a great capacity for adaptation (BGBSN, 2008).
Despite their resilience, they are equally affected by the scarcity of forage and the low
nutritional quality of the available grasses in winter and in drought. Therefore, drought
and cold-resistant fodder plants like moringa would serve as a best option to solve this

166
problem as suggested by Huque and Sarker (2014). It is however of paramount
importance to avail easily adaptable nutrient-rich plant species for maximum production
and growth of goats. One of such plants is the Moringa oleifera (M. oleifera) tree.
Moringa oleifera leaves are readily eaten by cattle, sheep, goats, pigs and rabbits
(United Caribbean Trust, 2013).
A feeding trial conducted with West African dwarf goats in Nigeria showed that M.
oleifera leaf-supplementation resulted in an average weight gain of 20.83
gram/animal/day (Asaolu et al., 2012). A similar feeding trial revealed that
supplementation of beef and dairy cows‘ diet with 40-50% of M. oleifera leaves led to
an increase in milk yields for dairy cows and daily weight gains for beef cattle by 30%.
Birth weight increased by 3-5 kg (Prince, 2007). Moringa oleifera is well known for its
enormous biomass production and it promises to be the plant of the future in ruminant
animal supplementation strategy. Under high density cultivation, it yielded biomass in
excess of 15 tonnes dry matter/hectare (DM/ha) in a 60-day growing cycle under the
International Trypanotolerance Centre conditions in Banjul (Akinbamijo et al., n.d.).
Research shows that every 100 grams of M. oleifera contains: 6.7 g of protein in leaves,
2.5 g of protein in pods, 27.1 g of protein in leaf powder, 259 mg of mineral potassium
(K) in leaves, 259 mg K in pods, 1,324 mg of K in leaf powder and 6.8 mg of vitamin A,
β-carotene in leaves, 0.11 mg in pods and 16.3 mg in leaf powder (Price, 2007). In a
study by Sánchez-Machado et al. (2009), the chemical composition of moringa dry
leaves ranged from 19.34% to 22.42% for protein and 30.97% to 46.78% for dietary
fiber. They concluded that the leaves are a protein source with an adequate profile of

167
amino acids. The crude protein content of extracted and unextracted moringa leaves was
43.5 and 25.1%, respectively, suggesting that both the extracted and unextracted leaves
are good sources of protein for livestock (Foidl et al., 2011). Moringa oleifera has
proved to be a valuable supplement for animals in other countries (Mendieta et al.,
2007). This means that feeding it to goats at the appropriate period of nutritional needs is
necessary, especially during pregnancy for proper foetus development, and during
lactation for kids‘ development. Moringa oleifera leaves have a high potential as a
protein source supplement for ruminants, and their feeding value is similar to that of the
widely used soybean meal and rapeseed meal (Soliva et al., 2005).
In Namibia, M. oleifera has not found much use as human food or feed for ruminants, in
comparison with other regions such as Asia and Western Africa (Radovich, 2007;
Adegun, Aye, & Dairo, 2011). In addition, the time of kidding determines the period of
the highest nutritional demand, as late pregnancy and early lactation are critical times for
the does and kids (Coffey, 2006). Hence, the need for nutritional supplementation of
does during this critical period, as well as during winter and drought when rangelands
are less productive and provide lower nutritional value. Therefore, this study was aimed
at evaluating the use of M. oleifera as a nutritional supplement for lactating does to meet
their milk production requirement for proper development of their kids, as suggested by
Soliva et al. (2005).

168
6.3 Materials and Methods
6.3.1 Study Area
This study was conducted from October 2015 to January 2016 at the Neudamm Campus
of the University of Namibia, about 30 km east of Windhoek, with an area of 10,187
hectares. Neudamm Campus is located at 22° 30′ 07″ S and at 17° 22′ 14″ E, and at an
altitude of 1762 meter above sea level. The farm‘s temperature ranges between a
minimum of -7°C and a maximum of 44°C (University of Namibia, 2011), and the area
received an annual average rainfall of 247.8 mm in 2015/2016 summer season (P.
Beukes, 2017).
The vegetation of Neudamm Experimental Farm is classified as highland savannah
(semi-arid savannah) and characterized by grasses, shrubs and trees that are well spread
over the farm. An annual grass like Melinis repens and perennial grasses like Schmidtia
pappophoporoides, Anthephora pubescens and Brachiaria nigropedata are well
represented on the farm. Different types of trees like Acacia brownii, Acacia erioloba,
Acacia mellifera as well as shrubs like Grevia flava, are also found on this farm. The
estimated carrying capacity is about 12 hectares per large stock unit or 45 kg per hectare
biomass (A. Beukes, 2017; Kahumba, 2010; Kapu, 2012).
6.3.2 Study Design
A completely randomized design (CRD) consisting of a one-way treatment structure was
used in this trial to determine the mean significant differences at different levels of
inclusion of M. oleifera leaf supplement. The M. oleifera leaves were harvested from an

169
organic M. oleifera farm in Rundu (about 714 km from Windhoek), Namibia, at 30-day
intervals and shade-dried over plastic sheets within two weeks. Four treatment levels of
M. oleifera inclusions, with four replicates in each (0%, 10%, 20%, and 30%) in
isocaloric and isonitrogenous diets were used. Sixteen (16) lactating Boer goats with age
range of 12-50 months old (29.375 ± 11.146 months) and body weight range of 27.6-
50.5 kg (37.056 ± 6.619 kg) were used along with their 20 kids in this study. Taking into
consideration an average weight of 37 kg per goat, the inclusion levels translated into
0% (0 g), 10% (150 g), 20% (300 g) and 30% (450 g) of M. oleifera dry leaves per day
as described by Gebregiorgis, Negesse, & Nurfeta (2011). The basic background
information about the study goats is presented in Table 6.1.
Table 6.1: Basic information about study goats
Doe ID
Doe‘s age in
months
Date of
kidding
Kid‘s birth
type
Kid‘s sex
Research start
date
M. oleifera
inclusion
levels
3634 22 05/10/2015 Single Male 15/ 10/ 2015 0%
3482 38 03/09/2015 Twins Male & female 15/ 10/ 2015 0%
3644 20 09/10/2015 Single Female 15/ 10/ 2015 0%
3631 12 09/10/2015 Single Male 15/ 10/ 2015 0%
911 50 03/09/2015 Single Male 15/ 10/ 2015 10%
3500 36 31/08/2015 Twins Male & female 15/ 10/ 2015 10%
1420 50 09/10/2015 Single Female 15/ 10/ 2015 10%
3581 24 13/10/2015 Single Female 15/ 10/ 2015 10%
3573 25 05/10/2015 Single Male 15/ 10/ 2015 20%
3480 38 31/08/2015 Twins Male & male 15/ 10/ 2015 20%
3628 21 09/10/2015 Single Male 15/ 10/ 2015 20%
3641 20 09/10/2015 Single Female 15/ 10/ 2015 20%
3584 25 08/10/2015 Single Male 15/ 10/ 2015 30%
3448 43 03/09/2015 Twins Male & female 15/ 10/ 2015 30%
3629 21 09/10/2015 Single Female 15/ 10/ 2015 30%
3576 25 09/10/2015 Single Female 15/ 10/ 2015 30%
Dry lucerne (Medicago sativa) was used as a basal diet for all goats, supplemented with
300 g Ram-Lamb-Ewe Pellets® [Feedmaster (Pty) Ltd., Windhoek, Namibia] along with
the mineral lick. At the Neudamm Experimental Farm, during winter or drought, lucerne

170
is being used as a sole feed to lactating goats and is supplemented with Ram-Lamb-Ewe
pellets. The nutritional compositions of the feed and mineral lick block fed to the studied
goats are given in Table 6.2.
Table 6.2: Nutrient compositions of feeds and lick block fed to the goats
Nutrients M. oleifera Lucerne Pellets Lick block
Moisture 6.25 g/100g 6.35 g/100g 120 (60 mg/kg) 120 g/kg
Ash 10.64 g/100g 6.75 g/100g 140 (50 mg/kg) ----
Fat 5.64 g/100g 1.02 g/100g 70 (1 mg/kg) ----
Crude protein 27.20 g/100g 20.35 g/100g ---- 160 g/kg
Protein ex. NPN ---- ---- ---- 100%
Crude Fiber 7.76 g/100g 23.45 g/100g 150 (1 mg/kg) 120 g/kg
Acid detergent fiber 8.91 g/100g 26.98 g/100g ---- ----
Neutral detergent fiber 16.39 g/100g 39.19 g/100g ---- ----
Metabolisable Energy 11 MJ/kg 9.50 MJ/kg 9.4 MJ/kg ----
Total Digestible Nutrient 67 g/100g 61 g/100g ---- ----
Digestible energy 12 MJ/kg 11.30 MJ/kg ---- ----
Calcium 1.76 g/100g 0.43 g/100g 12 (0.3 mg/kg) 75 g/kg
Phosphorus 0.32 g/100g 0.18 g/100g ---- 50 g/kg
Sodium 0.13 g/100g 0.01 g/100g ---- ----
Potassium 0.70 g/100g 0.65g/100g ---- ----
Magnesium 0.17 g/100g 0.06 g/kg 220 mg/kg ----
Iron 182.97 mg/kg 104.20 mg/kg 0.05 mg/kg ----
Copper 12.38 g/100g 6.77 mg/kg ---- ----
Manganese 0.001 mg/kg 32 mg/kg 0.03 mg/kg ----
Zinc ---- ---- 0.05 mg/kg ----
Cobalt ---- ---- 0.001 mg/kg ----
Iodine ---- ---- 0.001 mg/kg ----
Selenium ---- ---- 0.0003 mg/kg ----
Vitamin A (IU) ---- ---- 5,000 (3 mg/kg) ----
Moist = % Moisture (100 - Moisture) = % Dry Matter); CP = % Crude Protein; CF = % Crude Fibre;
ADF = % Acid Detergent Fibre; NDF = % Neutral Detergent Fibre; Fat = % Fat; Ash = % Ash (100 – Ash)
= Organic Matter); TDN = Total Digestible Nutrients; DE = Digestible Energy; and ME = Metabolisable
Energy, NSC = Non-structural Carbohydrate. Ca = % calcium; Na = % Sodium; K = %Potassium;
Mg = %Magnesium; P = % Phosphorous; Mn = Manganese (ppm); Cu = Copper (ppm); Fe = Iron (ppm);
Zn = Zinc (ppm); Tannins = Tannic Acid. Results are presented ‗as is‘. Source for pellets and lick block
data: Feedmaster Namibia
A control group (0% M. oleifera) was fed with only lucerne and pellets, while the three
experimental groups were supplemented with M. oleifera leaves at three inclusion levels
(10%, 20% and 30%). All goats were fed twice a day (08:00 and 15:00) for 74 days and
clean water was available ad libitum in all cages. Sixteen lactating Boer goats were

171
randomly allocated to each treatment (4 per treatment) to assess the effect of a M.
oleifera leaf-supplemented diet on growth rates of their pre-weaning kids. The goats
were housed in individual wire mesh cages and introduced to the M. oleifera leaf-
supplemented diet between two weeks and one month after birth. Both does and kids
were weighed prior to the introduction of the M. oleifera-supplemented diet. An
adjustment period of 14 days, as suggested by Sarwatt et al. (2002), was observed to get
animals used to the new diet, after which a 60-day trial period commenced. Feed given
and refusals were recorded daily for the determination of daily feed intake (Gebregiorgis
et al., 2011; Pulina et al., 2013). Heart girth, body length and body weights of kids were
measured and body condition scores (BCS) observed and recorded weekly throughout
the 60-day trial period. For does, only body weights and BCS of were taken weekly.
Table 6.3 displays the experimental layout of this study.
Table 6.3: Experimental layout of M. oleifera supplementation to lactating does
Treatments, M. oleifera: % (g) 0 (0) 10 (150) 20 (300) 30 (450) Total
Replications 4 goats 4 goats 4 goats 4 goats N = 16 goats
6.3.3 Experimental Animals
Lactating goats were purposefully targeted in the current study. Among these, 16
lactating Boer goats from a total population of 51 lactating goats at Neudamm
Experimental Farm were randomly sampled for the present feeding trial since most
nutritional deficiencies are common among lactating does and their kids (Coffey, 2006).
The trial had four treatment levels with four goats in each treatment level as replicates.
The does were enclosed in individual pens with their kids. All 16 pens were of equal size

172
(430 cm length x 13 cm width) with taps providing water ad libitum and trace mineral
salt blocks throughout the research period, as discussed by Juhnke (2011).
Boer goats are more sensitive to external parasites than to internal parasites (Agra
Professional Services, 2013). Therefore, at the beginning of this research, both does and
kids were treated against ectoparasites (Gebregiorgis et al., 2011; Rumosa Gwaze et al.,
2012) using COOPERS SUPADIP (500 mL) at a dilution ratio of 50 mL: 10 L of water.
The COOPERS SUPADIP® [Cooper Veterinary Products (Pty) Ltd., Isando, South
Africa] contains chlorfenvinphos 30% m/v. At Neudamm Experimental Farm,
Ivermectin (1 mL: 50 kg) and Dectomax (1 mL : 50 kg) are used to treat both
ectoparasites and endoparasites.
6.3.4 Data Collection Procedures
Lactating Boer goats with their kids and M. oleifera leaves were used as instruments for
data collection. Collected data included weekly growth rates of kids and M. oleifera leaf
supplemented rations as suggested by Abdulrazak et al. (2001) and Sanchez et al.
(2005). Similarly, weekly BCS were assessed and recorded as described by Frost et al.
(2008) for both does and kids. A weighing scale and tapeline were used to weigh and
measure weekly growth rates (heart girth, body length and weight) of kids as
demonstrated by Olatunji-Akioye and Adeyemo (2009). Lactating goats were fed M.
oleifera leaf-supplemented rations twice a day by 08:00 and 15:00, as suggested by
Yayneshet, Eik, and Moe (2008), using 4% body weight, which considered the wastes
during feeding as deliberated by Coffey (2006). Daily rations were divided into two
equal parts: one portion given by 08:00 and the other by 15:00, as described by

173
Gebregiorgis et al. (2011). During the feeding of M. oleifera leaf-supplemented rations,
kids were separated from their mothers to prevent them from consuming them directly.
The separation was done to observe the indirect effect of M. oleifera on the kids‘ growth
parameters and BCS. Moringa oleifera leaf rations were then given to and consumed by
the mothers within 10 to 20 minutes. Upon completion of the M. oleifera rations, the
kids were re-united with their mothers and lucerne and pellets were given together. Kids
were weighed and measured weekly to assess body weight gain, increase in body length
and girth, as well as BCS.
6.3.5 Data Analysis
The linear regression model and general linear model (GLM) were used to analyse data
to establish if the different diets significantly affected the kids‘ growth rates at the 5%
alpha level of significance (Gebregiorgis et al., 2011; Olatunji-Akioye & Adeyemo,
2009). The body weight, length, heart girth and body condition scores of the kids served
as dependent variables while the M. oleifera leaf supplement served as an explanatory
(factor) variable. The Statistical Package for Social Sciences (SPSS® version 23) and
Microsoft Office Excel® program were used for all data analyses.
6.4 Results and Discussion
The results obtained from this study include growth performance parameters (heart
girths, body lengths, and weights, as well as BCS) of kids used in the study that suckled
from does fed M. oleifera-supplemented rations, compared to a control group taken
weekly for the 74-day period. Figures and tables were used to compare the growth
parameters of kids, both descriptively and statistically. The results of the statistical

174
analyses reveal significant differences of growth parameters of kids whose mothers were
fed with a M. oleifera leaf-supplemented diet compared to the control group (kids not
indirectly fed M. oleifera).
6.4.1 Adjustment Period of Does and Kids’ Birth Types and Sex
A 14-day adaptation/adjustment period was considered, as suggested by Sarwatt et al.
(2002) and Yayneshet et al. (2008), during which the goats were gradually introduced to
the M. oleifera leaf-supplement diet. During this period, it was observed that in less than
a week, 15 out of the 16 (93.8%) goats liked M. oleifera leaves and consumed their
entire rations. This confirms the view of Mpofu (2004), who noted that goats feed on a
wide variety of feeds ranging from tree and shrub leaves to grasses. This dietary
flexibility is a factor which accounts for the hardiness of goats and one which increases
their ability to survive under difficult conditions. Although one of the goats could not
adjust immediately, but it did so gradually. The quick adaptation of goats to a M.
oleifera leaf-supplemented diet serves as an advantage of using it as fodder, nutritional
supplement or anthelmintic substance for goats and other livestock species, as reported
in a number of studies (Sanchez et al., 2005; Bey, 2010; Jain et al., 2013; Akinbamijo et
al., n.d.).
Does used in the study had both single and twin birth types, with kids comprising both
males and females. Figure 6.1 shows the birth types and sex of kids. A total of 20 kids
were used in this research, in which 12 (60%) were of single birth, and eight (40%) were
twins, with 11 (55%) males and nine (45%) females. Thus, from the 16 lactating does
used in the study, 12 had single births while four had twins.

175
Figure 6.1: Distribution of kids by birth type and sex
6.4.2 Heart Girths of Kids
The average growth of kids‘ heart girths based on M. oleifera inclusion levels are
presented in Figure 6.2. The result revealed that the 10% M. oleifera inclusion level
provided the highest growth in kids‘ heart girth of 50.43 cm, followed by 20% inclusion
level with 48.89 cm, and then 30% inclusion level with 48.09 cm. The control group, 0%
M. oleifera inclusion level had the lowest growth in kids‘ heart girth of 47.49 cm. This
clearly indicates that 10% (150 g) and 20% (300 g) M. oleifera inclusion levels can meet
the nutritional needs of lactating Boer goats ceteris paribus, while 30% (450 g) resulted
into diminishing returns to scale. Thus, it means that it is no longer economical to feed
more than a 20% inclusion level of M. oleifera. Although Boer goats have gained
worldwide recognition for its excellent fast growing rate (Lu, 2002), the results of this
study evidently shows that M. oleifera leaf supplementation to does boosted the fast-
growing rates of their kids.
12
kids 8
kids
11
kids 9
kids
60%
40%
55%
45%
0
10
20
30
40
50
60
70
Single Twins Males Females
Fre
quen
cy a
nd
per
centa
ge
Birth types and sex
Frequency
Percentage

176
Figure 6.2: Kids‘ average heart girths at different M. oleifera inclusion levels
The results of statistical analyses reveal significant differences of growth parameters of
kids whose mothers were fed with a M. oleifera leaf-supplemented diet compared to the
control (kids not indirectly fed M. oleifera). Table 6.4 presents the result of a linear
regression analysis of M. oleifera inclusion levels on the kids‘ heart girth growth over
time in weeks. Weeks were considered to evaluate the extent of weekly kids‘ growth
since the assessment of growth parameters was done on a weekly basis. The result
reveals that M. oleifera level of 10% (150 g) had a positive effect (P < 0.001) on the
kids‘ girth increase over time, but 20% (300 g) and 30% (450 g) inclusion levels had no
significant effect (P < 0.05) on kids‘ girth increase. This means that feeding 150 g of M.
oleifera to lactating goats would economically result into maximum productivity of does
and increase of kids‘ girth. On the contrary, any rate of increase of supplement beyond
these inclusion levels would result into economic loss since M. oleifera is costly, scarce
and in demand for human use as well, as emphasized by Radovich (2007) and Edward et
al. (2014). Furthermore, heart girth growth over time was also significantly different (P
47.49
50.43
48.89
48.09
46
46.5
47
47.5
48
48.5
49
49.5
50
50.5
51
0% 10% 20% 30%
Kid
s' g
irth
s (c
m)
M. oleifera inclusion levels

177
< 0.05) except in week one, where there was no statistically significant increase in girth
at the different M. oleifera inclusion levels and the control.
Table 6.4: Result of regression analysis on factors influencing kids‘ heart girth
Model
Unstandardized
Coefficients
Standardized
Coefficients
t Sig. B
Standard
Error Beta
(Constant) 40.53 0.83 48.93 0.000
Dum level 10% 2.09 0.63 0.17 3.34 0.001***
Dum level 20% 1.11 0.63 0.09 1.77 0.078ns
Dum level 30% 0.69 0.63 0.05 1.10 0.271ns
Week1 0.60 1.04 0.03 0.58 0.564ns
Week2 2.05 1.04 0.11 1.97 0.050*
Week3 4.05 1.04 0.21 3.90 0.000***
Week4 6.00 1.04 0.31 5.78 0.000***
Week5 7.70 1.04 0.40 7.41 0.000***
Week6 8.55 1.04 0.45 8.24 0.000***
Week7 9.25 1.04 0.48 8.91 0.000***
Week8 10.70 1.04 0.56 10.31 0.000***
Week9 12.00 1.04 0.63 11.56 0.000***
Week10 13.70 1.04 0.72 13.20 0.000***
Dependent Variable: Kid girth (cm); F-statistics = 31.61; R-square = 0.67; N = 220; & Durbin-
Watson Test= 1.03; ns = non-significant at 0.05; * = significant at 0.05; *** = extremely
significant to ≤ 0.001 alpha levels
Figure 6.3 presents the average weekly aggregate growth in kids‘ heart girths (cm). The
result indicates that asides weeks zero (initial girths) and one, growth in kids‘ heart girth
continued over time by weeks arithmetically. This means there was an additional growth
in heart girth throughout the research weeks on aggregate although kids grew bigger in
some weeks than others.

178
Figure 6.3: Overall average weekly growth in kids‘ heart girth
Table 6.5 presents the interaction of kids‘ growth in girth over time in weeks using a
Duncan Multiple Range Test analysis. The result shows the means for groups in
homogeneous subsets, which had no significant differences (P > 0.05) in kids‘ growth in
girths over time in weeks. Although kids‘ growth occurs every week, the growth was not
large enough to be statistically different.
Table 6.5: Duncan‘s multiple range tests for weekly growth in kids‘ heart girth (cm)
Week N
Subset for alpha = 0.05
1 2 3 4 5 6 7 8
0.0 20 42.00
1.0 20 42.10
2.0 20 43.70 43.70
3.0 20 45.70 45.70
4.0 20 47.70 47.70
5.0 20 49.35 49.35
6.0 20 50.40 50.40
7.0 20 51.20 51.20
8.0 20 52.40 52.40
9.0 20 54.00 54.00
10.0 20 55.50
P-value 0.140ns 0.066ns 0.066ns 0.129ns 0.108ns 0.082ns 0.141ns 0.167ns
Means for groups in homogeneous subsets are displayed; uses Harmonic Mean Sample size = 20
Note: ns = non-significant at 0.05 alpha level

179
Table 6.6 presents the descriptive statistics of weekly growth in kids‘ heart girths (cm).
As seen in the table, the mean ranges from 42.00 cm in week 0 to 55.50 cm in week 10
while maximum girth ranges from 48 cm to 60 cm, respectively. This indicates
significant increase in girths among kids.
Table 6.6: Descriptive statistics of weekly growth in kids‘ heart girth (cm)
Week N Mean
Standard
Deviation
Standard
Error
95% Confidence
Interval for Mean
Minimu
m
Maximu
m
Lower
Bound
Upper
Bound
0 20 42.00 4.41 0.99 39.94 44.07 36.00 48.00
1 20 42.10 4.36 0.98 40.06 44.14 36.00 48.00
2 20 43.70 3.99 0.89 41.83 45.57 37.00 50.00
3 20 45.70 3.92 0.88 43.87 47.54 40.00 53.00
4 20 47.70 3.44 0.77 46.09 49.31 42.00 53.00
5 20 49.35 3.51 0.79 47.71 50.99 42.00 55.00
6 20 50.40 2.85 0.64 49.06 51.74 45.00 55.00
7 20 51.20 2.73 0.61 49.92 52.48 45.00 55.00
8 20 52.40 2.44 0.54 51.26 53.54 48.00 56.00
9 20 54.00 2.53 0.57 52.81 55.19 48.00 59.00
10 20 55.50 2.63 0.59 54.27 56.73 50.00 60.00
Total 220 48.55 5.60 0.38 47.81 49.29 36.00 60.00
6.4.3 Body Lengths of Kids
The average growth rates of kids‘ body length based on the four M. oleifera inclusion
levels are found in Figure 6.4. The result shows that the 20% inclusion level resulted in
the highest increase in body length of 45.20 cm. Thirty percent had the second highest
increase in length of 45.13 cm, followed by the 10% inclusion level with 44.92 cm, and
the control (0% inclusion level) had the least increase in length of 42.71 cm,
respectively. This implies that kids‘ growth in body length corresponded more to the M.
oleifera inclusion levels compared to the control, an indication that M. oleifera leaf-
supplemented diet increased the growth in kids‘ body length.

180
Figure 6.4: Kids‘ average body length at different M. oleifera inclusion levels
Table 6.7 presents the result of a linear regression analysis of M. oleifera inclusion
levels on the kids‘ growth in length over time in weeks using the Durbin-Watson Test.
The result shows that M. oleifera inclusion levels had a significant effect (P < 0.05) on
kids‘ growth in length at all three inclusion levels over time (weeks), although 10%
(150 g) was less significant (p-value = 0.029) than 20% (300 g) and 30% (450 g),
respectively. There were also significant differences (P < 0.05) in kids‘ weekly growth
in length, except for weeks one and two that had no differences (P > 0.05).
Economically, kids‘ length growth was achieved from weeks 0 to 6 and diminished over
time from weeks 7 to 10, which means that continuous feeding of does resulted in less
effect on the kids‘ growth in length. This lesser effect could be attributed to lower
intake of milk as the kids grew bigger towards weaning period and were exposed to
consuming concentrates (pellets) and fodder (lucerne) by themselves, as suggested by
Mpofu (2004).
42.71
44.92 45.20 45.13
41
41.5
42
42.5
43
43.5
44
44.5
45
45.5
0% 10% 20% 30%
Kid
s' l
ength
s (c
m)
M. oleifera inclusion levels

181
Table 6.7: Result of regression analysis of factors influencing kids‘ body
length
Model
Unstandardized Coefficients
Standardized
Coefficients
t P-value B Standard Error Beta
(Constant) 37.41 0.73 51.06 0.000
Dum level 10% 1.22 0.55 0.11 2.20 0.029*
Dum level 20% 2.15 0.55 0.19 3.87 0.000***
Dum level 30% 2.20 0.55 0.19 3.97 0.000***
Week1 0.40 0.92 0.02 0.44 0.664ns
Week2 0.30 0.92 0.02 0.33 0.744ns
Week3 2.65 0.92 0.16 2.89 0.004***
Week4 2.90 0.92 0.17 3.16 0.002***
Week5 4.10 0.92 0.24 4.46 0.000***
Week6 5.95 0.92 0.35 6.48 0.000***
Week7 9.05 0.92 0.53 9.85 0.000***
Week8 8.80 0.92 0.52 9.58 0.000***
Week9 10.10 0.92 0.59 11.00 0.000***
Week10 10.65 0.92 0.63 11.60 0.000***
Dependent Variable: Kid length; R-Square= 0.67; F-Statistics= 32.36; N= 220 & Durbin-
Watson Test = 1.32; ns = non-significant at 0.05; * = significant at 0.05; *** = extremely
significant to ≤ 0.001 alpha level
The weekly aggregate average growth in kids‘ body length (cm) is shown in Figure 6.5.
Just as with the heart girths (Figure 6.3), there is a linear and consistent growth in kids‘
body lengths per week. However, weeks zero (initial week), one and two had the least
differences in aggregate increase in kids‘ growth in body length.

182
Figure 6.5: Overall average weekly growth in kids‘ body length
Table 6.8 presents the Duncan Multiple Comparison test analysis of kids‘ weekly growth
rates in body length. The result shows means for groups in 5 homogeneous subsets. The
result revealed that there were no mean significant differences (P > 0.05) within all
subsets in kids‘ length growth. Even though kids‘ growth in length did occur every
week, there was no statistical difference as in the case with growth in heart girth (Table
6.5).

183
Table 6.8: Duncan‘s multiple range tests for weekly growth in kids‘ body
lengths (cm)
Week
N
Subset for alpha = 0.05
1 2 3 4 5
0 20 38.80
1 20 39.20
2 20 39.85
3 20 41.95
4 20 42.95
5 20 43.80 43.80
6 20 45.25
7 20 47.60
8 20 48.55 48.55
9 20 49.40 49.40
10 20 50.10
Sig. 0.310ns 0.071ns 0.135ns 0.079ns 0.132ns
Means for groups in homogeneous subsets are displayed; uses Harmonic Mean Sample size =
20. Note: ns = non-significant at 0.05 alpha level
The descriptive statistics for kids‘ weekly growth in body length (cm) is presented in
Table 6.9. The mean ranges from 38.80 cm to 50.10 cm with maximum length ranging
from 46 cm to 54 cm from week 0 to 10, respectively.
Table 6.9: Descriptive statistics of weekly growth in kids‘ body length (cm)
Weeks
N
Mean
Standard
Deviation
Standard
Error
95% Confidence
Interval for Mean
Min.
Max.
Lower
Bound
Upper
Bound
0 20 38.80 4.42 0.99 36.73 40.87 31.00 46.00
1 20 39.20 4.23 0.94 37.22 41.18 31.00 46.00
2 20 39.85 3.67 0.82 38.13 41.57 33.00 46.00
3 20 41.95 2.98 0.67 40.55 43.35 36.00 47.00
4 20 42.95 2.68 0.60 41.69 44.21 39.00 48.00
5 20 43.80 2.38 0.53 42.69 44.91 40.00 49.00
6 20 45.25 2.29 0.51 44.18 46.32 40.00 49.00
7 20 47.60 2.70 0.60 46.34 48.87 43.00 53.00
8 20 48.55 2.33 0.52 47.46 49.64 44.00 53.00
9 20 49.40 2.37 0.53 48.29 50.51 45.00 54.00
10 20 50.10 2.57 0.58 48.90 51.30 45.00 54.00
Total 220 44.31 4.97 0.35 43.65 44.98 31.00 54.00

184
6.4.4 Body Weight Gains of Kids
The average body weight gains of kids according to M. oleifera inclusion levels are
found in Figure 6.6. The analysis confirms that a 10% inclusion level led to the highest
weight gain in kids of 10.49 kg. The 20% inclusion level yielded the second highest
weight gain of 10.28 kg, which was followed by the 30% inclusion level with 9.99 kg.
Finally, the 0% inclusion level generated the lowest weight gain of 8.98 kg. The fact that
the 0% inclusion level (control) generated the lowest of kids‘ weight gain compared to
the experimental groups demonstrates the effectiveness of M. oleifera on growth
parameters. Lu (2002) reported that among all superior traits, heavier body weight and
faster growth rate are the most notable characteristics of Boer goat kids. In a study with
West African Dwarf goat kids, Asaolu et al. (2012) concurred that supplementing M.
oleifera resulted in a significant weight gain, compared to Gliricidia sepium and
Leucaena leucocephala fodders. In the present study, the M. oleifera leaf-supplemented
diet increased weight gain more than those whose mothers were fed with only lucerne
and pellets.
Figure 6.6: Kids‘ average body weights gain at different M. oleifera inclusion
8.98
10.49 10.28
9.99
8
8.5
9
9.5
10
10.5
11
0% 10% 20% 30%
Kid
s' w
eights
(kg)
M. oleifera inclusion levels

185
Table 6.10 presents a linear regression analysis result of kids‘ weekly weight gain as
explained by M. oleifera inclusion levels using a Durbin-Watson test. The result shows
that M. oleifera and time resulted in significant differences (P < 0.05) in kids‘ weight
gain, except for week 1 that had no effect statistically. This means that M. oleifera
inclusion levels had an effect on weight gain of kids over time (weeks), which indicates
that all inclusion levels were economically potential contributors to weight gain as time
progressed. Gebregiorgis et al. (2011) affirmed that feeding moringa leaves to sheep
increased their body weight gain (P < 0.05) corresponding to increasing levels of
moringa leaves (300 g and 450 g), but not in the control group. Also, a research by
Asaolu et al. (2012) with West African Dwarf growing goats indicated that
supplementing with M. oleifera resulted in a significant weight gain compared to using
Gliricidia sepium and Leucaena leucocephala fodders.
Table 6.10: Result of regression analysis on factors influencing kids‘ body
weight (kg)
Model
Unstandardized Coefficients
Standardized
Coefficients
t Sig. B
Standard
Error Beta
(Constant) 4.87 0.45 10.847 0.000***
Dum level 10% 1.13 0.34 0.145 3.320 0.001***
Dum level 20% 1.30 0.34 0.167 3.812 0.000***
Dum level 30% 1.01 0.34 0.130 2.966 0.003***
Week1 0.44 0.56 0.038 0.781 0.435ns
Week2 1.37 0.56 0.117 2.424 0.016*
Week3 2.03 0.56 0.174 3.605 0.000***
Week4 3.03 0.56 0.260 5.381 0.000***
Week5 4.37 0.56 0.374 7.761 0.000***
Week6 5.10 0.56 0.437 9.048 0.000***
Week7 5.73 0.56 0.491 10.176 0.000***
Week8 6.62 0.56 0.567 11.756 0.000***
Week9 7.74 0.56 0.663 13.745 0.000***
Week10 8.78 0.56 0.752 15.592 0.000***
Dependent Variable: Kid weight; R-Square= 0.74; F-Statistic= 44.22; N= 214 & Durbin-Watson
Test = 1.25; ns = non-significant at 0.05; * = significant at 0.05; *** = extremely significant to ≤
0.001 alpha levels

186
Figure 6.7 shows a graphic presentation of the weekly kids‘ body weight gains. On
aggregate, kids gained weight linearly with time, which means that kids‘ body weight
gain was an addition per week although the increased weight gains were greater in some
weeks than others.
Figure 6.7: Overall average weekly growth in kids‘ body weight gain
Table 6.11 presents the Duncan Multiple Range tests of kids‘ weekly weight gains. It
contains nine mean homogenous subsets with levels of significant differences. The result
shows that all subsets were not significantly different (P > 0.05) in kids‘ weight gains
over time in weeks.

187
Table 6.11: Duncan‘s multiple range tests for weekly growth in kids‘ body weight
gains (kg)
Week N
Subset for alpha = 0.05
1 2 3 4 5 6 7 8 9
0 20 5.73
1 20 6.17 6.17
2 20 7.10 7.10
3 20 7.76 7.76
4 20 8.76
5 20 10.10
6 20 10.83 10.83
7 20 11.46 11.46
8 20 12.35 12.35
9 20 13.47 13.47
10 20 14.51
P-value 0.451ns 0.114ns 0.255ns 0.088ns 0.215ns 0.277ns 0.128ns 0.056ns 0.076ns
Means for groups in homogeneous subsets are displayed; uses Harmonic Mean Sample size = 20
Note: ns = non-significant at 0.05 alpha level
The descriptive statistics of weekly kids‘ weight gains is found in Table 6.12. The result
reveals that there was a continuous increase in weight gains among kids, as the mean
ranges from 5.73 kg to 14.51 kg (13.50 kg difference), just like the mean of 42.00 cm at
initial kids‘ heart girth to 48.55 cm (see Table 6.6) at the end of the research (6.55 cm
difference in heart girth), and mean of 38.80 cm kids‘ body length to 50.10 cm (see
Table 6.9) with a difference of 11.3 cm in body length, respectively.

188
Table 6.12: Descriptive statistics of weekly growth in kids‘ body weight gains (kg)
Week
N
Mean
Standard
Deviation
Standard
Error
95% Confidence
Interval for Mean
Minimum
Maximum
Lower
Bound
Upper
Bound
0.0 20 5.73 1.81 0.41 4.88 6.58 2.80 8.40
1.0 20 6.17 1.87 0.42 5.30 7.04 3.20 8.60
2.0 20 7.10 1.88 0.42 6.22 7.97 4.00 9.60
3.0 20 7.76 1.91 0.43 6.87 8.65 4.40 10.20
4.0 20 8.76 1.62 0.36 8.00 9.52 5.40 10.80
5.0 20 10.10 1.70 0.38 9.30 10.90 6.40 12.40
6.0 20 10.83 1.64 0.37 10.06 11.59 8.00 13.60
7.0 20 11.46 1.69 0.38 10.67 12.25 8.60 14.60
8.0 20 12.35 1.77 0.39 11.52 13.18 9.40 16.20
9.0 20 13.47 2.01 0.45 12.53 14.41 10.00 17.80
10.0 20 14.51 2.27 0.51 13.45 15.57 11.20 20.00
Total 220 9.84 3.36 0.23 9.39 10.29 2.80 20.00
6.4.5 Body Condition Scores of Kids
The average of kids‘ body condition scores (BCS) according to M. oleifera inclusion
levels are shown in Figure 6.8. The analysis of body condition scores indicates that 10%
M. oleifera inclusion level led to the highest BCS of 3.35 points, while 20% and 30%
had equal BCS of 3 point each, and the lowest among the kids BCS was the 0% (control)
with two 2.80 points. Just as the kids‘ heart girth, body length and body weight gain,
BCS were the least at 0% inclusion level. Body condition scores range from 1 to 5, with
0.5 increments and were assessed by visual observation and palpation method as
suggested by Frost et al. (2008). In the present study, the kids‘ BCS lie between 2.50 to
3.35 points. This suggests that most of the kids ranged from moderate to good body
condition scores as BCS of below 2 is considered thin (Mellado, 2002). These good BCS
of kids are an indirect indication that kids had sufficient milk from their mothers to
sustain proper early growth and development. Villaquiran et al. (2015) explained that in
most cases, healthy goats should have a BCS of 2.5 to 4.0. The BCS of 1.0, 1.5, or 2.0
indicate a management or health problem. A BCS of 4.5 or 5 is almost never observed in

189
goats under normal management conditions; however, it can sometimes be observed in
show goats. On the other hand, a BCS of 1 is extremely thin and 5 is considered as obese
or very over-conditioned (Mellado, 2002; Villaquiran et al., 2015).
Figure 6.8: Kids‘ average body condition scores at different M. oleifera inclusion
levels
Table 6.13 presents the result of a linear regression analysis of BCS of kids whose
mothers were fed M. oleifera over time (weeks) to observe the indirect effect on kids.
The result indicates that M. oleifera had significant effects (P < 0.05) on the BCS of kids
over time in weeks. The BCS were higher at the 30% inclusion level (450 g) compared
to 10% (150 g) and 20% (300 g) levels, respectively over time (weeks). This may be
attributed to the fact that as the kids grew, the demand for the quantity of milk increased
while the milk was still being produced at the same level; thus, leading to a negative
change in BCS.
2.80
3.35 3 3
2.7
2.75
2.8
2.85
2.9
2.95
3
3.05
0% 10% 20% 30%
Kid
s' B
CS
(p
oin
ts)
M. oleifera inclusion levels

190
Table 6.13: Result of regression analysis on factors influencing kids‘ body
condition scores
Model
Unstandardized Coefficients
Standardized
Coefficients
t Sig. B
Standard
Error Beta
(Constant) 2.47 0.08 29.30 0.000
Dum level 10% 0.13 0.06 0.12 2.00 0.047*
Dum level 20% 0.11 0.06 0.10 1.71 0.089ns
Dum level 30% 0.17 0.06 0.16 2.71 0.007***
Week1 0.38 0.11 0.24 3.55 0.000***
Week2 0.48 0.11 0.30 4.49 0.000***
Week3 -0.41 0.11 -0.27 -4.02 0.000***
Week4 0.30 0.11 0.19 2.84 0.005***
Week5 0.45 0.11 0.28 4.25 0.000***
Week6 0.61 0.11 0.39 5.91 0.000***
Week7 0.60 0.11 0.38 5.67 0.000***
Week8 0.45 0.11 0.28 4.25 0.000***
Week9 0.58 0.11 0.36 5.44 0.000***
Week10 0.78 0.11 0.49 7.33 0.000***
Dependent Variable: Kid BCS; R-Square = 0.50; F-Statistic = 16.01; N = 220 & Durbin-Watson
Test = 1.65 Note: ns = significant at 0.05; * = significant at 0.05; *** = extremely significant to ≤
0.001 alpha level
The aggregate mean plots of weekly kids‘ BCS are found in figure 6.9. Kids‘ BCS range
from 2.58 to 3.35 in this study, which means that most had between moderate to good
body conditions since below 2 is considered thin. Mellado (2002) stated that kids‘ BCS
of 3 to 3.50 points are considered moderate to good. In the present study, the kids‘ BCS
lies between 3 to 3.35 points except for the first few weeks when they were below 3
points.

191
Figure 6.9: Overall average weekly growth in kids‘ body condition scores
Table 6.14 presents the Duncan Multiple Comparison test analysis of kids‘ BCS over
time in weeks. The result reveals means for groups in 6 homogeneous subsets. All
subsets had no mean significant differences (P > 0.05) within kids‘ BCS. Although not
statistically significant, at first kids‘ BCS were changing weekly but as they grew bigger,
the BCS began dropping, causing subsets to have many weeks without differences. This
might be attributed to the demand for more milk and other sources of rations as the
mothers‘ milk was no longer meeting the demand. Table 6.15 presents descriptive
statistics of weekly kids‘ BCS. The mean ranges from 2.58 to 3.35, with a maximum
BCS of 4 among the kids.

192
Table 6.14: Duncan‘s multiple range tests for weekly growth in kids‘ body
condition scores
Week
N
Subset for alpha = 0.05
1 2 3 4 5 6
3.0 20 2.15
0.0 20 2.58
4.0 20 2.88
1.0 20 2.95 2.95
5.0 20 3.03 3.03 3.03
8.0 20 3.03 3.03 3.03
2.0 20 3.05 3.05 3.05
9.0 20 3.15 3.15 3.15
7.0 20 3.18 3.18 3.18
6.0 20 3.20 3.20
10.0 20 3.35
P-value --- 1.000ns 1.000ns 0.149ns 0.066ns 0.158ns 0.089ns
Means for groups in homogeneous subsets are displayed; uses Harmonic Mean Sample Size =
20. Note: ns = non-significant at 0.05 alpha level
Table 6.15: Descriptive statistics of weekly growth in kids‘ body condition
scores
Weeks
N
Mean
Standard
Deviation
Standard
Error
95% Confidence
Interval for Mean
Min.
Max.
Lower
Bound
Upper
Bound
0.0 20 2.58 0.54 0.12 2.32 2.83 1.50 3.0
1.0 20 2.95 0.22 0.05 2.85 3.06 2.00 3.00
2.0 20 3.05 0.22 0.05 2.95 3.16 3.00 4.00
3.0 20 2.15 0.24 0.05 2.04 2.26 2.00 2.50
4.0 20 2.88 0.22 0.05 2.77 2.98 2.50 3.00
5.0 20 3.03 0.20 0.04 2.93 3.12 2.50 3.50
6.0 20 3.20 0.25 0.06 3.08 3.32 3.00 3.50
7.0 20 3.18 0.29 0.07 3.04 3.31 2.50 3.50
8.0 20 3.03 0.47 0.11 2.80 3.25 2.00 3.50
9.0 20 3.15 0.46 0.10 2.93 3.37 2.00 3.50
10.0 20 3.35 0.37 0.08 3.18 3.52 2.50 4.00
Total 220 2.96 0.46 0.03 2.90 3.02 1.50 4.00
6.4.6 Growth Differences Between and Within Sex and Birth Types
Table 6.16 presents the average growth parameters of kids, which revealed that males
grew faster and bigger than females in heart girth, body length, body weight gain and
they even had better body condition scores. As per birth types, single males had the
highest average growth parameters (heart girth 54.24 cm, body length 48.72 cm and

193
body weight 13.07 kg), followed by twin males in girth (51.99 cm) and weight gains
(11.04 cm) but not length (44.31 cm). This confirms the findings by Lu (2002) who
stated that Boer goats‘ male kids have a higher body weight and post-weaning growth
rate under standardized conditions. Conversely, single females had greater length (45.67
cm) and body condition scores (3.18), while twin females had the lowest growth
parameters of all the groups. Individually, the heart girth ranges between 50 cm to 60
cm, length between 45 cm and 54 cm and weight between 11.20 kg and 20 kg. Weight
range in the present study is lower than what was estimated by Agra Professional
Services (2013) which reported that 100 day-old kids weigh between 25 kg to 32 kg.
The aggregate for birth types shows that singles grew bigger and faster than twins, even
though statistical analysis showed that twins had bigger parameters compared to singles
(Table 6.18).
Table 6.16: Average growth parameters of kids by birth type and sex
Birth
Sex
No. of kids
Heart girth
(cm)
Body length
(cm)
Body weight
(kg)
Body Condition
Scores (points)
Single Male 6 54.24 48.72 13.07 3.43
Single Female 6 49.98 45.67 10.84 3.18
Twin Male 5 51.99 44.31 11.04 2.73
Twin Female 3 50.74 43.69 9.45 2.47
Single Aggregate 12 52.11 47.19 11.96 3.90
Twin Aggregate 8 51.36 44.00 10.25 2.60
Table 6.17 presents a General Linear Model (GLM) Multivariate Pairwise Comparisons
of M. oleifera‘s effects on kids‘ heart girth, body length, body weight and BCS using a
least significant difference (LSD) post hoc analysis with weeks as covariate on the male
and female kids. There were significant differences (P < 0.01) between male kids and
female kids in all growth parameters (heart girth, body length, body weight gains) as

194
well as BCS over time regardless of the M. oleifera levels. This implies that the growth
parameters of male kids measured in this study were better than that of the female kids
although their mothers were fed with equal levels of M. oleifera.
Table 6.17: Pairwise comparisons of M. oleifera effect on kids‘ growth
parameters by sex
Dependent
Variable
(I) Sex
(J) Sex
Mean
Difference
(I-J)
Standard
Error
Sig.c
95% Confidence
Interval for
Differencec
Lower
Bound
Upper
Bound
Kid girth
Female Male -3.07***
0.39 0.000 -3.84 -2.31
Male Female 3.07***
0.39 0.000 2.31 3.84
Kid length
Female Male -2.28***
0.37 0.000 -3.012 -1.54
Male Female 2.28***
0.37 0.000 1.54 3.01
Kid weight
Female Male -2.20***
0.30 0.000 -2.59 -1.81
Male Female 2.20***
0.20 0.000 1.81 2.59
Kid BCS
Female Male -0.12***
0.04 0.006 -0.20 -0.04
Male Female 0.12***
0.04 0.006 0.04 0.20
Based on estimated marginal means
***. The mean difference is significant to ≤ 0.001 levels.
a. Weighted Least Squares Regression - Weighted by MOL consumed
c. Adjustment for multiple comparisons: Least Significant Difference (equivalent to no
adjustments).
Table 6.18 presents GLM Multivariate Pairwise Comparisons of M. oleifera effects on
kids‘ heart girth, length, weight and BCS using a least significant difference (LSD) post
hoc analysis with weeks as covariate on birth-types (single and twin birth) of kids over
time in weeks. The LSD multiple comparisons results indicate that the growth
parameters were significantly different (P < 0.01) by birth-types; that is, between single
and twin births. These differences might be attributed to the fact that singles were born
bigger and heavier and suckled their mothers alone no matter how much milk they
produced, while twins were smaller and lighter and had to share the milk produced by
their mothers. This offers chances for single kids to grow faster and bigger than twins.
Zhang et al. (2008) concurred that singles have the heaviest birth weight and larger body

195
size. Although in this study, the result indicated that twins had greater growth parameter
values than single births contrary to the expectation, this could be supported by the fact
that males grow faster and bigger than females. This was pointed out in this study where
there were more twin males than twin females and single births.
Table 6.18: Pairwise comparisons of M. oleifera effect on kids growth
parameters by birth type
Dependent
Variable
(I) birth
type
(J) birth
type
Mean
Difference
(I-J)
Standard
Error
Sig.c
95% Confidence
Interval for
Differencec
Lower
Bound
Upper
Bound
Kid girth Single Twins -1.81
*** 0.39 0.000 -2.56 -1.05
Twins Single 1.81***
0.39 0.000 1.05 2.56
Kid length Single Twins -1.48
*** 0.37 0.000 -2.22 -0.75
Twins Single 1.48***
0.37 0.000 0.75 2.22
Kid weight Single Twins -0.52
*** 0.20 0.009 -0.91 -0.13
Twins Single 0.52***
0.20 0.009 0.13 0.91
Kid BCS Single Twins 0.11
*** 0.04 0.007 0.03 0.20
Twins Single -0.11***
0.04 0.007 -0.20 -0.03
Based on estimated marginal means
***. The mean difference is highly significant to ≤ 0.001 level.
a. Weighted Least Squares Regression - Weighted by MOL consumed
c. Adjustment for multiple comparisons: Least Significant Difference (equivalent to no
adjustments).
The results of this study to a large extent revealed that a M. oleifera leaf-supplemented
diet for lactating does had a positive effect on their pre-weaning kids‘ growth in heart
girth, body length, and body weight gain as growth parameters as well as their body
conditions. The growth effects were observed at all inclusion levels of M. oleifera leaf-
supplemented diet. This subsequently resulted into the failure to accept the hypothesis
(H05) that feeding M. oleifera as a supplement to lactating goats does not affect the
growth parameters of their pre-weaning kids, because there was a significant effect on
all growth parameters as well as BCS of pre-weaning kids.

196
6.5 Conclusion
The supplementation of M. oleifera to lactating Boer does at all three different inclusion
levels had positive indirect effect on all growth parameters of their kids which included
heart girth, body length and weight as well as body condition scores. The indirect effect
of M. oleifera on kids‘ growth parameters was based on the feeding of M. oleifera leaf-
supplemented diets to lactating does whose kids indirectly benefited through the
suckling of the amount of milk produced by their mothers since M. oleifera is believed
to increase milk production due to its nutritional quality. All growth parameters were all
statistically significant (P < 0.05). Although Boer goats are known for their fast growth
under favourable conditions, feed supplementation of pregnant and lactating does could
be advantageous for maximum milk production to support their kids‘ healthy early
growth and development especially under unfavourable conditions such as during winter
and drought. This study was done under severe drought conditions after the 2015 winter
season, demonstrating that in a semi-arid, dry, and drought-persistent country like
Namibia, M. oleifera would be a possible solution for animal supplementation during
drought and winter periods. The study shows that M. oleifera grows very fast and
produces more leaf-dry matter per hectare, thus alleviating farmer‘s stress of purchasing
feed-supplement during pregnancy and lactation period. This was demonstrated by the
present study where M. oleifera leaf-supplemented diet of lactating Boer goats had
positive effect on growth parameters (girth, length and weight) of their kids as well as
their BCS. Finally, growth increment was more evident at 10% (150 g) and 20% (300 g)
dry M. oleifera leaf-inclusion levels compared to 30% (450 g), which means that a daily
ration of 150 g or 300 g of M. oleifera leaf-supplemented diets are recommended for
each lactating goat.

197
References
Abdulrazak, A., Nyangaga, J., & Fujihara, T. (2001). Relative palatability to sheep of
some browse species, their in sacco degradability and in vitro gas production
characteristics. Asian-Aust. J.Anim. Sci., 14(11), 1580–1584.
Adegun, M., Aye, P., & Dairo, F. (2011). Evaluation of Moringa oleifera, Gliricidia
sepium and Leucaena leucocephala - based multinutrient blocks as feed
supplements for sheep in South West Nigeria. Agriculture and Biology Journal
of North America, 2(11), 1395–1401. https://doi.org/10.5251
Agra Professional Services. (2013). Namibia livestock catalogue. Windhoek, Namibia:
Ministry of Agriculture, Water and Forestry.
Akinbamijo, O., Adediran, S., Nouala, S., & Saecker, J. (n.d.). Moringa fodder in
ruminant nutrition in The Gambia. Moringa News, 5.
Asaolu, V., Binuomote, R., Akinlade, J., Aderinola, O., & Oyelami, O. (2012). Intake
and growth performance of West African Dwarf goats fed Moringa oleifera,
Gliricidia sepium and Leucaena leucocephala dried leaves as supplements to
cassava peels. Journal of Biology, Agriculture and Healthcare, 2(10). Retrieved
from www.iiste.org
Beukes, A. (2017, March 15). Vegetation of Neudamm Experimental Farm.
Beukes, P. (2017). Average annual rainfall of Neudamm Experimental Farm from 1974
to 2016 (Meteorological) (pp. 1–2). Namibia: University of Namibia.
Bey, H. (2010). All things moringa: the story of an amazing tree of life.
http://www.allthingsmoringa.com/eBook.pdf, 1–40.
BGBSN. (2008, June). The ennobled: Boer goat of Namibia. Boer Goat Breeders‘
Society of Namibia.

198
Coffey, L. (2006). Meat goats: Sustainable production. ATTRA. Retrieved from
www.attra.ncat.org
Edward, E., Chamshama, S., Ngaga, Y., & Mndolwa, M. (2014). Survival, growth and
biomass production of Moringa oleifera provenances at Gairo inland plateau and
Ruvu Coastal Region in Tanzania. African Journal of Plant Science, 8(1), 54–64.
Foidl, N., Makkar, H., & Becker, K. (2011). The potential of Moringa oleifera for
agricultural and industrial uses. Retrieved from
http://www.empaeg.com/UserFiles/File19947.pdf
Frost, R., Launchbaugh, K., & Taylor, C. (2008). Age and body condition of goats
influence consumption of Juniper and Monopene-treated feed. Allen Press
Publishing Services for Society for Rangeland Management, 16(1), 48–54.
Gebregiorgis, F., Negesse, T., & Nurfeta, A. (2011). Feed intake and utilization in sheep
fed graded levels of dried moringa (Moringa stenopetala) leaf as a supplement to
Rhodes grass hay. Trop Anim Health Prod in Springer Science, 44, 511–517.
https://doi.org/10.1007/s11250-011-9927-9
Huque, K., & Sarker, N. (2014). Feeds and feeding of livestock in Bangladesh:
performance, constraints and options forward. Bangladesh Journal of Animal,
43(1), 1–10.
Huston, J., & Hart, S. (2002). Goat husbandry/feeding management. USA: Elsevier
Science Ltd.
Jain, P., Singh, S., Singh, S., Verma, S., Kharva, M., & Solanki, S. (2013). Anthelmintic
potential of herbal drugs. International Journal of Research and Development in
Pharmacy and Life Sciences, 2(3), 412–427.

199
Juhnke, J. (2011, January 10). Effects of tannin containing feed on Haemonchous
contortus in sheep and its behavioral implications (Master of Science Degree).
Utah State University. Retrieved from http://digitalcommons.usu.edu/etd/1058
Kahumba, A. (2010, November). Comparison of the rehabilitative effects of mechanical
and chemical methods of bush control on degraded Highland Savanna
rangelands in Namibia. University of Namibia, Windhoek, Namibia.
Kapu, N. (2012). Assessment of rangeland condition and evaluation of the nutritional
value of common grass and browse species at the Neudamm Experimental Farm,
Namibia. University of Namibia, Windhoek, Namibia. Retrieved from
www.unam.na
Lu, C. (2002). Boer goat production: progress and perspective. University of Hawai’i.
Retrieved from http://hilo.hawaii.edu/uhh/vcaa/documents/BoerGoatProduction
ProgressandPerspective2002.pdf
Mellado, M. (2002). Reproductive management. Elsevier Science Ltd., 1253–1258.
Mendieta, B., Reyes, N., & Rodriquez, R. (2007, June 25). Successful experiences of on
the use of Moringa oleifera in animal feeding. Retrieved from
http://redmarango.una.edu.ni/
documentos/20-Bryan-Moringa-pres-Vietnam-final-version.pdf
Mpofu, I. (2004). Applied animal feed science and technology. (L. Mutewa & C.
Vengesai, Eds.). Upfront Publishing Ltd., Leicestershire.
Olatunji-Akioye, A., & Adeyemo, O. (2009). Liveweight and Chest Girth Correlation in
Commercial Sheep and Goat Herds in Southwestern Nigeria. Int. J. Morphol.,
27(1), 49–52.
Prince, M. (2007). ECHO Technical Note: The moringa tree, 1–19.

200
Pulina, G., Avondo, M., Molle, G., Francesconi, A., Atzori, A., & Cannas, A. (2013).
Models for estimating feed intake in small ruminants. Revista Brasileira de
Zootecnia, 42(9), 675–690.
Radovich, T. (2007). Farm and forestry production and marketing profile for Moringa
oleifera. WSTERN AND PAR. https://doi.org/47001-03798
Rumosa Gwaze, F., Chimonyo, M., & Dzama, K. (2012). Effect of season and age on
blood minerals, liver enzyme levels, and faecal egg counts in Nguni goats of
South Africa. Czech Journal of Animal Science, 57, 443–453.
Sanchez, N., Sporndly, E., & Ledin, I. (2005). Effect of feeding different levels of
foliage of Moringa oleifera to creole dairy cows on intake, digestibility, milk
production and composition. Elsevier.
https://doi.org/10.1016/j.livprodsci.2005.09.010
Sánchez-Machado, D., Núñez-Gastélum, J., Reyes-Moreno, C., Ramírez-Wong, B., &
López-Cervantes, J. (2009). Nutritional quality of edible parts of Moringa
oleifera. Food Anal. Methods, 3, 175–180. https://doi.org/10.1007/s12161-009-
9106-z
Sarwatt, S., Kapange, S., & Kakengi, A. (2002). Substituting sunflower seed-cake with
Moringa oleifera leaves as a supplemental goat feed in Tanzania. Kuwer
Academic Publishers, Netherland, 56, 241–247.
Soliva, C., Kreuzer, M., Foidl, G., Machmuller, A., & Hess, H. (2005). Feeding value of
whole and extracted Moringa oleifera leaves for ruminants and their effects on
ruminal fermentation in vitro. Animal Feed Science and Technology, 118, 47–62.
https://doi.org/10.1016/j.anifeedsci.2004.10.005

201
United Caribbean Trust. (2013). Moringa: an alternative animal feed. United Caribbean.
Retrieved from www.unitedCaribbean.com
University of Namibia. (2011). Neudamm Agricultural College Farm. University of
Namibia. Retrieved from http://digital.unam.na/handle/11070.1/4461?show=full
Villaquiran, M., Gipson, T., Merkel, R., Goetsch, A., & Sahlu, T. (2015). Body
condition scores in goats. ResearchGate. Retrieved from
http://www.researchgate.net/publication/264889567
Yayneshet, T., Eik, L., & Moe, R. (2008). Feeding Acacia etbaica and Dichrostachys
cinerea fruits to smallholder goats in northern Ethiopia improves their
performance during the dry season. Elsevier on Science Direct, 119, 31–41.
Zhang, C., Yang, L., & Shen, Z. (2008). Variance components and genetic parameters
for weight and size at birth in the Boer goat. Journal of Livestock Science, 115,
73–79.

202
Chapter 7
Conclusions and Recommendations
This chapter presents conclusions and recommendations of the five experimental
chapters, which are chapters 2 to 6 that have been discussed and concluded sequentially.
Since chapter 1 is an introductory chapter of the study it has no conclusion, neither does
it have recommendations.
7.1 Conclusions
Based on the findings from this study, the following conclusions have been drawn
according to the sequence of chapters:
7.1.1 Chapter 2 Conclusion
In this study, the Moringa oleifera seeds used had a poor emergence in the nursery
compared to Moringa ovalifolia seeds. However, M. oleifera seedlings had faster growth
than M. ovalifolia which grew at a slower pace over time. Thinned and transplanted
seedlings of both M. oleifera and M. ovalifolia had high EoE and low mortality rates.
Based on its fast growth, M. oleifera cultivation can be encouraged in Namibia, which is
predominantly semi-arid. In addition, M. oleifera, being a ―never-die‖ tree, has the
ability to withstand drought and water shortages that are frequent in Namibia. Moringa
ovalifolia cultivation should be encouraged since it is indigenous to Namibia and has the
ability to grow in the wild and endure on its own with little care. Ecologically, it will
have an edge of endurance due to its adaptability to this region, compared to M. oleifera
which is exotic to Namibia. The major challenge to the cultivation of M. oleifera in

203
Namibia is frost susceptibility. Nevertheless, the cultivation of both Moringa species is
of paramount importance to the Namibian dry environmental conditions.
7.1.2 Chapter 3 Conclusion
Moringa oleifera and M. ovalifolia have the ability to grow, endure and yield under
harsh conditions at the field level. Moringa oleifera reaches maximum heights within
four to five months, while M. ovalifolia takes longer to develop into a fully grown tree.
Both species need little water to grow and survive, which makes them suitable for an
arid and semi-arid climates found in Namibia. Moringa oleifera had an EoE of 97.50%
and M. ovalifolia of 71.63% in the 2015/2016 summer season. They can both yield
considerable amount of leaf-dry matter each summer season that may be used as a feed
supplement. Moringa oleifera had maximum yields of 379.36 kg/ha and 268.53 kg/ha
for 2015/2016 and 2014/2016, while M. ovalifolia‘s maximum yields were 94.67 kg/ha
and 76.81 for 2014/2014 and 2015/2016 seasons. Therefore, M. oleifera, especially and
M. ovalifolia are possible alternative trees that can be planted to improve rangeland
productivity in terms of fodder.
7.1.3 Chapter 4 Conclusion
Moringa plant species are nutritious and contain almost all the essential nutrients needed
by livestock for growth and development. An increase in moringa production and use
would improve food security and minimize malnutrition, especially in third-world
countries. Although there is a human-livestock conflict in the use of moringa, if adopted
by livestock farmers, both M. oleifera and M. ovalifolia have the potential to eliminate
the purchasing of animal feed supplements and to enhance livestock production, since it

204
will be readily available on the farm for supplementation during low-nutrient periods of
rangelands. Therefore, the cultivation of moringa as a nutrient-rich plant species should
be encouraged along with their uses as livestock feed for improved productivity.
7.1.4 Chapter 5 Conclusion
This study revealed that M. oleifera has the ability to reduce to a large extent
gastrointestinal parasite (GIP) loads in Boer goats in comparison to the conventional
ecomectin drug. Moringa oleifera leaf-supplemented diet significantly reduced
trichostrongyles-type eggs, coccidia oocyst, Trichuris species, Moniezia species eggs
and to a lesser extent Strongyloides species in goats. Goats like M. oleifera leaves, and
feeding them to these animals would cause no difficulty. Although M. oleifera is exotic
to Namibia and unfamiliar to animals at large, its leaves were easily adopted by the
goats. Feeding about 300 g (20%) and 450 g (30%) to goats would serve as an
anthelmintic remedy. Moringa oleifera, being in high demand for both human and
animal consumption needs, it should be used carefully and just for the purpose set forth
in this study. Finally, M. oleifera would serve as a good natural remedy and supplement
for goats in the fight against gastrointestinal helminths, especially since they have
developed resistance to many commercial anthelmintics over the years.
7.1.5 Chapter 6 Conclusion
The supplementation of M. oleifera to lactating Boer does at all 3 different levels had a
positive effect on all considered growth parameters of their kids which included girth,
length and body weight as well as body condition scores. Although Boer goats are
known for their fast growth under favourable conditions, feed supplementation of

205
pregnant and lactating does could be advantageous for proper milk production to support
their kids‘ early growth and development, especially under unfavourable conditions such
as during winter and drought. Therefore, in a drought-persistent country like Namibia,
M. oleifera would serve as a possible solution for animal supplementation during
drought and winter periods since it grows very fast and produces high biomass per
hectare. Thus, it would be effective in alleviating the farmer‘s stress of purchasing
supplements during their does‘ pregnancy and lactation periods. This was demonstrated
by the present study where a M. oleifera leaf-supplemented diet of lactating Boer goat
does had a positive effect on growth parameters (girth, length and weight) of their kids.
Finally, growth increment was more evident at 10% (150 g) and 20% (300 g) dry M.
oleifera leaf-inclusion levels compared to 30% (450 g), which means that a daily ration
of 150 g or 300 g of M. oleifera leaf-supplemented diets are recommended for each
lactating goat.

206
7.2 Recommendations
Based on the findings from this study, the following recommendations are put forward
according to the sequence of chapters:
7.2.1 Chapter 2 Recommendations
Moringa oleifera and M. ovalifolia seeds should be sown and grown in the nursery
before being transplanted in the field under these harsh Namibian environmental
conditions. It is easy to care for emerged seedlings in the nursery because they can be
moved from one location to another based on weather circumstances. In addition, pests
can also be controlled easily in the nursery. These favourable conditions in the nursery
prevent the mortality of seedlings and gradually adapt to the environmental challenges
within 1-2 months at which time they are ready for transplanting in the field. When
doing so, farmers should always prepare a nursery and grow moringa seedlings before
transplanting in the field.
7.2.2 Chapter 3 Recommendations
Moringa oleifera, as a drought resistant tree, should be used to improve rangeland
conditions since it has the ability to produce a large quantity of leaf-dry matter per
hectare. When established in two to three years, they need less water (once fortnightly)
to endure and, most importantly, endure well under the Namibian winter conditions. On
the other hand, M. ovalifolia, although it produced less leaf-dry matter than M. oleifera,
it is resistant to many insects and endures better in its native environment. As a result,
farmers should be encouraged to cultivate both M. oleifera and M. ovalifolia trees on
their farms and homesteads for use as supplements. Further research is recommended on
207
the LSB heights, EoE and leaf-dry-matter yield of both Moringa species especially in
the central Namibian climate since the trees were young during this study period.
7.2.3 Chapter 4 Recommendations
Moringa oleifera and M. ovalifolia contain almost equal quantities of nutrients and may
be used for similar purposes. The nutritional components of M. oleifera and M.
ovalifolia are very high, thus, making them suitable fodder crops in an environment that
is prone to drought and cold winters when the grasses in the rangelands are poor in
nutrient contents. Thus, moringa trees can be recommended as a good alternative feed
supplement likely to improve the livestock sector in Namibia, since they contain a
substantial amount of needed nutrients.
7.2.4 Chapter 5 Recommendations
The leaves of M. oleifera can be recommended to use as a medicinal supplement for
livestock since it has medicinal properties against many maladies. Indeed, research
findings showed that M. oleifera has anthelmintic substances that reduced helminth
loads in Boer goats. Therefore, taking into consideration the high prevalence of
helminths among livestock, the overuse of conventional anthelmintic drugs and the
development of resistance to such drugs, M. oleifera could serve as a natural
anthelmintic as well as a remedy for other livestock diseases. This could subsequently
enhance livestock productivity for communal farmers who cannot afford to purchase
drugs for their animals, and could save extra money for those farmers who could afford
to purchase them.

208
7.2.5 Chapter 6 Recommendations
Moringa oleifera could be used as supplement for livestock since it contains almost all
the essential nutrients needed for growth and development. Moringa oleifera leaves
must be harvested, stored and used as a supplement during critical stages like pregnancy
and lactation, when does‘ demand for quality feed is high. With the supplementation of
M. oleifera to livestock, lactating animals can maintain good body condition scores
throughout the lactation period. This will minimize the purchasing of feed supplements
for livestock and save farmers extra expense. Henceforth, the livelihoods of farmers will
improve since the money that would have been used for purchasing supplements for
livestock will be diverted to other basic needs.