Culebra Town Center For Lease · REOC San Antonio is a licensed Real Estate broker in the State of...
17
210 524 4000 8023 Vantage Drive, Suite 1200 San Antonio TX 78230 reocsanantonio.com SAN ANTONIO RE OC Culebra Town Center 7519-7551 Culebra Rd & 7592-7596 Ingram Rd, San Antonio, TX 78251 For Lease Hans G. Rohl Commercial Property Specialist Direct Line 210 524 1362 [email protected] Kimberly S. Gatley Senior Vice President Direct Line 210 524 1320 [email protected]
Transcript of Culebra Town Center For Lease · REOC San Antonio is a licensed Real Estate broker in the State of...
210 524 40008023 Vantage Drive, Suite 1200
San Antonio TX 78230reocsanantonio.comSAN ANTONIO
R E O C
Culebra Town Center7519-7551 Culebra Rd & 7592-7596 Ingram Rd, San Antonio, TX 78251
For Lease
Hans G. RohlCommercial Property SpecialistDirect Line 210 524 [email protected]
Kimberly S. GatleySenior Vice PresidentDirect Line 210 524 [email protected]
Hans G. RohlCommercial Property SpecialistDirect Line 210 524 [email protected]
Kimberly S. GatleySenior Vice PresidentDirect Line 210 524 [email protected]
210 524 4000
SAN ANTONIOR E O C Table of Contents
© 2016 REOC San Antonio. REOC San Antonio is a licensed Real Estate broker in the State of Texas operating under REOC General Partner, LLC. The information contained herein is deemed accurate as it has been reported to us by reliable sources. As such, we can make no warranty or representation as to the accuracy or completeness thereof. Further, the property is presented subject to availability, change in price or terms, prior sale or lease, or withdrawal from the market.
SECTION 1 Maps & Aerials
SECTION 2 Site Plan
SECTION 3 Property Summary
SECTION 4 Quote Sheet
SECTION 5 San Antonio Overview
SECTION 6 Market Snapshot
SECTION 7 Demographics
SECTION 8 TREC Agency Disclosure
Hans G. RohlCommercial Property SpecialistDirect Line 210 524 [email protected]
Kimberly S. GatleySenior Vice PresidentDirect Line 210 524 [email protected]
210 524 4000
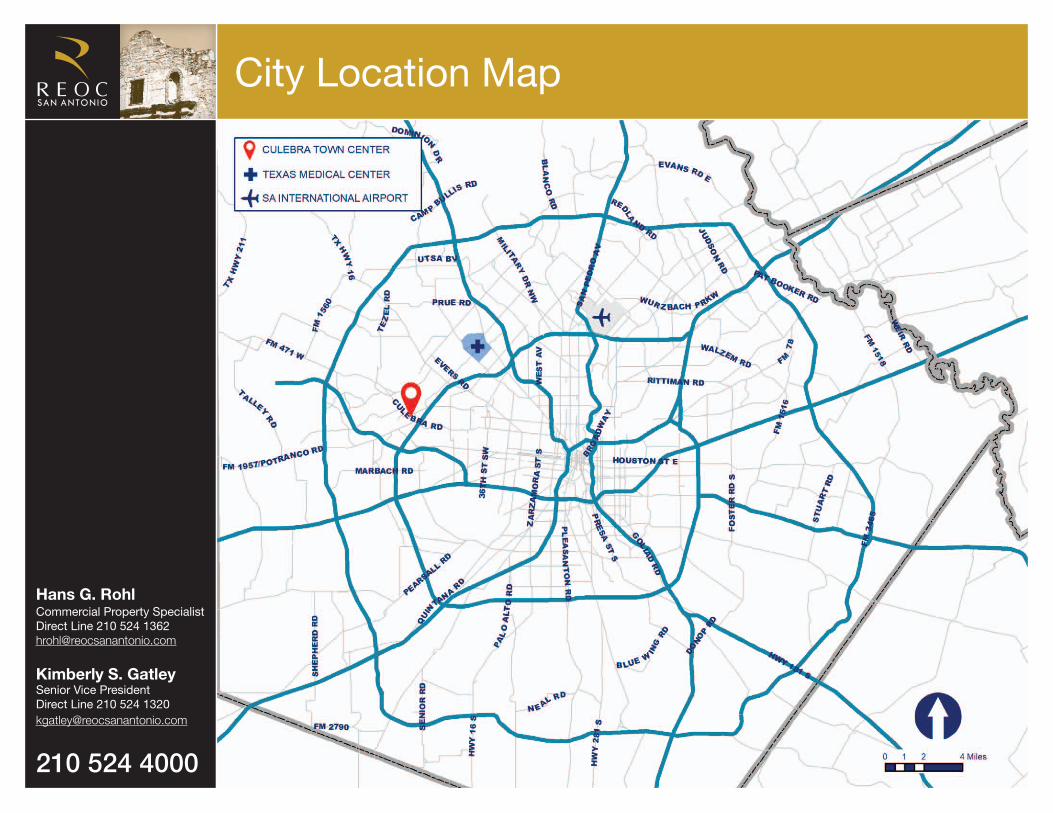
SAN ANTONIOR E O C City Location Map
Hans G. RohlCommercial Property SpecialistDirect Line 210 524 [email protected]
Kimberly S. GatleySenior Vice PresidentDirect Line 210 524 [email protected]
210 524 4000
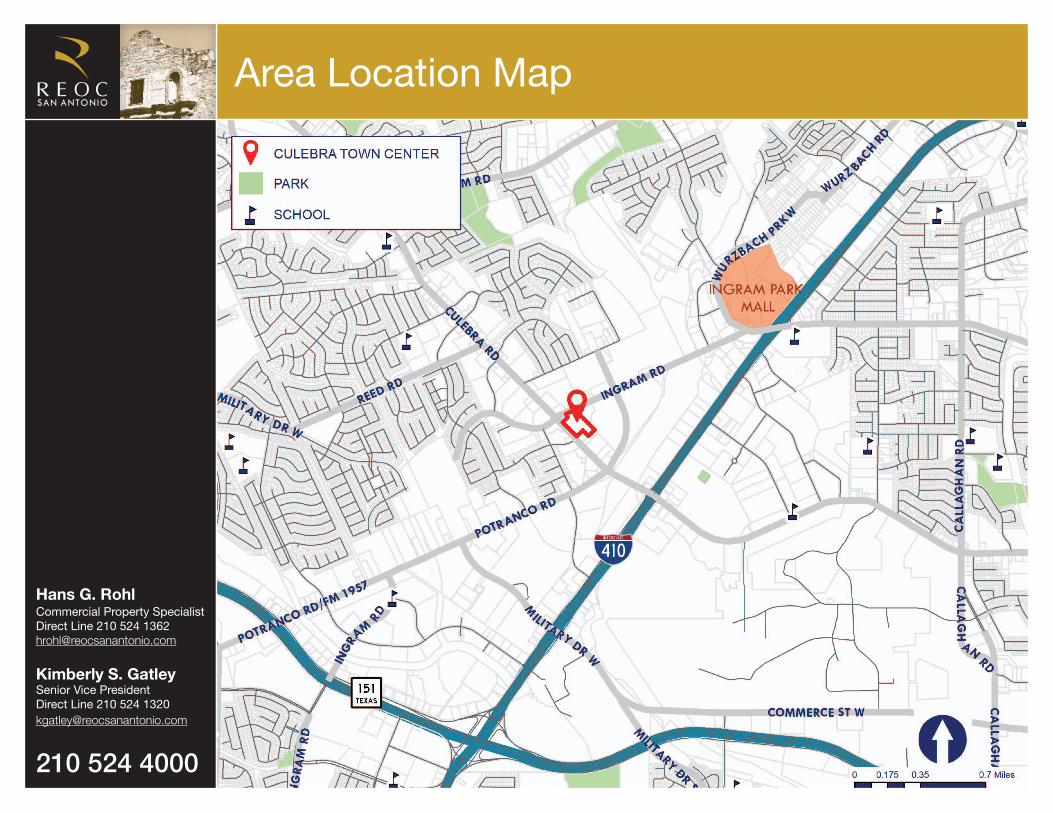
SAN ANTONIOR E O C Area Location Map
Hans G. RohlCommercial Property SpecialistDirect Line 210 524 [email protected]
Kimberly S. GatleySenior Vice PresidentDirect Line 210 524 [email protected]
210 524 4000
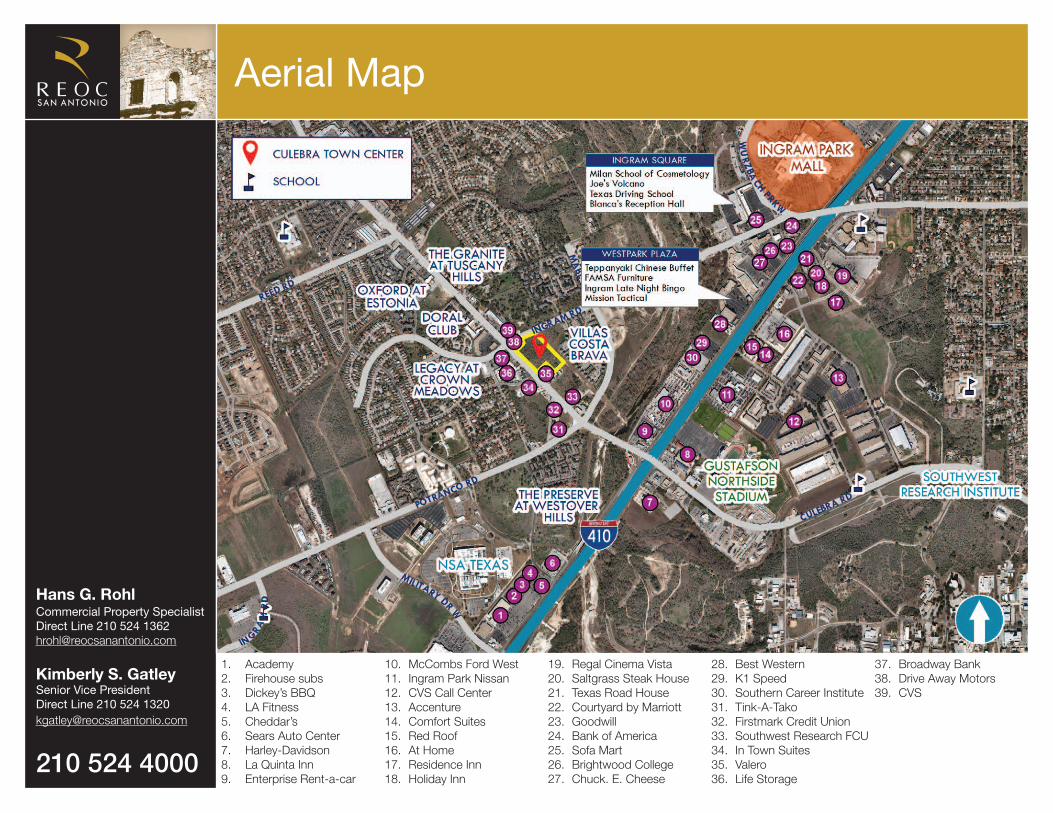
SAN ANTONIOR E O C Aerial Map
1. Academy 2. Firehouse subs 3. Dickey’s BBQ4. LA Fitness 5. Cheddar’s 6. Sears Auto Center 7. Harley-Davidson 8. La Quinta Inn9. Enterprise Rent-a-car
10. McCombs Ford West 11. Ingram Park Nissan 12. CVS Call Center 13. Accenture 14. Comfort Suites 15. Red Roof 16. At Home 17. Residence Inn18. Holiday Inn
19. Regal Cinema Vista20. Saltgrass Steak House21. Texas Road House 22. Courtyard by Marriott23. Goodwill24. Bank of America 25. Sofa Mart 26. Brightwood College 27. Chuck. E. Cheese
28. Best Western 29. K1 Speed30. Southern Career Institute 31. Tink-A-Tako 32. Firstmark Credit Union33. Southwest Research FCU 34. In Town Suites 35. Valero 36. Life Storage
37. Broadway Bank38. Drive Away Motors 39. CVS
Hans G. RohlCommercial Property SpecialistDirect Line 210 524 [email protected]
Kimberly S. GatleySenior Vice PresidentDirect Line 210 524 [email protected]
210 524 4000
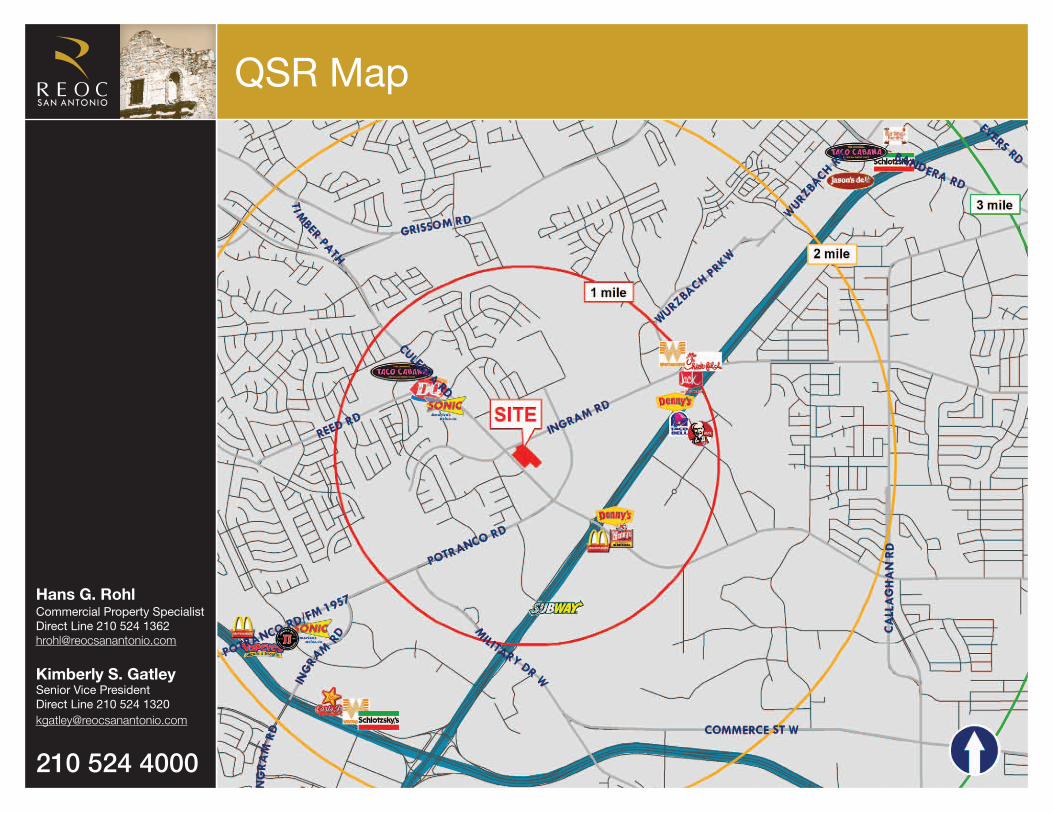
SAN ANTONIOR E O C QSR Map
Hans G. RohlCommercial Property SpecialistDirect Line 210 524 [email protected]
Kimberly S. GatleySenior Vice PresidentDirect Line 210 524 [email protected]
210 524 4000
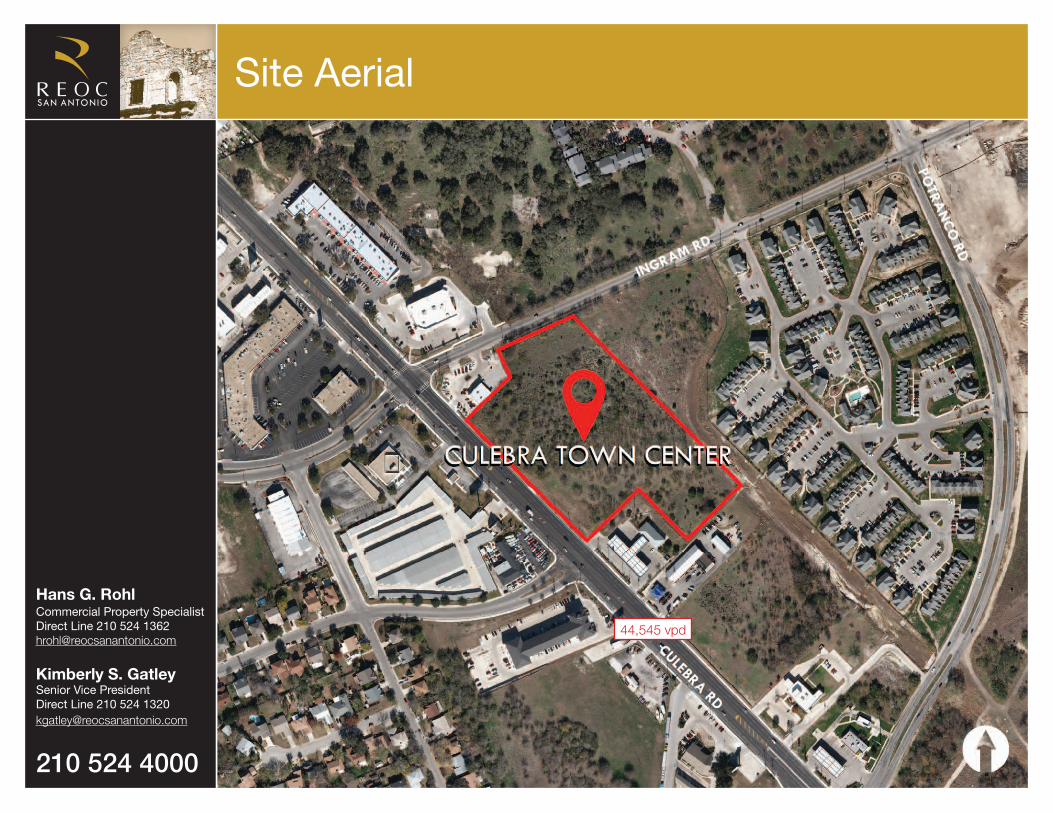
SAN ANTONIOR E O C Site Aerial
44,545 vpd

Hans G. RohlCommercial Property SpecialistDirect Line 210 524 [email protected]
Kimberly S. GatleySenior Vice PresidentDirect Line 210 524 [email protected]
210 524 4000
SAN ANTONIOR E O C Site Plan
Hans G. RohlCommercial Property SpecialistDirect Line 210 524 [email protected]
Kimberly S. GatleySenior Vice PresidentDirect Line 210 524 [email protected]
210 524 4000
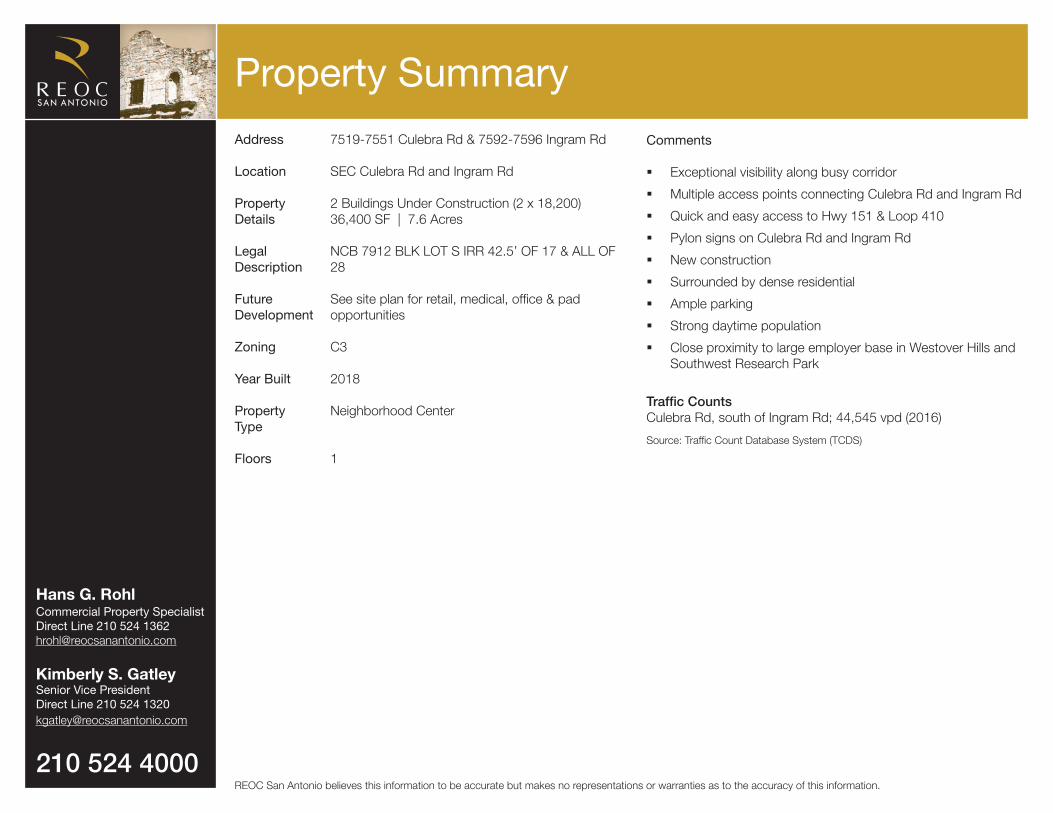
SAN ANTONIOR E O C Property Summary
Address 7519-7551 Culebra Rd & 7592-7596 Ingram Rd
Location SEC Culebra Rd and Ingram Rd
Property 2 Buildings Under Construction (2 x 18,200)Details 36,400 SF | 7.6 Acres
Legal NCB 7912 BLK LOT S IRR 42.5’ OF 17 & ALL OFDescription 28
Future See site plan for retail, medical, office & pad Development opportunities
Zoning C3
Year Built 2018
Property Neighborhood CenterType
Floors 1
REOC San Antonio believes this information to be accurate but makes no representations or warranties as to the accuracy of this information.
Comments
� Exceptional visibility along busy corridor
� Multiple access points connecting Culebra Rd and Ingram Rd
� Quick and easy access to Hwy 151 & Loop 410
� Pylon signs on Culebra Rd and Ingram Rd
� New construction
� Surrounded by dense residential
� Ample parking
� Strong daytime population
� Close proximity to large employer base in Westover Hills and Southwest Research Park
Traffic CountsCulebra Rd, south of Ingram Rd; 44,545 vpd (2016)
Source: Traffic Count Database System (TCDS)
Hans G. RohlCommercial Property SpecialistDirect Line 210 524 [email protected]
Kimberly S. GatleySenior Vice PresidentDirect Line 210 524 [email protected]
210 524 4000
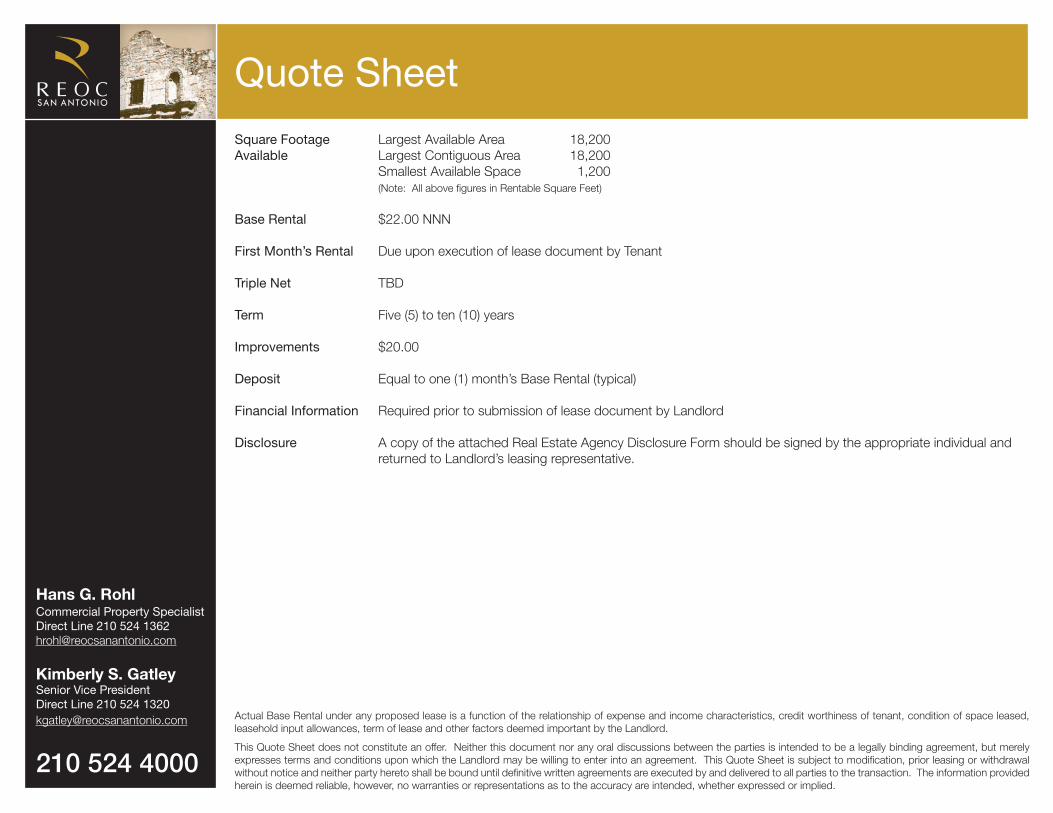
SAN ANTONIOR E O C Quote Sheet
Actual Base Rental under any proposed lease is a function of the relationship of expense and income characteristics, credit worthiness of tenant, condition of space leased, leasehold input allowances, term of lease and other factors deemed important by the Landlord.
This Quote Sheet does not constitute an offer. Neither this document nor any oral discussions between the parties is intended to be a legally binding agreement, but merely expresses terms and conditions upon which the Landlord may be willing to enter into an agreement. This Quote Sheet is subject to modification, prior leasing or withdrawal without notice and neither party hereto shall be bound until definitive written agreements are executed by and delivered to all parties to the transaction. The information provided herein is deemed reliable, however, no warranties or representations as to the accuracy are intended, whether expressed or implied.
Square Footage Largest Available Area 18,200Available Largest Contiguous Area 18,200 Smallest Available Space 1,200 (Note: All above figures in Rentable Square Feet)
Base Rental $22.00 NNN
First Month’s Rental Due upon execution of lease document by Tenant
Triple Net TBD
Term Five (5) to ten (10) years
Improvements $20.00
Deposit Equal to one (1) month’s Base Rental (typical)
Financial Information Required prior to submission of lease document by Landlord
Disclosure A copy of the attached Real Estate Agency Disclosure Form should be signed by the appropriate individual and returned to Landlord’s leasing representative.

Hans G. RohlCommercial Property SpecialistDirect Line 210 524 [email protected]
Kimberly S. GatleySenior Vice PresidentDirect Line 210 524 [email protected]
210 524 4000
SAN ANTONIOR E O C San Antonio Overview
Largest U.S. Cities
1 New York2 Los Angeles3 Chicago4 Houston5 Philadelphia6 Phoenix7 San Antonio8 San Diego9 Dallas10 San Jose
Ethnicity
Black Alone
American Indian Alone
Asian Alone
Some Other Race Alone
Two or More Races
White Alone
74.2%7%
0.8%
12%
3.5%
2.3%
Hispanic Origin (Any Race)
Non-Hispanic
45%
55%
San Antonio-New Braunfels Metro Area
Pop
ulat
ion
Med
ian
Age
Tota
l Hou
seho
lds
Avg
. Hou
seho
ld In
com
e
Med
ian
Hou
seho
ld In
com
e
Per
Cap
ita In
com
e
1,711,703
2,142,508
2,392,282
2,632,711
2000 Census
2010 Census
2016 Estimate
2021 Projection
32.9
34.1
35.0
35.8
601,265
763,022
846,066
928,458
$51,426
$62,458
$74,515
$80,710
2000 Census
2010 Census
2016 Estimate
2021 Projection
$39,029
$50,146
$54,186
$59,097
$18,443
$22,135
$26,902
$28,962
Sources: U.S. Census; ESRI 2015 Estimates; U.S. Census Bureau 2010, ESRI forecasts for 2015 & 2020; Fortune 2015 Rankings
Austin80 miles
Dallas280 miles
Houston200 miles
Corpus Christi145 miles
Laredo/Nvo. Laredo 150 miles
Mexico City900 miles
San Antonio
Located in South Central Texas within Bexar County, San Antonio occupies approximately 504 square miles. Situated about 140 miles north of the Gulf of Mexico where the Gulf Coastal Plain and Texas Hill Country meet.
Major Industries
In Billions
$0 $5 $10 $15 $20 $25 $30
Manufacturing
Health Care & Bioscience
Finance
Real Estate & Construction
Military
Hospitality/Tourism
Major Industries
Finance
Real Estate & Construction
Military
Hospitality & Tourism
Health Care & Bioscience
Manufacturing
$0 $5 $10 $15 $20 $25 $30
1 Valero Energy 13
2 Tesoro Corp 77
3 USAA 122
4 CST Brands, Inc 277
5 iHeart Media 429
6 NuStar Energy 741
Fortune 500 CompaniesSAT USRankings
Hans G. RohlCommercial Property SpecialistDirect Line 210 524 [email protected]
Kimberly S. GatleySenior Vice PresidentDirect Line 210 524 [email protected]
210 524 4000
SAN ANTONIOR E O C
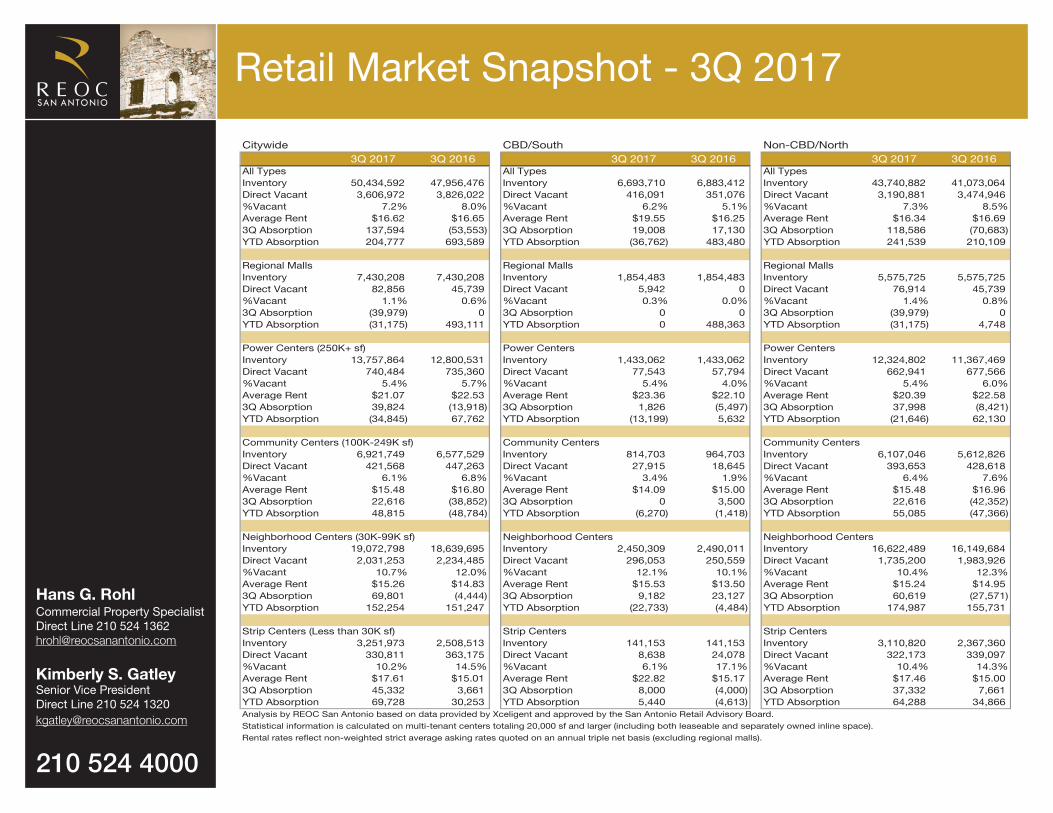
Retail Market Snapshot - 3Q 2017
REOC San Antonio I 8023 Vantage Dr, Suite 1200 I San Antonio TX 78230-4726 I 210 524 4000 I www.reocsanantonioblog.com
Citywide CBD/South Non-CBD/North3Q 2017 3Q 2016 3Q 2017 3Q 2016 3Q 2017 3Q 2016
All Types All Types All TypesInventory 50,434,592 47,956,476 Inventory 6,693,710 6,883,412 Inventory 43,740,882 41,073,064Direct Vacant 3,606,972 3,826,022 Direct Vacant 416,091 351,076 Direct Vacant 3,190,881 3,474,946%Vacant 7.2% 8.0% %Vacant 6.2% 5.1% %Vacant 7.3% 8.5%Average Rent $16.62 $16.65 Average Rent $19.55 $16.25 Average Rent $16.34 $16.693Q Absorption 137,594 (53,553) 3Q Absorption 19,008 17,130 3Q Absorption 118,586 (70,683)YTD Absorption 204,777 693,589 YTD Absorption (36,762) 483,480 YTD Absorption 241,539 210,109
Regional Malls Regional Malls Regional MallsInventory 7,430,208 7,430,208 Inventory 1,854,483 1,854,483 Inventory 5,575,725 5,575,725Direct Vacant 82,856 45,739 Direct Vacant 5,942 0 Direct Vacant 76,914 45,739%Vacant 1.1% 0.6% %Vacant 0.3% 0.0% %Vacant 1.4% 0.8%3Q Absorption (39,979) 0 3Q Absorption 0 0 3Q Absorption (39,979) 0YTD Absorption (31,175) 493,111 YTD Absorption 0 488,363 YTD Absorption (31,175) 4,748
Power Centers (250K+ sf) Power Centers Power CentersInventory 13,757,864 12,800,531 Inventory 1,433,062 1,433,062 Inventory 12,324,802 11,367,469Direct Vacant 740,484 735,360 Direct Vacant 77,543 57,794 Direct Vacant 662,941 677,566%Vacant 5.4% 5.7% %Vacant 5.4% 4.0% %Vacant 5.4% 6.0%Average Rent $21.07 $22.53 Average Rent $23.36 $22.10 Average Rent $20.39 $22.583Q Absorption 39,824 (13,918) 3Q Absorption 1,826 (5,497) 3Q Absorption 37,998 (8,421)YTD Absorption (34,845) 67,762 YTD Absorption (13,199) 5,632 YTD Absorption (21,646) 62,130
Community Centers (100K-249K sf) Community Centers Community CentersInventory 6,921,749 6,577,529 Inventory 814,703 964,703 Inventory 6,107,046 5,612,826Direct Vacant 421,568 447,263 Direct Vacant 27,915 18,645 Direct Vacant 393,653 428,618%Vacant 6.1% 6.8% %Vacant 3.4% 1.9% %Vacant 6.4% 7.6%Average Rent $15.48 $16.80 Average Rent $14.09 $15.00 Average Rent $15.48 $16.963Q Absorption 22,616 (38,852) 3Q Absorption 0 3,500 3Q Absorption 22,616 (42,352)YTD Absorption 48,815 (48,784) YTD Absorption (6,270) (1,418) YTD Absorption 55,085 (47,366)
Neighborhood Centers (30K-99K sf) Neighborhood Centers Neighborhood CentersInventory 19,072,798 18,639,695 Inventory 2,450,309 2,490,011 Inventory 16,622,489 16,149,684Direct Vacant 2,031,253 2,234,485 Direct Vacant 296,053 250,559 Direct Vacant 1,735,200 1,983,926%Vacant 10.7% 12.0% %Vacant 12.1% 10.1% %Vacant 10.4% 12.3%Average Rent $15.26 $14.83 Average Rent $15.53 $13.50 Average Rent $15.24 $14.953Q Absorption 69,801 (4,444) 3Q Absorption 9,182 23,127 3Q Absorption 60,619 (27,571)YTD Absorption 152,254 151,247 YTD Absorption (22,733) (4,484) YTD Absorption 174,987 155,731
Strip Centers (Less than 30K sf) Strip Centers Strip CentersInventory 3,251,973 2,508,513 Inventory 141,153 141,153 Inventory 3,110,820 2,367,360Direct Vacant 330,811 363,175 Direct Vacant 8,638 24,078 Direct Vacant 322,173 339,097%Vacant 10.2% 14.5% %Vacant 6.1% 17.1% %Vacant 10.4% 14.3%Average Rent $17.61 $15.01 Average Rent $22.82 $15.17 Average Rent $17.46 $15.003Q Absorption 45,332 3,661 3Q Absorption 8,000 (4,000) 3Q Absorption 37,332 7,661YTD Absorption 69,728 30,253 YTD Absorption 5,440 (4,613) YTD Absorption 64,288 34,866Analysis by REOC San Antonio based on data provided by Xceligent and approved by the San Antonio Retail Advisory Board.
Statistical information is calculated on multi-tenant centers totaling 20,000 sf and larger (including both leaseable and separately owned inline space).
Rental rates reflect non-weighted strict average asking rates quoted on an annual triple net basis (excluding regional malls).
San Antonio Retail ReportThird Quarter 2017

Hans G. RohlCommercial Property SpecialistDirect Line 210 524 [email protected]
Kimberly S. GatleySenior Vice PresidentDirect Line 210 524 [email protected]
210 524 4000
SAN ANTONIOR E O C Demographics: 1-MileDemographic and Income Profile
7575 Culebra Rd, San Antonio, Texas, 78238 Prepared by EsriRing: 1 mile radius Latitude: 29.45875
Longitude: -98.63766
Summary Census 2010 2017 2022Population 11,338 12,985 14,219Households 4,937 5,492 5,981Families 2,824 3,146 3,412Average Household Size 2.30 2.36 2.38Owner Occupied Housing Units 1,432 1,549 1,698Renter Occupied Housing Units 3,505 3,944 4,283Median Age 28.2 29.2 29.4
Trends: 2017 - 2022 Annual Rate Area State NationalPopulation 1.83% 1.67% 0.83%Households 1.72% 1.63% 0.79%Families 1.64% 1.58% 0.71%Owner HHs 1.85% 1.58% 0.72%Median Household Income 1.43% 2.23% 2.12%
2017 2022 Households by Income Number Percent Number Percent
<$15,000 533 9.7% 585 9.8%$15,000 - $24,999 768 14.0% 780 13.0%$25,000 - $34,999 899 16.4% 896 15.0%$35,000 - $49,999 1,059 19.3% 1,039 17.4%$50,000 - $74,999 1,122 20.4% 1,226 20.5%$75,000 - $99,999 547 10.0% 691 11.6%$100,000 - $149,999 465 8.5% 624 10.4%$150,000 - $199,999 58 1.1% 78 1.3%$200,000+ 42 0.8% 62 1.0%
Median Household Income $41,354 $44,392Average Household Income $52,615 $59,030Per Capita Income $21,373 $23,860
Census 2010 2017 2022 Population by Age Number Percent Number Percent Number Percent
0 - 4 1,008 8.9% 1,070 8.2% 1,184 8.3%5 - 9 832 7.3% 921 7.1% 966 6.8%10 - 14 814 7.2% 815 6.3% 875 6.2%15 - 19 806 7.1% 881 6.8% 864 6.1%20 - 24 1,352 11.9% 1,483 11.4% 1,606 11.3%25 - 34 2,294 20.2% 2,770 21.3% 3,127 22.0%35 - 44 1,524 13.4% 1,728 13.3% 1,880 13.2%45 - 54 1,282 11.3% 1,387 10.7% 1,424 10.0%55 - 64 880 7.8% 1,030 7.9% 1,169 8.2%65 - 74 377 3.3% 620 4.8% 745 5.2%75 - 84 130 1.1% 226 1.7% 306 2.2%
85+ 38 0.3% 55 0.4% 73 0.5%Census 2010 2017 2022
Race and Ethnicity Number Percent Number Percent Number PercentWhite Alone 7,529 66.4% 8,428 64.9% 9,187 64.6%Black Alone 1,161 10.2% 1,347 10.4% 1,495 10.5%American Indian Alone 90 0.8% 102 0.8% 112 0.8%Asian Alone 271 2.4% 361 2.8% 445 3.1%Pacific Islander Alone 21 0.2% 24 0.2% 28 0.2%Some Other Race Alone 1,728 15.2% 2,062 15.9% 2,206 15.5%Two or More Races 538 4.7% 661 5.1% 747 5.3%
Hispanic Origin (Any Race) 7,544 66.5% 8,944 68.9% 9,983 70.2%Data Note: Income is expressed in current dollars.
Source: U.S. Census Bureau, Census 2010 Summary File 1. Esri forecasts for 2017 and 2022.
September 15, 2017
©2017 Esri Page 1 of 6

Hans G. RohlCommercial Property SpecialistDirect Line 210 524 [email protected]
Kimberly S. GatleySenior Vice PresidentDirect Line 210 524 [email protected]
210 524 4000
SAN ANTONIOR E O C Demographics: 3-MileDemographic and Income Profile
7575 Culebra Rd, San Antonio, Texas, 78238 Prepared by EsriRing: 3 mile radius Latitude: 29.45875
Longitude: -98.63766
Summary Census 2010 2017 2022Population 100,573 114,187 123,344Households 35,753 40,263 43,471Families 24,792 27,386 29,292Average Household Size 2.81 2.83 2.83Owner Occupied Housing Units 19,654 20,238 21,474Renter Occupied Housing Units 16,099 20,025 21,996Median Age 30.7 31.6 31.9
Trends: 2017 - 2022 Annual Rate Area State NationalPopulation 1.55% 1.67% 0.83%Households 1.55% 1.63% 0.79%Families 1.35% 1.58% 0.71%Owner HHs 1.19% 1.58% 0.72%Median Household Income 1.30% 2.23% 2.12%
2017 2022 Households by Income Number Percent Number Percent
<$15,000 4,535 11.3% 4,794 11.0%$15,000 - $24,999 4,415 11.0% 4,415 10.2%$25,000 - $34,999 4,805 11.9% 4,645 10.7%$35,000 - $49,999 6,348 15.8% 6,123 14.1%$50,000 - $74,999 8,621 21.4% 8,964 20.6%$75,000 - $99,999 5,361 13.3% 6,452 14.8%$100,000 - $149,999 4,468 11.1% 5,794 13.3%$150,000 - $199,999 1,073 2.7% 1,416 3.3%$200,000+ 638 1.6% 866 2.0%
Median Household Income $50,052 $53,390Average Household Income $61,221 $68,948Per Capita Income $21,698 $24,428
Census 2010 2017 2022 Population by Age Number Percent Number Percent Number Percent
0 - 4 8,410 8.4% 9,094 8.0% 9,963 8.1%5 - 9 8,222 8.2% 8,468 7.4% 8,985 7.3%10 - 14 7,920 7.9% 8,102 7.1% 8,549 6.9%15 - 19 7,635 7.6% 7,862 6.9% 8,144 6.6%20 - 24 8,288 8.2% 9,725 8.5% 10,152 8.2%25 - 34 16,596 16.5% 20,182 17.7% 22,564 18.3%35 - 44 13,617 13.5% 15,424 13.5% 16,915 13.7%45 - 54 12,127 12.1% 12,664 11.1% 12,923 10.5%55 - 64 9,492 9.4% 10,899 9.5% 11,311 9.2%65 - 74 5,115 5.1% 7,606 6.7% 8,685 7.0%75 - 84 2,496 2.5% 3,216 2.8% 4,021 3.3%
85+ 655 0.7% 946 0.8% 1,133 0.9%Census 2010 2017 2022
Race and Ethnicity Number Percent Number Percent Number PercentWhite Alone 71,537 71.1% 79,188 69.3% 84,968 68.9%Black Alone 7,776 7.7% 9,395 8.2% 10,466 8.5%American Indian Alone 796 0.8% 901 0.8% 970 0.8%Asian Alone 2,241 2.2% 3,037 2.7% 3,727 3.0%Pacific Islander Alone 165 0.2% 206 0.2% 237 0.2%Some Other Race Alone 14,182 14.1% 16,744 14.7% 17,732 14.4%Two or More Races 3,876 3.9% 4,716 4.1% 5,244 4.3%
Hispanic Origin (Any Race) 69,621 69.2% 80,812 70.8% 88,634 71.9%Data Note: Income is expressed in current dollars.
Source: U.S. Census Bureau, Census 2010 Summary File 1. Esri forecasts for 2017 and 2022.
September 15, 2017
©2017 Esri Page 3 of 6
Hans G. RohlCommercial Property SpecialistDirect Line 210 524 [email protected]
Kimberly S. GatleySenior Vice PresidentDirect Line 210 524 [email protected]
210 524 4000
SAN ANTONIOR E O C Demographics: 5-MileDemographic and Income Profile
7575 Culebra Rd, San Antonio, Texas, 78238 Prepared by EsriRing: 5 mile radius Latitude: 29.45875
Longitude: -98.63766
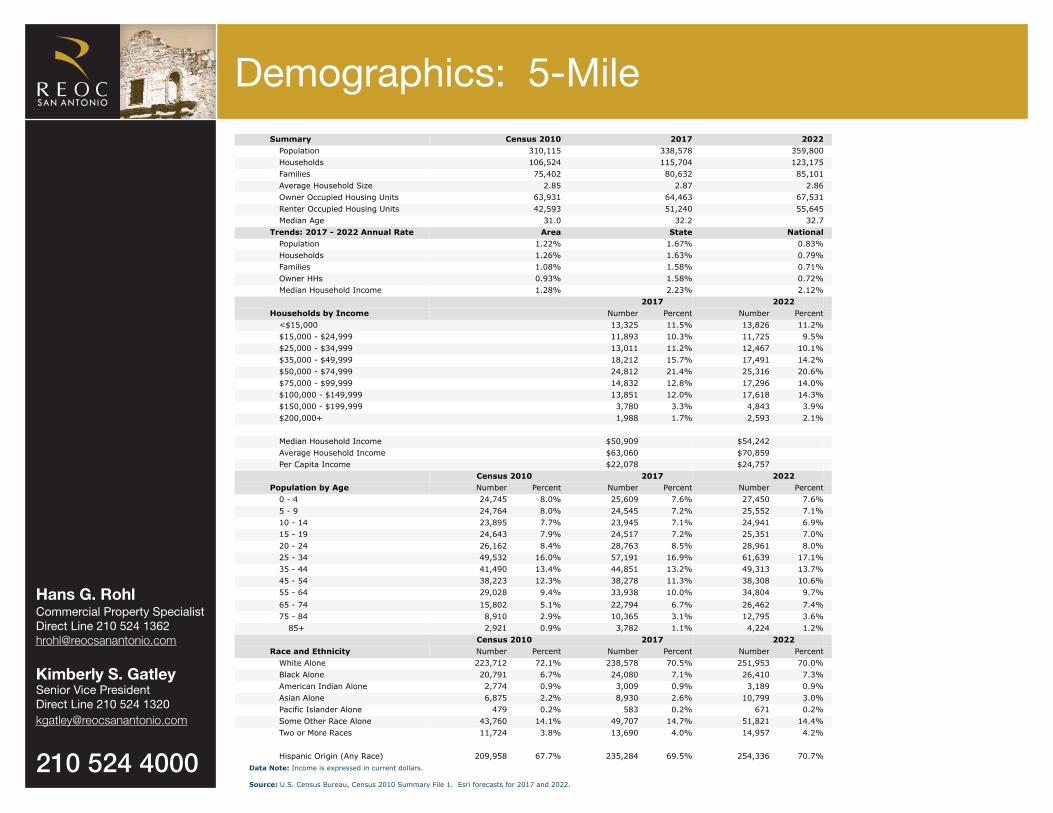
Summary Census 2010 2017 2022Population 310,115 338,578 359,800Households 106,524 115,704 123,175Families 75,402 80,632 85,101Average Household Size 2.85 2.87 2.86Owner Occupied Housing Units 63,931 64,463 67,531Renter Occupied Housing Units 42,593 51,240 55,645Median Age 31.0 32.2 32.7
Trends: 2017 - 2022 Annual Rate Area State NationalPopulation 1.22% 1.67% 0.83%Households 1.26% 1.63% 0.79%Families 1.08% 1.58% 0.71%Owner HHs 0.93% 1.58% 0.72%Median Household Income 1.28% 2.23% 2.12%
2017 2022 Households by Income Number Percent Number Percent
<$15,000 13,325 11.5% 13,826 11.2%$15,000 - $24,999 11,893 10.3% 11,725 9.5%$25,000 - $34,999 13,011 11.2% 12,467 10.1%$35,000 - $49,999 18,212 15.7% 17,491 14.2%$50,000 - $74,999 24,812 21.4% 25,316 20.6%$75,000 - $99,999 14,832 12.8% 17,296 14.0%$100,000 - $149,999 13,851 12.0% 17,618 14.3%$150,000 - $199,999 3,780 3.3% 4,843 3.9%$200,000+ 1,988 1.7% 2,593 2.1%
Median Household Income $50,909 $54,242Average Household Income $63,060 $70,859Per Capita Income $22,078 $24,757
Census 2010 2017 2022 Population by Age Number Percent Number Percent Number Percent
0 - 4 24,745 8.0% 25,609 7.6% 27,450 7.6%5 - 9 24,764 8.0% 24,545 7.2% 25,552 7.1%10 - 14 23,895 7.7% 23,945 7.1% 24,941 6.9%15 - 19 24,643 7.9% 24,517 7.2% 25,351 7.0%20 - 24 26,162 8.4% 28,763 8.5% 28,961 8.0%25 - 34 49,532 16.0% 57,191 16.9% 61,639 17.1%35 - 44 41,490 13.4% 44,851 13.2% 49,313 13.7%45 - 54 38,223 12.3% 38,278 11.3% 38,308 10.6%55 - 64 29,028 9.4% 33,938 10.0% 34,804 9.7%65 - 74 15,802 5.1% 22,794 6.7% 26,462 7.4%75 - 84 8,910 2.9% 10,365 3.1% 12,795 3.6%
85+ 2,921 0.9% 3,782 1.1% 4,224 1.2%Census 2010 2017 2022
Race and Ethnicity Number Percent Number Percent Number PercentWhite Alone 223,712 72.1% 238,578 70.5% 251,953 70.0%Black Alone 20,791 6.7% 24,080 7.1% 26,410 7.3%American Indian Alone 2,774 0.9% 3,009 0.9% 3,189 0.9%Asian Alone 6,875 2.2% 8,930 2.6% 10,799 3.0%Pacific Islander Alone 479 0.2% 583 0.2% 671 0.2%Some Other Race Alone 43,760 14.1% 49,707 14.7% 51,821 14.4%Two or More Races 11,724 3.8% 13,690 4.0% 14,957 4.2%
Hispanic Origin (Any Race) 209,958 67.7% 235,284 69.5% 254,336 70.7%Data Note: Income is expressed in current dollars.
Source: U.S. Census Bureau, Census 2010 Summary File 1. Esri forecasts for 2017 and 2022.
September 15, 2017
©2017 Esri Page 5 of 6
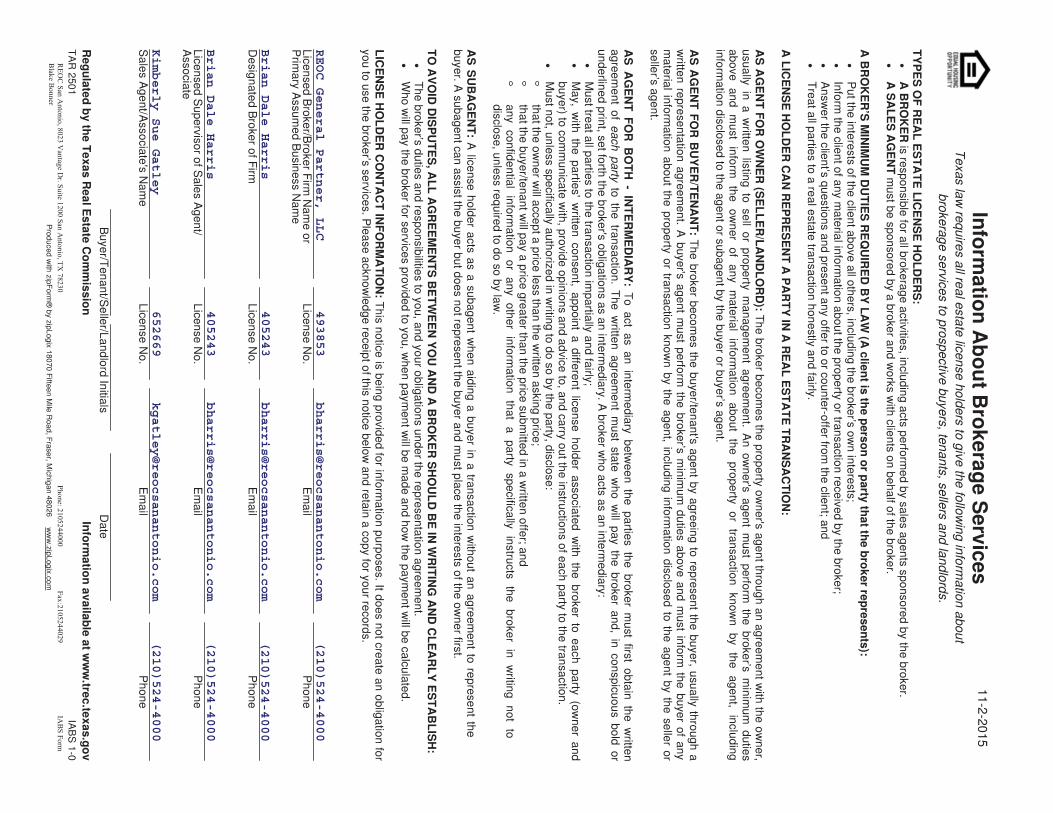
REOC General Partner, LLC
493853
(210)524-4000
Brian Dale Harris
405243
(210)524-4000
Brian Dale Harris
405243
(210)524-4000
Kimberly Sue Gatley
652669
(210)524-4000
REOC San A
ntonio, 8023 Vantage D
r. Suite 1200 San Antonio, TX
782302105244000
2105244029Blake Bonner
IABS Form
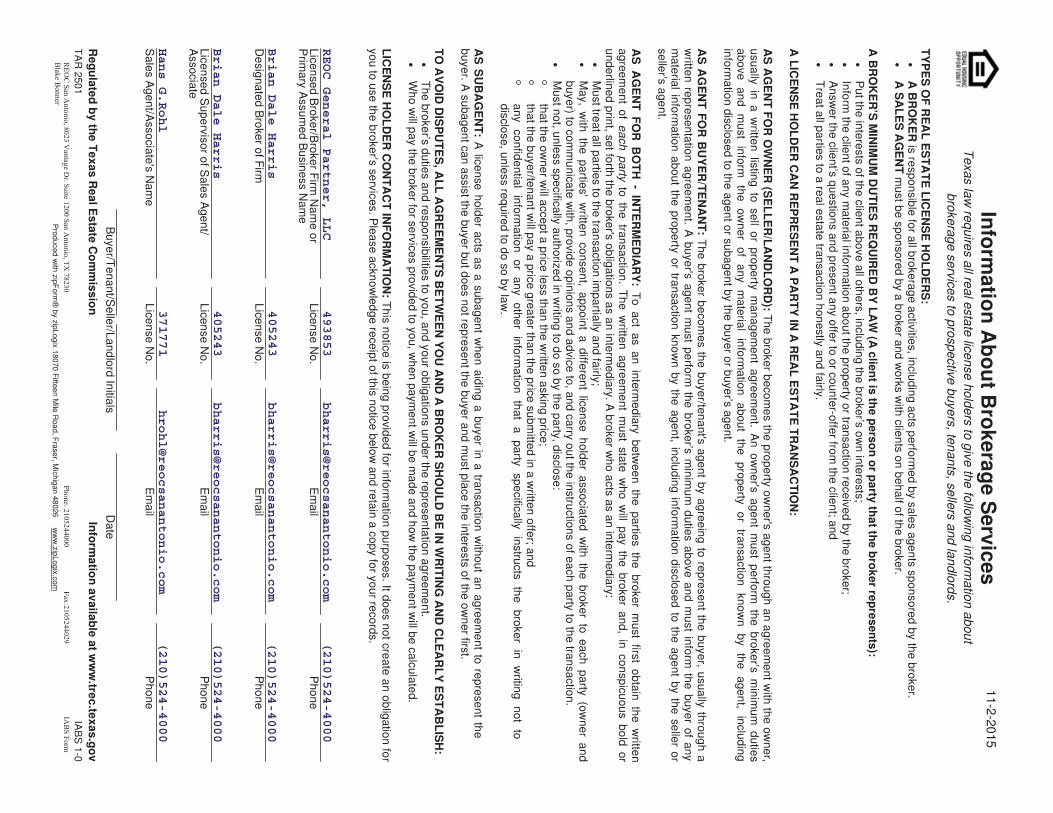
REOC General Partner, LLC
493853
(210)524-4000
Brian Dale Harris
405243
(210)524-4000
Brian Dale Harris
405243
(210)524-4000
Hans G.Rohl
371771
(210)524-4000
REOC San A
ntonio, 8023 Vantage D
r. Suite 1200 San Antonio, TX
782302105244000
2105244029Blake Bonner
IABS Form