CTSI Module 8 Workshop Biomedical Informatics › education › files › view › ... · CTSI...
32
CTSI Module 8 Workshop Introduction to Biomedical Informatics, Part V Practical Tools: Data Processing & Analysis William Hsu, PhD Assistant Professor Medical Imaging Informatics Group Dept of Radiological Sciences, UCLA 1
Transcript of CTSI Module 8 Workshop Biomedical Informatics › education › files › view › ... · CTSI...
CTSI Module 8 Workshop Introduction to Biomedical Informatics,
Part V
Practical Tools: Data Processing & Analysis
William Hsu, PhD Assistant Professor Medical Imaging Informatics Group Dept of Radiological Sciences, UCLA
1
Disclosures
No financial disclosures.
2
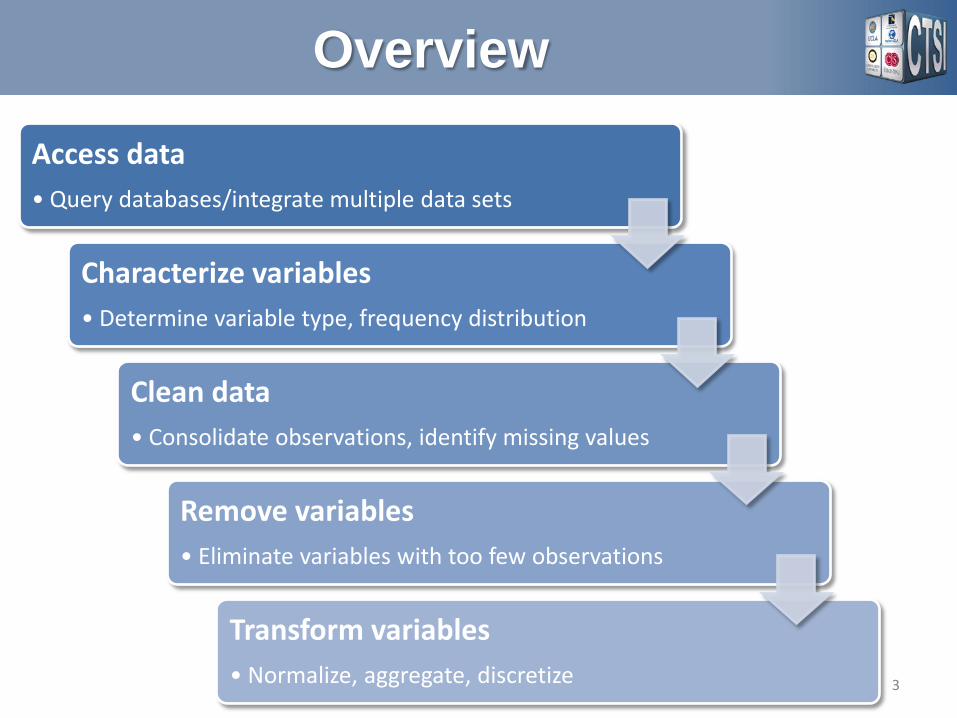
Overview
3
Access data • Query databases/integrate multiple data sets
Characterize variables • Determine variable type, frequency distribution
Clean data • Consolidate observations, identify missing values
Remove variables • Eliminate variables with too few observations
Transform variables • Normalize, aggregate, discretize
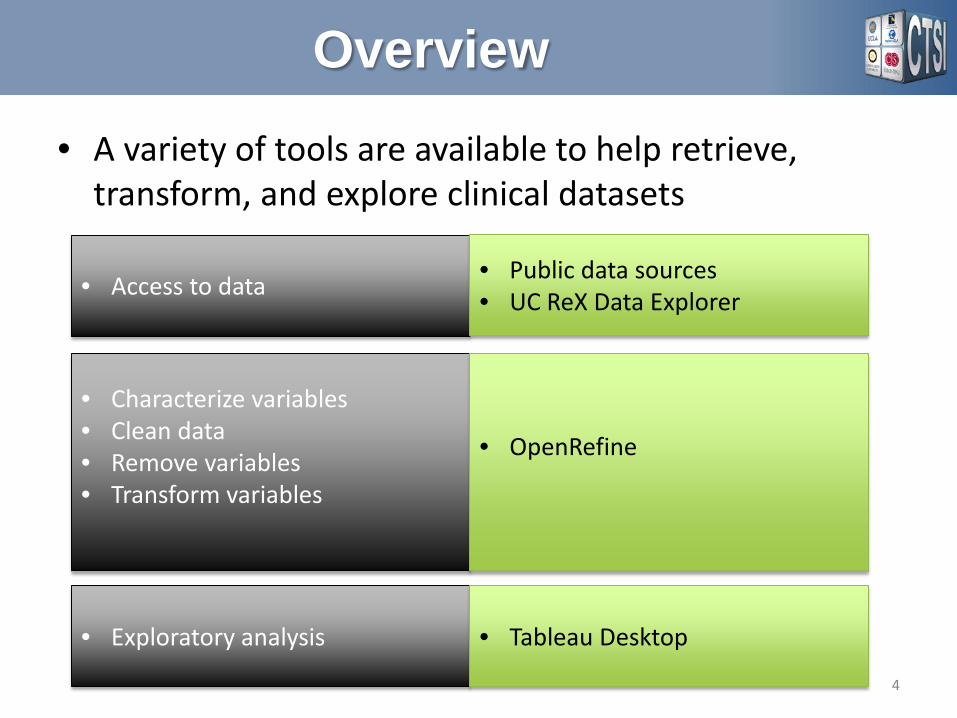
Overview
• A variety of tools are available to help retrieve, transform, and explore clinical datasets
4
• Characterize variables • Clean data • Remove variables • Transform variables
• OpenRefine
• Exploratory analysis • Tableau Desktop
• Access to data • Public data sources • UC ReX Data Explorer
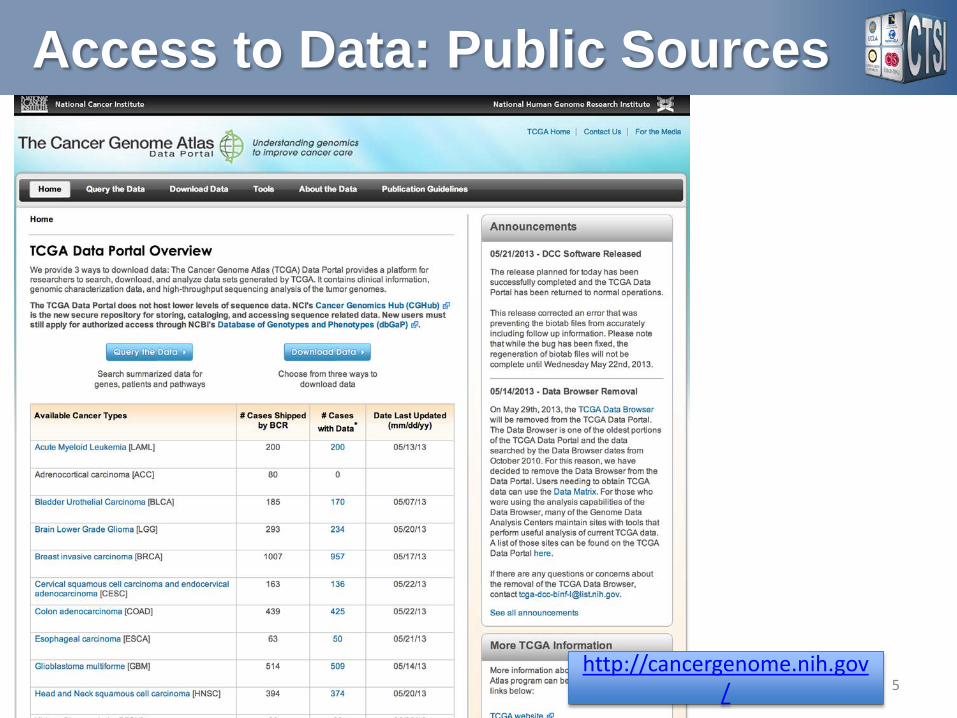
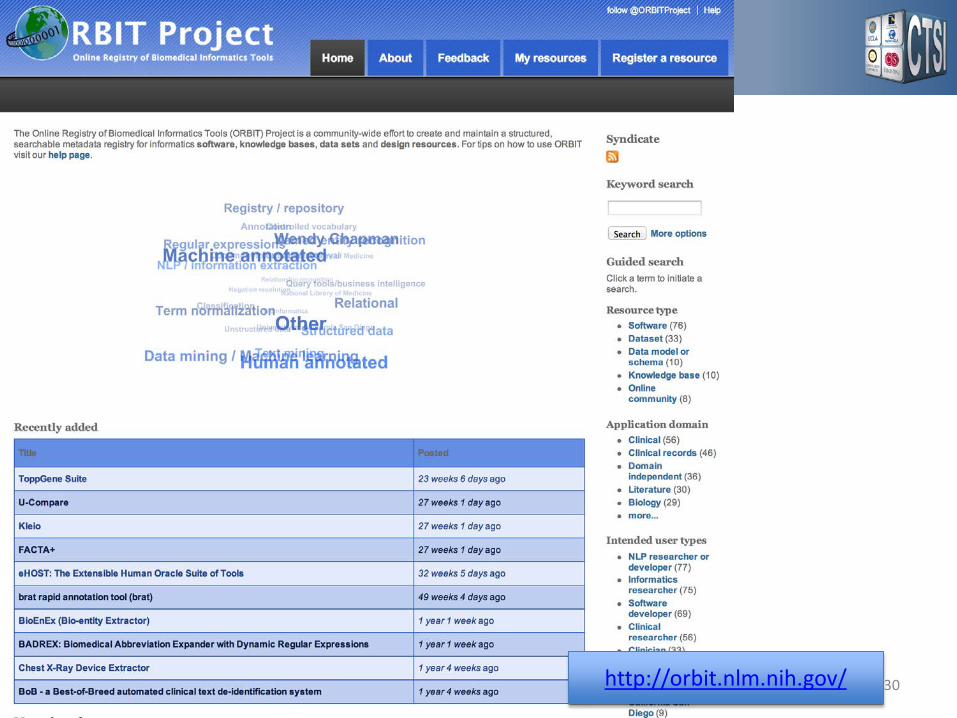
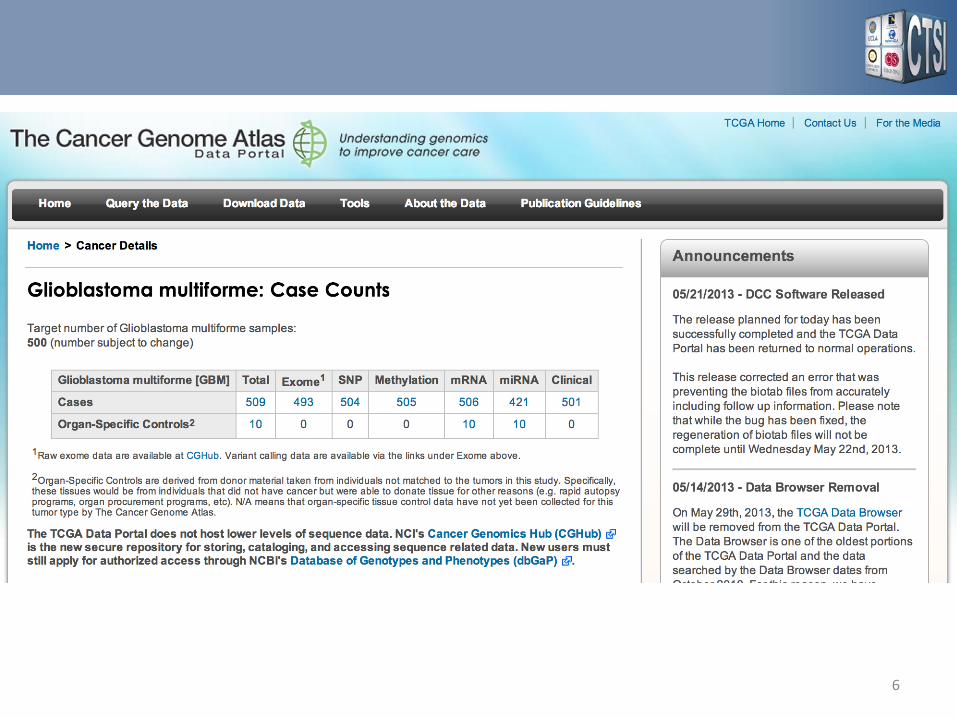
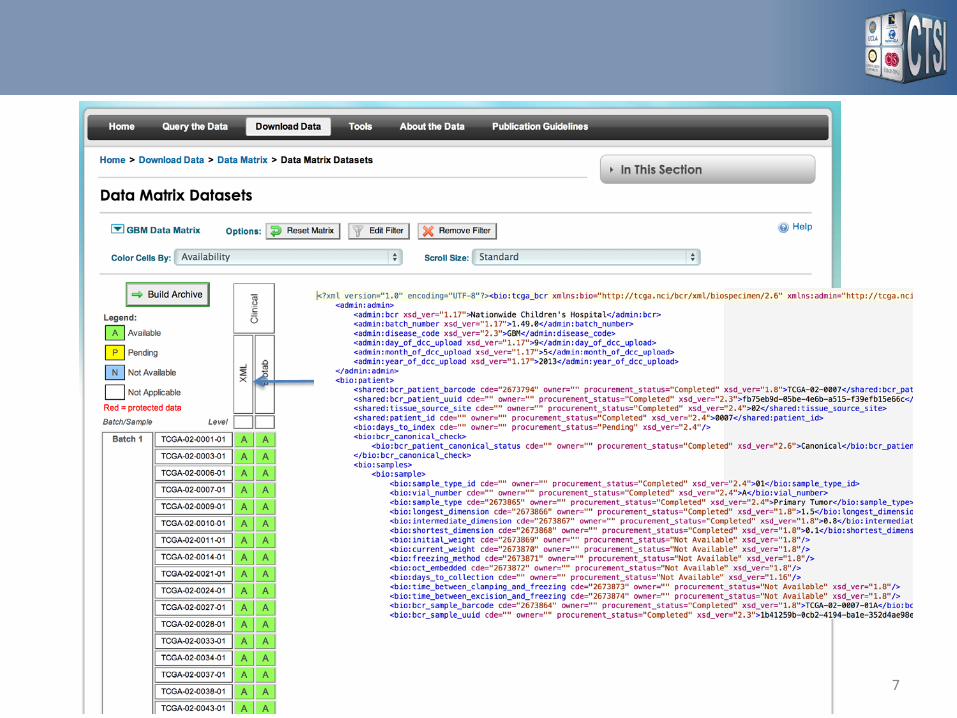
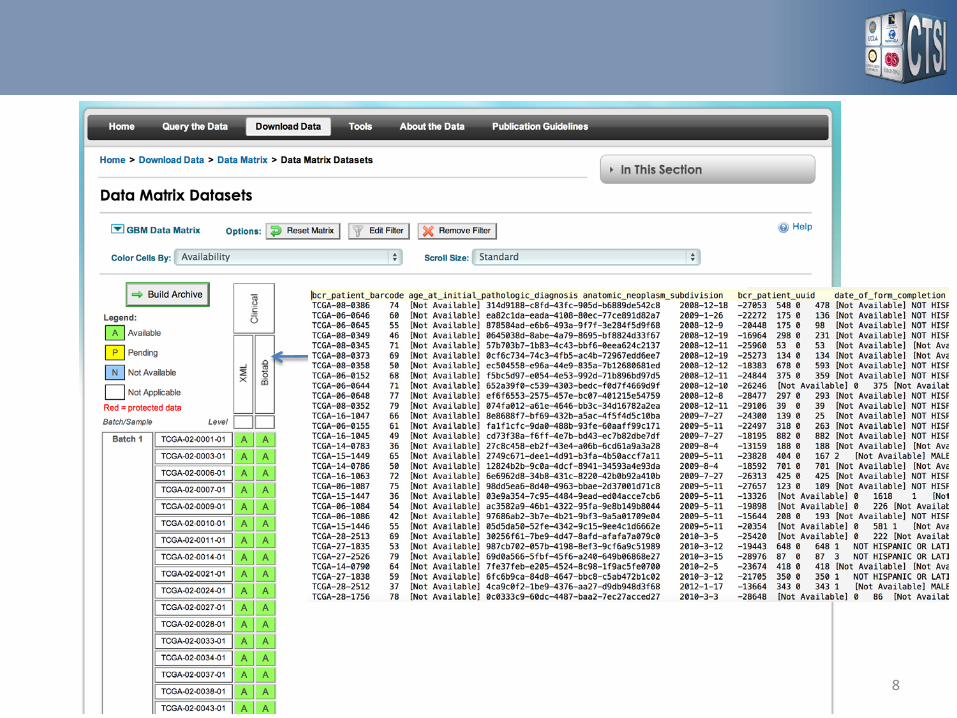
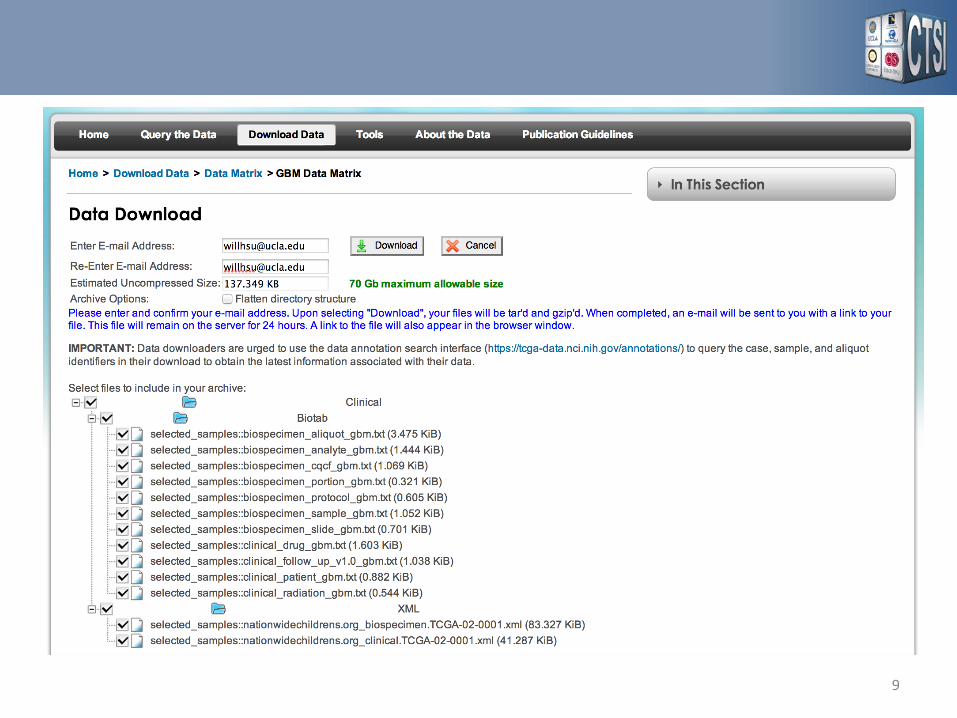
Access to Data: Public Sources
5 http://cancergenome.nih.gov
/
6
7
8
9
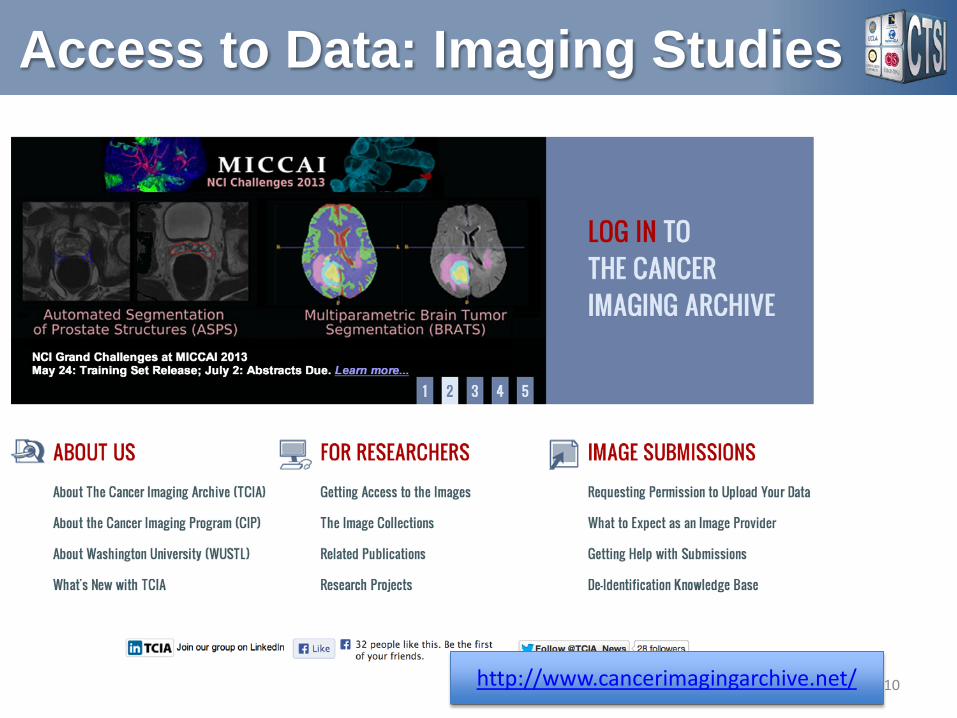
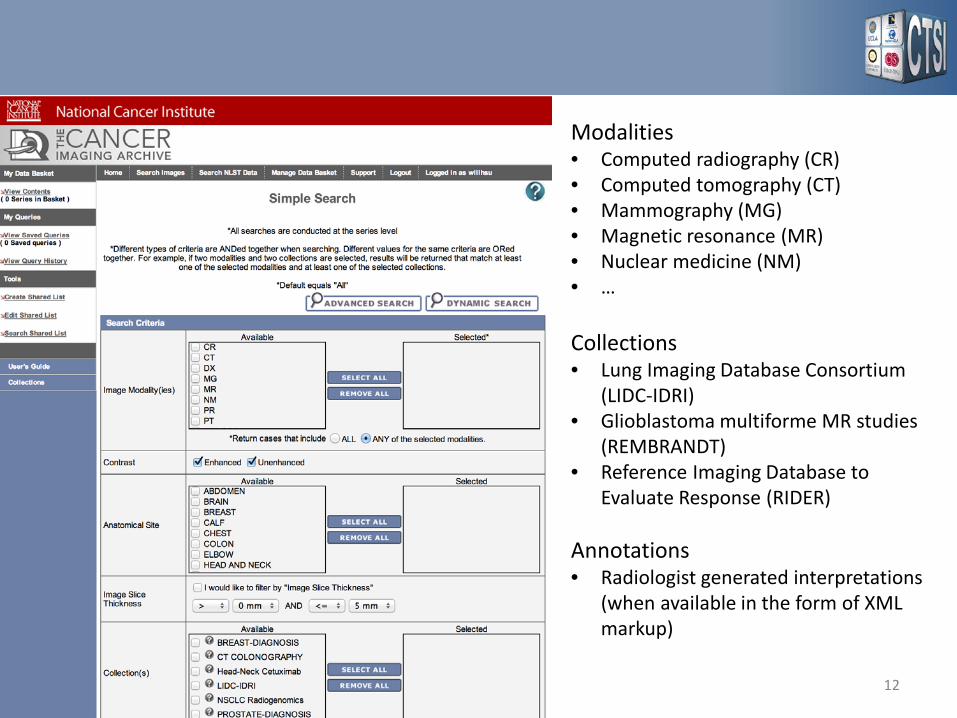
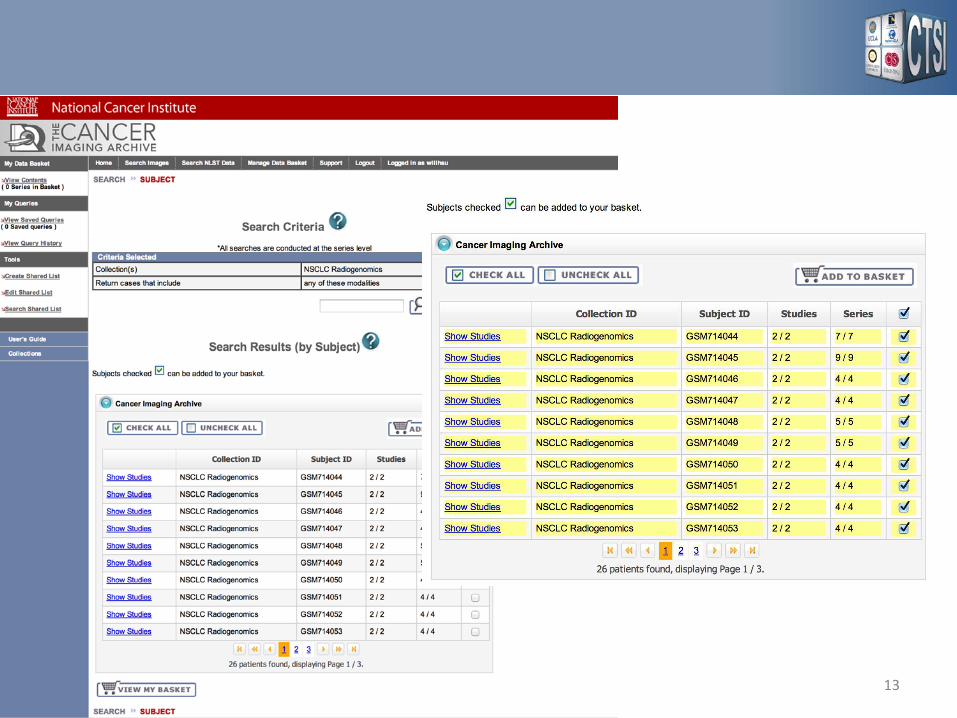
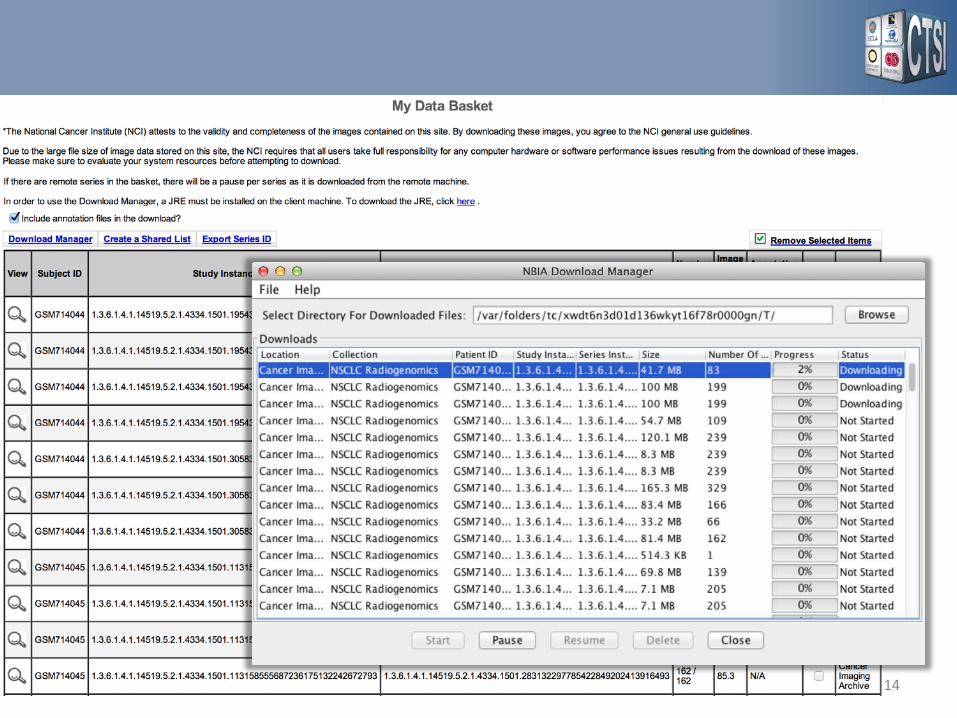
Access to Data: Imaging Studies
10 http://www.cancerimagingarchive.net/

11
12
Modalities • Computed radiography (CR) • Computed tomography (CT) • Mammography (MG) • Magnetic resonance (MR) • Nuclear medicine (NM) • …
Collections • Lung Imaging Database Consortium
(LIDC-IDRI) • Glioblastoma multiforme MR studies
(REMBRANDT) • Reference Imaging Database to
Evaluate Response (RIDER)
Annotations • Radiologist generated interpretations
(when available in the form of XML markup)
13
14
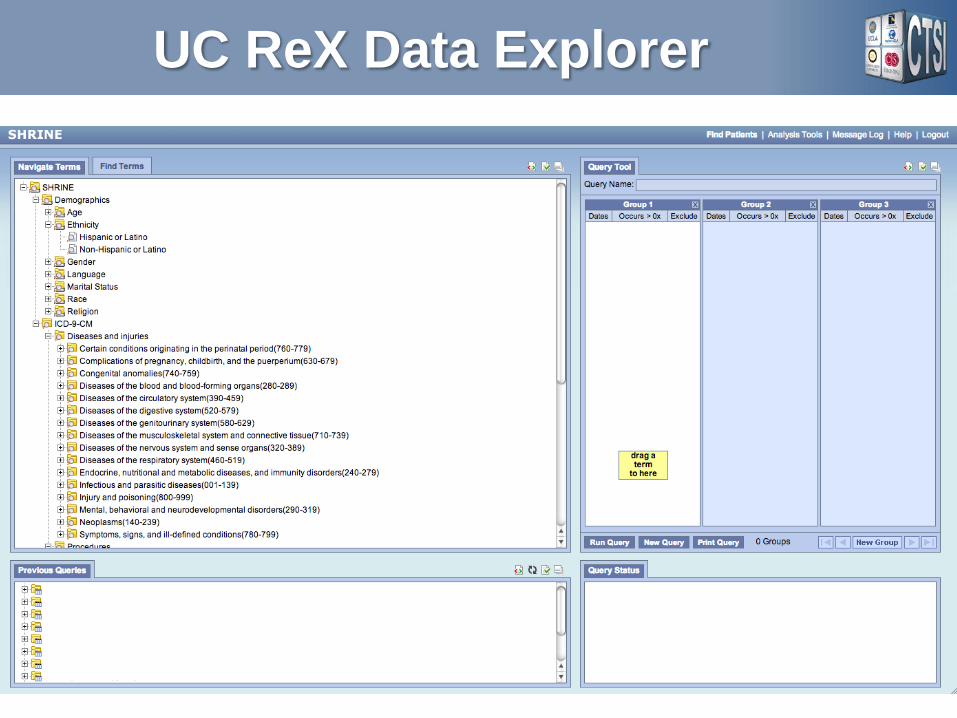
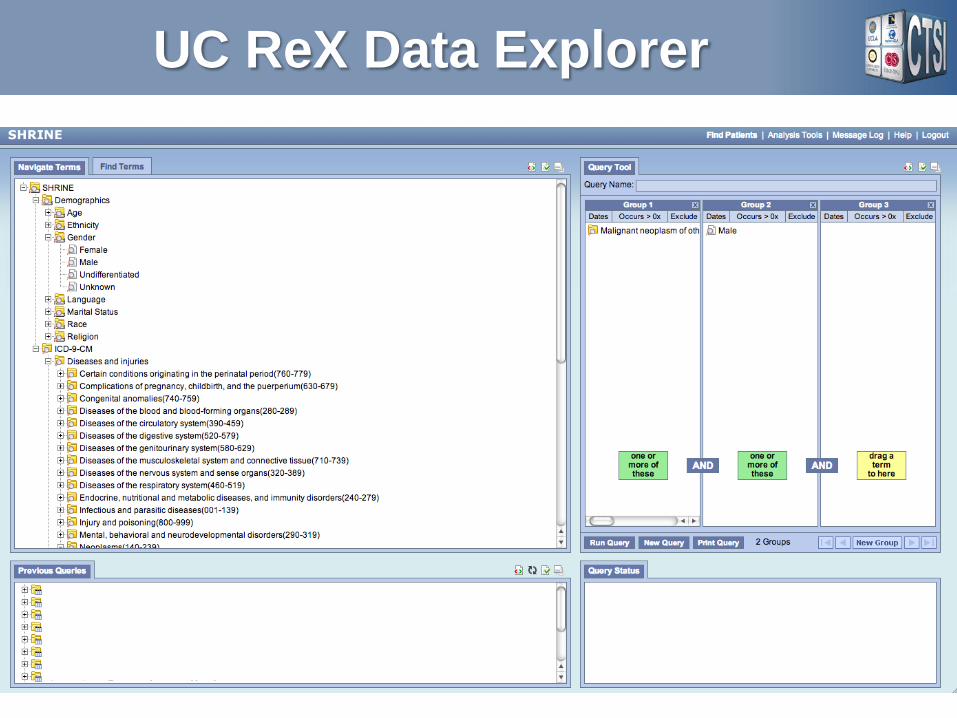
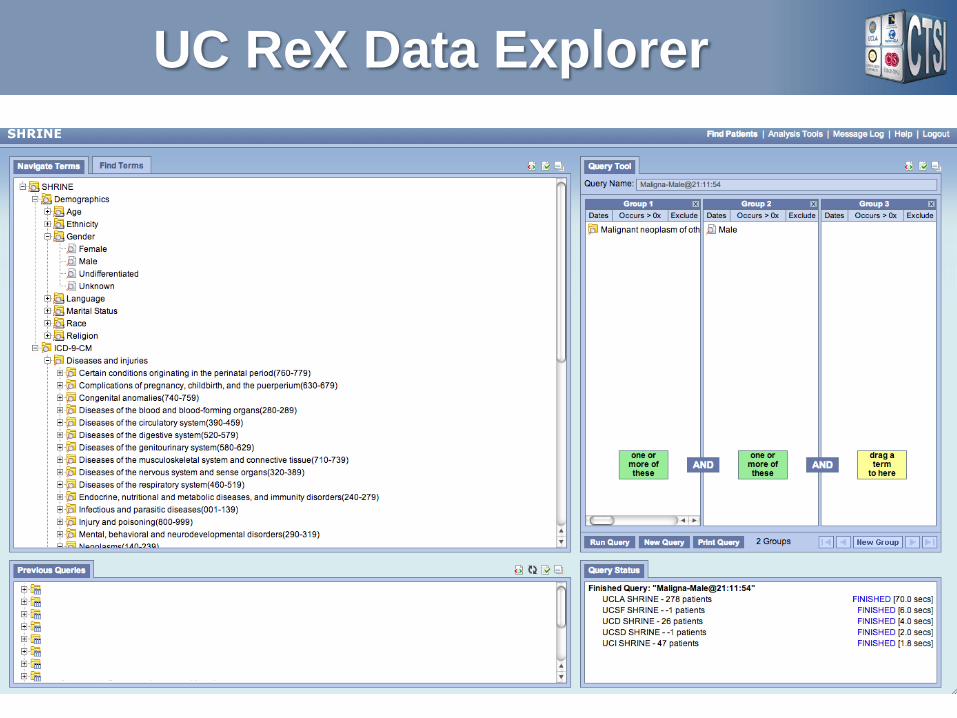
UC ReX Data Explorer
• UC ReX Data Explorer – Allows authorized UC researchers to query de-
identified diagnosis and procedure data across all patient records
• 11.8 million patient records • All 5 UC academic medical centers
– Provides secure, web-based, local access to shared database
– Includes patient demographics, diagnosis, and procedures data
• http://ucrex.org
15
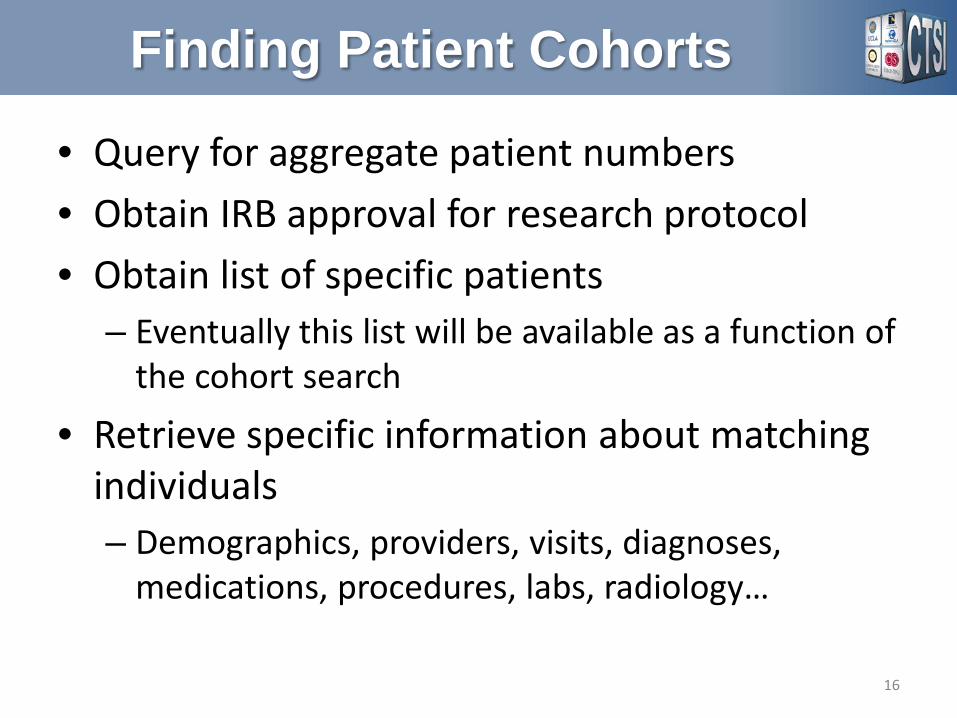
Finding Patient Cohorts
• Query for aggregate patient numbers • Obtain IRB approval for research protocol • Obtain list of specific patients
– Eventually this list will be available as a function of the cohort search
• Retrieve specific information about matching individuals – Demographics, providers, visits, diagnoses,
medications, procedures, labs, radiology…
16
UC ReX Data Explorer
17
UC ReX Data Explorer
18
UC ReX Data Explorer
19
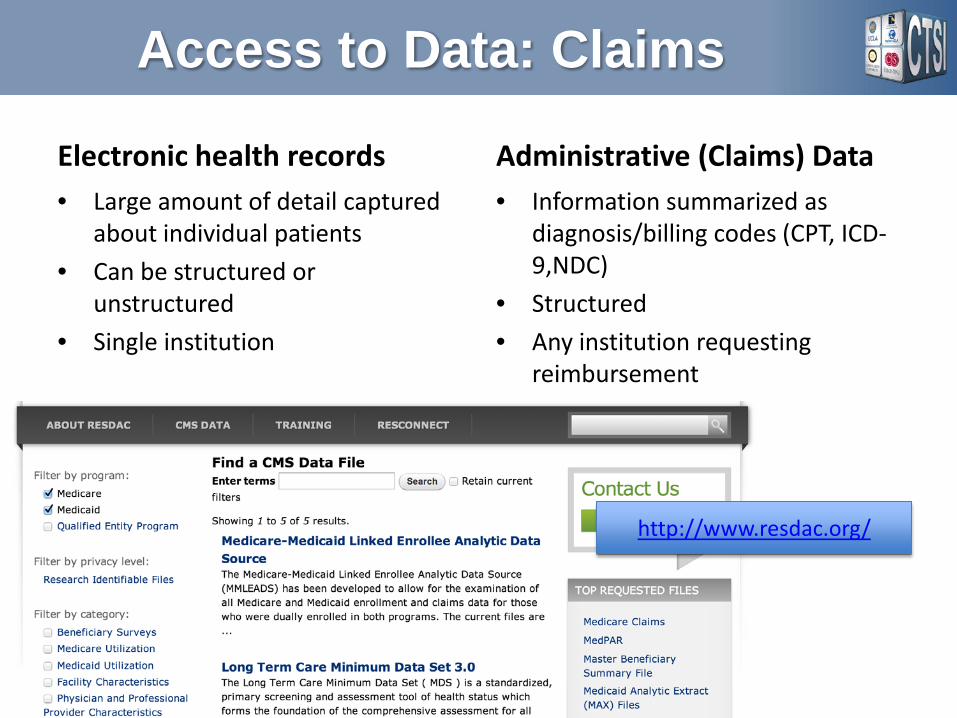
Access to Data: Claims
Electronic health records • Large amount of detail captured
about individual patients • Can be structured or
unstructured • Single institution
Administrative (Claims) Data • Information summarized as
diagnosis/billing codes (CPT, ICD-9,NDC)
• Structured • Any institution requesting
reimbursement
http://www.resdac.org/
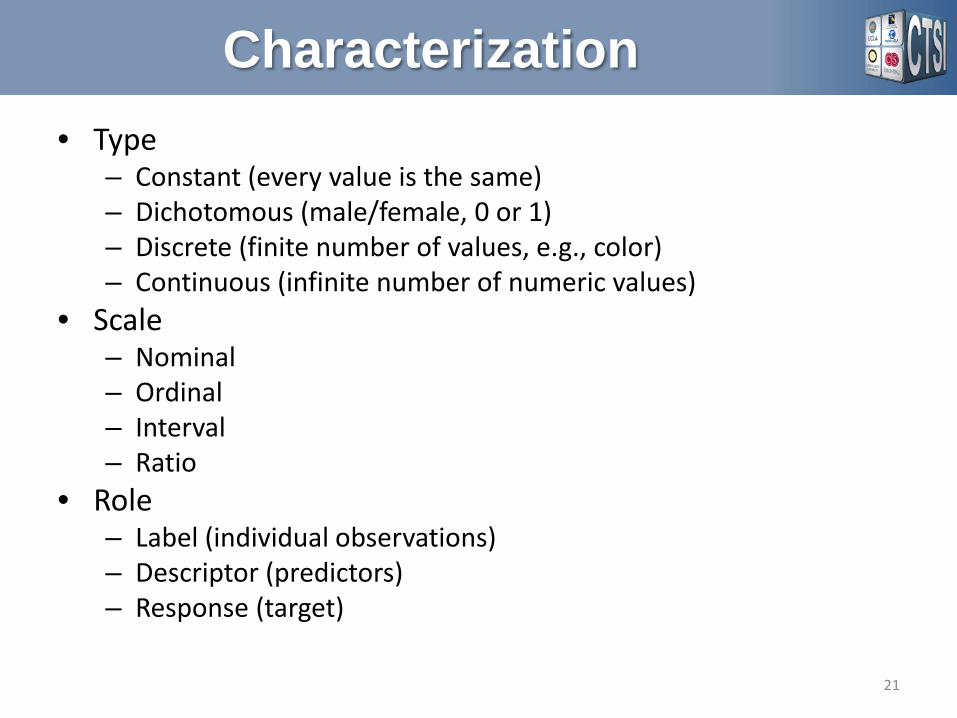
Characterization • Type
– Constant (every value is the same) – Dichotomous (male/female, 0 or 1) – Discrete (finite number of values, e.g., color) – Continuous (infinite number of numeric values)
• Scale – Nominal – Ordinal – Interval – Ratio
• Role – Label (individual observations) – Descriptor (predictors) – Response (target)
21
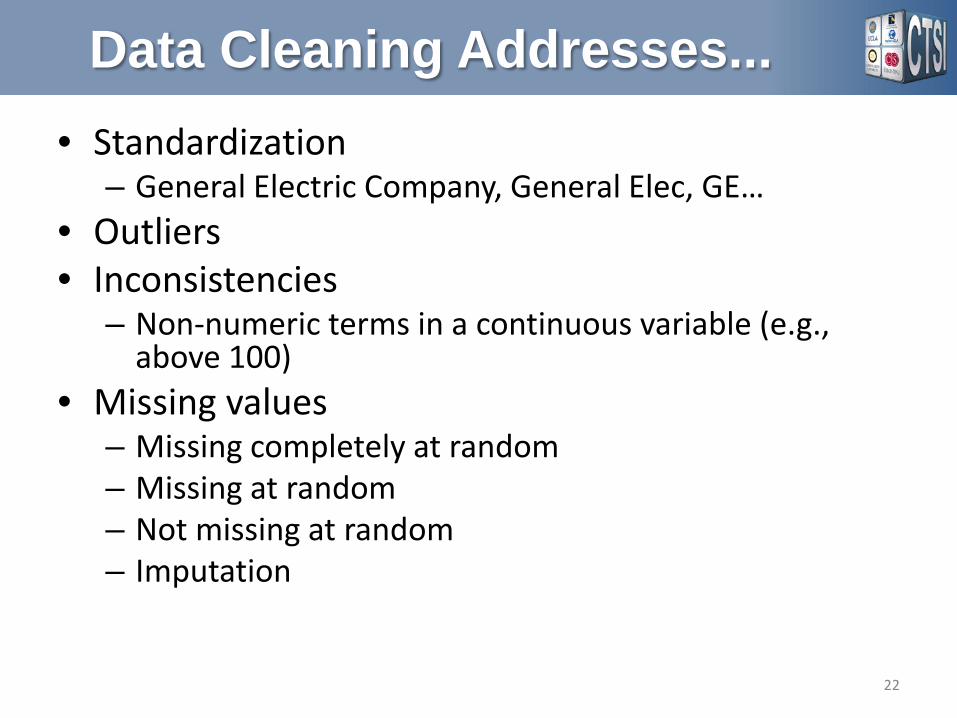
Data Cleaning Addresses... • Standardization
– General Electric Company, General Elec, GE… • Outliers • Inconsistencies
– Non-numeric terms in a continuous variable (e.g., above 100)
• Missing values – Missing completely at random – Missing at random – Not missing at random – Imputation
22
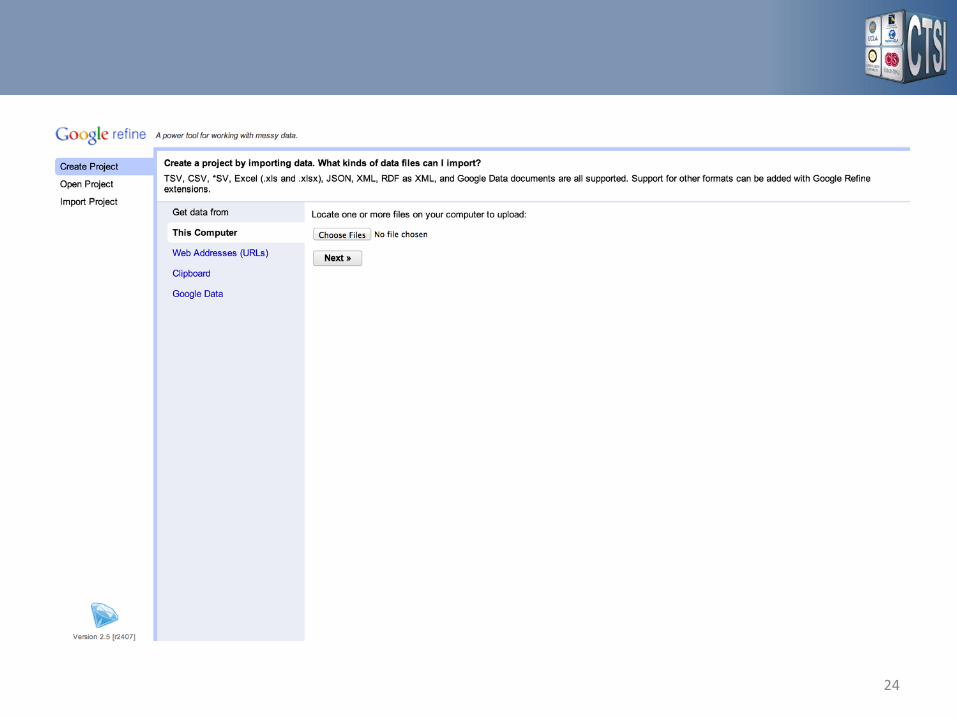
OpenRefine
• Formerly Google Refine • Handles tasks related to loading, cleaning, and
transforming raw data • Web-based interface connected to a
lightweight web server that runs on your desktop computer
• Freely available • Available here:
http://openrefine.org/
23
24
OpenRefine: Facets • Purpose: Filtering which rows are displayed based
on a user-defined set of criteria – Define facet for a column – Utilize facet to identify relevant rows
• Many types of facets available – Text facet – Numerical facet – Timeline facet – Scatterplot facet
• Tasks – Removing redundancy – Error checking
25
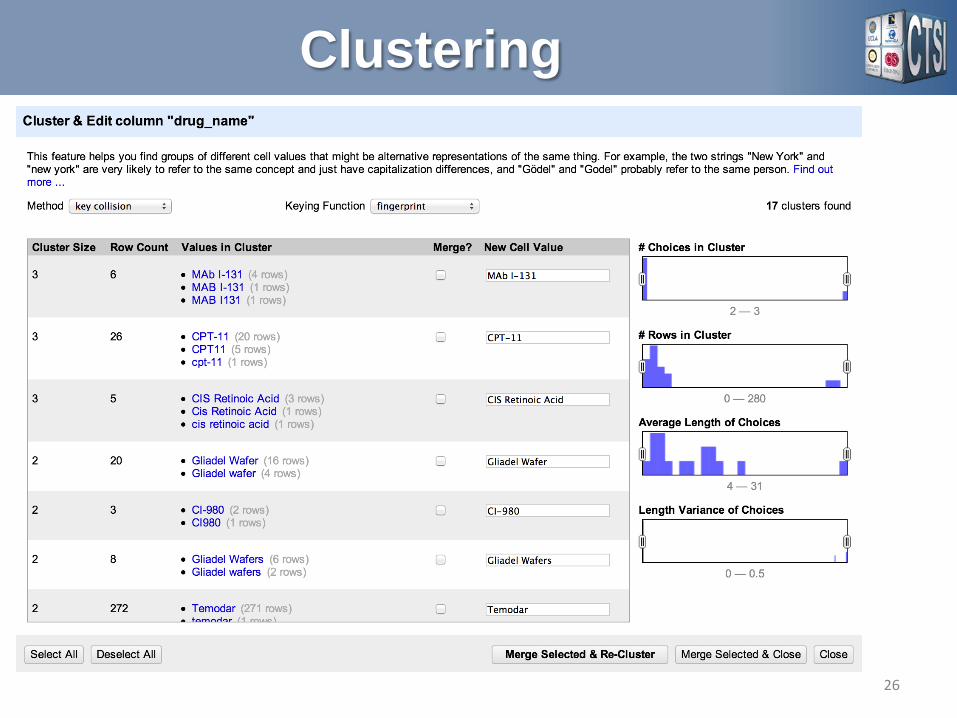
Clustering
26
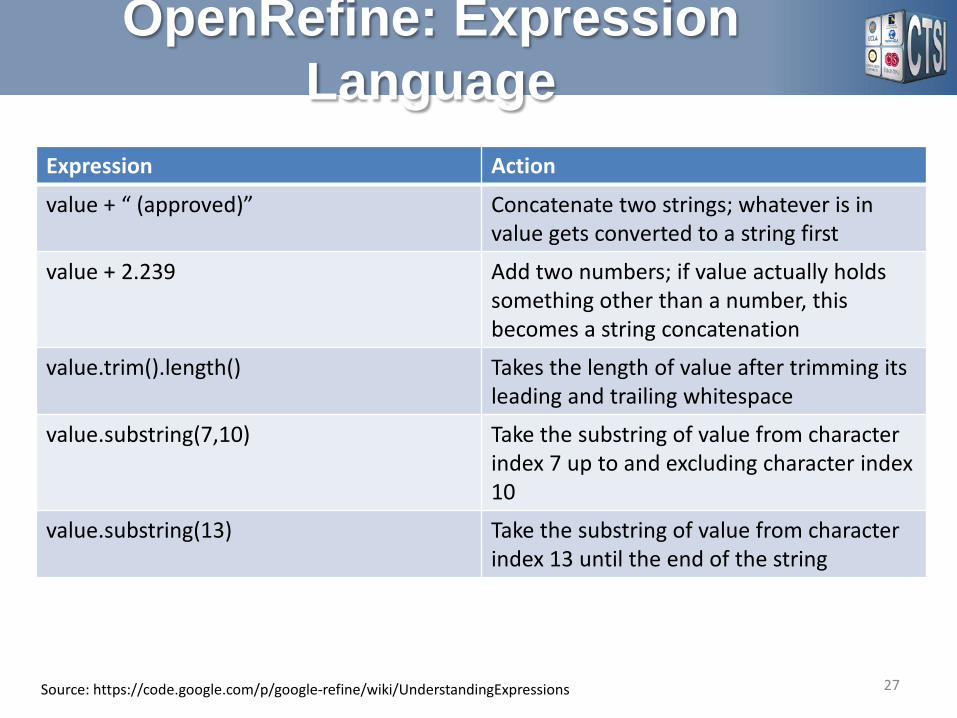
OpenRefine: Expression Language
27
Expression Action
value + “ (approved)” Concatenate two strings; whatever is in value gets converted to a string first
value + 2.239 Add two numbers; if value actually holds something other than a number, this becomes a string concatenation
value.trim().length() Takes the length of value after trimming its leading and trailing whitespace
value.substring(7,10) Take the substring of value from character index 7 up to and excluding character index 10
value.substring(13) Take the substring of value from character index 13 until the end of the string
Source: https://code.google.com/p/google-refine/wiki/UnderstandingExpressions
Exploratory Analysis • Information visualization
– The use of visual representations of abstract data to enhance human cognition
– Visual analytics: Facilitating analytical reasoning through interactive visual interfaces
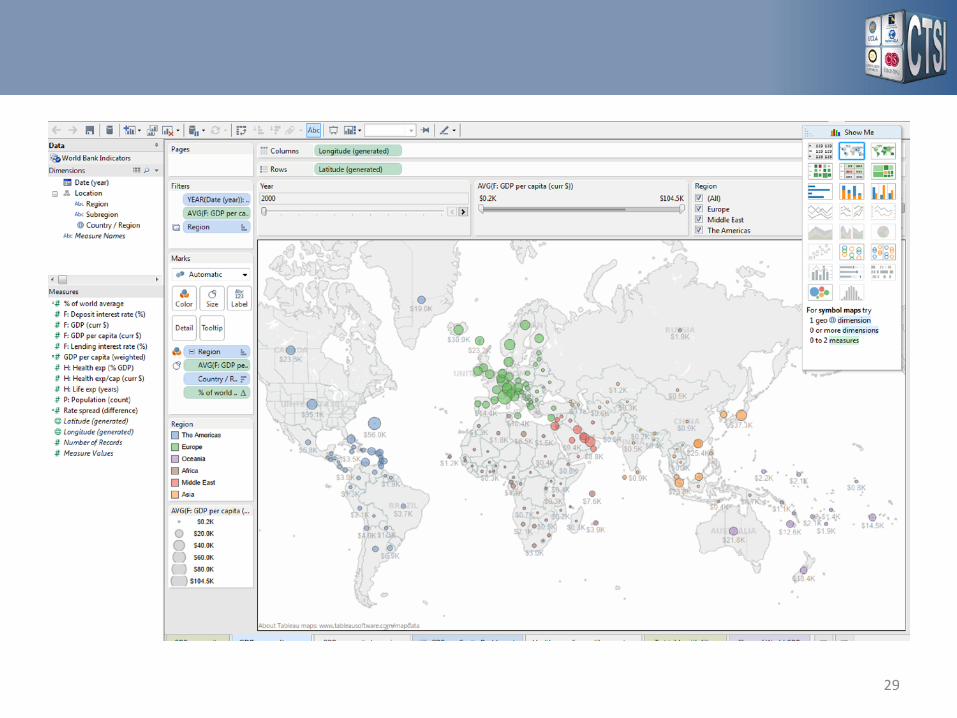
• Tableau Desktop – http://www.tableausoftware.com/ – Commercial software derived from visualization
research done at Stanford University – Various versions available:
• Public (free) but can only save to Tableau website • Desktop Personal ($$, free for full-time students) • Desktop Professional ($$$, connect to more data sources)
28
29
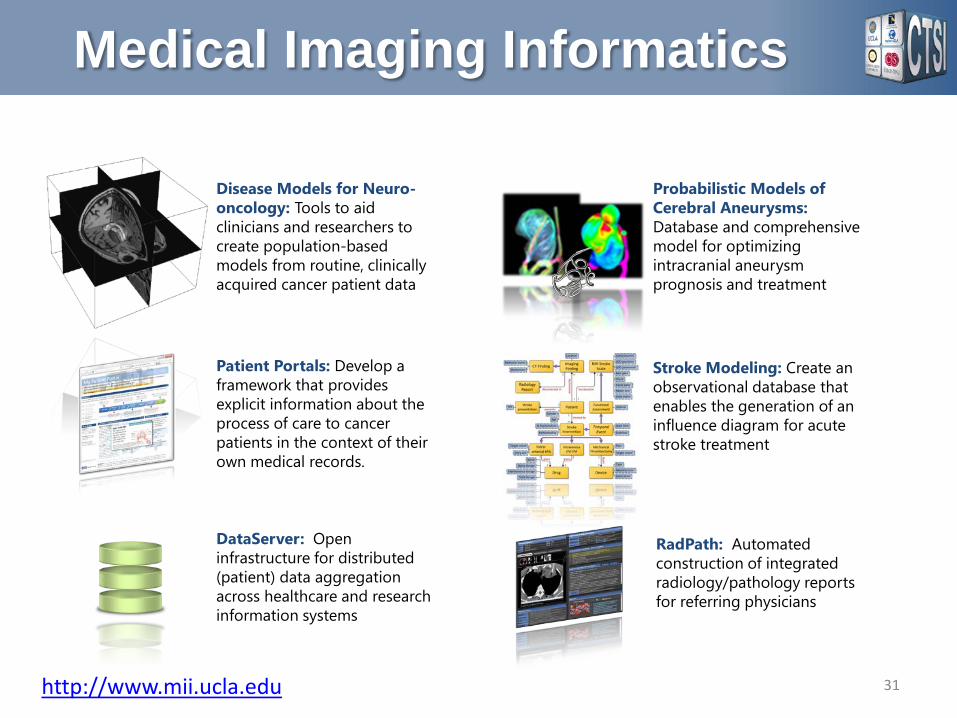
Medical Imaging Informatics
31
Stroke Modeling: Create an observational database that enables the generation of an influence diagram for acute stroke treatment
Disease Models for Neuro-oncology: Tools to aid clinicians and researchers to create population-based models from routine, clinically acquired cancer patient data
Patient Portals: Develop a framework that provides explicit information about the process of care to cancer patients in the context of their own medical records.
Probabilistic Models of Cerebral Aneurysms: Database and comprehensive model for optimizing intracranial aneurysm prognosis and treatment
RadPath: Automated construction of integrated radiology/pathology reports for referring physicians
DataServer: Open infrastructure for distributed (patient) data aggregation across healthcare and research information systems
http://www.mii.ucla.edu
Thank You
William Hsu, PhD Medical Imaging Informatics Group
Dept of Radiological Sciences [email protected]
http://www.mii.ucla.edu/~willhsu
32