CTM Analysis
5
Customer Name: ABC Company Per Per Conversion: 100 ft3 1,000 gallons 100 ft 3 to 1,000 gallons Total Tons: 2000 Water Cost: $0.00 $2.00 $2.67 Annual Water Usage: 0 9600.0 7180.8 Avg. Run Days Per Year: 365 Avg. Run Time Per Day (Hours): 18 % Run Time Per Year in Months: 12.0 Waste Water Cost: $0.00 $4.00 $5.35 Avg. Percentage Load: 40.00% Annual Waste Water: 0 9600.0 7180.8 Delta T: 6 Avg. Cycles of Concentration: 10 Total Current Water/Waste Cost: $0 $57,600 $57,600 % of Water Used by Tower @ Average COC: 88% Too Few Cycles Target Zone Too Many Cycles Water Demand 7 8 9 10 11 12 13 14 Make Up 6,622,560 6,487,406 6,386,040 6,307,200 6,244,128 6,192,524 6,149,520 6,113,132 Blow Down 946,080 810,926 709,560 630,720 567,648 516,044 473,040 436,652 Evaporation 5,676,480 5,676,480 5,676,480 5,676,480 5,676,480 5,676,480 5,676,480 5,676,480 Utility Customer Costs 7 8 9 10 11 12 13 14 Make-Up Water Cost 17,707 $ 17,346 $ 17,075 $ 16,864 $ 16,696 $ 16,558 $ 16,443 $ 16,345 $ Waste Water Cost 35,415 $ 34,692 $ 34,150 $ 33,728 $ 33,391 $ 33,115 $ 32,885 $ 32,691 $ Total Cost BEFORE Credit 53,122 $ 52,038 $ 51,225 $ 50,593 $ 50,087 $ 49,673 $ 49,328 $ 49,036 $ Financial Benefit of Additional Cycles - $ 1,084 $ 813 $ 632 $ 506 $ 414 $ 345 $ 292 $ Estimated Evaporation Credit 30,356 $ 30,356 $ 30,356 $ 30,356 $ 30,356 $ 30,356 $ 30,356 $ 30,356 $ Total Cost After Proposed Credit 22,767 $ 21,683 $ 20,869 $ 20,237 $ 19,731 $ 19,317 $ 18,972 $ 18,680 $ Actual Blowdown Cost 5,059 $ 4,337 $ 3,794 $ 3,373 $ 3,036 $ 2,760 $ 2,530 $ 2,335 $ Total Cost AFTER Credit 22,767 $ 21,683 $ 20,869 $ 20,237 $ 19,731 $ 19,317 $ 18,972 $ 18,680 $ Financial Benefit of Additional Cycles - $ 1,084 $ 813 $ 632 $ 506 $ 414 $ 345 $ 292 $ Cycles of Concentration Used in Analysis Below: 10 ANNUAL ANALYSIS: MONTHLY ANALYSIS: $16,864 Make-Up Water Cost Make-Up Water Cost $1,405 $33,728 Waste Water Cost Waste Water Cost $2,811 $50,593 Total Cost Prior to Credit Total Cost Prior to Credit $4,216 $30,356 LESS: Annual Evaporation Credit LESS: Monthly Evaporation Credit $2,530 $20,237 Total Cost After Proposed Credit Total Cost After Proposed Credit $1,686 $3,373 Actual Blowdown Cost After Credit Actual Blowdown Cost After Credit $281 Make-Up vs. Evaporation Analysis Water Usage / Waste Water Savings Analysis Cooling Tower Analysis Cooling Tower System Data 6,487,406 6,386,040 6,307,200 6,244,128 810,926 709,560 630,720 567,648 5,676,480 5,676,480 5,676,480 5,676,480 0 1,000,000 2,000,000 3,000,000 4,000,000 5,000,000 6,000,000 7,000,000 8 9 10 11 Make Up Blow Down Evaporation $17,346 $17,075 $16,864 $16,696 $34,692 $34,150 $33,728 $33,391 $52,038 $51,225 $50,593 $50,087 $30,356 $30,356 $30,356 $30,356 $21,683 $20,869 $20,237 $19,731 $- $10,000 $20,000 $30,000 $40,000 $50,000 $60,000 8 9 10 11 Cycles of Concentration Make-Up Water Cost Waste Water Cost Total Cost BEFORE Cre Estimated Evaporation Total Cost After Propose Hereʼs is the Cooling Tower Analysis that is generated once the proper information has been entered into the site survey...
-
Upload
princetongreenorg -
Category
Documents
-
view
214 -
download
0
description
screen shots of the CTM analysis
Transcript of CTM Analysis

Customer Name: ABC CompanyPer Per Conversion: 100 ft3
1,000 gallons 100 ft3 to 1,000 gallons Total Tons: 2000 Water Cost: $0.00 $2.00 $2.67
Annual Water Usage: 0 9600.0 7180.8Avg. Run Days Per Year: 365
Avg. Run Time Per Day (Hours): 18% Run Time Per Year in Months: 12.0
Waste Water Cost: $0.00 $4.00 $5.35Avg. Percentage Load: 40.00% Annual Waste Water: 0 9600.0 7180.8
Delta T: 6Avg. Cycles of Concentration: 10 Total Current Water/Waste Cost: $0 $57,600 $57,600
% of Water Used by Tower @ Average COC: 88%
Too Few Cycles Target Zone Too Many CyclesWater Demand 7 8 9 10 11 12 13 14
Make Up 6,622,560 6,487,406 6,386,040 6,307,200 6,244,128 6,192,524 6,149,520 6,113,132 Blow Down 946,080 810,926 709,560 630,720 567,648 516,044 473,040 436,652
Evaporation 5,676,480 5,676,480 5,676,480 5,676,480 5,676,480 5,676,480 5,676,480 5,676,480
Utility Customer Costs 7 8 9 10 11 12 13 14Make-Up Water Cost 17,707$ 17,346$ 17,075$ 16,864$ 16,696$ 16,558$ 16,443$ 16,345$
Waste Water Cost 35,415$ 34,692$ 34,150$ 33,728$ 33,391$ 33,115$ 32,885$ 32,691$ Total Cost BEFORE Credit 53,122$ 52,038$ 51,225$ 50,593$ 50,087$ 49,673$ 49,328$ 49,036$
Financial Benefit of Additional Cycles -$ 1,084$ 813$ 632$ 506$ 414$ 345$ 292$
Estimated Evaporation Credit 30,356$ 30,356$ 30,356$ 30,356$ 30,356$ 30,356$ 30,356$ 30,356$ Total Cost After Proposed Credit 22,767$ 21,683$ 20,869$ 20,237$ 19,731$ 19,317$ 18,972$ 18,680$
Actual Blowdown Cost 5,059$ 4,337$ 3,794$ 3,373$ 3,036$ 2,760$ 2,530$ 2,335$ Total Cost AFTER Credit 22,767$ 21,683$ 20,869$ 20,237$ 19,731$ 19,317$ 18,972$ 18,680$
Financial Benefit of Additional Cycles -$ 1,084$ 813$ 632$ 506$ 414$ 345$ 292$
Cycles of Concentration Used in Analysis Below: 10
ANNUAL ANALYSIS: MONTHLY ANALYSIS:
$16,864 Make-Up Water Cost Make-Up Water Cost $1,405
$33,728 Waste Water Cost Waste Water Cost $2,811
$50,593 Total Cost Prior to Credit Total Cost Prior to Credit $4,216
$30,356 LESS: Annual Evaporation Credit LESS: Monthly Evaporation Credit $2,530
$20,237 Total Cost After Proposed Credit Total Cost After Proposed Credit $1,686
$3,373 Actual Blowdown Cost After Credit Actual Blowdown Cost After Credit $281
Make-Up vs. Evaporation Analysis
Water Usage / Waste Water Savings Analysis
Cooling Tower Analysis
Cooling Tower System Data
6,48
7,40
6
6,38
6,04
0
6,30
7,20
0
6,24
4,12
8
810,
926
709,
560
630,
720
567,
648
5,67
6,48
0
5,67
6,48
0
5,67
6,48
0
5,67
6,48
0
0
1,000,000
2,000,000
3,000,000
4,000,000
5,000,000
6,000,000
7,000,000
8 9 10 11
Make Up
Blow Down
Evaporation
$17
,346
$17
,075
$16
,864
$16
,696
$34
,692
$34
,150
$33
,728
$33
,391
$52
,038
$51
,225
$50
,593
$50
,087
$30
,356
$30
,356
$30
,356
$30
,356
$21
,683
$20
,869
$20
,237
$19
,731
$-
$10,000
$20,000
$30,000
$40,000
$50,000
$60,000
8 9 10 11 Cycles of Concentration
Make-Up Water Cost
Waste Water Cost
Total Cost BEFORE Credit
Estimated Evaporation Credit
Total Cost After Proposed Credit
Hereʼs is the Cooling Tower Analysis that is generated once the proper information has been entered into the site survey...
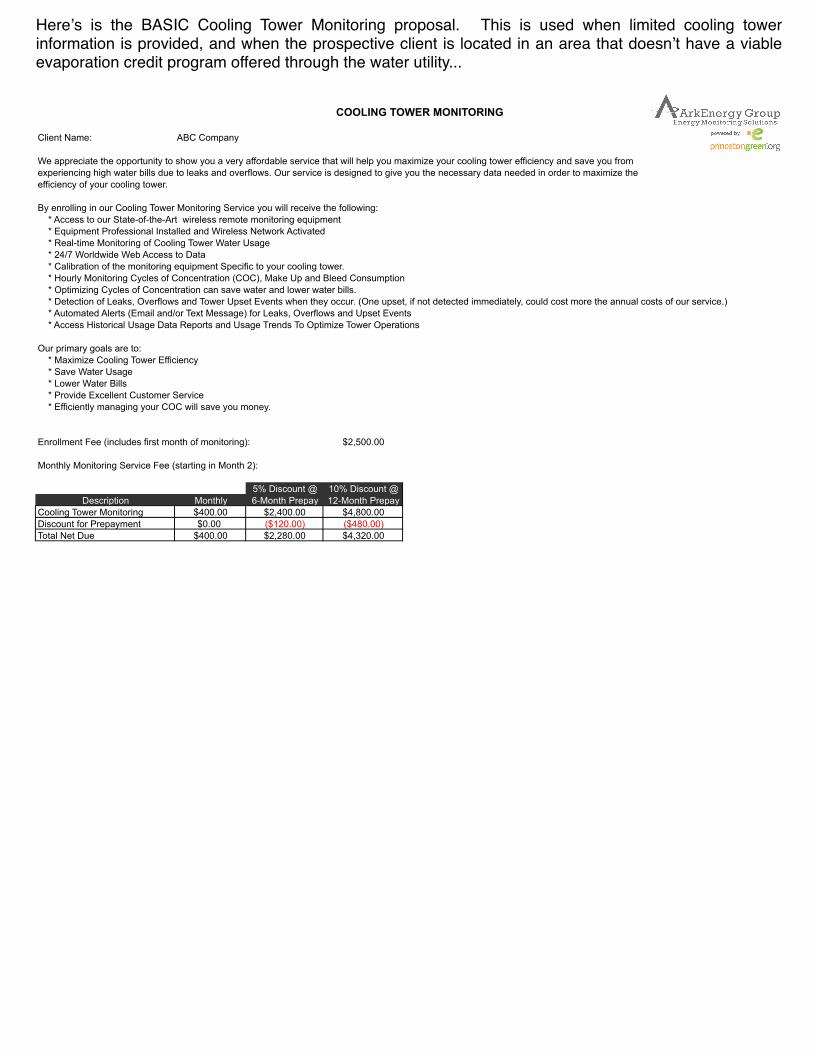
COOLING TOWER MONITORING
Client Name: ABC Company
We appreciate the opportunity to show you a very affordable service that will help you maximize your cooling tower efficiency and save you from experiencing high water bills due to leaks and overflows. Our service is designed to give you the necessary data needed in order to maximize theefficiency of your cooling tower.
By enrolling in our Cooling Tower Monitoring Service you will receive the following: * Access to our State-of-the-Art wireless remote monitoring equipment * Equipment Professional Installed and Wireless Network Activated * Real-time Monitoring of Cooling Tower Water Usage * 24/7 Worldwide Web Access to Data * Calibration of the monitoring equipment Specific to your cooling tower. * Hourly Monitoring Cycles of Concentration (COC), Make Up and Bleed Consumption * Optimizing Cycles of Concentration can save water and lower water bills. * Detection of Leaks, Overflows and Tower Upset Events when they occur. (One upset, if not detected immediately, could cost more the annual costs of our service.) * Automated Alerts (Email and/or Text Message) for Leaks, Overflows and Upset Events * Access Historical Usage Data Reports and Usage Trends To Optimize Tower Operations
Our primary goals are to: * Maximize Cooling Tower Efficiency * Save Water Usage * Lower Water Bills * Provide Excellent Customer Service * Efficiently managing your COC will save you money.
Enrollment Fee (includes first month of monitoring): $2,500.00
Monthly Monitoring Service Fee (starting in Month 2):
5% Discount @ 10% Discount @Description Monthly 6-Month Prepay 12-Month Prepay
Cooling Tower Monitoring $400.00 $2,400.00 $4,800.00Discount for Prepayment $0.00 ($120.00) ($480.00)Total Net Due $400.00 $2,280.00 $4,320.00
Hereʼs is the BASIC Cooling Tower Monitoring proposal. This is used when limited cooling tower information is provided, and when the prospective client is located in an area that doesnʼt have a viable evaporation credit program offered through the water utility...

COOLING TOWER MONITORING
Client Name: ABC Company
We appreciate the opportunity to show you a very affordable service that will help you maximize your cooling tower efficiency and save you from experiencing high water bills due to leaks and overflows. Our service is designed to give you the necessary data needed in order to maximize theefficiency of your cooling tower.
By enrolling in our Cooling Tower Monitoring Service you will receive the following benefits: * Access to our State-of-the-Art wireless remote monitoring equipment * Equipment Professional Installed and Wireless Network Activated * Real-time Monitoring of Cooling Tower Water Usage * 24/7 Worldwide Web Access to Data * Calibration of the monitoring equipment Specific to your cooling tower. * Hourly Monitoring Cycles of Concentration (COC), Make Up and Bleed Consumption * Optimizing Cycles of Concentration can save water and lower water bills. * Detection of Leaks, Overflows and Tower Upset Events when they occur. (One upset, if not detected immediately, could cost more the annual costs of our service.) * Automated Alerts (Email and/or Text Message) for Leaks, Overflows and Upset Events * Access Historical Usage Data Reports and Usage Trends To Optimize Tower Operations
Our primary goals are to: * Maximize Cooling Tower Efficiency * Save Water Usage * Lower Water Bills * Provide Excellent Customer Service * Efficiently managing your COC will save you money.
Enrollment Fee (includes first month of monitoring): $2,500.00
Monthly Monitoring Service Fee (starting in Month 2):
5% Discount @ 10% Discount @Description Monthly 6-Month Prepay 12-Month Prepay
Cooling Tower Monitoring $400.00 $2,400.00 $4,800.00Discount for Prepayment $0.00 ($120.00) ($480.00)Total Net Due $400.00 $2,280.00 $4,320.00
Cycles of Concentration Analysis: Evaporation remains constant regardless of water usage. Therefore, effectively managing your Cycles of Concentration (COC) will save you water and money.Simply compare your current cycles to the respective number of cycles to determine estimates savings (negative numbers) by increasing the number of cycles,or determine the estimate cost (positive numbers) by decreasing the number of cycles.
Annual Costs (+) or Savings (-) Differential Based on Adjusting the Cycles of Concentration Current Cycles Current Cost 2 Cycles 3 Cycles 4 Cycles 5 Cycles 6 Cycles 7 Cycles 8 Cycles 9 Cycles
2 Cycles $53,122.14 $0.00 ($1,084.13) ($1,897.22) ($2,529.63) ($3,035.55) ($3,449.49) ($3,794.44) ($4,086.32)Incremental Costs/Savings $0.00 ($1,084.13) ($813.09) ($632.41) ($505.93) ($413.94) ($344.95) ($291.88)
3 Cycles $52,038.01 $1,084.13 $0.00 ($813.09) ($1,445.50) ($1,951.43) ($2,365.36) ($2,710.31) ($3,002.19)Incremental Costs/Savings $1,084.13 $0.00 ($813.09) ($632.41) ($505.93) ($413.94) ($344.95) ($291.88)
4 Cycles $51,224.92 $1,897.22 $813.09 $0.00 ($632.41) ($1,138.33) ($1,552.27) ($1,897.22) ($2,189.10)Incremental Costs/Savings $1,084.13 $813.09 $0.00 ($632.41) ($505.93) ($413.94) ($344.95) ($291.88)
5 Cycles $50,592.51 $2,529.63 $1,445.50 $632.41 $0.00 ($505.93) ($919.86) ($1,264.81) ($1,556.69)Incremental Costs/Savings $1,084.13 $813.09 $632.41 $0.00 ($505.93) ($413.94) ($344.95) ($291.88)
6 Cycles $50,086.59 $3,035.55 $1,951.43 $1,138.33 $505.93 $0.00 ($413.94) ($758.89) ($1,050.77)Incremental Costs/Savings $1,084.13 $813.09 $632.41 $505.93 $0.00 ($413.94) ($344.95) ($291.88)
7 Cycles $49,672.65 $3,449.49 $2,365.36 $1,552.27 $919.86 $413.94 $0.00 ($344.95) ($636.83)Incremental Costs/Savings $1,084.13 $813.09 $632.41 $505.93 $413.94 $0.00 ($344.95) ($291.88)
8 Cycles $49,327.70 $3,794.44 $2,710.31 $1,897.22 $1,264.81 $758.89 $344.95 $0.00 ($291.88)Incremental Costs/Savings $1,084.13 $813.09 $632.41 $505.93 $413.94 $344.95 $0.00 ($291.88)
9 Cycles $49,035.82 $4,086.32 $3,002.19 $2,189.10 $1,556.69 $1,050.77 $636.83 $291.88 $0.00Incremental Costs/Savings $1,084.13 $813.09 $632.41 $505.93 $413.94 $344.95 $291.88 $0.00
Overflow & Leak Analysis:The severity of an overflow or leak determines the amount of water and money being wasted. The severity is contingent upon many factors, including the size of the cooling tower, the size of the make-up and blow-down pipes, the size of the float valve, as well as the length of time the overleak or leak goes undetected. As a result,it is difficult to accurately predict the cost (both in terms of wasted water and money) of a future upset. All cooling tower upsets are wasteful. Early detection goes a longway to saving you water and money. The following analysis accounts for the annual make-up water usage, and assumes an upset is a percentage of that total usage. Eachpercentage increment takes in account the percentage of annual make-up water usage, and multiplies it by the total cost of water (water + sewer) to estimate to potentialcost of an upset. A national survey of cooling towers determined that 40% of cooling towers incur some type of upset in a given month. An upset is defined as an overflow,leak, or when the COC get thrown out of balance.
Description Parameters 1% 5% 10% 20% 40% 60% 80% 100%Annual Water Usage 7,181 72 359 718 1,436 2,872 4,308 5,745 7,181
Total Current Water/Waste Cost $57,600.00 $576.00 $2,880.00 $5,760.00 $11,520.00 $23,040.00 $34,560.00 $46,080.00 $57,600.00Total Water Cost $8.02
Water Cost $2.67 Waste Water Cost $5.35
Hereʼs is the COMPREHENSIVE Cooling Tower Monitoring proposal. This is used when adequate cooling tower information is provided. It is when the prospective client is located in an area that doesnʼt have a viable evaporation credit program offered through the water utility. And it is used in combination with the ECS Cash Flow Analysis when the prospective client is located in an area with a viable program.

Hereʼs is the Cash Flow Analysis, which is used for clients to decide which ECS program to enter. In this instance, the client enrolls directly in the Evaporation Credit Service. We work directly with the water utility to get them enrolled in the water utility program.
Evaporation Credit ServiceCash Flow Analysis
ABC Company
$2,530Estimated Annual Evaporation Credit: $30,356
ECS ECS ECSPROGRAM A PROGRAM B PROGRAM C
CTM ENROLLMENT FEE: $2,500 $2,500 $2,500ECS ENROLLMENT FEE: $0 $3,000 $6,000TOTAL INVESTMENT: * $2,500 $5,500 $8,500
EVAPORATION CREDIT SPLITS:Client % - Year 1 30% 50% 70%Client % - Subsequent Years 60% 65% 70%
AEG/pg.org % - Year 1 70% 50% 30%AEG/pg.org % - Subsuquent Years 40% 35% 30%
ESTIMATED MONTHLY CREDITS:Average Monthly Credit per Water Bill Analysis $2,530 $2,530 $2,530Average Annual Credit per Water Bill Analysis $30,356 $30,356 $30,356
YEAR 1 ESTIMATES (+/- 10%):Client % - Year 1 30% 50% 70%First Year Estimated Gross Revenue $9,107 $15,178 $21,249 LESS: Total Investment ($2,500) ($5,500) ($8,500) Net First Year Cash Flow $6,607 $9,678 $12,749 Return On Investment 364% 276% 250%
SUBSEQUENT YEARS ESTIMATES (+/- 10%):Client % - Subsequent Years 60% 65% 70%Subsequent Years Estimated Gross Revenue $18,213 $19,731 $21,249
Client 2 Year Cumulative Gross Revenue Generated $27,320 $34,909 $42,498 2 Year Return On Investment 1093% 635% 500% Average Annualized Return On Investment 546% 317% 250%
Client 3 Year Cumulative Gross Revenue Generated $45,533 $54,640 $63,747 3 Year Return On Investment 1821% 993% 750% Average Annualized Return On Investment 607% 331% 250%
Client 5 Year Cumulative Gross Revenue Generated $81,960 $94,102 $106,244 5 Year Return On Investment 3278% 1711% 1250% Average Annualized Return On Investment 656% 342% 250%
Client 10 Year Cumulative Gross Revenue Generated $173,026 $192,757 $212,489 10 Year Return On Investment 6921% 3505% 2500% Average Annualized Return On Investment 692% 350% 250%
the upfront dollars, the higher the split. ArkEnergy Group retains ownership of the equipment that is used in the
Client Name:
Estimated Monthly Evaporation Credit:
* Enroll in the program that best meets your needs. Essentially, you are buying your split. Therefore, the higher
cooling tower monitoring and calibration of the monthly credit. Customer retains ownership of any water meters that had to be installed in order for the monitoring/calibration equipment to work.
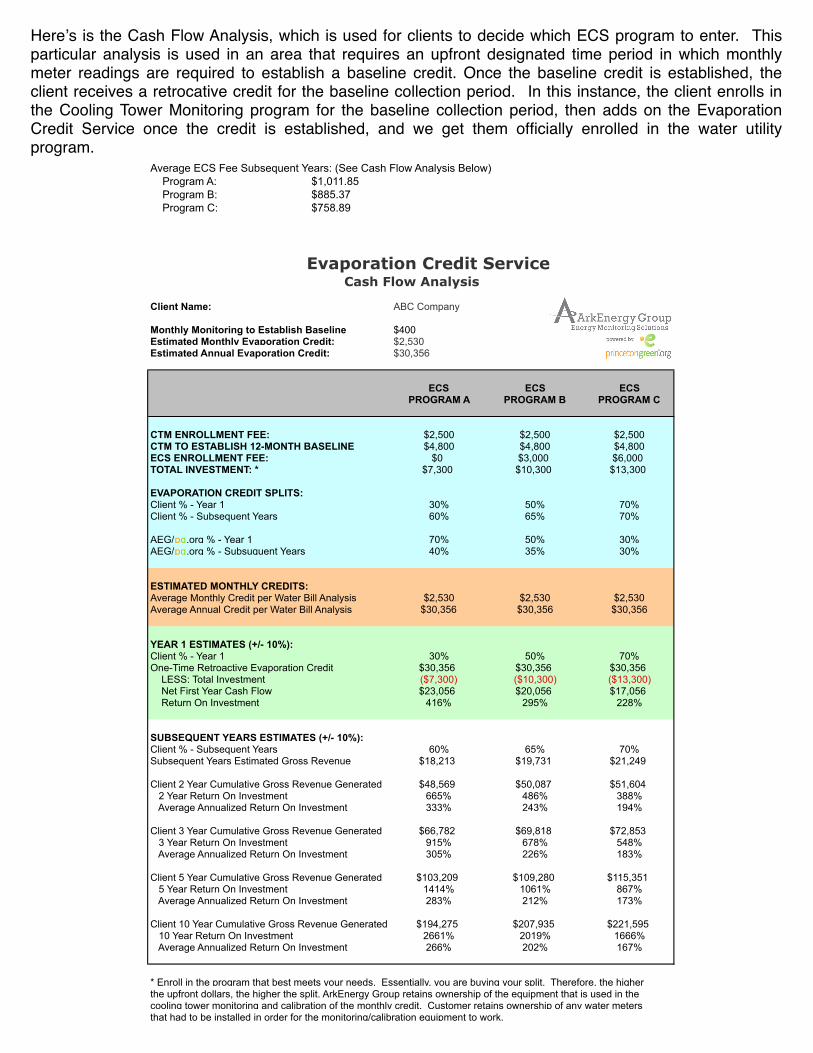
Average ECS Fee Subsequent Years: (See Cash Flow Analysis Below) Program A: $1,011.85 Program B: $885.37 Program C: $758.89
Evaporation Credit ServiceCash Flow Analysis
ABC Company
Monthly Monitoring to Establish Baseline $400$2,530
Estimated Annual Evaporation Credit: $30,356
ECS ECS ECSPROGRAM A PROGRAM B PROGRAM C
CTM ENROLLMENT FEE: $2,500 $2,500 $2,500CTM TO ESTABLISH 12-MONTH BASELINE $4,800 $4,800 $4,800ECS ENROLLMENT FEE: $0 $3,000 $6,000TOTAL INVESTMENT: * $7,300 $10,300 $13,300
EVAPORATION CREDIT SPLITS:Client % - Year 1 30% 50% 70%Client % - Subsequent Years 60% 65% 70%
AEG/pg.org % - Year 1 70% 50% 30%AEG/pg.org % - Subsuquent Years 40% 35% 30%
ESTIMATED MONTHLY CREDITS:Average Monthly Credit per Water Bill Analysis $2,530 $2,530 $2,530Average Annual Credit per Water Bill Analysis $30,356 $30,356 $30,356
YEAR 1 ESTIMATES (+/- 10%):Client % - Year 1 30% 50% 70%One-Time Retroactive Evaporation Credit $30,356 $30,356 $30,356 LESS: Total Investment ($7,300) ($10,300) ($13,300) Net First Year Cash Flow $23,056 $20,056 $17,056 Return On Investment 416% 295% 228%
SUBSEQUENT YEARS ESTIMATES (+/- 10%):Client % - Subsequent Years 60% 65% 70%Subsequent Years Estimated Gross Revenue $18,213 $19,731 $21,249
Client 2 Year Cumulative Gross Revenue Generated $48,569 $50,087 $51,604 2 Year Return On Investment 665% 486% 388% Average Annualized Return On Investment 333% 243% 194%
Client 3 Year Cumulative Gross Revenue Generated $66,782 $69,818 $72,853 3 Year Return On Investment 915% 678% 548% Average Annualized Return On Investment 305% 226% 183%
Client 5 Year Cumulative Gross Revenue Generated $103,209 $109,280 $115,351 5 Year Return On Investment 1414% 1061% 867% Average Annualized Return On Investment 283% 212% 173%
Client 10 Year Cumulative Gross Revenue Generated $194,275 $207,935 $221,595 10 Year Return On Investment 2661% 2019% 1666% Average Annualized Return On Investment 266% 202% 167%
the upfront dollars, the higher the split. ArkEnergy Group retains ownership of the equipment that is used in the
Client Name:
Estimated Monthly Evaporation Credit:
* Enroll in the program that best meets your needs. Essentially, you are buying your split. Therefore, the higher
cooling tower monitoring and calibration of the monthly credit. Customer retains ownership of any water metersthat had to be installed in order for the monitoring/calibration equipment to work.
Hereʼs is the Cash Flow Analysis, which is used for clients to decide which ECS program to enter. This particular analysis is used in an area that requires an upfront designated time period in which monthly meter readings are required to establish a baseline credit. Once the baseline credit is established, the client receives a retrocative credit for the baseline collection period. In this instance, the client enrolls in the Cooling Tower Monitoring program for the baseline collection period, then adds on the Evaporation Credit Service once the credit is established, and we get them officially enrolled in the water utility program.