CTIA Wireless 2004 Conference Georgia World Congress Convention Center Atlanta, Georgia March 22-24,...
19
CTIA Wireless 2004 Conference Georgia World Congress Convention Center Atlanta, Georgia March 22-24, 2004 OUR PLEDGE We believe that a good company should stand for a set of values that are tangible and clear-cut. In our case, this means providing good communications services at a fair price in a sensible manner. We will continue to better serve our customers as well as protect our track record of solid financial results. We will strike the right balance between delivering great value to the customer and delivering great value to our shareholders. We will continue to focus on long-term value creation by investing wisely in our business and competing aggressively in our markets. Finally, we will, as always, uphold our obligations as financial stewards for our shareholders by following the very highest financial, management and ethical standards.
-
Upload
felix-harrington -
Category
Documents
-
view
213 -
download
0
Transcript of CTIA Wireless 2004 Conference Georgia World Congress Convention Center Atlanta, Georgia March 22-24,...

CTIA Wireless 2004 ConferenceGeorgia World Congress Convention Center
Atlanta, Georgia
March 22-24, 2004
OUR PLEDGEWe believe that a good company should stand for a set of values that are tangible and clear-cut. In our case, this means providing good communications services at a fair price in a sensible manner. We will continue to better serve our customers as well as protect our track record of solid financial results. We will strike the right balance between delivering great value to the customer and delivering great value to our shareholders. We will continue to focus on long-term value creation by investing wisely in our business and competing aggressively in our markets. Finally, we will, as always, uphold our obligations as financial stewards for our shareholders by following the very highest financial, management and ethical standards.

2
This presentation includes certain estimates and other forward-looking
statements, including statements with respect to anticipated operating and
financial performance, growth opportunities and growth rates, acquisition and
divestiture opportunities, and other statements of expectation. Words such as
“expects,” “anticipates,” “intends,” “plans,” “believes,” “assumes,” “seeks,”
“estimates,” and “should,” and variations of these words and similar
expressions, are intended to identify these forward-looking statements.
Forward-looking statements are subject to uncertainties that could cause
actual future performance, outcomes and results to differ materially. These
statements by the Company and its management are based on estimates,
projections, beliefs and assumptions of management and are not guarantees
of future performance. The company disclaims any obligation to update or
revise any forward-looking statement based on the occurrence of future
events, the receipt of new information, or otherwise.
“Safe Harbor” Statement

3
Today’s presentation will include certain non-GAAP financial measures. I refer you to the Investor Relations section of ALLTEL’s Web site where the company has posted additional information regarding these non-GAAP financial measures, including a reconciliation of each such measure to the most directly comparable GAAP measure. The company’s Web site is located at www.alltel.com.
Regulation G Disclaimer

4
1 From Current Businesses - defined as Net Income + Depreciation & Amortization - Capital Expenditures (including software development)
First Quarter 2004 Highlights
• Equity Free Cash Flow1 of $328 million, an increase of 13% year-over-year
• Wireless retail revenue growth of 8%
• Wireless gross adds of 737K, best in company history
• Wireless post-pay churn of 1.93%
• Wireless net adds of 158K, best in five years
• Wireline segment income increased 2% year-over-year – despite 2% decline in revenue
• DSL net adds of 21K
• Repurchased 4.8M shares for $243M completing 1/3 of $750M plan

5
Solid Financial Performance Strategic Model Driving Consistent Growth
$5.6$6.3 $6.6
$7.1$8.0
1999 2000 2001 2002 2003
Revenue ($bn)1
$2.33 $2.44$2.59
$2.94 $3.05
1999 2000 2001 2002 2003
Diluted Earnings per Share1
$1.24$1.29 $1.33 $1.37
$1.42
1999 2000 2001 2002 2003
Dividends per Share
1 From Current Businesses
Operating Income Before Depreciation and Amortization ($bn)1
$2.3 $2.5 $2.7 $2.9$3.2
1999 2000 2001 2002 2003
CAGR = 9.3% CAGR = 8.6%
CAGR = 7.0% CAGR = 3.4%
6
0
200
400
600
800
1,000
1,200
1999 2000 2001 2002 20038%
12%
16%
20%
24%
28%
32%
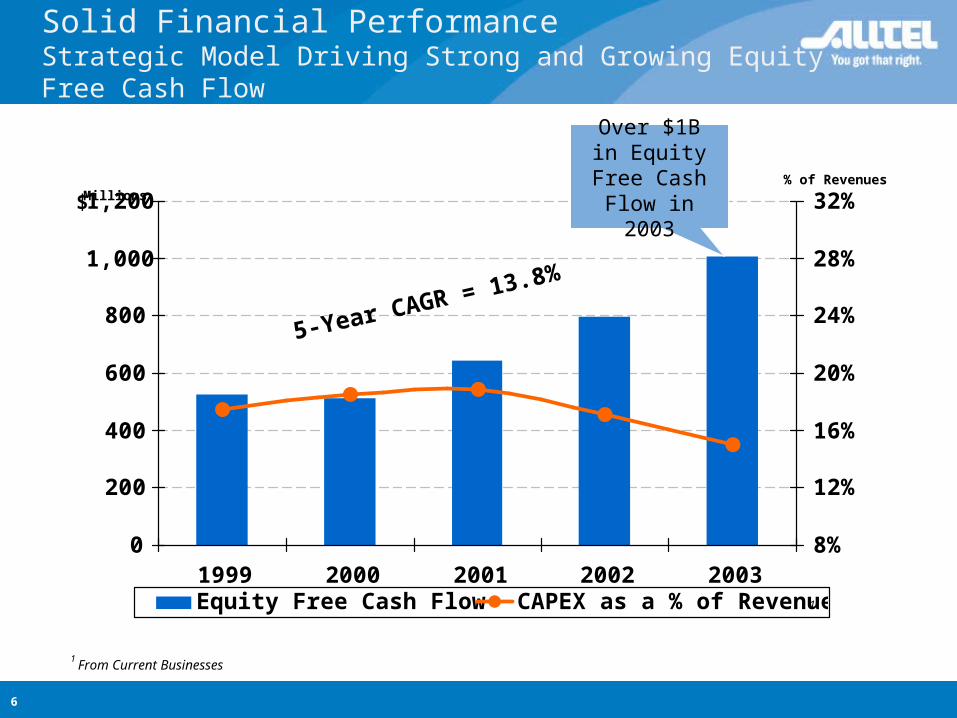
Equity Free Cash Flow CAPEX as a % of Revenues
Millions % of Revenues
$
1
Solid Financial Performance Strategic Model Driving Strong and Growing Equity Free Cash Flow
5-Year CAGR = 13.8%
Over $1B in Equity Free
Cash Flow in 2003
1 From Current Businesses

7
2003 Strategic Highlights
• Completed sale of information services business
• Significantly improved the Balance Sheet– Paid nearly $800M in long-term debt– Ended the year with more than $1B of cash and marketable
securities– Improved credit ratings – reduced net debt to total cap from 43%
to 33%1
1Assumes 80% equity credit for equity units.

8
2003 Operational Highlights
• Invested $1.2B to improve and expand our service capabilities– Further expand digital footprint– Deployed 1X wireless data technology in 10 markets– Expanded high-speed wireline technology (DSL) availability
• At year-end we served:– 8.0 million wireless customers (6% y/y growth)– 3.1 million wireline customers (2% y/y growth)– 1.7 million long-distance customers (9% y/y growth)– 153,000 DSL high-speed Internet customers (118% y/y growth)

9
2003 Financial Highlights
• Grew Equity Free Cash Flow1,2 26% to over $1 billion
• Earned a 15% Return on Equity1
• Grew Diluted EPS1 4% to $3.05
• Increased consolidated revenue 12% to $8 billion
• Grew wireless service revenue 12% to $4.5 billion
• Grew wireline revenue 12% to $2.4 billion
• Increased the dividend for the 43rd consecutive year to $1.48 per share annually, an ~3% yield
1 From Current Businesses2 Equity Free Cash Flow defined as Net Income + Depreciation & Amortization - Capital Expenditures (including software development)
10
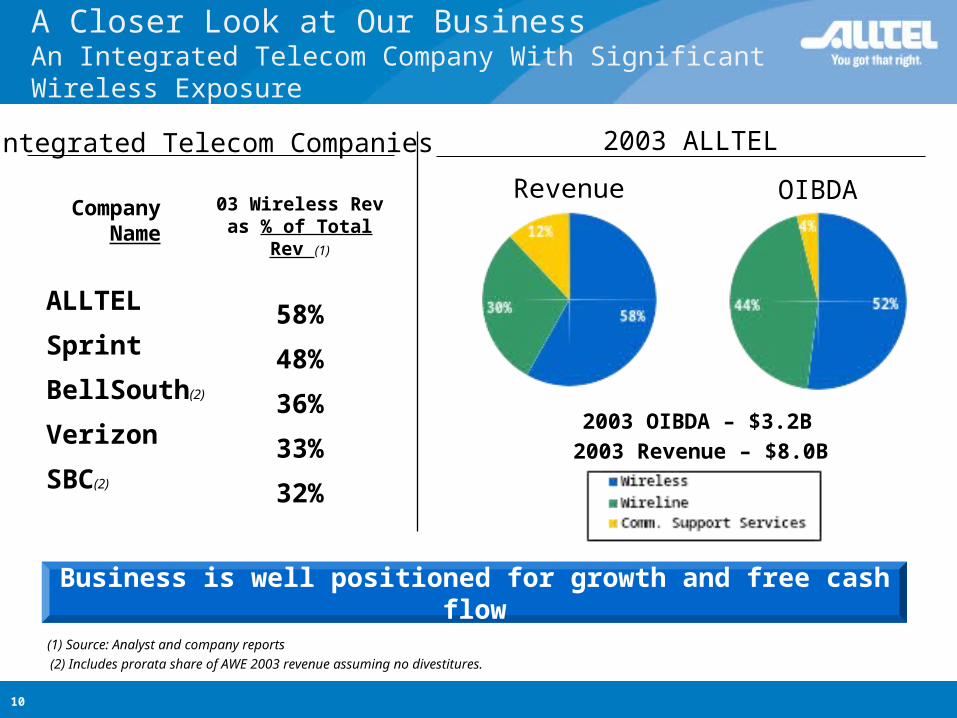
A Closer Look at Our BusinessAn Integrated Telecom Company With Significant Wireless Exposure
2003 ALLTEL
Business is well positioned for growth and free cash flow
OIBDARevenue
2003 Revenue – $8.0B
2003 OIBDA – $3.2B
Integrated Telecom Companies
Company Name
ALLTEL
Sprint
BellSouth(2)
Verizon
SBC(2)
03 Wireless Rev as % of Total Rev (1)
58%
48%
36%
33%
32%
(1) Source: Analyst and company reports
(2) Includes prorata share of AWE 2003 revenue assuming no divestitures.
11
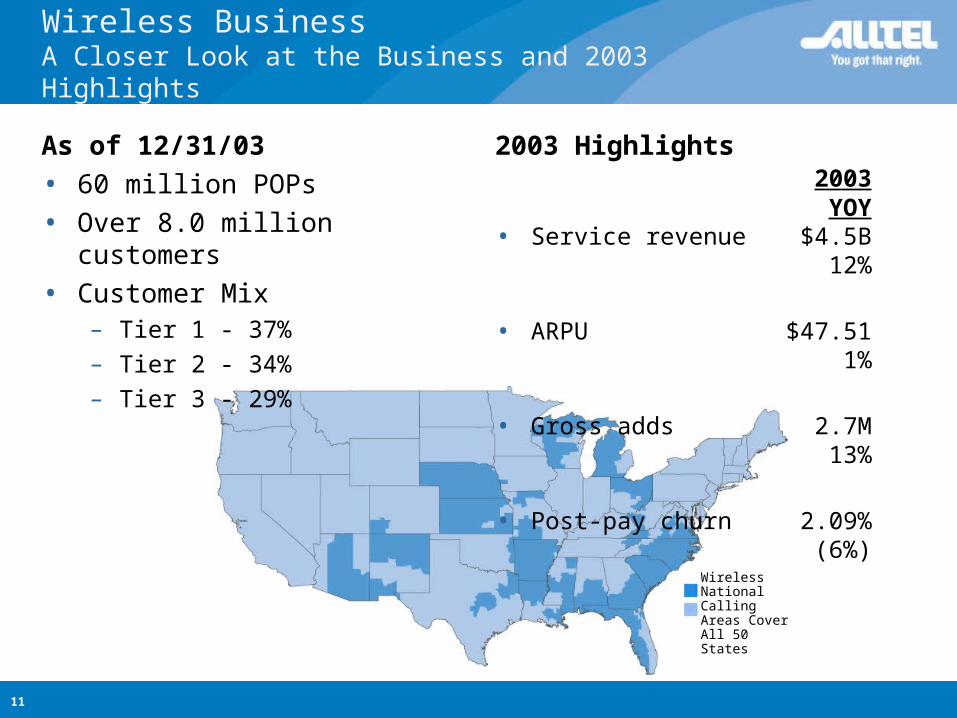
Wireless BusinessA Closer Look at the Business and 2003 Highlights
As of 12/31/03
• 60 million POPs
• Over 8.0 million customers
• Customer Mix– Tier 1 - 37%
– Tier 2 - 34%
– Tier 3 - 29%
2003 Highlights2003YOY
• Service revenue $4.5B12%
• ARPU $47.511%
• Gross adds 2.7M13%
• Post-pay churn 2.09%(6%)
WirelessNational Calling Areas Cover All 50 States

12
Cingular/AWE(a)
Verizon
Sprint(b)
T-Mobile
Nextel
ALLTEL
2003 Comparison to Wireless PeersRevenue and Income Metrics Per Customer
Source: Analyst and company reports(a) Estimates for Cingular/AWE assuming no divestitures(b) Excludes affiliates(c) Customers as of 12/31/03 Note: Expense categories exclude one-time charges.
Customers(In Millions)(c)
46.0
37.5
17.5
13.1
12.9
8.0
ARPU(Service Rev)
$54
$49
$61
$53
$69
$48
CCPU(Exc Acq Costs)
$28
$21
$31
$26
$26
$21
Monthly Op. Income
Per Customer
$6
$9
$4
$1
$16
$11
SCALE IS LOCAL

13
Wireline BusinessA Closer Look at the Business and 2003 Highlights
As of 12/31/03
• 2nd largest independent ILEC
• Approximately 3.1 million customer lines
• Approximately 50% of wireline access lines overlap wireless service areas
WirelessWirelineNational Calling Areas Cover All 50 States
2003 Highlights2003 YOY
• Revenue $2.4B 12%
• Segment income $884M 10%
• DSL net adds 83K 93%
14
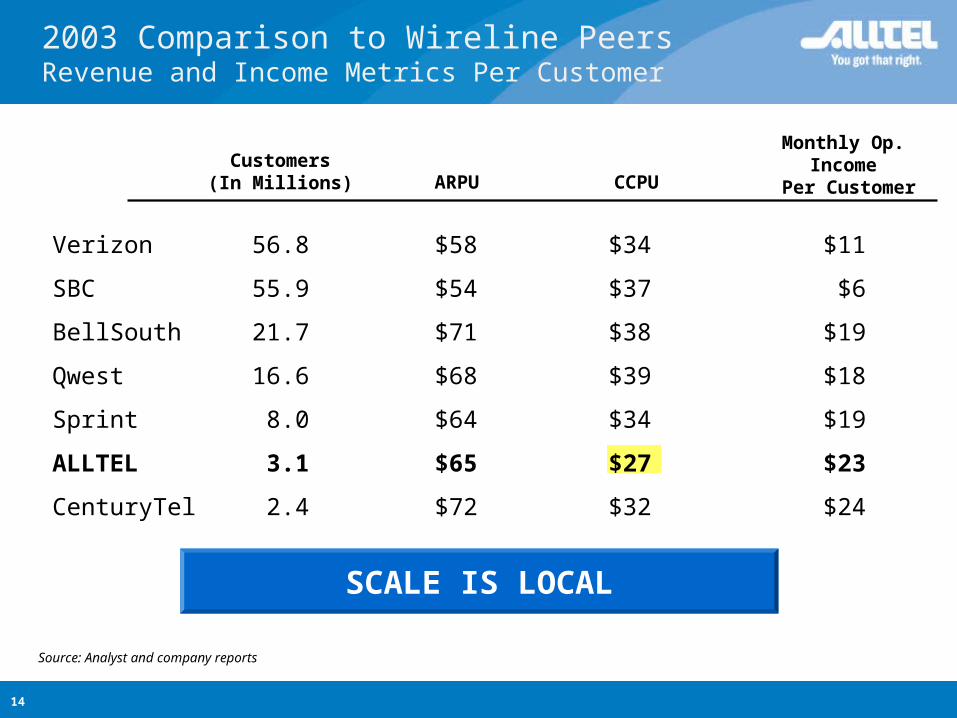
2003 Comparison to Wireline PeersRevenue and Income Metrics Per Customer
Source: Analyst and company reports
SCALE IS LOCAL
Customers(In Millions) ARPU CCPU
Monthly Op. Income
Per Customer
Verizon 56.8 $58 $34 $11
SBC 55.9 $54 $37 $6
BellSouth 21.7 $71 $38 $19
Qwest 16.6 $68 $39 $18
Sprint 8.0 $64 $34 $19
ALLTEL 3.1 $65 $27 $23
CenturyTel 2.4 $72 $32 $24

15
Reconciliation of Non-GAAP Financial Measuresfor the three months ended March 31
Equity Free Cash Flow(Dollars in millions) 2004 2003
Net cash provided from operations 551.5$ 546.9$ Adjustments to reconcile to net income under GAAP:
Income from discontinued operations - 37.1
Cumulative effect of accounting change - 15.6
Depreciation and amortization expense (321.3) (303.5)
Provision for doubtful accounts (42.6) (52.8)
Non-cash portion of restructuring and other charges (25.6) -
Increase in deferred income taxes (72.2) (78.0)
Other non-cash changes, net 2.9 1.8
Changes in operating assets and liabilities, net of the
effects of acquisitions and dispositions 97.1 113.2
Net income under GAAP 189.8 280.3
Adjustments to reconcile to net income from current businesses:
Restructuring and other charges, net of tax 31.7 -
Cumulative effect of accounting change - (15.6)
Income from discontinued operations - (37.1)
Net income from current businesses 221.5 227.6
Adjustments to reconcile to equity free cash flow from current businesses:
Depreciation and amortization expense 321.3 303.5
Capital expenditures (215.2) (241.3)
Equity free cash flow from current businesses 327.6$ 289.8$

16
Reconciliation of Non-GAAP Financial Measuresfor the years ended December 31, 2003, 2002, 2001, 2000 and 1999:
Revenues and sales from Current Businesses(Dollars in millions) 2003 2002 2001 2000 1999Revenues and sales under GAAP 7,979.9$ 7,112.4$ 6,615.7$ 6,308.9$ 5,634.9$ Items excluded from measuring results from current businesses: Litigation settlement - - - 11.5 - Revenues and sales from current businesses 7,979.9$ 7,112.4$ 6,615.7$ 6,320.4$ 5,634.9$
OIBDA from Current Businesses(Dollars in millions) 2003 2002 2001 2000 1999Operating income under GAAP 1,898.0$ 1,719.6$ 1,548.7$ 1,536.2$ 1,386.6$ Items excluded from measuring results from current businesses: Write-down of receivables due to interexchange carrier's bankruptcy filing - 14.0 - - - Litigation settlement - - - 11.5 - Merger and integration expenses and other charges 19.0 69.9 76.3 15.3 90.5 Operating income from current businesses 1,917.0 1,803.5 1,625.0 1,563.0 1,477.1 Depreciation and amortization expense 1,247.7 1,095.5 1,082.0 903.7 777.5 OIBDA from current businesses 3,164.7$ 2,899.0$ 2,707.0$ 2,466.7$ 2,254.6$
Diluted Earnings per Share from Current Businesses2003 2002 2001 2000 1999
Diluted earnings per share under GAAP $4.25 $2.96 $3.40 $6.08 $2.47Items excluded from measuring results from current businesses, net of tax: Write-down of receivables due to interexchange carrier's bankruptcy filing - .03 - - - Net financing costs related to prefunding the Company's wireline and wireless acquisitions - .05 - - - Litigation settlement - - - .02 - Merger and integration expenses and other charges .04 .14 .14 .02 .20 Provision to reduce carrying value of certain assets - - - - - Gain on disposal of assets (.06) (.03) (.68) (3.57) (.08) Write-down of investments .01 .03 - .03 - Termination fees on early retirement of long-term debt .01 - .01 - - Discontinued operations (1.15) (.24) (.22) (.26) (.26) Cumulative effect of accounting change (.05) - (.06) .12 - Diluted earnings per share from current businesses $3.05 $2.94 $2.59 $2.44 $2.33
For the years ended December 31
For the years ended December 31
For the years ended December 31
17
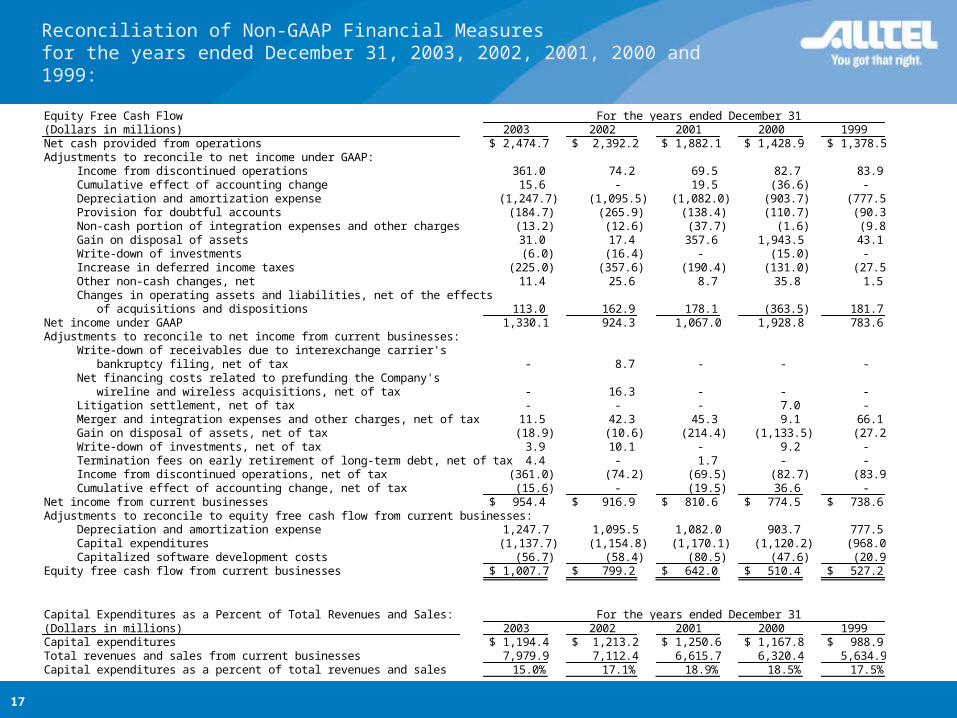
Reconciliation of Non-GAAP Financial Measuresfor the years ended December 31, 2003, 2002, 2001, 2000 and 1999:
Equity Free Cash Flow(Dollars in millions) 2003 2002 2001 2000 1999Net cash provided from operations 2,474.7$ 2,392.2$ 1,882.1$ 1,428.9$ 1,378.5$ Adjustments to reconcile to net income under GAAP: Income from discontinued operations 361.0 74.2 69.5 82.7 83.9 Cumulative effect of accounting change 15.6 - 19.5 (36.6) - Depreciation and amortization expense (1,247.7) (1,095.5) (1,082.0) (903.7) (777.5) Provision for doubtful accounts (184.7) (265.9) (138.4) (110.7) (90.3) Non-cash portion of integration expenses and other charges (13.2) (12.6) (37.7) (1.6) (9.8) Gain on disposal of assets 31.0 17.4 357.6 1,943.5 43.1 Write-down of investments (6.0) (16.4) - (15.0) - Increase in deferred income taxes (225.0) (357.6) (190.4) (131.0) (27.5) Other non-cash changes, net 11.4 25.6 8.7 35.8 1.5 Changes in operating assets and liabilities, net of the effects of acquisitions and dispositions 113.0 162.9 178.1 (363.5) 181.7 Net income under GAAP 1,330.1 924.3 1,067.0 1,928.8 783.6 Adjustments to reconcile to net income from current businesses: Write-down of receivables due to interexchange carrier's bankruptcy filing, net of tax - 8.7 - - - Net financing costs related to prefunding the Company's wireline and wireless acquisitions, net of tax - 16.3 - - - Litigation settlement, net of tax - - - 7.0 - Merger and integration expenses and other charges, net of tax 11.5 42.3 45.3 9.1 66.1 Gain on disposal of assets, net of tax (18.9) (10.6) (214.4) (1,133.5) (27.2) Write-down of investments, net of tax 3.9 10.1 - 9.2 - Termination fees on early retirement of long-term debt, net of tax 4.4 - 1.7 - - Income from discontinued operations, net of tax (361.0) (74.2) (69.5) (82.7) (83.9) Cumulative effect of accounting change, net of tax (15.6) - (19.5) 36.6 - Net income from current businesses 954.4$ 916.9$ 810.6$ 774.5$ 738.6$ Adjustments to reconcile to equity free cash flow from current businesses: Depreciation and amortization expense 1,247.7 1,095.5 1,082.0 903.7 777.5 Capital expenditures (1,137.7) (1,154.8) (1,170.1) (1,120.2) (968.0) Capitalized software development costs (56.7) (58.4) (80.5) (47.6) (20.9) Equity free cash flow from current businesses 1,007.7$ 799.2$ 642.0$ 510.4$ 527.2$
Capital Expenditures as a Percent of Total Revenues and Sales:(Dollars in millions) 2003 2002 2001 2000 1999Capital expenditures 1,194.4$ 1,213.2$ 1,250.6$ 1,167.8$ 988.9$ Total revenues and sales from current businesses 7,979.9 7,112.4 6,615.7 6,320.4 5,634.9 Capital expenditures as a percent of total revenues and sales 15.0% 17.1% 18.9% 18.5% 17.5%
For the years ended December 31
For the years ended December 31
18
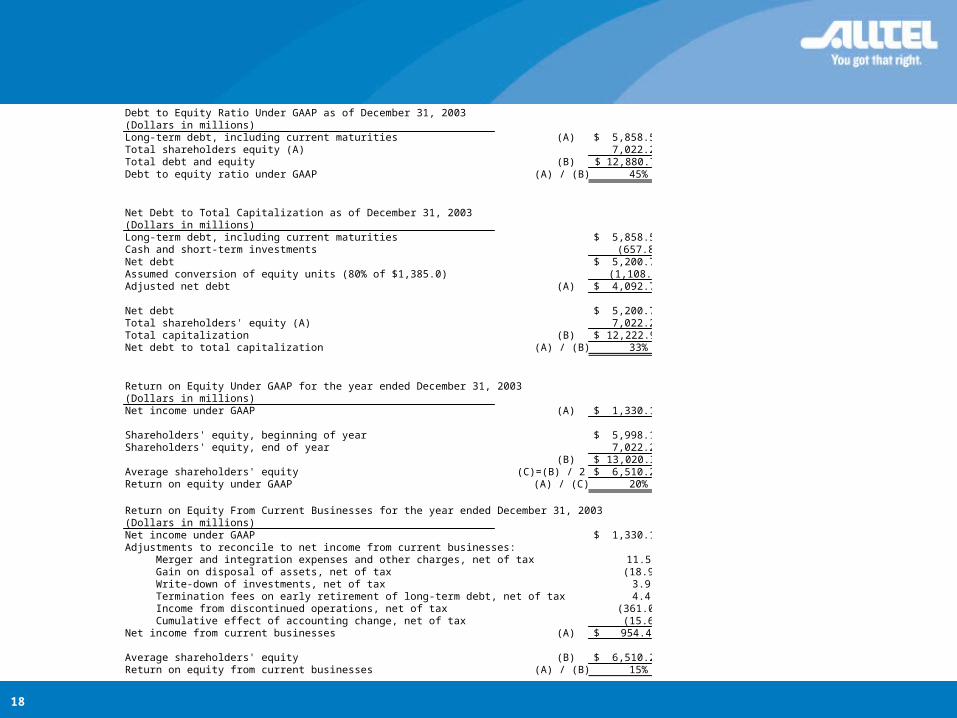
Debt to Equity Ratio Under GAAP as of December 31, 2003(Dollars in millions)Long-term debt, including current maturities (A) 5,858.5$ Total shareholders equity (A) 7,022.2 Total debt and equity (B) 12,880.7$ Debt to equity ratio under GAAP (A) / (B) 45%
Net Debt to Total Capitalization as of December 31, 2003(Dollars in millions)Long-term debt, including current maturities 5,858.5$ Cash and short-term investments (657.8) Net debt 5,200.7$ Assumed conversion of equity units (80% of $1,385.0) (1,108.0) Adjusted net debt (A) 4,092.7$
Net debt 5,200.7$ Total shareholders' equity (A) 7,022.2 Total capitalization (B) 12,222.9$ Net debt to total capitalization (A) / (B) 33%
Return on Equity Under GAAP for the year ended December 31, 2003(Dollars in millions)Net income under GAAP (A) 1,330.1$
Shareholders' equity, beginning of year 5,998.1$ Shareholders' equity, end of year 7,022.2
(B) 13,020.3$ Average shareholders' equity (C)=(B) / 2 6,510.2$ Return on equity under GAAP (A) / (C) 20%
Return on Equity From Current Businesses for the year ended December 31, 2003(Dollars in millions)Net income under GAAP 1,330.1$ Adjustments to reconcile to net income from current businesses: Merger and integration expenses and other charges, net of tax 11.5 Gain on disposal of assets, net of tax (18.9) Write-down of investments, net of tax 3.9 Termination fees on early retirement of long-term debt, net of tax 4.4 Income from discontinued operations, net of tax (361.0) Cumulative effect of accounting change, net of tax (15.6) Net income from current businesses (A) 954.4$
Average shareholders' equity (B) 6,510.2$ Return on equity from current businesses (A) / (B) 15%

CTIA Wireless 2004 ConferenceGeorgia World Congress Convention Center
Atlanta, Georgia
March 22-24, 2004
OUR PLEDGEWe believe that a good company should stand for a set of values that are tangible and clear-cut. In our case, this means providing good communications services at a fair price in a sensible manner. We will continue to better serve our customers as well as protect our track record of solid financial results. We will strike the right balance between delivering great value to the customer and delivering great value to our shareholders. We will continue to focus on long-term value creation by investing wisely in our business and competing aggressively in our markets. Finally, we will, as always, uphold our obligations as financial stewards for our shareholders by following the very highest financial, management and ethical standards.