CTGA 2006 Seq Anl 1.final Current Topics in Genome Analysis 2006 Biological Sequence Analysis I 9...
40
NHGRI Current Topics in Genome Analysis 2006 Biological Sequence Analysis I 1 Overview Overview • Week 2: Comparative methods and concepts Week 2: Comparative methods and concepts • Similarity Similarity vs vs . . Homology Homology • Global Global vs vs. Local Alignments Local Alignments • Scoring Matrices Scoring Matrices • BLAST BLAST • BLAT BLAT • Week 3: Predictive methods and concepts Week 3: Predictive methods and concepts • Profiles, patterns, motifs, and domains Profiles, patterns, motifs, and domains • Secondary structure prediction Secondary structure prediction • Structures: VAST, Cn3D, and Structures: VAST, Cn3D, and de novo de novo prediction prediction Why do sequence alignments? Why do sequence alignments? • Provide a measure of relatedness between Provide a measure of relatedness between nucleotide or amino acid sequences nucleotide or amino acid sequences • Determining relatedness allows one to draw Determining relatedness allows one to draw biological inferences regarding biological inferences regarding • structural relationships structural relationships • functional relationships functional relationships • evolutionary relationships evolutionary relationships importance of using correct terminology importance of using correct terminology
Transcript of CTGA 2006 Seq Anl 1.final Current Topics in Genome Analysis 2006 Biological Sequence Analysis I 9...

NHGRI Current Topics in Genome Analysis 2006Biological Sequence Analysis I
1
OverviewOverview•• Week 2: Comparative methods and conceptsWeek 2: Comparative methods and concepts
•• Similarity Similarity vsvs. . HomologyHomology•• GlobalGlobal vsvs.. Local Alignments Local Alignments•• Scoring MatricesScoring Matrices•• BLASTBLAST•• BLATBLAT
•• Week 3: Predictive methods and conceptsWeek 3: Predictive methods and concepts•• Profiles, patterns, motifs, and domainsProfiles, patterns, motifs, and domains•• Secondary structure predictionSecondary structure prediction•• Structures: VAST, Cn3D, and Structures: VAST, Cn3D, and de novode novo prediction prediction
Why do sequence alignments?Why do sequence alignments?•• Provide a measure of relatedness betweenProvide a measure of relatedness between
nucleotide or amino acid sequencesnucleotide or amino acid sequences
•• Determining relatedness allows one to drawDetermining relatedness allows one to drawbiological inferences regardingbiological inferences regarding•• structural relationshipsstructural relationships•• functional relationshipsfunctional relationships•• evolutionary relationshipsevolutionary relationships
importance of using correct terminologyimportance of using correct terminology

NHGRI Current Topics in Genome Analysis 2006Biological Sequence Analysis I
2
Defining the TermsDefining the Terms•• The quantitative measure: The quantitative measure: SimilaritySimilarity
•• Always based on an observableAlways based on an observable•• Usually expressed as percent identityUsually expressed as percent identity•• Quantify changes that occur as two sequences divergeQuantify changes that occur as two sequences diverge
•• substitutionssubstitutions•• insertionsinsertions•• deletionsdeletions
•• Identify residues crucial for maintaining a proteinIdentify residues crucial for maintaining a protein’’ssstructure or functionstructure or function
•• High degrees of sequence similarity High degrees of sequence similarity mightmight imply imply•• a common evolutionary historya common evolutionary history•• possible commonality in biological functionpossible commonality in biological function
Defining the TermsDefining the Terms•• The conclusion: The conclusion: HomologyHomology
•• Genes Genes areare or or are notare not homologous homologous(not measured in degrees)(not measured in degrees)
•• Homology implies an evolutionary relationshipHomology implies an evolutionary relationship
•• The term The term ““homologhomolog”” may apply to the may apply to therelationshiprelationship•• between genes separated by the event of speciationbetween genes separated by the event of speciation
((orthologyorthology))•• between genes separated by the event of geneticbetween genes separated by the event of genetic
duplication (duplication (paralogyparalogy))

NHGRI Current Topics in Genome Analysis 2006Biological Sequence Analysis I
3
Defining the TermsDefining the Terms•• OrthologsOrthologs
•• Sequences are direct descendants of a sequence in aSequences are direct descendants of a sequence in acommon ancestorcommon ancestor
•• Most likely have similar domain structure, three-Most likely have similar domain structure, three-dimensional structure, and biological functiondimensional structure, and biological function
•• ParalogsParalogs•• Related through a gene duplication eventRelated through a gene duplication event•• Provides insight into Provides insight into ““evolutionary innovationevolutionary innovation””
(adapting a pre-existing gene product for a new(adapting a pre-existing gene product for a newfunction)function)
Defining the TermsDefining the Terms
A1
B2
C3
α
OrthologsOrthologs
Most recentMost recentcommon ancestorcommon ancestor

NHGRI Current Topics in Genome Analysis 2006Biological Sequence Analysis I
4
Defining the TermsDefining the Terms
A1
B2
C3
A4
B5
C6
α β
OrthologsOrthologs
•• Genes 1-3 are Genes 1-3 are orthologousorthologous•• Genes 4-6 areGenes 4-6 are orthologous orthologous•• Any pair of Any pair of αα and and ββ genes are genes are paralogousparalogous
(genes related through a gene duplication event)(genes related through a gene duplication event)
Gene duplicationGene duplication
ParalogsParalogs
Most recentMost recentcommon ancestorcommon ancestor
OverviewOverview•• Week 2: Comparative methods and conceptsWeek 2: Comparative methods and concepts
•• Similarity Similarity vsvs. . HomologyHomology•• GlobalGlobal vsvs.. Local Alignments Local Alignments•• Scoring MatricesScoring Matrices•• BLASTBLAST•• BLATBLAT
•• Week 3: Predictive methods and conceptsWeek 3: Predictive methods and concepts•• Profiles, patterns, motifs, and domainsProfiles, patterns, motifs, and domains•• Secondary structure predictionSecondary structure prediction•• Structures: VAST, Cn3D, and Structures: VAST, Cn3D, and de novode novo prediction prediction

NHGRI Current Topics in Genome Analysis 2006Biological Sequence Analysis I
5
Global Sequence AlignmentsGlobal Sequence Alignments•• Sequence comparison along the entire length ofSequence comparison along the entire length of
the two sequences being alignedthe two sequences being aligned•• Best for highly-similar sequences of similarBest for highly-similar sequences of similar
lengthlength•• As the degree of sequence similarity declines,As the degree of sequence similarity declines,
global alignment methods tend to miss importantglobal alignment methods tend to miss importantbiological relationshipsbiological relationships
Local Sequence AlignmentsLocal Sequence Alignments•• Sequence comparison intended to find the mostSequence comparison intended to find the most
similar regions in the two sequences beingsimilar regions in the two sequences beingaligned (aligned (““paired subsequencespaired subsequences””))
•• Regions outside the area of local alignment areRegions outside the area of local alignment areexcludedexcluded
•• More than one local alignment could beMore than one local alignment could begenerated for any two sequences being comparedgenerated for any two sequences being compared
•• Best for sequences that share some similarity, orBest for sequences that share some similarity, orfor sequences of different lengthsfor sequences of different lengths

NHGRI Current Topics in Genome Analysis 2006Biological Sequence Analysis I
6
OverviewOverview•• Week 2: Comparative methods and conceptsWeek 2: Comparative methods and concepts
•• Similarity Similarity vsvs. . HomologyHomology•• GlobalGlobal vsvs.. Local Alignments Local Alignments•• Scoring MatricesScoring Matrices•• BLASTBLAST•• BLATBLAT
•• Week 3: Predictive methods and conceptsWeek 3: Predictive methods and concepts•• Profiles, patterns, motifs, and domainsProfiles, patterns, motifs, and domains•• Secondary structure predictionSecondary structure prediction•• Structures: VAST, Cn3D, and Structures: VAST, Cn3D, and de novode novo prediction prediction
Scoring MatricesScoring Matrices•• Empirical weighting scheme representingEmpirical weighting scheme representing
physicochemical and biological characteristicsphysicochemical and biological characteristicsofof nucleotides and amino acidsnucleotides and amino acids•• Side chain structure and chemistrySide chain structure and chemistry•• Side chainSide chain function function
•• Amino acid-based examples:Amino acid-based examples:•• Cys/Pro Cys/Pro important for structure and functionimportant for structure and function•• Trp Trp has bulky side chainhas bulky side chain•• Lys/Arg Lys/Arg have positively-charged side chainshave positively-charged side chains

NHGRI Current Topics in Genome Analysis 2006Biological Sequence Analysis I
7
Scoring MatricesScoring Matrices•• Conservation:Conservation: What residues can substitute forWhat residues can substitute for
another residue and not adversely affect theanother residue and not adversely affect thefunction of the protein?function of the protein?•• Ile/Val Ile/Val - both small and hydrophobic- both small and hydrophobic•• Ser/Thr Ser/Thr - both polar- both polar•• Conserve charge, size, Conserve charge, size, hydrophobicityhydrophobicity,,
other physicochemical factorsother physicochemical factors
•• Frequency:Frequency: How often does a particular residue How often does a particular residueoccur amongst the entire constellation ofoccur amongst the entire constellation ofproteins?proteins?
Scoring MatricesScoring Matrices•• Why is understanding scoring matricesWhy is understanding scoring matrices
important?important?
•• Appear in all analyses involving sequenceAppear in all analyses involving sequencecomparisoncomparison
•• Implicitly represent particular evolutionary patternsImplicitly represent particular evolutionary patterns
•• Choice of matrix can strongly influence outcomes ofChoice of matrix can strongly influence outcomes ofanalysesanalyses

NHGRI Current Topics in Genome Analysis 2006Biological Sequence Analysis I
8
Matrix Structure: NucleotidesMatrix Structure: Nucleotides A T G C S W R Y K M B V H D NA 5 -4 -4 -4 -4 1 1 -4 -4 1 -4 -1 -1 -1 -2T -4 5 -4 -4 -4 1 -4 1 1 -4 -1 -4 -1 -1 -2G -4 -4 5 -4 1 -4 1 -4 1 -4 -1 -1 -4 -1 -2C -4 -4 -4 5 1 -4 -4 1 -4 1 -1 -1 -1 -4 -2S -4 -4 1 1 -1 -4 -2 -2 -2 -2 -1 -1 -3 -3 -1W 1 1 -4 -4 -4 -1 -2 -2 -2 -2 -3 -3 -1 -1 -1R 1 -4 1 -4 -2 -2 -1 -4 -2 -2 -3 -1 -3 -1 -1Y -4 1 -4 1 -2 -2 -4 -1 -2 -2 -1 -3 -1 -3 -1K -4 1 1 -4 -2 -2 -2 -2 -1 -4 -1 -3 -3 -1 -1M 1 -4 -4 1 -2 -2 -2 -2 -4 -1 -3 -1 -1 -3 -1B -4 -1 -1 -1 -1 -3 -3 -1 -1 -3 -1 -2 -2 -2 -1V -1 -4 -1 -1 -1 -3 -1 -3 -3 -1 -2 -1 -2 -2 -1H -1 -1 -4 -1 -3 -1 -3 -1 -3 -1 -2 -2 -1 -2 -1D -1 -1 -1 -4 -3 -1 -1 -3 -1 -3 -2 -2 -2 -1 -1N -2 -2 -2 -2 -1 -1 -1 -1 -1 -1 -1 -1 -1 -1 -1
•• Simple match/mismatch scoringSimple match/mismatch scoring scheme:scheme:MatchMatch + 5+ 5MismatchMismatch –– 4 4
•• Assumes each nucleotide occurs 25% of the timeAssumes each nucleotide occurs 25% of the time
Matrix Structure: ProteinsMatrix Structure: Proteins A R N D C Q E G H I L K M F P S T W Y V B Z X *A 4 -1 -2 -2 0 -1 -1 0 -2 -1 -1 -1 -1 -2 -1 1 0 -3 -2 0 -2 -1 0 -4R -1 5 0 -2 -3 1 0 -2 0 -3 -2 2 -1 -3 -2 -1 -1 -3 -2 -3 -1 0 -1 -4N -2 0 6 1 -3 0 0 0 1 -3 -3 0 -2 -3 -2 1 0 -4 -2 -3 3 0 -1 -4D -2 -2 1 6 -3 0 2 -1 -1 -3 -4 -1 -3 -3 -1 0 -1 -4 -3 -3 4 1 -1 -4C 0 -3 -3 -3 9 -3 -4 -3 -3 -1 -1 -3 -1 -2 -3 -1 -1 -2 -2 -1 -3 -3 -2 -4Q -1 1 0 0 -3 5 2 -2 0 -3 -2 1 0 -3 -1 0 -1 -2 -1 -2 0 3 -1 -4E -1 0 0 2 -4 2 5 -2 0 -3 -3 1 -2 -3 -1 0 -1 -3 -2 -2 1 4 -1 -4G 0 -2 0 -1 -3 -2 -2 6 -2 -4 -4 -2 -3 -3 -2 0 -2 -2 -3 -3 -1 -2 -1 -4H -2 0 1 -1 -3 0 0 -2 8 -3 -3 -1 -2 -1 -2 -1 -2 -2 2 -3 0 0 -1 -4I -1 -3 -3 -3 -1 -3 -3 -4 -3 4 2 -3 1 0 -3 -2 -1 -3 -1 3 -3 -3 -1 -4L -1 -2 -3 -4 -1 -2 -3 -4 -3 2 4 -2 2 0 -3 -2 -1 -2 -1 1 -4 -3 -1 -4K -1 2 0 -1 -3 1 1 -2 -1 -3 -2 5 -1 -3 -1 0 -1 -3 -2 -2 0 1 -1 -4M -1 -1 -2 -3 -1 0 -2 -3 -2 1 2 -1 5 0 -2 -1 -1 -1 -1 1 -3 -1 -1 -4F -2 -3 -3 -3 -2 -3 -3 -3 -1 0 0 -3 0 6 -4 -2 -2 1 3 -1 -3 -3 -1 -4P -1 -2 -2 -1 -3 -1 -1 -2 -2 -3 -3 -1 -2 -4 7 -1 -1 -4 -3 -2 -2 -1 -2 -4S 1 -1 1 0 -1 0 0 0 -1 -2 -2 0 -1 -2 -1 4 1 -3 -2 -2 0 0 0 -4T 0 -1 0 -1 -1 -1 -1 -2 -2 -1 -1 -1 -1 -2 -1 1 5 -2 -2 0 -1 -1 0 -4W -3 -3 -4 -4 -2 -2 -3 -2 -2 -3 -2 -3 -1 1 -4 -3 -2 11 2 -3 -4 -3 -2 -4Y -2 -2 -2 -3 -2 -1 -2 -3 2 -1 -1 -2 -1 3 -3 -2 -2 2 7 -1 -3 -2 -1 -4V 0 -3 -3 -3 -1 -2 -2 -3 -3 3 1 -2 1 -1 -2 -2 0 -3 -1 4 -3 -2 -1 -4B -2 -1 3 4 -3 0 1 -1 0 -3 -4 0 -3 -3 -2 0 -1 -4 -3 -3 4 1 -1 -4Z -1 0 0 1 -3 3 4 -2 0 -3 -3 1 -1 -3 -1 0 -1 -3 -2 -2 1 4 -1 -4X 0 -1 -1 -1 -2 -1 -1 -1 -1 -1 -1 -1 -1 -1 -2 0 0 -2 -1 -1 -1 -1 -1 -4* -4 -4 -4 -4 -4 -4 -4 -4 -4 -4 -4 -4 -4 -4 -4 -4 -4 -4 -4 -4 -4 -4 -4 1
BLOSUM62BLOSUM62

NHGRI Current Topics in Genome Analysis 2006Biological Sequence Analysis I
9
PAM MatricesPAM Matrices•• MargaretMargaret Dayhoff Dayhoff and colleagues, 1978and colleagues, 1978
•• Look at patterns of substitutions in highly relatedLook at patterns of substitutions in highly relatedproteins (> 85% similar) within multiple sequenceproteins (> 85% similar) within multiple sequencealignmentsalignments
•• Analysis documented 1572 changes in 71 groups ofAnalysis documented 1572 changes in 71 groups ofproteins examinedproteins examined
•• Substitution tables constructed based on results ofSubstitution tables constructed based on results ofthis analysisthis analysis
•• Given high degree of similarityGiven high degree of similarity within originalwithin originalsequence set, results representsequence set, results represent substitution patternsubstitution patternthat would be expected over short evolutionarythat would be expected over short evolutionarydistancesdistances
PAM MatricesPAM Matrices•• Short evolutionary distanceShort evolutionary distance∴∴ change in function unlikelychange in function unlikely
•• Point Accepted Mutation (PAM)Point Accepted Mutation (PAM)•• The new side chain must function the same way asThe new side chain must function the same way as
the old one (the old one (““acceptanceacceptance””))•• On average, 1 PAM corresponds to 1 amino acidOn average, 1 PAM corresponds to 1 amino acid
change per 100 residueschange per 100 residues•• 1 PAM ~ 1% divergence1 PAM ~ 1% divergence•• Extrapolate to predict patterns at longer evolutionaryExtrapolate to predict patterns at longer evolutionary
distancesdistances

NHGRI Current Topics in Genome Analysis 2006Biological Sequence Analysis I
10
PAM Matrices: AssumptionsPAM Matrices: Assumptions•• All sites assumed to be equally mutable,All sites assumed to be equally mutable,
not accounting for conserved blocks or motifsnot accounting for conserved blocks or motifs
•• Replacement of amino acids is independent ofReplacement of amino acids is independent ofprevious mutations at the same positionprevious mutations at the same position
•• ReplacementReplacement is independent of surroundingis independent of surroundingresiduesresidues
•• Forces responsible for sequence evolution overForces responsible for sequence evolution overshorter time spans are the same asshorter time spans are the same as those overthose overlonger time spanslonger time spans
PAM Matrices: Sources of ErrorPAM Matrices: Sources of Error•• Small, globular proteins of average compositionSmall, globular proteins of average composition
used to derive matricesused to derive matrices
•• Errors in PAM 1 are magnified up to PAM 250Errors in PAM 1 are magnified up to PAM 250(only PAM 1 is based on direct observation)(only PAM 1 is based on direct observation)
NHGRI Current Topics in Genome Analysis 2006Biological Sequence Analysis I
11
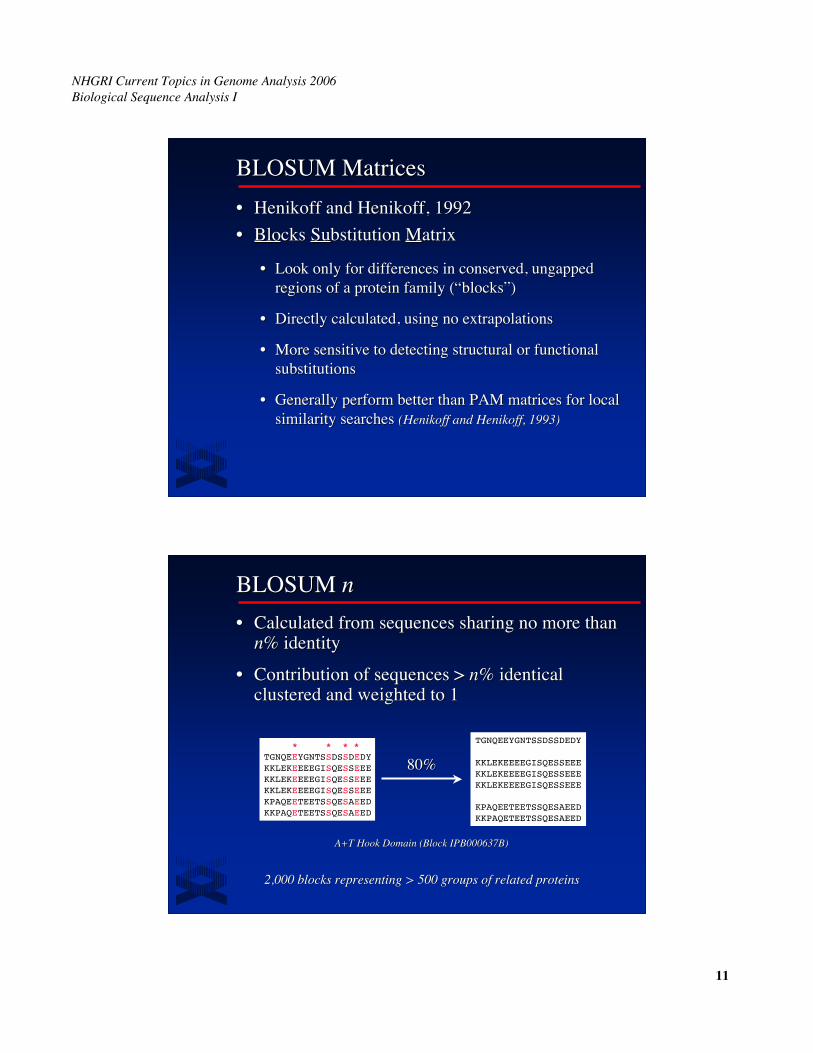
BLOSUM MatricesBLOSUM Matrices•• Henikoff Henikoff andand Henikoff Henikoff, 1992, 1992•• BloBlocks cks SuSubstitution bstitution MMatrixatrix
•• Look only for differences in conserved,Look only for differences in conserved, ungapped ungappedregions of a protein family (regions of a protein family (““blocksblocks””))
•• Directly calculated, using no extrapolationsDirectly calculated, using no extrapolations
•• More sensitive to detecting structural or functionalMore sensitive to detecting structural or functionalsubstitutionssubstitutions
•• Generally perform better than PAM matrices for localGenerally perform better than PAM matrices for localsimilarity searches similarity searches ((Henikoff Henikoff and and HenikoffHenikoff, 1993), 1993)
BLOSUM BLOSUM nn•• Calculated from sequences sharing no more thanCalculated from sequences sharing no more than
nn% identity% identity
•• Contribution of sequences > Contribution of sequences > nn% identical% identicalclustered and weighted to 1clustered and weighted to 1
* * * ** * * *TGNQEEYGNTSSDSSDEDYKKLEKEEEEGISQESSEEEKKLEKEEEEGISQESSEEEKKLEKEEEEGISQESSEEEKPAQEETEETSSQESAEEDKKPAQETEETSSQESAEED
TGNQEEYGNTSSDSSDEDY
KKLEKEEEEGISQESSEEEKKLEKEEEEGISQESSEEEKKLEKEEEEGISQESSEEE
KPAQEETEETSSQESAEEDKKPAQETEETSSQESAEED
80%80%
A+T Hook Domain (Block IPB000637B)A+T Hook Domain (Block IPB000637B)
2,000 blocks representing > 500 groups of related proteins2,000 blocks representing > 500 groups of related proteins

NHGRI Current Topics in Genome Analysis 2006Biological Sequence Analysis I
12
BLOSUM BLOSUM nn•• Clustering reduces contribution of closely-Clustering reduces contribution of closely-
related sequences (less bias towards substitutionsrelated sequences (less bias towards substitutionsthat occur in the most closely-related membersthat occur in the most closely-related membersof a family)of a family)
•• Substitution frequencies are more heavily-Substitution frequencies are more heavily-influenced by sequences that are more divergentinfluenced by sequences that are more divergentthan this cutoffthan this cutoff
•• Reducing Reducing nn yields more distantly-related yields more distantly-relatedsequencessequences
So many matrices...So many matrices...Triple-PAM Strategy Triple-PAM Strategy ((AltschulAltschul, 1991), 1991)
PAM 40PAM 40 Short alignments, highly similar Short alignments, highly similar 70-90%70-90%PAM 160PAM 160 Detecting known members of a protein familyDetecting known members of a protein family 50-60%50-60%PAM 250PAM 250 Longer, weaker local alignments Longer, weaker local alignments ~ 30%~ 30%
BLOSUM BLOSUM ((HenikoffHenikoff, 1993), 1993)
BLOSUM 90BLOSUM 90 Short alignments, highly similarShort alignments, highly similar 70-90%70-90%BLOSUM 80BLOSUM 80 Detecting known members of a protein family Detecting known members of a protein family 50-60%50-60%BLOSUM 62BLOSUM 62 Most effective in finding all potential similaritiesMost effective in finding all potential similarities 30-40%30-40%BLOSUM 30BLOSUM 30 Longer, weaker local alignmentsLonger, weaker local alignments < 30%< 30%

NHGRI Current Topics in Genome Analysis 2006Biological Sequence Analysis I
13
So many matrices...So many matrices...•• Matrix EquivalenciesMatrix Equivalencies
PAM 250PAM 250 ~~ BLOSUM 45BLOSUM 45
PAM 160PAM 160 ~~ BLOSUM 62BLOSUM 62
PAM 120PAM 120 ~~ BLOSUM 80BLOSUM 80
•• Specialized matricesSpecialized matrices•• Transmembrane Transmembrane proteinsproteins•• Species-specific matricesSpecies-specific matrices
Wheeler, 2003Wheeler, 2003
So many matrices...So many matrices...
No single matrix isNo single matrix isthe complete answer forthe complete answer for
all sequence comparisonsall sequence comparisons

NHGRI Current Topics in Genome Analysis 2006Biological Sequence Analysis I
14
GapsGaps•• Compensate for insertions and deletionsCompensate for insertions and deletions
•• Used to improve alignments between twoUsed to improve alignments between twosequencessequences
•• Must be kept to a reasonable number, to notMust be kept to a reasonable number, to notreflect a biological implausible scenarioreflect a biological implausible scenario(~1 gap per 20 residues good rule-of-thumb)(~1 gap per 20 residues good rule-of-thumb)
•• Cannot be scored simply as a Cannot be scored simply as a ““matchmatch”” or a or a““mismatchmismatch””
Affine Gap PenaltyAffine Gap PenaltyFixed deduction for introducing a gap Fixed deduction for introducing a gap plusplusan additional deduction proportional to the length of the gapan additional deduction proportional to the length of the gap
Deduction for a gap = Deduction for a gap = GG + + LnLn
nucnuc proprowhere where GG = = gap-opening penaltygap-opening penalty 55 1111
LL = = gap-extension penaltygap-extension penalty 22 11andand nn = = length of the gaplength of the gap
Can adjust scores to make gap insertion more or lessCan adjust scores to make gap insertion more or lesspermissive, but most programs will use values of permissive, but most programs will use values of GG and and LLmost appropriate for the scoring matrix selectedmost appropriate for the scoring matrix selected

NHGRI Current Topics in Genome Analysis 2006Biological Sequence Analysis I
15
OverviewOverview•• Week 2: Comparative methods and conceptsWeek 2: Comparative methods and concepts
•• Similarity Similarity vsvs. . HomologyHomology•• GlobalGlobal vsvs.. Local Alignments Local Alignments•• Scoring MatricesScoring Matrices•• BLASTBLAST•• BLATBLAT
•• Week 3: Predictive methods and conceptsWeek 3: Predictive methods and concepts•• Profiles, patterns, motifs, and domainsProfiles, patterns, motifs, and domains•• Secondary structure predictionSecondary structure prediction•• Structures: VAST, Cn3D, and Structures: VAST, Cn3D, and de novode novo prediction prediction
BLASTBLAST•• BBasic asic LLocal ocal AAlignment lignment SSearch earch TToolool
•• Seeks high-scoring segment pairs (HSP)Seeks high-scoring segment pairs (HSP)•• pair of sequences that can be aligned with one anotherpair of sequences that can be aligned with one another•• when aligned, have maximal aggregate scorewhen aligned, have maximal aggregate score
(score cannot be improved by extension or trimming)(score cannot be improved by extension or trimming)•• score must be above scorescore must be above score threshhold threshhold SS•• gapped or gapped or ungappedungapped
•• Results not limited to the Results not limited to the ““best HSPbest HSP”” for any for anygiven sequence pairgiven sequence pair

NHGRI Current Topics in Genome Analysis 2006Biological Sequence Analysis I
16
BLAST AlgorithmsBLAST Algorithms
Program Query Sequence Target Sequence
BLASTN Nucleotide Nucleotide
BLASTP Protein Protein
BLASTX Nucleotide, Proteinsix-frame translation
TBLASTN Protein Nucleotide,six-frame translation
TBLASTX Nucleotide, Nucleotide,six-frame translation six-frame translation
Neighborhood WordsNeighborhood WordsQuery Word (Query Word (WW = 3) = 3)
Neighborhood ScoreNeighborhood ScoreThresholdThreshold((TT = 13) = 13)
Query: GSQSLAALLNKCKTPQGQRLVNQWIKQPLMDKNRIEERLNLVEAFVED
PQG 18PEG 15PRG 14PKG 14PNG 13PDG 13PHG 13PMG 13PSG 13PQA 12PQN 12etc.
NeighborhoodNeighborhoodWordsWords
= 7 + 5 + 6= 7 + 5 + 6

NHGRI Current Topics in Genome Analysis 2006Biological Sequence Analysis I
17
High-Scoring Segment PairsHigh-Scoring Segment Pairs
Query: 325 SLAALLNKCKTPQGQRLVNQWIKQPLMDKNRIEERLNLVEA 365 +LA++L TP+G R++ +W+ +P+ D + ER + ASbjct: 290 TLASVLDCTVTPMGSRMLKRWLHMPVRDTRVLLERQQTIGA 330
PQG 18PEG 15PRG 14PKG 14PNG 13PDG 13PHG 13PMG 13PSG 13PQA 12PQN 12etc.
ExtensionExtension
Extension
Cum
ulat
ive S
core
T
S
XX Significance decaySignificance decay•• mismatches mismatches•• gap penalties gap penalties
Query: 325 SLAALLNKCKTPQGQRLVNQWIKQPLMDKNRIEERLNLVEA 365 +LA++L TP+G R++ +W+ +P+ D + ER + ASbjct: 290 TLASVLDCTVTPMGSRMLKRWLHMPVRDTRVLLERQQTIGA 330

NHGRI Current Topics in Genome Analysis 2006Biological Sequence Analysis I
18
Scores and ProbabilitiesScores and Probabilities
Extension
Cum
ulat
ive S
core
T
S
X
Karlin-Altschul Karlin-Altschul EquationEquation
E = E = kmNekmNe--λλSS
mm # letters in query# letters in queryNN # letters in database# letters in databasemNmN size of search spacesize of search spaceλλSS normalized scorenormalized scorekk minor constantminor constant
Query: 325 SLAALLNKCKTPQGQRLVNQWIKQPLMDKNRIEERLNLVEA 365 +LA++L TP+G R++ +W+ +P+ D + ER + ASbjct: 290 TLASVLDCTVTPMGSRMLKRWLHMPVRDTRVLLERQQTIGA 330
Scores and ProbabilitiesScores and Probabilities
Extension
Cum
ulat
ive S
core
T
S
X
E = E = kmNekmNe--λλSS
Number ofNumber of HSPs HSPsfound purely by chancefound purely by chanceLower values signifyLower values signifyhigher similarityhigher similarity
Query: 325 SLAALLNKCKTPQGQRLVNQWIKQPLMDKNRIEERLNLVEA 365 +LA++L TP+G R++ +W+ +P+ D + ER + ASbjct: 290 TLASVLDCTVTPMGSRMLKRWLHMPVRDTRVLLERQQTIGA 330

NHGRI Current Topics in Genome Analysis 2006Biological Sequence Analysis I
19
Scores and ProbabilitiesScores and Probabilities
ExtensionExtension
Cum
ulat
ive S
core
Cum
ulat
ive S
core
TT
SS
XX
Query: 325 SLAALLNKCKTPQGQRLVNQWIKQPLMDKNRIEERLNLVEA 365 +LA++L TP+G R++ +W+ +P+ D + ER + ASbjct: 290 TLASVLDCTVTPMGSRMLKRWLHMPVRDTRVLLERQQTIGA 330
E E < 1010-6-6
for nucleotidesfor nucleotidesE E < 1010-3-3
for proteinsfor proteins
http://www.http://www.ncbincbi..nlmnlm..nihnih..govgov

NHGRI Current Topics in Genome Analysis 2006Biological Sequence Analysis I
20
http://www.http://www.ncbincbi..nlmnlm..nihnih..gov/BLASTgov/BLAST
Available protein databases include:
nr Non-redundantrefseq Reference Sequencesswissprot SWISS-PROTpat Patentspdb Protein Data Bankenv_nr Environmental samplesmonth Last 30 days

NHGRI Current Topics in Genome Analysis 2006Biological Sequence Analysis I
21
Low-Complexity RegionsLow-Complexity RegionsDefined as regions of biased compositionDefined as regions of biased composition
•• Homopolymeric Homopolymeric runsruns•• Short-period repeatsShort-period repeats•• Subtle over-representation of several residuesSubtle over-representation of several residues
>>gigi|20455478|sp|P50553|ASC1_HUMAN|20455478|sp|P50553|ASC1_HUMAN Achaete Achaete--scutescute homolog 1 (HASH1) homolog 1 (HASH1)MESSAKMESGGAGQQPQPQPQQPFLPPAACFFATAAAAAAAAAAAAAQSAQQQQQQQQQQQQAPQLRPAAMESSAKMESGGAGQQPQPQPQQPFLPPAACFFATAAAAAAAAAAAAAQSAQQQQQQQQQQQQAPQLRPAADGQPSGGGHKSAPKQVKRQRSSSPELMRCKRRLNFSGFGYSLPQQQPAAVARRNERERNRVKLVNLGFATDGQPSGGGHKSAPKQVKRQRSSSPELMRCKRRLNFSGFGYSLPQQQPAAVARRNERERNRVKLVNLGFATLREHVPNGAANKKMSKVETLRSAVEYIRALQQLLDEHDAVSAAFQAGVLSPTISPNYSNDLNSMAGSPVSLREHVPNGAANKKMSKVETLRSAVEYIRALQQLLDEHDAVSAAFQAGVLSPTISPNYSNDLNSMAGSPVSSYSSDEGSYDPLSPEEQELLDFTNWFSYSSDEGSYDPLSPEEQELLDFTNWF
HomopolymericHomopolymericalanine-glutamine alanine-glutamine tracttract

NHGRI Current Topics in Genome Analysis 2006Biological Sequence Analysis I
22
Identifying Low-Complexity RegionsIdentifying Low-Complexity Regions•• Biological origins and role not well-understoodBiological origins and role not well-understood
•• DNA replication errors (polymerase slippage)?DNA replication errors (polymerase slippage)?•• Unequal crossing-over?Unequal crossing-over?
•• May confound sequence analysisMay confound sequence analysis•• BLAST relies on uniformly-distributedBLAST relies on uniformly-distributed
amino acid frequenciesamino acid frequencies•• Often lead to false positivesOften lead to false positives•• Filtering is advised (and usually enabled by default)Filtering is advised (and usually enabled by default)
PAM30PAM70BLOSUM80BLOSUM62BLOSUM45

NHGRI Current Topics in Genome Analysis 2006Biological Sequence Analysis I
23
E value thresholdReports all hits with E < 10
Organism [ORGN]

NHGRI Current Topics in Genome Analysis 2006Biological Sequence Analysis I
24

NHGRI Current Topics in Genome Analysis 2006Biological Sequence Analysis I
25
Descendingscoreorder
Gap withinsame hit• >1 HSP• Masked
region
Unrelatedhits
Color key

NHGRI Current Topics in Genome Analysis 2006Biological Sequence Analysis I
26
Descendingscoreorder
3e-93 = 3 x 10-93
0.0 means< 10-1000
StructureGene
UniGene
SS
GG
UU

NHGRI Current Topics in Genome Analysis 2006Biological Sequence Analysis I
27
RejectReject
AcceptAccept(for now)(for now)
— Gapaa Low-
Complexity
> 25% for proteins> 70% for nucleotides

NHGRI Current Topics in Genome Analysis 2006Biological Sequence Analysis I
28
No definition line ∴second HSP identified
— Gapaa Low-
Complexity
HSP 1HSP 1Q:Q: 1-9171-917S:S: 1-9171-917
HSPHSP 22Q:Q: 906-1403906-1403S:S: 1070-15351070-1535

NHGRI Current Topics in Genome Analysis 2006Biological Sequence Analysis I
29
Suggested BLAST CutoffsSuggested BLAST CutoffsSequenceSequence
EE value value IdentityIdentity
NucleotideNucleotide < 10 10-6-6 > 70% 70%
ProteinProtein < 10 10-3-3 > 25% 25%
•• Do not use these cutoffs blindly!Do not use these cutoffs blindly!•• Pay attention to alignmentsPay attention to alignments on either side ofon either side of
the dividing linethe dividing line•• Do not ignore biology!Do not ignore biology!
Database Searching ArtifactsDatabase Searching Artifacts•• Low-complexity regionsLow-complexity regions
•• Nucleotide searches: removed with DUSTNucleotide searches: removed with DUST (( N) N)•• Protein searches: removed with SEGProtein searches: removed with SEG (( X) X)
•• Repetitive elementsRepetitive elements•• LINEsLINEs, , SINEsSINEs, retroviral repeats, retroviral repeats•• Choose Choose ““Filter: Human RepeatsFilter: Human Repeats”” when usingwhen using
BLASTNBLASTN•• RepeatMaskerRepeatMasker
http://www.http://www.repeatmaskerrepeatmasker.org.org

NHGRI Current Topics in Genome Analysis 2006Biological Sequence Analysis I
30
Database Searching ArtifactsDatabase Searching Artifacts•• Low-quality sequence hitsLow-quality sequence hits
•• Expressed sequence tags (Expressed sequence tags (ESTsESTs))•• Single-pass sequence reads from large-scaleSingle-pass sequence reads from large-scale
sequencing (possibly with vector contaminants)sequencing (possibly with vector contaminants)
BLAST 2 SequencesBLAST 2 Sequences•• Finds local alignments between two protein orFinds local alignments between two protein or
nucleotide sequences of interestnucleotide sequences of interest
•• All BLAST programs availableAll BLAST programs available
•• Select BLOSUM and PAM matrices available forSelect BLOSUM and PAM matrices available forprotein comparisonsprotein comparisons
•• Same affine gap costs (adjustable)Same affine gap costs (adjustable)
•• Input sequences can be maskedInput sequences can be masked

NHGRI Current Topics in Genome Analysis 2006Biological Sequence Analysis I
31
http://www.http://www.ncbincbi..nlmnlm..nihnih..gov/BLASTgov/BLAST
PAM30PAM70BLOSUM80BLOSUM62BLOSUM45

NHGRI Current Topics in Genome Analysis 2006Biological Sequence Analysis I
32

NHGRI Current Topics in Genome Analysis 2006Biological Sequence Analysis I
33
MegaBLASTMegaBLAST•• Optimized for aligning very long and/orOptimized for aligning very long and/or
highly-similar sequenceshighly-similar sequences
•• Good for batch nucleotide searchesGood for batch nucleotide searches
•• Search targets includeSearch targets include•• Entire eukaryotic genomesEntire eukaryotic genomes•• Complete chromosomes and Complete chromosomes and contigs contigs from from RefSeqRefSeq
•• Run speeds approximately 10 times faster thanRun speeds approximately 10 times faster thanBLASTNBLASTN•• Adjusted word sizeAdjusted word size•• Different gap scoring schemeDifferent gap scoring scheme
BLASTN BLASTN vsvs.. MegaBLAST MegaBLAST•• Word sizeWord size
•• BLASTN default BLASTN default = 11= 11•• MegaBLAST MegaBLAST default default = 28= 28
•• Non-affineNon-affine gap penalties gap penalties
Deduction for a gap = Deduction for a gap = rr/2 /2 –– qq
where where rr = = match rewardmatch reward (default 1)(default 1)qq = = mismatch penalty mismatch penalty (default -2)(default -2)
and and no penalty for opening the gapno penalty for opening the gap

NHGRI Current Topics in Genome Analysis 2006Biological Sequence Analysis I
34
http://www.http://www.ncbincbi..nlmnlm..nihnih..gov/BLASTgov/BLAST

NHGRI Current Topics in Genome Analysis 2006Biological Sequence Analysis I
35
Sequence truly not unique?Artifact of assembly process?Finished sequence neededCheck subsequent builds of zebrafish genome

NHGRI Current Topics in Genome Analysis 2006Biological Sequence Analysis I
36
OverviewOverview•• Week 2: Comparative methods and conceptsWeek 2: Comparative methods and concepts
•• Similarity Similarity vsvs. . HomologyHomology•• GlobalGlobal vsvs.. Local Alignments Local Alignments•• Scoring MatricesScoring Matrices•• BLASTBLAST•• BLATBLAT
•• Week Week 3:3: Predictive methods and concepts Predictive methods and concepts•• Profiles, patterns, motifs, and domainsProfiles, patterns, motifs, and domains•• Secondary structure predictionSecondary structure prediction•• Structures: VAST, Cn3D, and Structures: VAST, Cn3D, and de novode novo prediction prediction
BLATBLAT•• ““BLAST-Like Alignment ToolBLAST-Like Alignment Tool””
•• Designed to rapidly-align longer nucleotide sequencesDesigned to rapidly-align longer nucleotide sequences((LL >> 40) having > 95% sequence similarity 40) having > 95% sequence similarity
•• Can find exact matches reliably down to Can find exact matches reliably down to LL = 33 = 33
•• Method of choice when looking for exact matches inMethod of choice when looking for exact matches innucleotide databasesnucleotide databases
•• 500 times faster for mRNA/DNA searches500 times faster for mRNA/DNA searches
•• May miss divergent or shorter sequence alignmentsMay miss divergent or shorter sequence alignments
•• Can be used on protein sequencesCan be used on protein sequences

NHGRI Current Topics in Genome Analysis 2006Biological Sequence Analysis I
37
When to Use BLATWhen to Use BLAT•• To characterize an unknown gene or sequenceTo characterize an unknown gene or sequence
fragmentfragment•• Find its genomic coordinatesFind its genomic coordinates•• Determine gene structure (the presence and position ofDetermine gene structure (the presence and position of
exonsexons))•• Identify markers of interest in the vicinity of a sequenceIdentify markers of interest in the vicinity of a sequence
•• To find highly-similar sequencesTo find highly-similar sequences•• Identify gene family membersIdentify gene family members•• Identify putative Identify putative homologshomologs
•• To display a specific sequence as a separate trackTo display a specific sequence as a separate track
http://genome.http://genome.ucscucsc..eduedu

NHGRI Current Topics in Genome Analysis 2006Biological Sequence Analysis I
38

NHGRI Current Topics in Genome Analysis 2006Biological Sequence Analysis I
39

NHGRI Current Topics in Genome Analysis 2006Biological Sequence Analysis I
40
FASTAFASTA•• Identifies regions of local alignmentIdentifies regions of local alignment•• Employs an approximation of theEmploys an approximation of the
Smith-Waterman algorithm to determine the bestSmith-Waterman algorithm to determine the bestalignment betweenalignment between two sequencestwo sequences
•• Method is significantly different from that usedMethod is significantly different from that usedby BLASTby BLAST
•• Online implementations atOnline implementations athttp:http://fasta//fasta..biochbioch..virginiavirginia..edueduhttp://www.http://www.ebiebi.ac.uk/fasta33.ac.uk/fasta33