CT Testing with the PowerMaster - powermetrix.com · Instrument Current Transformer (CT) testing...
27
Instrument Current Transformer (CT) testing with the PowerMaster Martin T. Hiatt, VP of Sales & Marketing June 7, 2013 ®
Transcript of CT Testing with the PowerMaster - powermetrix.com · Instrument Current Transformer (CT) testing...
Instrument Current Transformer (CT) testing with the PowerMaster
Martin T. Hiatt, VP of Sales & Marketing
June 7, 2013
®
2
Execu ve Summary
When tes ng instrument transformers in the field using the PowerMaster, there can be
confusion whether or not a CT is mee ng its specifica ons. This white paper will
discuss in detail basic ra ngs listed on instrument current transformers and help clarify
how the PowerMaster analyzes the data to determine if a CT has either passed or failed
a test. This paper also explains user preferences in the PowerMaster so the user can
personalize the tes ng to meet their needs.
In order to understand how a CT will pass or fail a test according to the IEEE C57.13
standard, we must first understand its nameplate specifica ons. These specifica ons
include the ra o, accuracy class, ra ng factor, temperature, and burden ra ng. The
ra o of a CT is the amplitude of the primary current in rela onship to the amplitude of
the secondary current. The accuracy class is rated at 100% of the CT ra o, and most are
specified at 0.3% error. The ra ng factor is a mul plier of the ra o which increases the
opera ng range at its stated accuracy class and temperature range. The burden ra ng
is defined as all resistance in ohms that is present on the secondary connec ons of the
CT. For this paper, we are using a 20:5 CT, accuracy class of 0.3%, ra ng factor of 2, and
a burden ra ng of 0.5 ohms.
When ra o tes ng a CT, we are looking at the rela onship between the primary and
secondary current waveforms for both amplitude and phase. When there is zero phase
difference between the two signals, the phase measurement would pass. If there is no
phase difference, but the secondary current is ½ of expected, the measurement would
fail on amplitude. If the amplitude of the primary and secondary current matches the
ra o of the CT, but the phase difference between the two signals is outside the error
limits, the measurement would fail on phase. By using the parallelogram in the
PowerMaster, the user can visually determine if these test points are within
specifica on.

3
In addi on to errors in the CT itself, probes used to measure amplitude and phase
induce addi onal errors simply by their applica on and design. Errors can occur
depending on how the probe is placed around the conductor, proximity of the probe to
other conductors, and accuracy limita ons with the probe design. To alleviate some of
the restric ons, the PowerMaster allows the user to choose customizable CT error
limits and different graphical displays for the IEEE accuracy parallelogram. The
parallelogram can be displayed as a standard IEEE C57.13 display, a user defined display,
or a combina on of the two displays.
When tes ng instrument transformers, the PowerMaster has the ability to analyze and
display the data to the user in a prac cal format. However, understanding the nature
and limita on of a CT becomes paramount when interpre ng the data. This paper
guides the user on how to analyze, interpret, and configure the PowerMaster to supply
the desired results.
4
Introduc on
The PowerMaster is a highly advanced piece of field test equipment that is capable of
tes ng instrument transformers in the field. CT manufacturers specify their products
using a wide range of criteria. Some of this criterion is inter‐related, which can cause
confusion about whether a CT is mee ng its specifica ons. This white paper will discuss
in detail basic ra ngs listed on instrument current transformers and help clarify how
the PowerMaster analyzes the data to determine if the CT has either passed or failed a
test. This white paper will also define various user definable preferences so that the
operator can personalize their PowerMaster to suit their needs.

5
The PowerMaster is capable of performing three different types of tests on CTs.
1) Ra o Only Test
A ra o only test measures both the primary and secondary current at a single point and
displays the results. Amplitude and phase error will both be calculated.
2) Burden Only Test
A burden only test only measures the secondary current. The PowerMaster will test at
several points (as determined in the test setup). The PowerMaster will first measure
the amplitude of the secondary current with no extra burden applied. This is the base
reading. The PowerMaster will then measure the current as it simultaneously increases
the burden on the circuit. The PowerMaster is measuring how much the secondary
current drops during the test. The addi onal burden points available are 0.1 ohms, 0.3
ohms, 0.5 ohms, 1.0 ohms, 2.0 ohms and 4.0 ohms. The user can select the maximum
amount of addi onal ohms maximum they want the test to add. For example, if the
user chooses 2.0 ohms, the PowerMaster will measure the current at no addi onal
burden, 0.1 ohms applied, then 0.3 ohms applied, then 0.5 ohms applied, then 1.0
ohms applied, and then finally 2.0 ohms applied. The 4.0 ohm point would not be
tested.
3) Burden and Ra o Test
A burden and ra o test combines both aspects of the ra o only test and burden only
test. The PowerMaster will test at several points (as determined in the test setup). The
PowerMaster will first measure the amplitude and phase of the primary current and
secondary current with no extra burden applied. This is the base reading. The
PowerMaster will then measure both of these signals as it simultaneously increases the
burden on the circuit. The PowerMaster is measuring how the rela onship between
the primary and secondary current changes as extra burden is applied. The addi onal
burden points available are 0.1 ohms, 0.3 ohms, 0.5 ohms, 1.0 ohms, 2.0 ohms and 4.0
ohms. The user can select the maximum amount of addi onal ohms maximum they
want the test to add. For example, if the user chooses 2.0 ohms, the PowerMaster will
make measurements at no addi onal burden, 0.1 ohms applied, then 0.3 ohms applied,
then 0.5 ohms applied, then 1.0 ohms applied, and then finally 2.0 ohms applied. The
4.0 ohm point would not be tested.
6
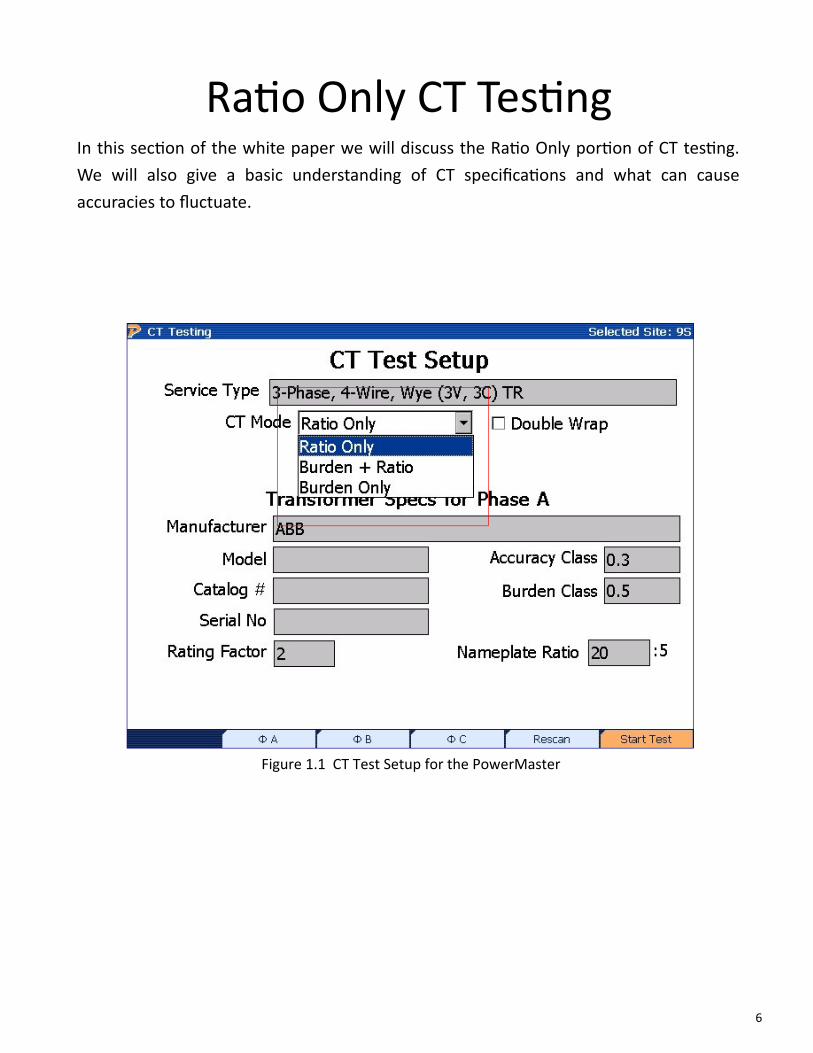
In this sec on of the white paper we will discuss the Ra o Only por on of CT tes ng.
We will also give a basic understanding of CT specifica ons and what can cause
accuracies to fluctuate.
Ra o Only CT Tes ng
Figure 1.1 CT Test Setup for the PowerMaster
7
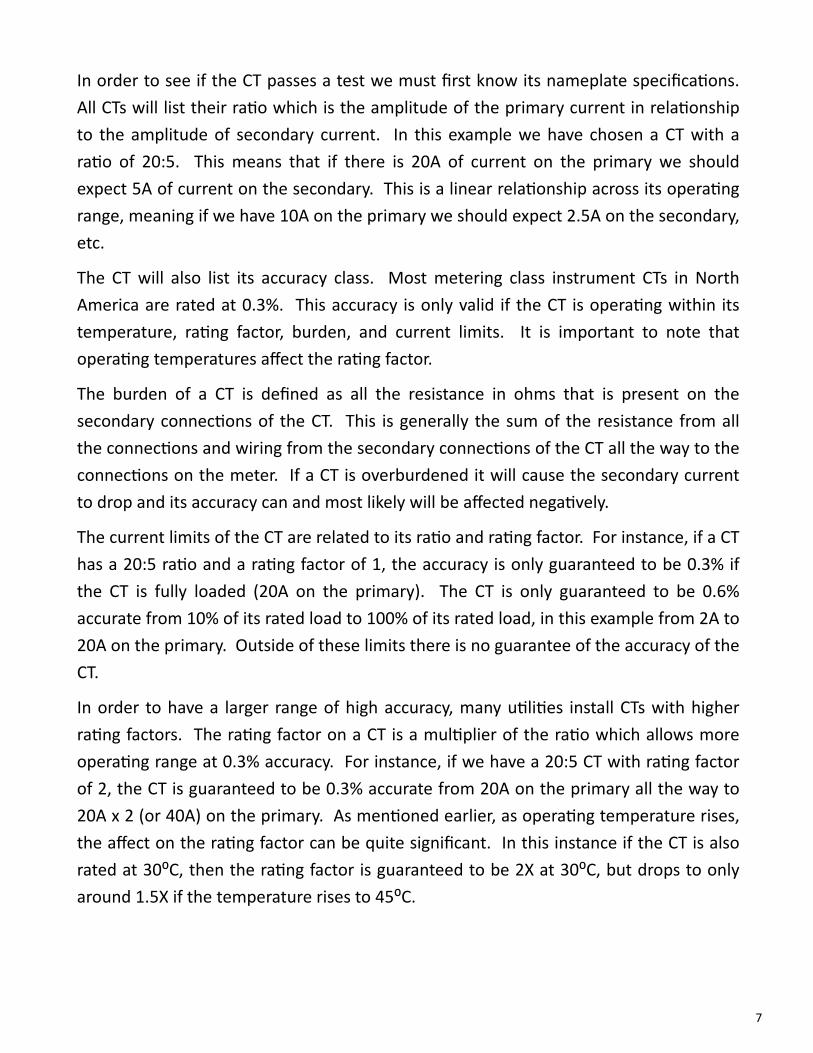
In order to see if the CT passes a test we must first know its nameplate specifica ons.
All CTs will list their ra o which is the amplitude of the primary current in rela onship
to the amplitude of secondary current. In this example we have chosen a CT with a
ra o of 20:5. This means that if there is 20A of current on the primary we should
expect 5A of current on the secondary. This is a linear rela onship across its opera ng
range, meaning if we have 10A on the primary we should expect 2.5A on the secondary,
etc.
The CT will also list its accuracy class. Most metering class instrument CTs in North
America are rated at 0.3%. This accuracy is only valid if the CT is opera ng within its
temperature, ra ng factor, burden, and current limits. It is important to note that
opera ng temperatures affect the ra ng factor.
The burden of a CT is defined as all the resistance in ohms that is present on the
secondary connec ons of the CT. This is generally the sum of the resistance from all
the connec ons and wiring from the secondary connec ons of the CT all the way to the
connec ons on the meter. If a CT is overburdened it will cause the secondary current
to drop and its accuracy can and most likely will be affected nega vely.
The current limits of the CT are related to its ra o and ra ng factor. For instance, if a CT
has a 20:5 ra o and a ra ng factor of 1, the accuracy is only guaranteed to be 0.3% if
the CT is fully loaded (20A on the primary). The CT is only guaranteed to be 0.6%
accurate from 10% of its rated load to 100% of its rated load, in this example from 2A to
20A on the primary. Outside of these limits there is no guarantee of the accuracy of the
CT.
In order to have a larger range of high accuracy, many u li es install CTs with higher
ra ng factors. The ra ng factor on a CT is a mul plier of the ra o which allows more
opera ng range at 0.3% accuracy. For instance, if we have a 20:5 CT with ra ng factor
of 2, the CT is guaranteed to be 0.3% accurate from 20A on the primary all the way to
20A x 2 (or 40A) on the primary. As men oned earlier, as opera ng temperature rises,
the affect on the ra ng factor can be quite significant. In this instance if the CT is also
rated at 30⁰C, then the ra ng factor is guaranteed to be 2X at 30⁰C, but drops to only
around 1.5X if the temperature rises to 45⁰C.

8
Below are graphical representa ons of how burden, load, ra ng factor and
temperature can influence CT performance. Figure 1.2 is for a 0.3% CT with
ra ng factor of 2 and burden ra ng of 1.8 ohms. It illustrates how accuracies are
affected by percent rated load of CT opera on and exis ng burden.
200
Figure 1.3 shows how opera ng
temperatures can influence the ra ng
factor of a CT. It illustrates that as
temperature increases, the ra ng factor
of the CT decreases.
Figure 1.2
Figure 1.3
9
When ra o tes ng a CT we must also look at the phase rela onship between the
primary current and secondary current. In a perfect world there should be zero phase
difference between these two signals. When determining if a CT passes a ra o test, the
PowerMaster follows the IEEE C57.13 Standard which defines what the limits are on
phase shi at different amplitude errors. This is graphically represented by the IEEE
parallelogram which we will show in detail throughout this white paper.
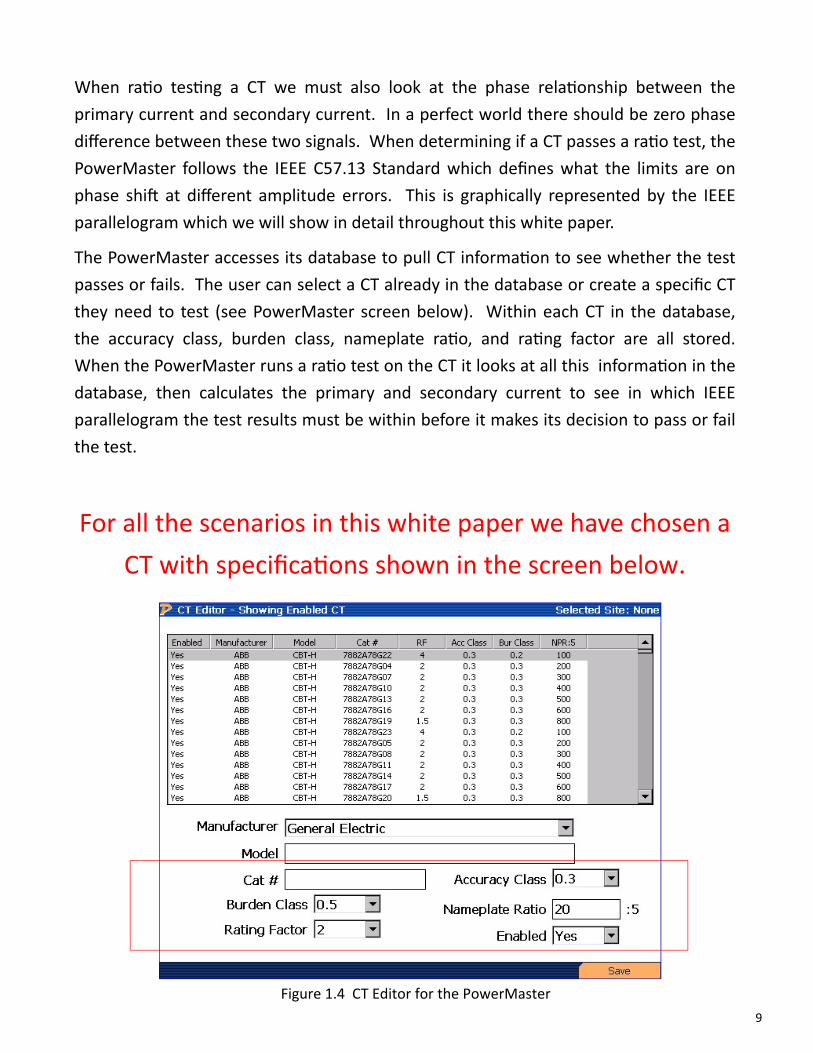
The PowerMaster accesses its database to pull CT informa on to see whether the test
passes or fails. The user can select a CT already in the database or create a specific CT
they need to test (see PowerMaster screen below). Within each CT in the database,
the accuracy class, burden class, nameplate ra o, and ra ng factor are all stored.
When the PowerMaster runs a ra o test on the CT it looks at all this informa on in the
database, then calculates the primary and secondary current to see in which IEEE
parallelogram the test results must be within before it makes its decision to pass or fail
the test.
For all the scenarios in this white paper we have chosen a
CT with specifica ons shown in the screen below.
Figure 1.4 CT Editor for the PowerMaster

10
Amplitude (Amps)
+ 5
+ 10
+ 15
+ 20
‐ 5
‐ 10
0
‐ 15
‐ 20
Phase (degrees)
0 45 90 135 ‐ 45 ‐ 90 ‐ 135 ‐ 180 180
Primary Current
Secondary Current
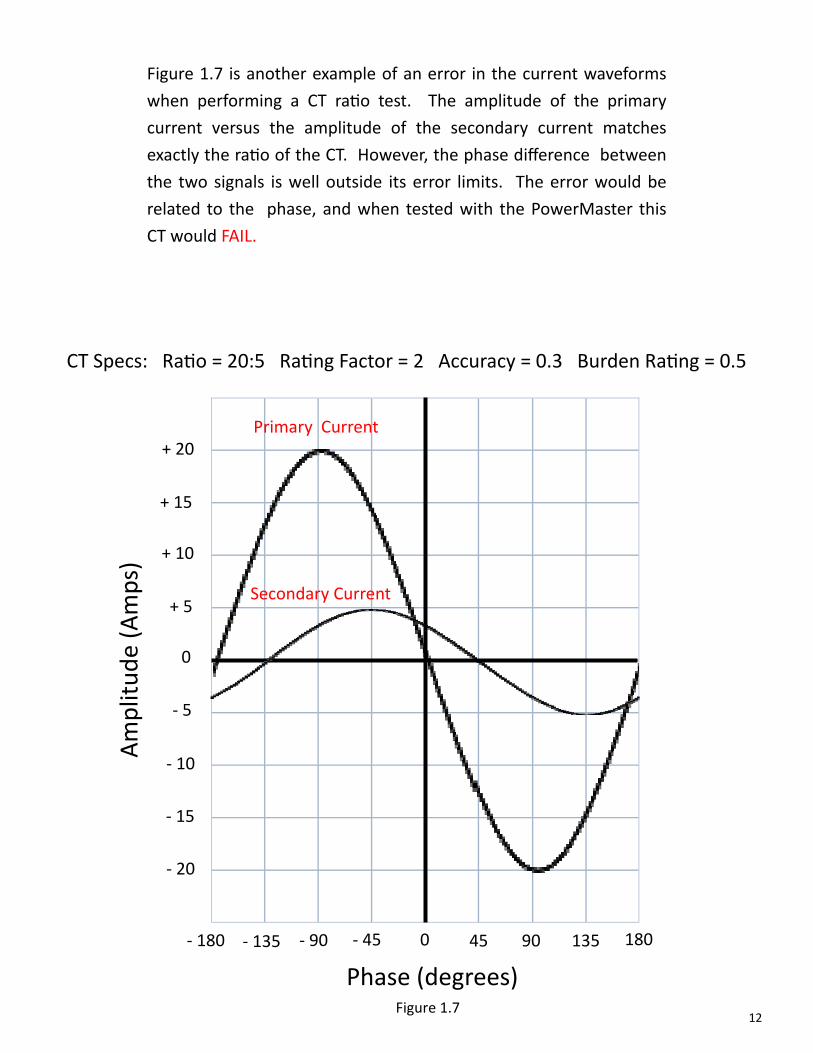
CT Specs: Ra o = 20:5 Ra ng Factor = 2 Accuracy = 0.3 Burden Ra ng = 0.5
Figure 1.5 is an example of the sinusoidal current waveforms expected
when performing a CT ra o test. The amplitude of the primary current
versus the amplitude of the secondary current matches exactly to the ra o
of the CT. There is also zero phase difference between the two signals.
When tested with the PowerMaster this CT would PASS.
Figure 1.5

11
Amplitude (Amps)
+ 5
+ 10
+ 15
+ 20
‐ 5
‐ 10
0
‐ 15
‐ 20
Phase (degrees)
0 45 90 135 ‐ 45 ‐ 90 ‐ 135 ‐ 180 180
Primary Current
Secondary Current
Figure 1.6 is an example of an error in the current waveforms when
performing a CT ra o test. The amplitude of the primary current versus the
amplitude of the secondary current does not match the ra o of the CT.
Although there is no phase difference between the two signals, the
secondary current is roughly 1/2 what we would expect it to be (2.5A
instead of 5A). The CT could be damaged, labeled incorrectly, or the CT
could be heavily overburdened among other things. The error would be
related to the amplitude, and when tested with the PowerMaster this CT
would FAIL.
CT Specs: Ra o = 20:5 Ra ng Factor = 2 Accuracy = 0.3 Burden Ra ng = 0.5
Figure 1.6
12
Amplitude (Amps)
+ 5
+ 10
+ 15
+ 20
‐ 5
‐ 10
0
‐ 15
‐ 20
Phase (degrees)
0 45 90 135 ‐ 45 ‐ 90 ‐ 135 ‐ 180 180
Primary Current
Secondary Current
Figure 1.7 is another example of an error in the current waveforms
when performing a CT ra o test. The amplitude of the primary
current versus the amplitude of the secondary current matches
exactly the ra o of the CT. However, the phase difference between
the two signals is well outside its error limits. The error would be
related to the phase, and when tested with the PowerMaster this
CT would FAIL.
CT Specs: Ra o = 20:5 Ra ng Factor = 2 Accuracy = 0.3 Burden Ra ng = 0.5
Figure 1.7

13
Amplitude Error (%)
Phase Error (minutes)
60 minutes = 1 degree
+ 0.15
+ 0.3
+ 0.45
+ 0.6
‐ 0.15
‐ 0.3
0
‐ 0.45
‐ 0.6
0 + 10 + 20 + 30 ‐ 10 ‐ 20 ‐ 30 ‐ 40 + 40
100% Rated Load Limit
CT Specs: Ra o = 20:5 Ra ng Factor = 2 Accuracy = 0.3 Burden Ra ng = 0.5
We will now look at how the accuracy test is graphically represented in the
PowerMaster via the IEEE defini ons.
Figure 1.8 is the IEEE parallelogram used by the PowerMaster to determine if a CT
ra o test passes or fails. This par cular parallelogram is based on the 100% RATED
LOAD of the CT. In our example, the test must fit within the red area if the primary
current of the CT is between 20A and 40A. You will no ce that as the amplitude error
increases in the posi ve direc on, there is more leeway in the phase error in the
posi ve direc on as well. This rela onship is true in the nega ve direc on as well. In
this IEEE defini on the amplitude error is based on the accuracy class of the CT (0.3% in
our case).
PASS
FAIL
Figure 1.8
14
Amplitude Error (%)
Phase Error (minutes)
60 minutes = 1 degree
+ 0.15
+ 0.3
+ 0.45
+ 0.6
‐ 0.15
‐ 0.3
0
‐ 0.45
‐ 0.6
0 + 10 + 20 + 30 ‐ 10 ‐ 20 ‐ 30 ‐ 40 + 40
10% ‐ 100%
Rated Load Limit
CT Specs: Ra o = 20:5 Ra ng Factor = 2 Accuracy = 0.3 Burden Ra ng = 0.5
PASS
FAIL
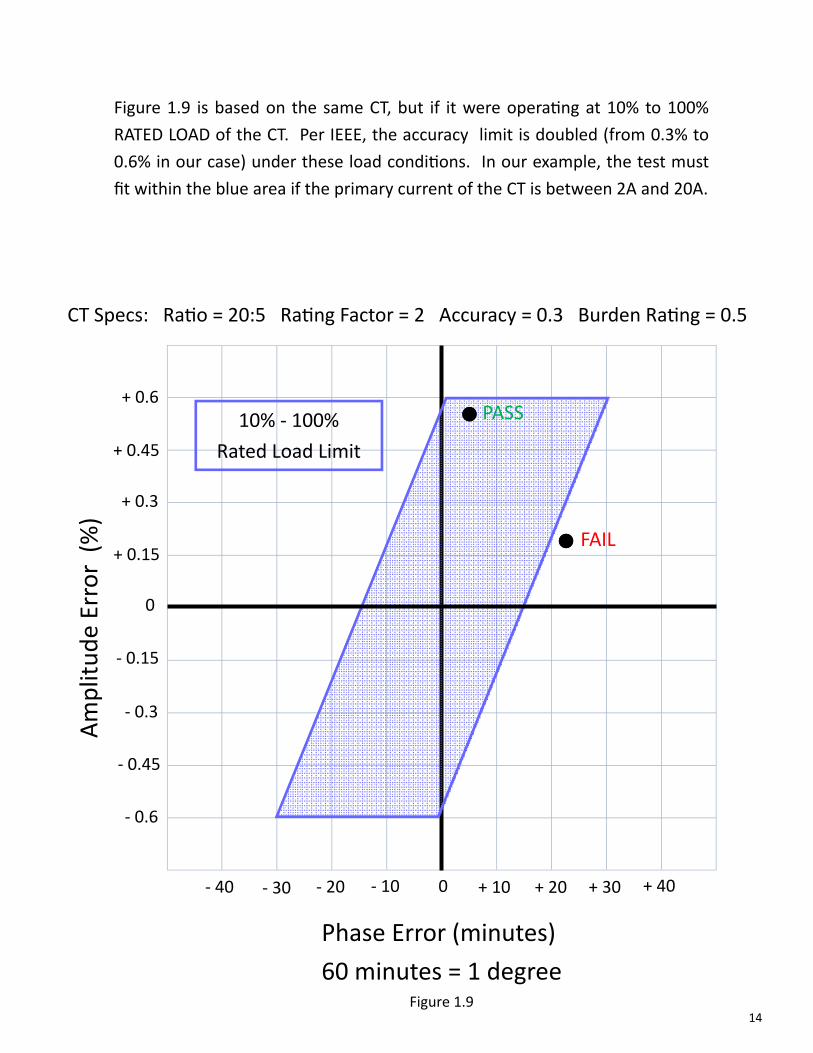
Figure 1.9 is based on the same CT, but if it were opera ng at 10% to 100%
RATED LOAD of the CT. Per IEEE, the accuracy limit is doubled (from 0.3% to
0.6% in our case) under these load condi ons. In our example, the test must
fit within the blue area if the primary current of the CT is between 2A and 20A.
Figure 1.9

15
Amplitude Error (%)
Phase Error (minutes)
60 minutes = 1 degree
+ 0.15
+ 0.3
+ 0.45
+ 0.6
‐ 0.15
‐ 0.3
0
‐ 0.45
‐ 0.6
0 + 10 + 20 + 30 ‐ 10 ‐ 20 ‐ 30 ‐ 40 + 40
100%
Rated Load Limit
10% ‐ 100%
Rated Load Limit
PASS
FAIL
FAIL
CT Specs: Ra o = 20:5 Ra ng Factor = 2 Accuracy = 0.3 Burden Ra ng = 0.5
Figure 1.10 shows the two separate IEEE parallelograms together that
the PowerMaster uses. Depending on the primary current of the CT that
the PowerMaster measures, it will use the appropriate parallelogram to
determine if the CT ra o test passes or fails. As an example, if the
PowerMaster was tes ng the CT and we were reading 25A on the
primary, the sample test points would be classified as pass or fail as
shown below.
Figure 1.10
16
Most CTs that don’t have internal defects and are not overburdened should pass tes ng when
tested with direct (wire touching wire) connec ons. When tes ng in the field with a product
like the PowerMaster, however, there are current probes that must be used to measure the
primary (and some mes secondary) current.
These probes have inherent inaccuracies in them simply because of their design. There are
many issues that can influence the current probe and cause readings to vary slightly. These
issues include placement of the probe around the conductor, the proximity of other probes
and conductors, and the specific probe in use. Some mes the inaccuracy of the probe itself
can cause the CT test points to fall outside of the IEEE parallelograms and give fail messages
when there is probably no error.
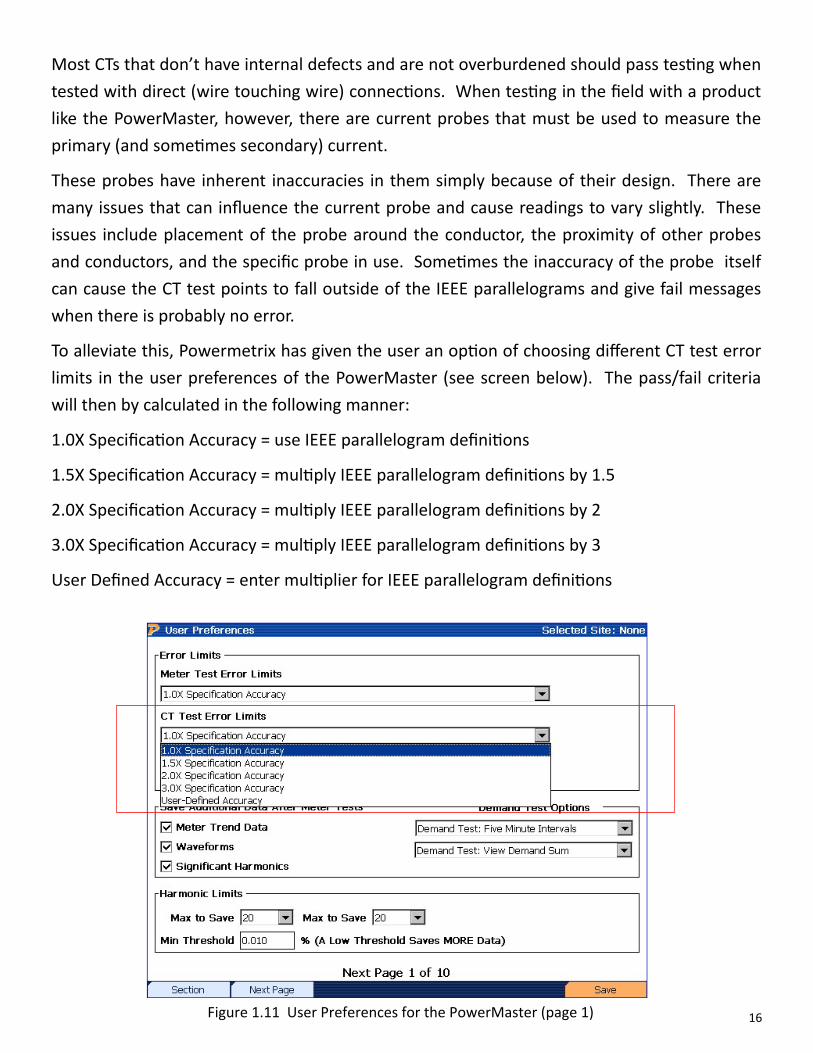
To alleviate this, Powermetrix has given the user an op on of choosing different CT test error
limits in the user preferences of the PowerMaster (see screen below). The pass/fail criteria
will then by calculated in the following manner:
1.0X Specifica on Accuracy = use IEEE parallelogram defini ons
1.5X Specifica on Accuracy = mul ply IEEE parallelogram defini ons by 1.5
2.0X Specifica on Accuracy = mul ply IEEE parallelogram defini ons by 2
3.0X Specifica on Accuracy = mul ply IEEE parallelogram defini ons by 3
User Defined Accuracy = enter mul plier for IEEE parallelogram defini ons
Figure 1.11 User Preferences for the PowerMaster (page 1)
17
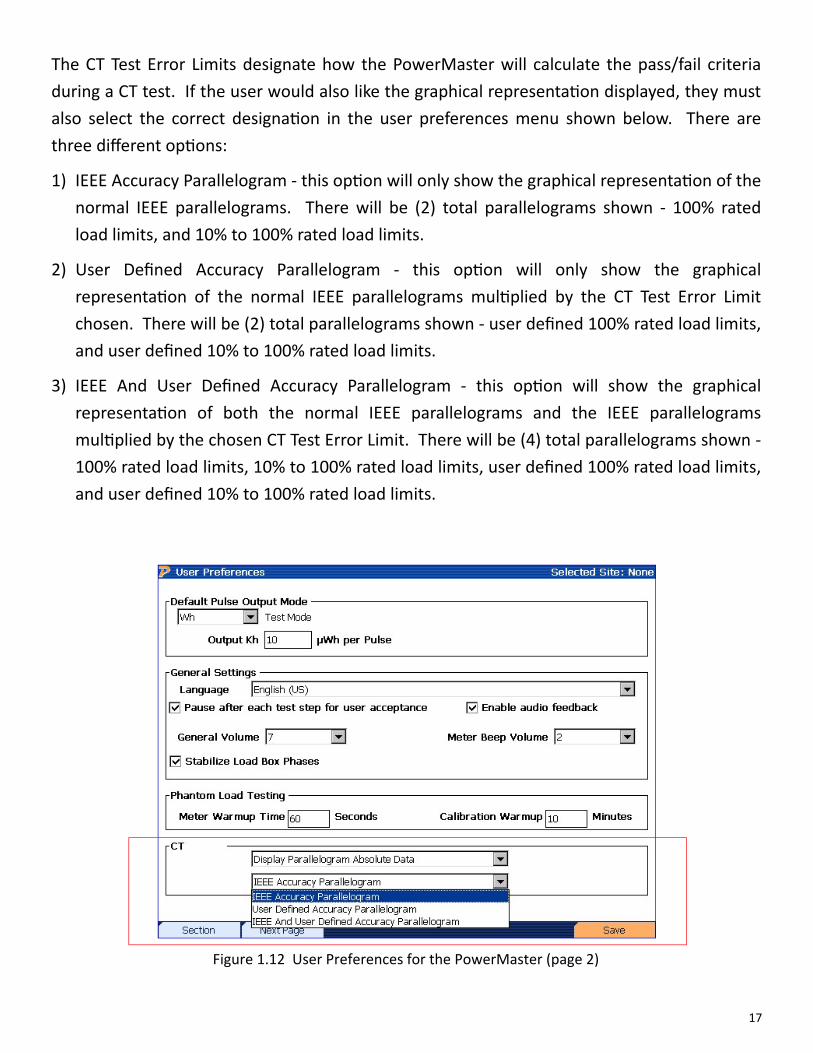
The CT Test Error Limits designate how the PowerMaster will calculate the pass/fail criteria
during a CT test. If the user would also like the graphical representa on displayed, they must
also select the correct designa on in the user preferences menu shown below. There are
three different op ons:
1) IEEE Accuracy Parallelogram ‐ this op on will only show the graphical representa on of the
normal IEEE parallelograms. There will be (2) total parallelograms shown ‐ 100% rated
load limits, and 10% to 100% rated load limits.
2) User Defined Accuracy Parallelogram ‐ this op on will only show the graphical
representa on of the normal IEEE parallelograms mul plied by the CT Test Error Limit
chosen. There will be (2) total parallelograms shown ‐ user defined 100% rated load limits,
and user defined 10% to 100% rated load limits.
3) IEEE And User Defined Accuracy Parallelogram ‐ this op on will show the graphical
representa on of both the normal IEEE parallelograms and the IEEE parallelograms
mul plied by the chosen CT Test Error Limit. There will be (4) total parallelograms shown ‐
100% rated load limits, 10% to 100% rated load limits, user defined 100% rated load limits,
and user defined 10% to 100% rated load limits.
Figure 1.12 User Preferences for the PowerMaster (page 2)
18
Amplitude Error (%)
Phase Error (minutes)
60 minutes = 1 degree
+ 0.15
+ 0.3
+ 0.45
+ 0.6
‐ 0.15
‐ 0.3
0
‐ 0.45
‐ 0.6
0 + 10 + 20 + 30 ‐ 10 ‐ 20 ‐ 30 ‐ 40 + 40
+ 0.75
+ 0.9
‐ 0.75
‐ 0.9 + 50 + 60 ‐ 50 ‐ 60
User Defined
100% Rated Load Limit
100%
Rated Load Limit PASS
PASS
FAIL
CT Specs: Ra o = 20:5 Ra ng Factor = 2 Accuracy = 0.3 Burden Ra ng = 0.5
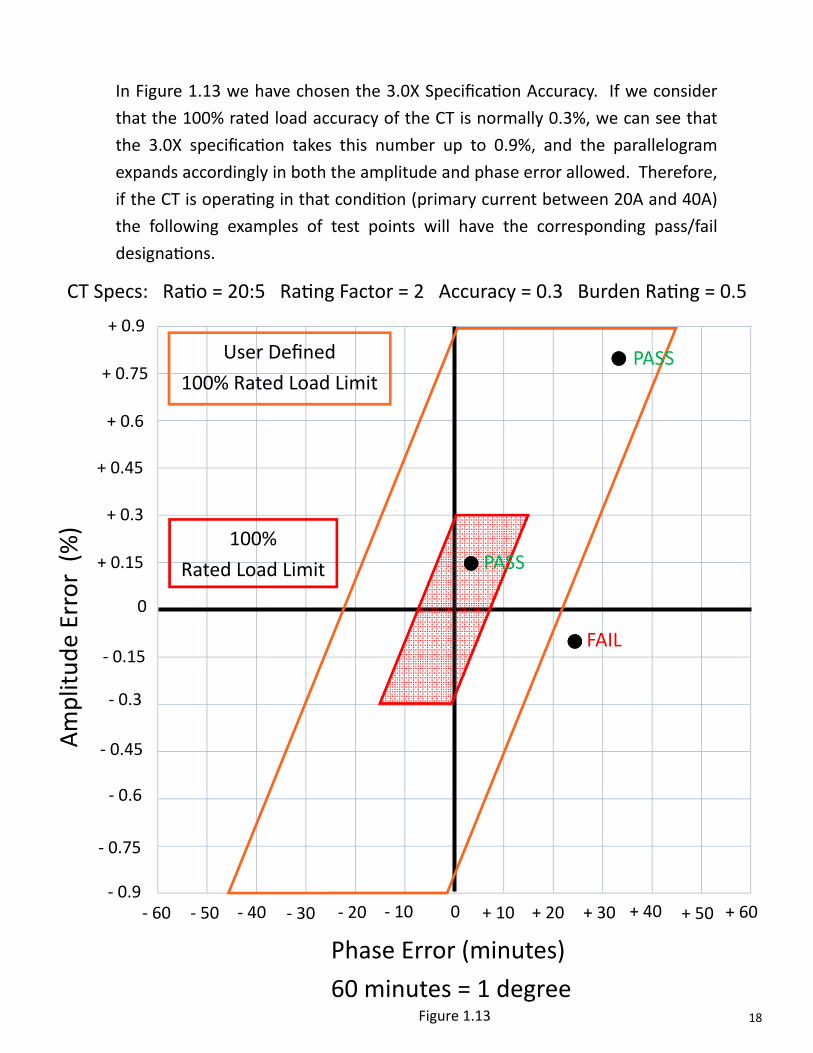
In Figure 1.13 we have chosen the 3.0X Specifica on Accuracy. If we consider
that the 100% rated load accuracy of the CT is normally 0.3%, we can see that
the 3.0X specifica on takes this number up to 0.9%, and the parallelogram
expands accordingly in both the amplitude and phase error allowed. Therefore,
if the CT is opera ng in that condi on (primary current between 20A and 40A)
the following examples of test points will have the corresponding pass/fail
designa ons.
Figure 1.13
19
Amplitude Error (%)
Phase Error (minutes)
60 minutes = 1 degree
+ 0.3
+ 0.6
+ 0.9
+ 1.2
‐ 0.3
‐ 0.6
0
‐ 0.9
‐ 1.2
0 + 20 + 40 + 60 ‐ 20 ‐ 40 ‐ 60 ‐ 80 + 80
+ 1.5
+ 1.8
‐ 1.5
‐ 1.8 + 100 + 120 ‐ 100 ‐ 120
User Defined 10% ‐ 100%
Rated Load Limit
10% ‐ 100%
Rated Load Limit
PASS
PASS
FAIL
CT Specs: Ra o = 20:5 Ra ng Factor = 2 Accuracy = 0.3 Burden Ra ng = 0.5
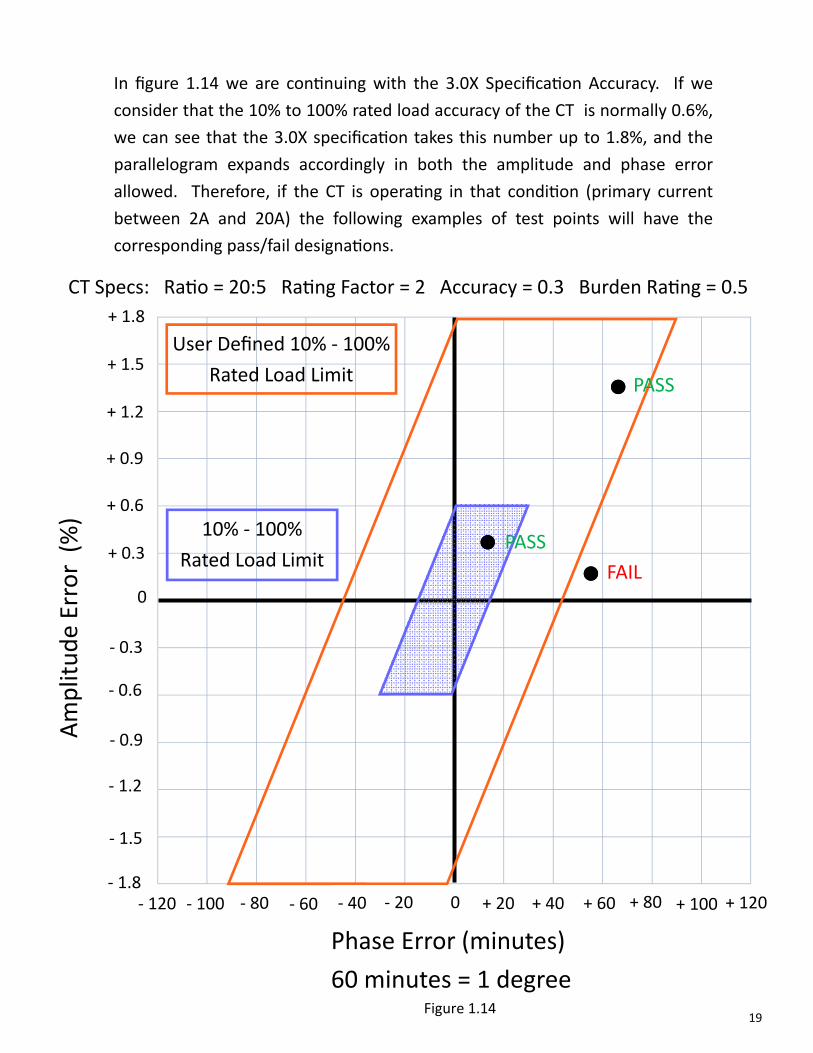
In figure 1.14 we are con nuing with the 3.0X Specifica on Accuracy. If we
consider that the 10% to 100% rated load accuracy of the CT is normally 0.6%,
we can see that the 3.0X specifica on takes this number up to 1.8%, and the
parallelogram expands accordingly in both the amplitude and phase error
allowed. Therefore, if the CT is opera ng in that condi on (primary current
between 2A and 20A) the following examples of test points will have the
corresponding pass/fail designa ons.
Figure 1.14
20
Amplitude Error (%)
Phase Error (minutes)
60 minutes = 1 degree
+ 0.15
+ 0.3
+ 0.45
+ 0.6
‐ 0.15
‐ 0.3
0
‐ 0.45
‐ 0.6
0 + 10 + 20 + 30 ‐ 10 ‐ 20 ‐ 30 ‐ 40 + 40
100%
Rated Load Limit
10% ‐ 100%
Rated Load Limit
CT Specs: Ra o = 20:5 Ra ng Factor = 2 Accuracy = 0.3 Burden Ra ng = 0.5
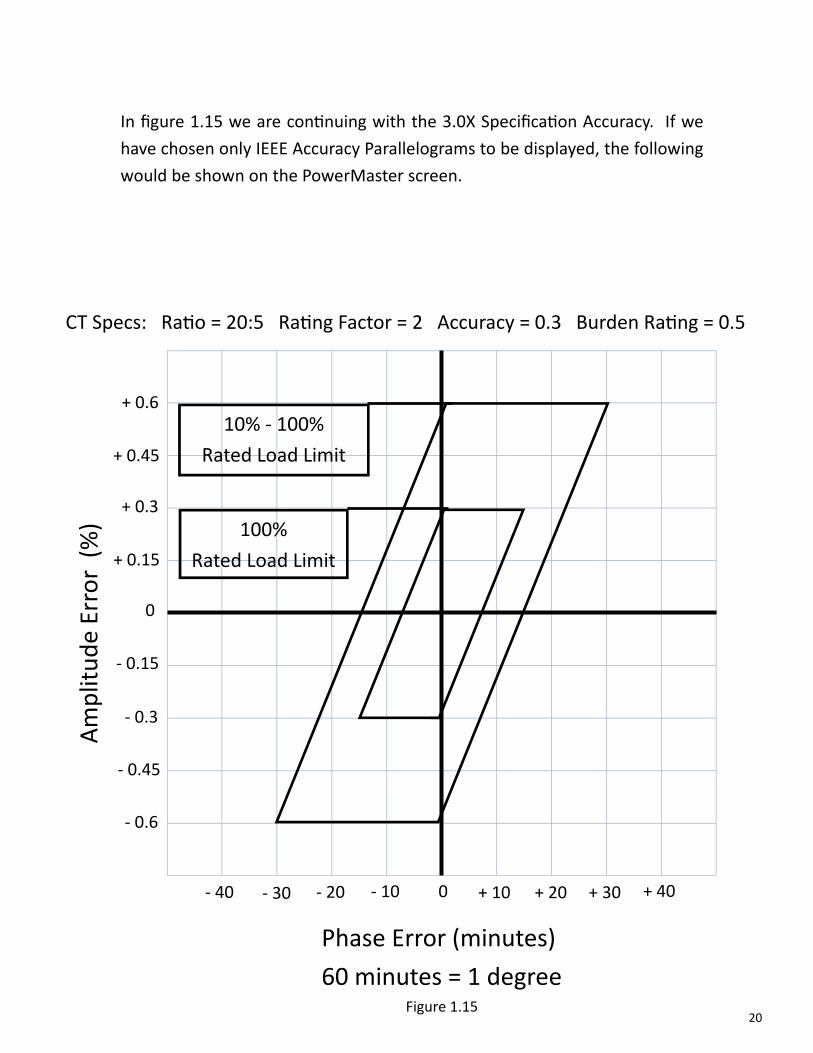
In figure 1.15 we are con nuing with the 3.0X Specifica on Accuracy. If we
have chosen only IEEE Accuracy Parallelograms to be displayed, the following
would be shown on the PowerMaster screen.
Figure 1.15
21
Amplitude Error (%)
Phase Error (minutes)
60 minutes = 1 degree
+ 0.3
+ 0.6
+ 0.9
+ 1.2
‐ 0.3
‐ 0.6
0
‐ 0.9
‐ 1.2
0 + 20 + 40 + 60 ‐ 20 ‐ 40 ‐ 60 ‐ 80 + 80
+ 1.5
+ 1.8
‐ 1.5
‐ 1.8 + 100 + 120 ‐ 100 ‐ 120
User Defined
100% Rated Load Limit
User Defined
10% ‐ 100% Rated Load Limit
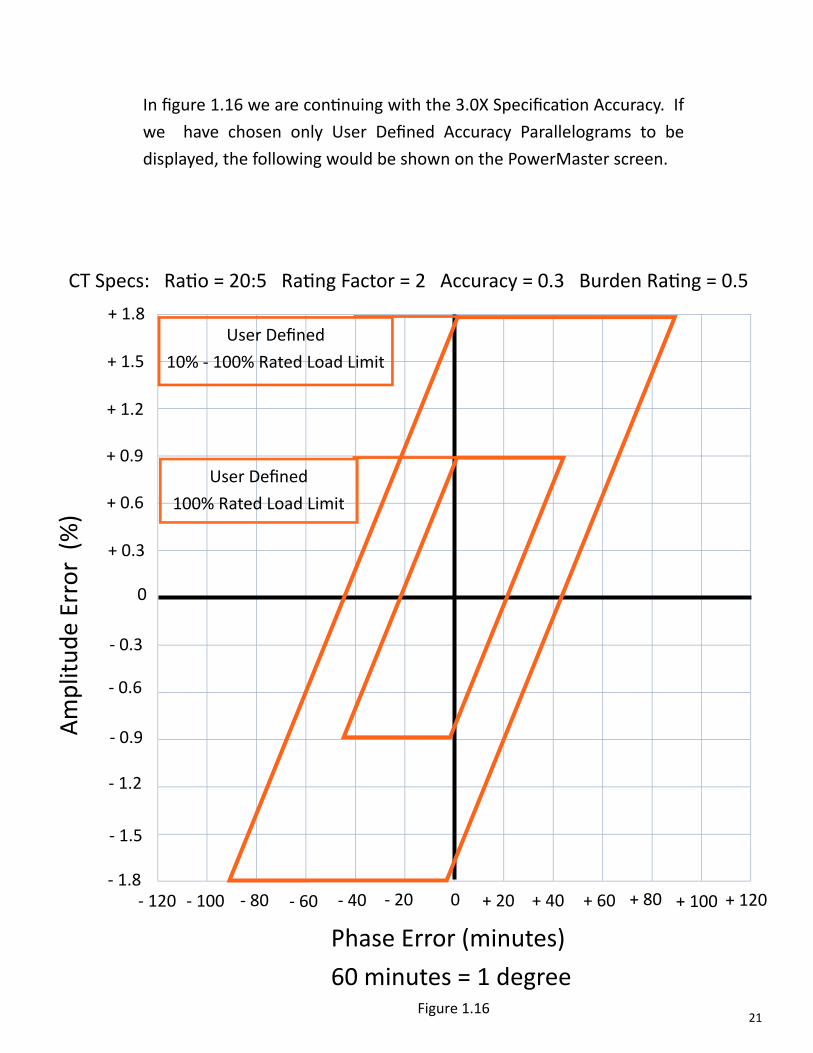
In figure 1.16 we are con nuing with the 3.0X Specifica on Accuracy. If
we have chosen only User Defined Accuracy Parallelograms to be
displayed, the following would be shown on the PowerMaster screen.
CT Specs: Ra o = 20:5 Ra ng Factor = 2 Accuracy = 0.3 Burden Ra ng = 0.5
Figure 1.16

22
Amplitude Error (%)
Phase Error (minutes)
60 minutes = 1 degree
+ 0.3
+ 0.6
+ 0.9
+ 1.2
‐ 0.3
‐ 0.6
0
‐ 0.9
‐ 1.2
0 + 20 + 40 + 60 ‐ 20 ‐ 40 ‐ 60 ‐ 80 + 80
+ 1.5
+ 1.8
‐ 1.5
‐ 1.8 + 100 + 120 ‐ 100 ‐ 120
100% Rated Load Limit
10% ‐ 100% Rated Load Limit
User Defined 100% Rated Load Limit
User Defined 10% ‐ 100% Rated Load Limit
CT Specs: Ra o = 20:5 Ra ng Factor = 2 Accuracy = 0.3 Burden Ra ng = 0.5
In Figure 1.17 we are con nuing with the 3.0X Specifica on Accuracy. If
we have chosen both IEEE And User Defined Accuracy Parallelograms to
be displayed, the following would be shown on the PowerMaster screen.
Figure 1.17
23
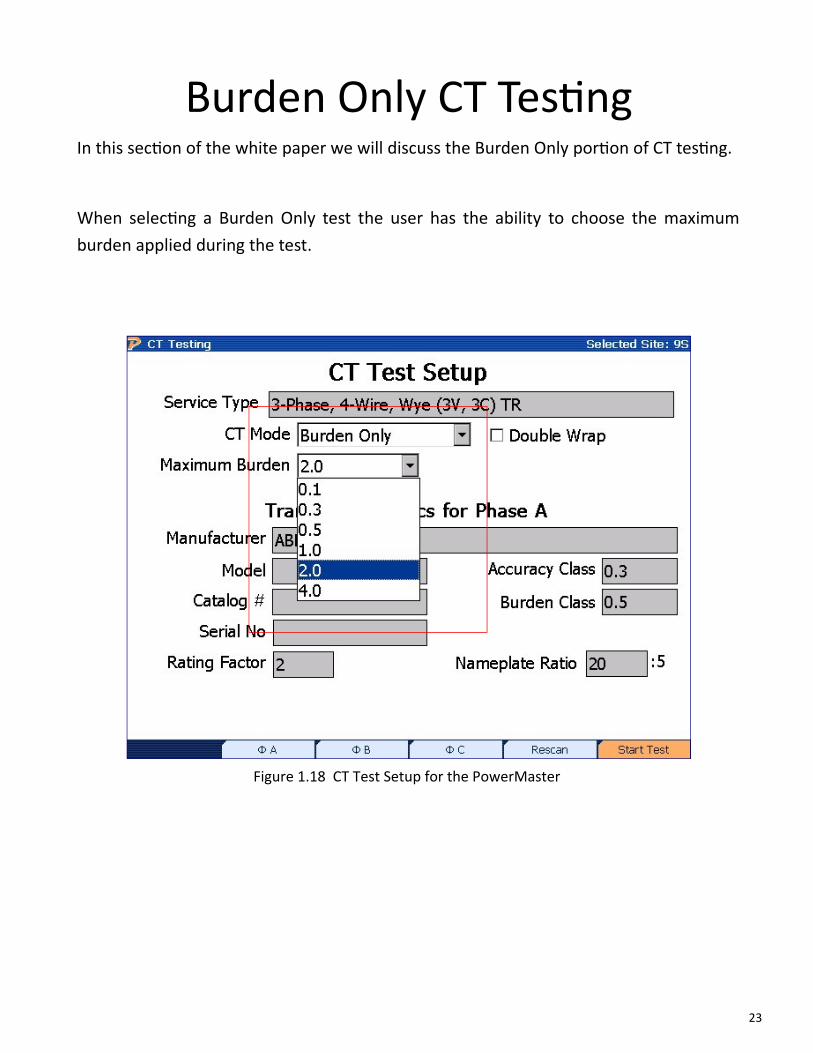
In this sec on of the white paper we will discuss the Burden Only por on of CT tes ng.
When selec ng a Burden Only test the user has the ability to choose the maximum
burden applied during the test.
Burden Only CT Tes ng
Figure 1.18 CT Test Setup for the PowerMaster

24
When performing a CT Burden only test, the PowerMaster must have a
direct connec on to the secondary terminals of the CT. This can be
accomplished by shor ng the CT via the bypass bar and connec ng
directly to the secondary terminals or by connec ng to a test switch.
In this example, the user chose to perform a burden only test up to 0.5
ohms. Figure 1.19 is the graphical representa on of how the secondary
current dropped as burden was added.
Figure 1.19 CT Burden Test Results for the PowerMaster
25
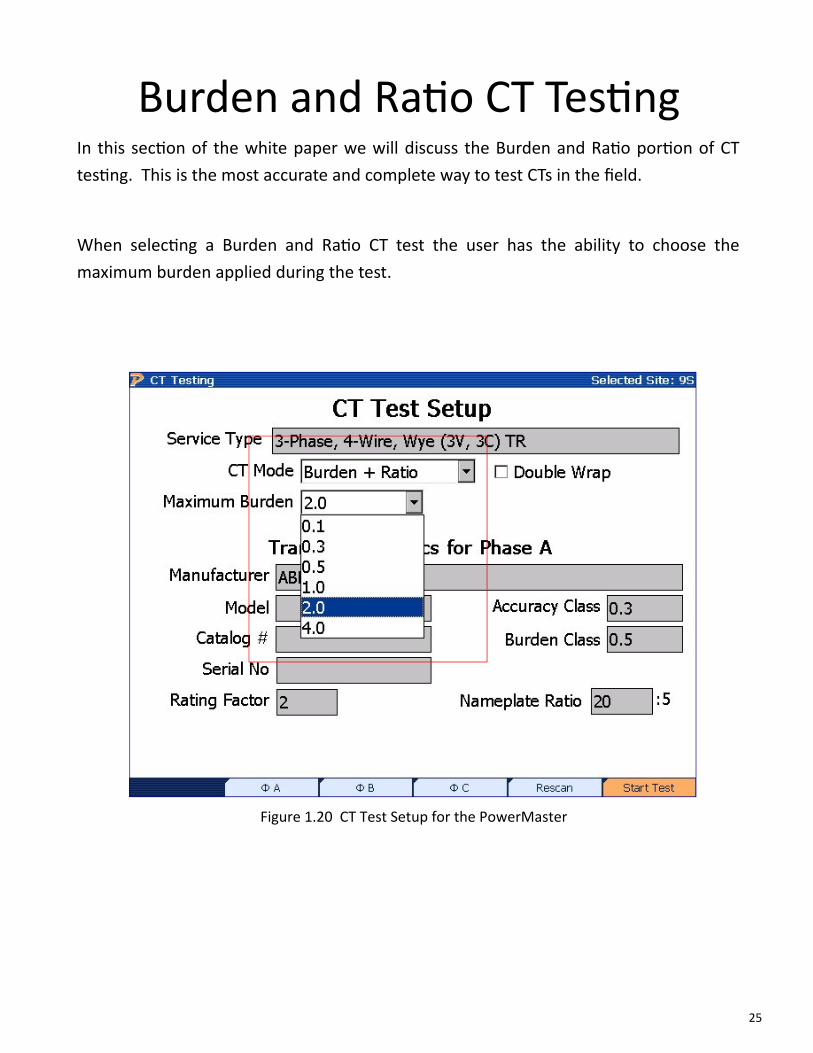
In this sec on of the white paper we will discuss the Burden and Ra o por on of CT
tes ng. This is the most accurate and complete way to test CTs in the field.
When selec ng a Burden and Ra o CT test the user has the ability to choose the
maximum burden applied during the test.
Burden and Ra o CT Tes ng
Figure 1.20 CT Test Setup for the PowerMaster

26
Amplitude Error (%)
Phase Error (minutes)
60 minutes = 1 degree
+ 0.15
+ 0.3
+ 0.45
+ 0.6
‐ 0.15
‐ 0.3
0
‐ 0.45
‐ 0.6
0 + 10 + 20 + 30 ‐ 10 ‐ 20 ‐ 30 ‐ 40 + 40
+ 0.75
+ 0.9
‐ 0.75
‐ 0.9 + 50 + 60 ‐ 50 ‐ 60
User Defined
100% Rated Load Limit
100%
Rated Load Limit At Installed Burden
CT Specs: Ra o = 20:5 Ra ng Factor = 2 Accuracy = 0.3 Burden Ra ng = 0.5
The graphical representa ons for the burden and ra o test follow all the same
rules as we defined earlier in the ra o only por on of this white paper. The only
difference is that there will be mul ple test points depending on the maximum
burden the user has selected. For example, if the user selected 1.0 ohms as the
maximum burden, the test points would correspond to the mul ple test points
as shown in Figure 1.21. This illustrates that as the secondary current drops
(because of extra applied burden), the ra o can also change in amplitude and
phase error. All pass/fail designa ons are based on the FIRST test point.
+ 0.3 ohms
+ 0.5 ohms
+ 1.0 ohms
+ 0.1 ohms
PASS/FAIL based on
this test point ONLY
Figure 1.21
27
Conclusion
When tes ng instrument transformers, the PowerMaster has the ability to analyze and
display the data to the user in a prac cal format. However, understanding the nature
and limita on of a CT becomes paramount when interpre ng the data. This paper
should now educate the user on the func onal aspects of a CT and what results should
be expected when certain a ributes are present. This paper should also guide the
user on how to configure the PowerMaster to yield expected results that can be
presented in a fully educated manner.