CT Signs of fugal Portal Venous Flow in Patients With Cirrhosis
5
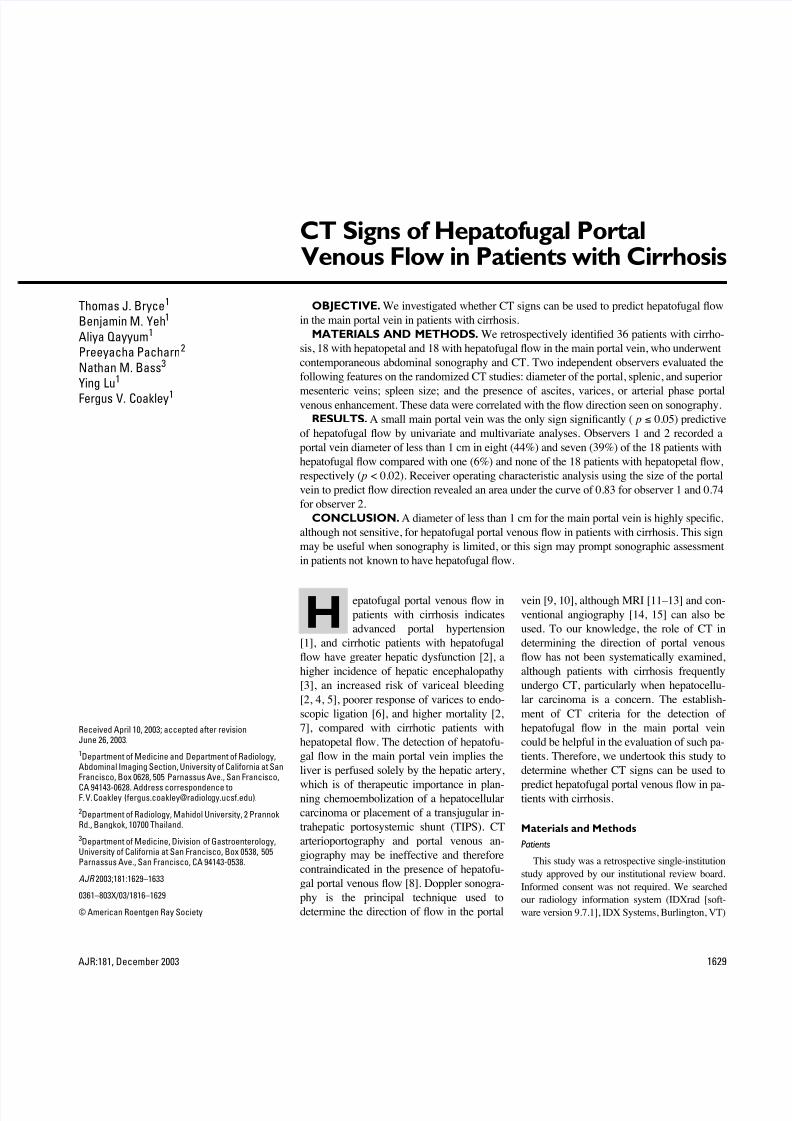
AJR:181, December 2003 1629 CT Signs of Hepatofugal Portal Venous Flow in Patients with Cirrhosis OBJECTIVE. We investigated whether CT signs can be used to predict hepatofugal flow in the main portal vein in patients with cirrhosis. MATERIALS AND METHODS. We retrospectively identified 36 patients with cirrho- sis, 18 with hepatopetal and 18 with hepatofugal flow in the main portal vein, who underwent contemporaneous abdominal sonography and CT. Two independent observers evaluated the following features on the randomized CT studies: diameter of the portal, splenic, and superior mesenteric veins; spleen size; and the presence of ascites, varices, or arterial phase portal venous enhancement. These data were correlated with the flow direction seen on sonography. RESULTS. A small main portal vein was the only sign significantly ( p ≤ 0.05) predictive of hepatofugal flow by univariate and multivariate analyses. Observers 1 and 2 recorded a portal vein diameter of less than 1 cm in eight (44%) and seven (39%) of the 18 patients with hepatofugal flow compared with one (6%) and none of the 18 patients with hepatopetal flow, respectively ( p < 0.02). Receiver operating characteristic analysis using the size of the portal vein to predict flow direction revealed an area under the curve of 0.83 for observer 1 and 0.74 for observer 2. CONCLUSION. A diameter of less than 1 cm for the main portal vein is highly specific, although not sensitive, for hepatofugal portal venous flow in patients with cirrhosis. This sign may be useful when sonography is limited, or this sign may prompt sonographic assessment in patients not known to have hepatofugal flow. epatofugal portal venous flow in patients with cirrhosis indicates advanced portal hypertension [1], and cirrhotic patients with hepatofugal flow have greater hepatic dysfunction [2], a higher incidence of hepatic encephalopathy [3], an increased risk of variceal bleeding [2, 4, 5], poorer response of varices to endo- scopic ligation [6], and higher mortality [2, 7], compared with cirrhotic patients with hepatopetal flow. The detection of hepatofu- gal flow in the main portal vein implies the liver is perfused solely by the hepatic artery, which is of therapeutic importance in plan- ning chemoembolization of a hepatocellular carcinoma or placement of a transjugular in- trahepatic portosystemic shunt (TIPS). CT arterioportography and portal venous an- giography may be ineffective and therefore contraindicated in the presence of hepatofu- gal portal venous flow [8]. Doppler sonogra- phy is the principal technique used to determine the direction of flow in the portal vein [9, 10], although MRI [11–13] and con- ventional angiography [14, 15] can also be used. To our knowledge, the role of CT in determining the direction of portal venous flow has not been systematically examined, although patients with cirrhosis frequently undergo CT, particularly when hepatocellu- lar carcinoma is a concern. The establish- ment of CT criteria for the detection of hepatofugal flow in the main portal vein could be helpful in the evaluation of such pa- tients. Therefore, we undertook this study to determine whether CT signs can be used to predict hepatofugal portal venous flow in pa- tients with cirrhosis. Materials and Methods Patients This study was a retrospective single-institution study approved by our institutional review board. Informed consent was not required. We searched our radiology information system (IDXrad [soft- ware version 9.7.1], IDX Systems, Burlington, VT) Thomas J. Bryce 1 Benjamin M. Yeh 1 Aliya Qayyum 1 Preeyacha Pacharn 2 Nathan M. Bass 3 Ying Lu 1 Fergus V. Coakley 1 Received April 10, 2003; accepted after revision June 26, 2003. 1 Department of Medicine and Department of Radiology, Abdominal Imaging Section, University of California at San Francisco, Box 0628, 505 Parnassus Ave., San Francisco, CA 94143-0628. Address correspondence to F. V. Coakley (fergus.coakley@radiolo gy.ucsf.edu). 2 Department of Radiology, Mahidol University, 2 Prannok Rd., Bangkok, 10700 Thailand. 3 Department of Medicine, Division of Gastroenterology, University of California at San Francisco, Box 0538, 505 Parnassus Ave., San Francisco, CA 94143-0538. AJR 2003;181:1629–1633 0361–803X/03/1816–1629 © American Roentgen Ray Society H
Transcript of CT Signs of fugal Portal Venous Flow in Patients With Cirrhosis
8/8/2019 CT Signs of fugal Portal Venous Flow in Patients With Cirrhosis
http://slidepdf.com/reader/full/ct-signs-of-fugal-portal-venous-flow-in-patients-with-cirrhosis 1/5
AJR:181, December 2003 1629
CT Signs of Hepatofugal PortalVenous Flow in Patients with Cirrhosis
OBJECTIVE. We investigated whether CT signs can be used to predict hepatofugal flow
in the main portal vein in patients with cirrhosis.
MATERIALS AND METHODS. We retrospectively identified 36 patients with cirrho-
sis, 18 with hepatopetal and 18 with hepatofugal flow in the main portal vein, who underwent
contemporaneous abdominal sonography and CT. Two independent observers evaluated the
following features on the randomized CT studies: diameter of the portal, splenic, and superior
mesenteric veins; spleen size; and the presence of ascites, varices, or arterial phase portalvenous enhancement. These data were correlated with the flow direction seen on sonography.
RESULTS.
A small main portal vein was the only sign significantly (
p
≤
0.05) predictive
of hepatofugal flow by univariate and multivariate analyses. Observers 1 and 2 recorded a
portal vein diameter of less than 1 cm in eight (44%) and seven (39%) of the 18 patients with
hepatofugal flow compared with one (6%) and none of the 18 patients with hepatopetal flow,
respectively (
p
< 0.02). Receiver operating characteristic analysis using the size of the portal
vein to predict flow direction revealed an area under the curve of 0.83 for observer 1 and 0.74
for observer 2.
CONCLUSION.
A diameter of less than 1 cm for the main portal vein is highly specific,
although not sensitive, for hepatofugal portal venous flow in patients with cirrhosis. This sign
may be useful when sonography is limited, or this sign may prompt sonographic assessment
in patients not known to have hepatofugal flow.
epatofugal portal venous flow in
patients with cirrhosis indicates
advanced portal hypertension
[1], and cirrhotic patients with hepatofugal
flow have greater hepatic dysfunction [2], a
higher incidence of hepatic encephalopathy
[3], an increased risk of variceal bleeding
[2, 4, 5], poorer response of varices to endo-
scopic ligation [6], and higher mortality [2,
7], compared with cirrhotic patients with
hepatopetal flow. The detection of hepatofu-
gal flow in the main portal vein implies the
liver is perfused solely by the hepatic artery,
which is of therapeutic importance in plan-ning chemoembolization of a hepatocellular
carcinoma or placement of a transjugular in-
trahepatic portosystemic shunt (TIPS). CT
arterioportography and portal venous an-
giography may be ineffective and therefore
contraindicated in the presence of hepatofu-
gal portal venous flow [8]. Doppler sonogra-
phy is the principal technique used to
determine the direction of flow in the portal
vein [9, 10], although MRI [11–13] and con-
ventional angiography [14, 15] can also be
used. To our knowledge, the role of CT in
determining the direction of portal venous
flow has not been systematically examined,
although patients with cirrhosis frequently
undergo CT, particularly when hepatocellu-
lar carcinoma is a concern. The establish-
ment of CT criteria for the detection of
hepatofugal flow in the main portal vein
could be helpful in the evaluation of such pa-
tients. Therefore, we undertook this study to
determine whether CT signs can be used to
predict hepatofugal portal venous flow in pa-tients with cirrhosis.
Materials and Methods
Patients
This study was a retrospective single-institution
study approved by our institutional review board.
Informed consent was not required. We searched
our radiology information system (IDXrad [soft-
ware version 9.7.1], IDX Systems, Burlington, VT)
Thomas J. Bryce
1
Benjamin M. Yeh
1
Aliya Qayyum
1
Preeyacha Pacharn
2
Nathan M. Bass
3
Ying Lu
1
Fergus V. Coakley
1
Received April 10, 2003; accepted after revisionJune 26, 2003.
1
Department of Medicine and Department of Radiology,Abdominal Imaging Section, University of California at SanFrancisco, Box 0628, 505 Parnassus Ave., San Francisco,
CA 94143-0628. Address correspondence toF. V. Coakley ([email protected]).
2
Department of Radiology, Mahidol University, 2 PrannokRd., Bangkok, 10700 Thailand.
3
Department of Medicine, Division of Gastroenterology,University of California at San Francisco, Box 0538, 505Parnassus Ave., San Francisco, CA 94143-0538.
AJR
2003;181:1629–1633
0361–803X/03/1816–1629
© American Roentgen Ray Society
H

8/8/2019 CT Signs of fugal Portal Venous Flow in Patients With Cirrhosis
http://slidepdf.com/reader/full/ct-signs-of-fugal-portal-venous-flow-in-patients-with-cirrhosis 2/5
1630
AJR:181, December 2003
Bryce et al.
and medical records for the period of October 1998
to March 2002 to identify patients meeting the fol-
lowing sequential criteria: abdominal sonography
report containing the term “cirrhosis”; contempora-
neous (within 5 months) abdominal CT; direction
of flow in the main portal vein described in the
sonography report; absence of TIPS or thrombosis
of the main portal vein; and histologic diagnosis of cirrhosis (
n
= 11) or a clear clinical diagnosis of
cirrhosis documented in the medical record (
n
=
25). We identified 18 patients with hepatofugal
flow in the main portal vein who met these criteria.
We then randomly selected an additional 18 pa-
tients with hepatopetal flow who also met these cri-
teria to form the final study population of 36
patients. None of the patients was assigned a
Child-Pugh class because not all required data
were available retrospectively.
The mean age of patients in the hepatopetal
group was 59 years (range, 44–80 years) versus 51
years (range, 17–73 years) in the hepatofugal
group. The hepatopetal group comprised 10 men
and eight women, and the hepatofugal group com-
prised seven men and 11 women. In the hepato-
petal group, the diagnosis of cirrhosis was
established by histology in six patients and on
clinical grounds in 12; in the hepatofugal group,
cirrhosis was established by histology in five pa-
tients and on clinical grounds in 13. Of those pa-
tients without histologic confirmation, cirrhosis
was diagnosed by a gastroenterologist in all but
two, both of whom had hepatofugal portal venous
flow. In these two patients, cirrhosis was diag-
nosed on the basis of clinical evidence including a
history of severe alcohol abuse; gross findings of
cirrhosis on imaging studies; and large varices, as-
cites, hypoalbuminemia, and coagulopathy. The
causes for cirrhosis in the group with hepatopetal
flow and in the group with hepatofugal flow, re-spectively, included the following: chronic viral
hepatitis, 11 and four patients; viral hepatitis and
ethanol abuse, two patients and one patient; etha-
nol abuse alone, 0 and six patients; autoimmune
hepatitis, one and three patients; nonalcoholic ste-
atotic hepatitis, one patient and 0 patients; primary
sclerosing cholangitis, one and three patients; and
cystic fibrosis, 0 and one patient. Cirrhosis was
cryptogenic in two patients with hepatopetal flow.
The median time between sonography and CT
was 23 days (range, 0–148 days) in the hepato-
petal group and 3 days (range, 0–97 days) in the
hepatofugal group. If sonography had been per-
formed more than 48 hr before or after the CT ex-
amination (hepatopetal group
, n
= 14; hepatofugalgroup, n
= 9), we identified a second Doppler
sonographic study of flow direction in the main
portal vein for each patient so that sonography oc-
curred before and after the CT examination
(hepatopetal group
, n
= 9; hepatofugal group, n
=
5). Alternatively, if CT had not been performed be-
tween the sonographic examinations, we identified
the two sonographic examinations closest in time
to the CT examination (hepatopetal group
, n
= 2;
hepatofugal group, n
= 2). In these patients, the
time lag between CT and sonography for the two
patients with hepatopetal flow was 3 and 31 days,
and for the two patients with hepatofugal flow, the
lag was 37 and 62 days. Additional studies were
not available for the remaining three hepatopetal
and two hepatofugal patients. All additional sono-
graphic studies evaluated confirmed the flow di-
rection seen on the initial study.
Imaging Technique
All CT examinations were performed on mul-
tidetector scanners (LightSpeed or HiSpeed, Gen-
eral Electric Medical Systems, Milwaukee, WI).
Thirty-four of the 36 patients received 150 mL of
IV iohexol (Omnipaque 350, Nycomed Amersham,
Princeton, NJ), and images were acquired in the
portal venous phase of enhancement (70-sec scan
delay with 5-mm slice collimation). Images were
also acquired in the arterial phase of enhancement
(45-sec scan delay with 2.5-mm slice collimation)
in 20 of these patients. Two patients (one with
hepatopetal and one with hepatofugal flow) did not
receive IV contrast material. All patients received
oral diatrizoate meglumine (Hypaque, Nycomed
Amersham). All images were contiguous. Color
Doppler sonography of the direction of flow in the
main portal vein was performed using a scanner
(Sequoia 512, Acuson Solutions, Mountain View,
CA) with a 1.75- to 4-MHz sector transducer (4V1,
Acuson Solutions) or a 2.5- to 4-MHz sector trans-
ducer (4V2,
Acuson Solutions).
CT Interpretation
Two radiologists independently reviewed the
randomized CT images of all 36 patients on a
PACS (picture archiving and communication sys-
tem) workstation (Impax DS 3000 [release 4.1],
Agfa, Mortsel, Belgium). Observers were unaware
of clinical and sonographic findings. Both observ-ers recorded the following CT signs: short-axis di-
ameter of the main portal vein, which was
measured midway between the splenoportal con-
fluence and the portal vein bifurcation in the porta
hepatis; maximum short-axis diameter of the supe-
rior mesenteric vein, measured on the first image
that was clearly inferior to the splenoportal conflu-
ence; diameter of the splenic vein, measured adja-
cent to the midportion of the pancreatic tail;
presence or absence of ascites; presence or ab-
sence of varices; and spleen size, recorded as the
maximum axial diameter. In addition, for mul-
tiphase CT examinations (
n
= 20), the presence or
absence of early (i.e., arterial phase) enhancement
of the main portal vein was recorded.
Data Analysis
Statistical analysis was performed using statis-
tical analysis software (SAS version 8.1, SAS,
Cary, NC). Continuous data (vessel diameters and
spleen size) were examined by univariate analysis
using the two-tailed Cochran t
test.
Noncontinuous
data (all other categories) were examined using
Fisher’s exact test. The univariate analyses were
performed separately for the data for each ob-
server. All p values of 0.05 or less were considered
significant. Interobserver agreement for categori-
cal data was measured with kappa statistics [16].
Interobserver agreement for continuous data was
assessed using Bland-Altman regression [17] with
Bradley-Blackwood p
values [18]. Multivariate
analysis was performed using logistic regression
with a generalized linear model to account for thepresence of two observers. Parameters were se-
lected in a stepwise fashion with a type 3 signifi-
cance level of 0.05 or less required for factors to
remain in the model. Receiver operating character-
istic (ROC) analysis and area under the ROC curve
(A
z
) calculations were performed to evaluate pre-
dictive models.
Results
The CT signs recorded by each observer
showed high interobserver consistency for
all measurements other than the presence of
varices and the size of the spleen. A small
main portal vein correlated strongly (
p
<0.01) with hepatofugal flow by univariate
and multivariate analyses (Fig. 1). No other
signs achieved significance by either
method. ROC analysis using the diameter of
the main portal vein to predict hepatofugal
flow revealed an A
z
of 0.83 for observer 1
and 0.74 for observer 2 (Fig. 2).
Observer 1 found that the main portal vein
measured less than 1 cm in eight (44%) of 18
patients with hepatofugal flow, but in only
one (6%) of 18 patients with hepatopetal
flow (
p
< 0.02). Thus, the sensitivity of this
sign for predicting hepatofugal flow was
44% and the specificity was 94%. Observer 2found that the main portal vein measured less
than 1 cm in seven (39%) of 18 patients with
hepatofugal flow and 0 of 18 patients with
hepatopetal flow (
p
< 0.01), for a sensitivity
of 39% and a specificity of 100%.
The 1-cm measurement was the largest
(most sensitive) threshold that could be used
to predict hepatofugal flow without signifi-
cantly reducing specificity, given that both
observers measured the main portal vein at
or slightly above 1 cm in several patients
with hepatopetal flow (Fig. 1). A lower
threshold would reduce sensitivity without
significantly increasing specificity, and ahigher threshold would greatly reduce speci-
ficity with only mildly increasing sensitivity
(Fig. 2). A representative case illustrates the
finding of a small portal vein in a patient
with hepatofugal flow (Fig. 3). Arterial phase
enhancement of the portal vein was seen in
only one patient; in that patient, flow in the
portal vein was hepatopetal on sonography 1
day before CT (Fig. 4).

8/8/2019 CT Signs of fugal Portal Venous Flow in Patients With Cirrhosis
http://slidepdf.com/reader/full/ct-signs-of-fugal-portal-venous-flow-in-patients-with-cirrhosis 3/5
CT Signs of Hepatofugal Portal Venous Flow
AJR:181, December 2003
1631
0
0
0.2
0.2
0.4
0.4
0.6
0.6
0.8
0.8
1
1
False-Positive Fraction
T r u e - P o s i t i v e F r a c t i o n
Observer 1 Observer 2
D i a m e t e r o f M a i n P o r t a l V
e i n ( c m )
Hepatopetal Hepatofugal Hepatopetal Hepatofugal0
0.5
1
1.5
2
2.5
Fig. 2.—Diagram shows receiver operating characteristic (ROC) values achieved usingsmall main portal vein diameter to predict hepatofugal flow in main portal vein in pa- tients with cirrhosis. Operating points achieved by predicting hepatofugal flow whenmain portal vein diameter was less than 1 cm are shown for observer 1 (×) and observer2 (Δ). Note that at appropriate operating points, this sign is highly specific for hepatofu-gal flow. Area under ROC curve (Az ) was 0.83 for observer 1 and 0.74 for observer 2.
Fig. 1.—Diagram shows diameters of main portal vein in patients with hepatopetalflow versus hepatofugal flow. Note that main portal vein diameter of less than 1 cmis highly specific for hepatofugal flow.
Fig. 3.—73-year-old woman with cirrhosis due to alcohol abuse.A, Axial CT scan obtained during portal venous phase shows small (8 mm in diameter) main portal vein (arrow ); this finding strongly correlates with hepatofugal flow.B, Sonogram shows hepatofugal flow in main portal vein.
BA

8/8/2019 CT Signs of fugal Portal Venous Flow in Patients With Cirrhosis
http://slidepdf.com/reader/full/ct-signs-of-fugal-portal-venous-flow-in-patients-with-cirrhosis 4/5
1632
AJR:181, December 2003
Bryce et al.
Discussion
Our finding that a relatively small main
portal vein in patients with cirrhosis indi-
cates hepatofugal flow is consistent with the
physiology of hepatofugal flow in the cir-
rhotic liver. The average size of the main
portal vein in healthy adults has been found
to be 1.0 cm [19]; a main portal vein of less
than 1 cm can be considered relatively small
in a cirrhotic patient because portal hyper-
tension tends to increase portal vein size
[20]. Normally, the portal vein receives flow
from the superior mesenteric vein and the
splenic vein. In patients with cirrhosis and
hepatofugal flow in the main portal vein, the
portal vein is supplied only by the hepatic
artery, which also supplies the hepatic veins.
This decrease in flow volume could explain
the decreased diameter of the portal vein. (A
small main portal vein in cirrhotic patients
has been associated with spontaneous sple-norenal shunts [21], a phenomenon that
would also be expected to reduce hepatic
portal venous perfusion.) Although specific
for hepatofugal flow, this sign was of only
moderate sensitivity in our study group.
Possible explanations for the limited sensi-
tivity may include a tendency for the vein to
remain patulous after enlarging in earlier
stages of portal hypertension and the possi-
bility that portal hypertension may provide a
continuing impetus for venous enlargement,
despite a reduction or reversal in flow.
Arterial phase enhancement of the portal
vein has been reported as a sign of hepatofu-
gal flow [1, 22]. In our study, this sign was
present in only one of 20 patients undergoing
CT with arterial phase contrast enhancement,
and Doppler sonography of this patient 1 day
before CT showed hepatopetal flow. The
finding of arterial phase enhancement of the
portal vein on CT in a patient with hepato-
petal portal venous flow on sonography is
puzzling but might be explained by transient
changes in flow direction in the portal
venous system. Such flow changes can occur
spontaneously in cirrhotic patients [23], in
the postprandial state [24, 25], and during
hepatic arteriography [26]. Disturbance of
baseline physiology during abdominal CT,
such as due to breath-hold technique or bolus
administration of IV contrast material, may
alter portal venous hemodynamics. For ex-
ample, contrast administration might elevate
right heart and hepatic vein pressures, and
the subsequent increased shunting of hepatic
arterial blood into the portal venous system
may result in temporary hepatofugal flow.
Our study has several limitations. The sam-
ple size was small and may have restricted the
power of the study to detect differences be-
tween the hepatopetal and hepatofugal
groups. For example, the prevalence of ascites
and varices was higher in patients with
hepatofugal flow, but these differences did not
achieve statistical significance. These factors
might exhibit an association with hepatofugal
flow in a larger study. CT and sonography
were not immediately contemporaneous. The
lag between the examinations may have low-
ered the sensitivity of the study for additional
predictors of hepatofugal flow, although the
possible effects of the time difference would
be expected to apply to both hepatopetal and
hepatofugal groups of patients. The lag be-
tween studies would not be expected to gener-
ate spurious associations and should not
detract from the finding that a small portal
vein size is associated with hepatofugal portal
venous flow. Analysis of additional sonogra-
phy examinations of the study population pro-
vided evidence that the direction of portal
venous flow in our subjects was stable. There-
fore, it is reasonable to expect that the direc-
tion of flow at the time of CT would be
accurately predicted by the contemporaneous
sonographic examination that was evaluated.
Fig. 4.—49-year-old man with cirrhosis due to chronic hepatitis C infection.A, CT scan obtained during arterial phase shows contrast enhancement of portal vein. This sign is thought to indicate hepatofugal portal venous flow.B, Doppler sonogram obtained 1 day earlier than A, however, reveals hepatopetal flow.
BA

8/8/2019 CT Signs of fugal Portal Venous Flow in Patients With Cirrhosis
http://slidepdf.com/reader/full/ct-signs-of-fugal-portal-venous-flow-in-patients-with-cirrhosis 5/5
CT Signs of Hepatofugal Portal Venous Flow
AJR:181, December 2003
1633
High interobserver consistency was not
seen for the measurement of spleen size and
assessment for the presence or absence of va-
rices. The discrepancy in identification of va-
rices between observers could be explained by
a greater sensitivity of observer 2 for varices in
borderline cases, given that all cases identified
as positive by observer 1 were also called posi-
tive by observer 2, but not vice versa. The in-
terobserver variation regarding spleen size
may have resulted from the complex and
partly subjective methodology used, which in-
volved identifying the maximal single dimen-
sion of the spleen on any axial image.
This study did not seek to measure the
prevalence of hepatofugal flow in the entire
population of cirrhotic patients, although this
information would be required to determine
predictive values. This is important given that
our sign, although highly specific, is of lim-
ited sensitivity. The prevalence of hepatofu-
gal flow in unselected cirrhotic patients has
been previously estimated at 3.1–3.4% [2,
27], rising to 9% or more in patients with ad-
vanced cirrhosis [2, 28]. Finally, the diagno-
sis of cirrhosis was confirmed histologically
in only about one third of the study subjects.
However, most patients with a diagnosis of
cirrhosis do not undergo histologic confirma-
tion. Restricting the analysis to only those pa-
tients with a histologic diagnosis would have
selected for substantially more diseased or
symptomatic patients, possibly harming the
generalizability of our results. Given that all
patients in this study had significant risk fac-tors for cirrhosis, had imaging features con-
sistent with cirrhosis, and had either
histologic confirmation of cirrhosis or had
been assigned the diagnosis of cirrhosis at a
tertiary care center (by a gastroenterologist in
all but two cases), we believe that the proba-
bility of noncirrhotic patients existing within
the study population is low.
In conclusion, our data suggest that a main
portal vein diameter of less than 1 cm is
highly specific for hepatofugal portal venous
flow in cirrhotic patients, although the sensi-
tivity of this sign is limited. If validated in
prospective studies, this sign may be usefulwhen sonography is limited or may prompt
sonographic assessment in patients not
known to have hepatofugal flow.
References
1. Wachsberg RH, Bahramipour P, Sofocleous CT,
Barone A. Hepatofugal flow in the portal venous
system: pathophysiology, imaging findings, and di-
agnostic pitfalls. RadioGraphics
2002;22:123–1402. Tarantino L, Giorgio A, de Stefano G, et al. Re-
verse flow in intrahepatic portal vessels and liver
function impairment in cirrhosis. Eur J Ultra-
sound
1997;6:171–177
3. Smith-Laing G, Camilo ME, Dick R, Sherlock S.
Percutaneous transhepatic portography in the as-
sessment of portal hypertension: clinical correla-
tions and comparison of radiographic techniques.
Gastroenterology
1980;78:197–205
4. Wachsberg RH, Simmons MZ. Coronary vein di-
ameter and flow direction in patients with portal
hypertension: evaluation with duplex sonography
and correlation with variceal bleeding. AJR
1994;162:637–641
5. Komatsuda T, Ishida H, Konno K, et al. Color
Doppler findings of gastrointestinal varices. Ab-dom
Imaging
1998;23:45–50
6. Matsumoto A, Hamamoto N, Ohnishi A, et al.
Left gastric vein hemodynamics and variceal re-
currence in patients undergoing prophylactic en-
doscopic ligation of high-risk esophageal varices.
Gastrointest
Endosc
1999;50:768–774
7. Finucci G, Bellon S, Merkel C, et al. Evaluation
of splanchnic angiography as a prognostic index
of survival in patients with cirrhosis. Scand
J
Gastroenterol
1991;26:951–960
8. Oliver JH 3rd, Baron RL, Dodd GD 3rd, Peterson
MS, Carr BI. Does advanced cirrhosis with porto-
systemic shunting affect the value of CT arterial
portography in the evaluation of the liver? AJR
1995;164:333–337
9. Ralls PW. Color Doppler sonography of the he-patic artery and portal venous system. AJR
1990;155:517–525
10. Johansen K, Paun M. Duplex ultrasonography of the
portal vein. Surg Clin North Am 1990;70:181–190
11. Burkart DJ, Johnson CD, Morton MJ, Ehman RL.
Phase-contrast cine MR angiography in chronic
liver disease. Radiology
1993;187:407–412
12. Imazu H, Matsui T, Noguchi R, et al. Magnetic
resonance angiography for monitoring prophylac-
tic endoscopic treatment of high risk esophageal
varices. Endoscopy
2000;32:766–772
13. Finn JP, Kane RA, Edelman RR, et al. Imaging of
the portal venous system in patients with cirrho-
sis: MR angiography vs duplex Doppler sonogra-
phy. AJR
1993;161:989–994
14. Herlinger H. Arterioportography. Clin
Radiol
1978;29:255–275
15. Nelson RC, Lovett KE, Chezmar JL, et al. Com-
parison of pulsed Doppler sonography and an-
giography in patients with portal hypertension.
AJR
1987;149:77–81
16. Landis JR, Koch GG. The measurement of ob-
server agreement for categorical data. Biometrics
1977;33:159–174
17. Bland JM, Altman DG. Statistical methods for as-
sessing agreement between two methods of clini-
cal measurement. Lancet
1986;1:307–310
18. Bradley EL, Blackwood LG. Comparing paired
data: a simultaneous test of means and variances.
Am Stat 1989;43:234–235
19. Niederau C, Sonnenberg A, Muller JE, Erckenbre-
cht JF, Scholten T, Fritsch WP. Sonographic mea-
surements of the normal liver, spleen, pancreas, and
portal vein. Radiology
1983;149:537–540
20. Subramanyam BR, Balthar EJ, Raghavendra BN,
Lefleur RS. Sonographic evaluation of patients
with portal hypertension. Am J Gastroenterol
1983;78:369–373
21. Brancatelli G, Federle MP, Pealer K, Geller DA.
Portal venous thrombosis or sclerosis in liver
transplantation candidates: preoperative CT find-
ings and correlation with surgical procedure. Ra-
diology
2001;220:321–328
22. Park CM, Cha SH, Kim DH, et al. Hepatic arteri-
oportal shunts not directly related to hepatocellular
carcinoma: findings on CT during hepatic arteriog-
raphy, CT arterial portography and dual phase spi-
ral CT. Clin Radiol 2000;55:465–470
23. Hoevels J, Lunderquist A, Tylen U. Spontaneous
intermittent reversal of blood flow in intrahepatic
portal vein branches in cirrhosis of the liver. Car-
diovasc Radiol
1979;2:267–273
24. de Vries PJ, de Hooge P, Hoekstra JB, van Hat-
tum J. Postprandial reversal of the portal venous
flow in a patient with liver cirrhosis. Neth J Med
1995;47:235–240
25. Tochio H, Kudo M, Nishiuma S, Okabe Y. Intra-
hepatic spontaneous retrograde portal flow in pa-tients with cirrhosis of the liver: reversal by food
intake. AJR
2001;177:1109–1112
26. Ohnishi K, Saito M, Sato S, et al. Direction of
splenic venous flow assessed by pulsed Doppler
flowmetry in patients with a large splenorenal
shunt: relation to spontaneous hepatic encephalop-
athy. Gastroenterology
1985;89:180–185
27. Gaiani S, Bolondi L, Li Bassi S, Zironi G, Siringo
S, Barbara L. Prevalence of spontaneous hepatofu-
gal portal flow in liver cirrhosis: clinical and endo-
scopic correlation in 228 patients. Gastroenterology
1991;100:160–167
28. von Herbay A, Frieling T, Haussinger D. Color
Doppler sonographic evaluation of spontaneous
portosystemic shunts and inversion of portal
venous flow in patients with cirrhosis.
J Clin Ul-trasound
2000;28:332–333