CSRE report template - Support, Service Delivery, Social ... · Web viewWoodward, L J and D M...
49
Understanding subgroups of sole parents receiving main benefits Centre for Social Research and Evaluation Te Pokapū Rangahau Arotake Hapori July 2010 ISBN 978-0-478-32363-4 (online)
Transcript of CSRE report template - Support, Service Delivery, Social ... · Web viewWoodward, L J and D M...

Understanding subgroups of sole parents receiving main benefits
Centre for Social Research and EvaluationTe Pokapū Rangahau Arotake Hapori
July 2010
ISBN 978-0-478-32363-4 (online)

Contents
Executive summary......................................................................................................1Background..................................................................................................................3Key findings..................................................................................................................4
A relatively disadvantaged profile overall..................................................................4Four high level groupings..........................................................................................4Summary of high level groups and subgroups.........................................................5Ethnic composition....................................................................................................8Benefit history...........................................................................................................9Debt to MSD and Special Needs Grant use.............................................................9Special Benefit........................................................................................................10Section 70A deductions..........................................................................................10Indicators of the health of sole parents on main benefits and of their children.......11Location and local area deprivation........................................................................12Indicators of educational attainment.......................................................................13Employment histories..............................................................................................14Exits from benefit and employment and partnering outcomes................................15
Discussion..................................................................................................................18Other challenges in moving towards employment..................................................18Teenage parenthood and disadvantage.................................................................18Tailoring approaches and interventions..................................................................19
Bibliography................................................................................................................21Appendix 1 Research approach................................................................................23Appendix 2 Profile of high level groups and subgroups, at 31 December 2005........28

Executive summary
This research aimed to increase our understanding of the sole parent benefit recipient population and to identify and better understand subgroups within that population, particularly disadvantaged subgroups, to inform policy and service development.
It explored the parenting, partnering, benefit and employment histories and other characteristics of sole parents receiving main benefits at the end of 2005, to the extent that these could be observed through the benefit administration data available.
On average, sole parents receiving main benefits had more disadvantaged backgrounds than might have been expected:
just over half had spent at least 80% of the history period observed (the previous 10 years in most cases) supported by main benefits
a third appeared to have become parents in their teenage years.
This reflects the over-representation of sole parents with long stays on benefit among those in receipt at any point in time, and the longer than average stays on benefit for those who become parents as teenagers.
Had the research considered all people granted benefit as a sole parent, or all people who received benefit as a sole parent over a window of time rather than at a point in time, the overall profile of the group would have appeared less disadvantaged.
Clustering techniques were used to identify 12 subgroups which give a rich picture of the diverse backgrounds and circumstances of sole parents receiving main benefits at the end of 2005. These 12 subgroups can be grouped into four high level groups: Early Starters Later Starters Older Long-term Domestic Purposes Benefit (DPB) Other Groups.
Early Starters (36% of sole parent benefit recipients, average age 29) tended to be ’early starters‘ both in terms of the age at which they became parents, and in terms of the age at which they had their first contact with the benefit system. Six in 10 appeared to have had children before age 20, and nine in 10 appeared to have had children before age 25. They were more likely than other sole parent benefit recipients to have spent a large proportion of their time supported by main benefits.
Later Starters (25% of sole parent benefit recipients, average age 30) tended to be older when they had their first child and older when they had their first contact with the benefit system. They were more likely than other sole parent benefit recipients to have only one child, to have a very young child, and to have spent some of their time employed and off benefit.
Older Long-term DPB recipients (22% of sole parent benefit recipients, average age 42) tended to have spent most of the last 10 years on DPB. Most had just one child, in most cases aged 10 or over.
1
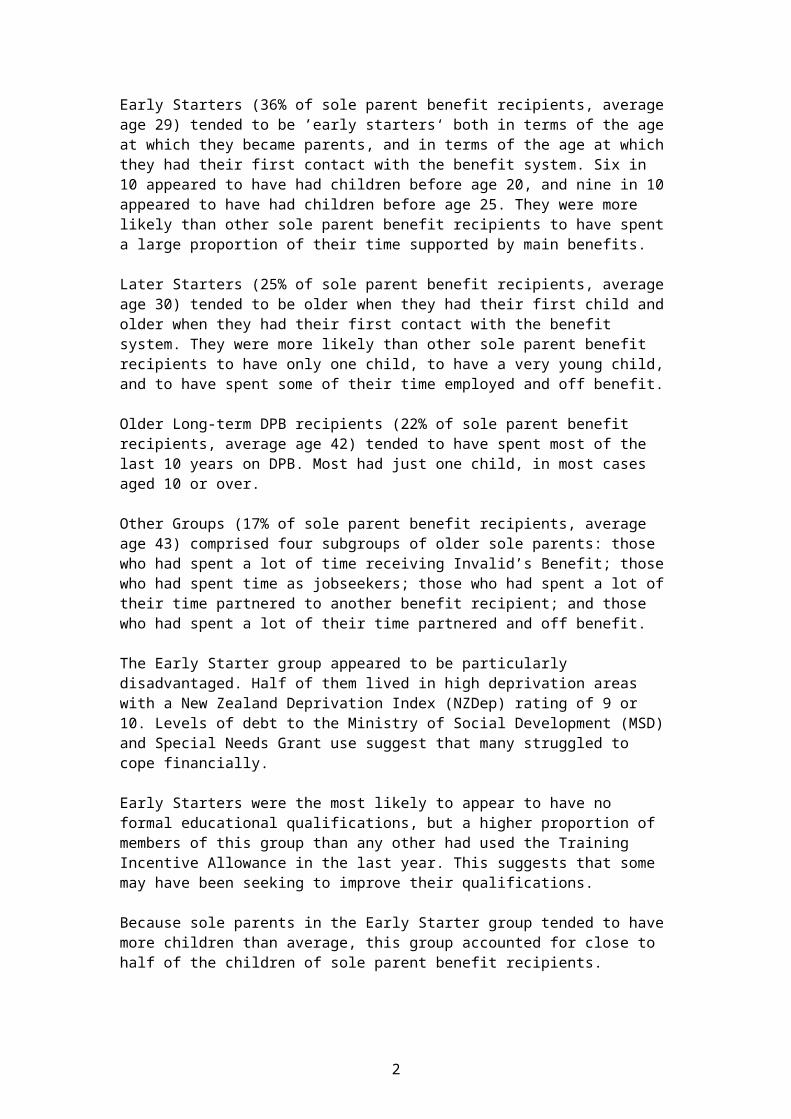
Other Groups (17% of sole parent benefit recipients, average age 43) comprised four subgroups of older sole parents: those who had spent a lot of time receiving Invalid’s Benefit; those who had spent time as jobseekers; those who had spent a lot of their time partnered to another benefit recipient; and those who had spent a lot of their time partnered and off benefit.
The Early Starter group appeared to be particularly disadvantaged. Half of them lived in high deprivation areas with a New Zealand Deprivation Index (NZDep) rating of 9 or 10. Levels of debt to the Ministry of Social Development (MSD) and Special Needs Grant use suggest that many struggled to cope financially.
Early Starters were the most likely to appear to have no formal educational qualifications, but a higher proportion of members of this group than any other had used the Training Incentive Allowance in the last year. This suggests that some may have been seeking to improve their qualifications.
Because sole parents in the Early Starter group tended to have more children than average, this group accounted for close to half of the children of sole parent benefit recipients.
Compared to their share of the overall population of sole parents receiving main benefits, Māori were over-represented in the Early Starter group. This partly reflects ethnic differences in age structure and fertility patterns.
In every group, some sole parents were participating in employment while in receipt of benefit. However, the proportion varied from over two-thirds of selected subgroups of Older Long-term DPB recipients and Other Groups to fewer than one in 10 in other subgroups.
The subgroups that had the highest likelihood of being employed while in receipt of benefit at 31 December 2005 were also the most likely to exit to employment in the following six months. This was the period in which the Working for Families in-work tax credit was introduced. Consistent with its design, the response to that tax credit appears to have been strongest among those already working.
For other groups the rate of exit from benefit and into employment was comparatively low, and participation in employment while in receipt of benefit was also low. Many appeared to be some way from being ready to work, with a history of long-term benefit receipt, limited work experience, low qualifications and location in communities of disadvantage.
These findings highlight the variation in backgrounds and in employment outcomes, both between and within groups. They suggest that different approaches are needed for working with different people.
For many, the path to sustained part- or full-time employment may be a long one, requiring a number of different services and interventions and a series of intermediate steps.
For some, employment will not be a realistic outcome in the short term, and the priority may be interventions that improve the quality of life on benefit for both the parents and their children.
2

Background
This research aimed to increase our understanding of the sole parent benefit recipient population and to identify and better understand subgroups within that population to inform policy and service development.
In the past, information on the sole parent benefit recipient population has been largely restricted to a snap-shot at a point in time, providing limited information about people’s backgrounds.
This study constructed a range of measures, including measures of people’s backgrounds as well as of their current characteristics. It examined parenting, partnering, benefit receipt and employment backgrounds to the extent that these could be observed through the benefit administration data available.
For each person, the study looked back over a 10-year history period, or a shorter history period in the case of people aged under 28:
for those aged 20–27, we looked back to the date of their 18th birthday for those aged under 20, we looked back to their 18th birthday, or the date they
first received benefit if they received benefit as a 16 or 17 year old.
In order to identify and better understand subgroups within the population of sole parents receiving benefits, cluster analysis techniques were applied to the measures assembled.
Cluster analysis is an exploratory data analysis tool which forms groups so that the individuals in each are most similar to other members of the same group, while being as different as possible to members of other groups. It is a method that can be used to discover structures in data without testing any particular hypothesis about why those structures exist.
Any clustering analysis is inherently a subjective exercise, and the groupings arrived at are sensitive to the measures included in the analysis and the weightings they are given.
The present study focused on measures of parenting, partnering, benefit receipt and employment backgrounds, as well as measures of current circumstances and characteristics such as age, number of children, the age of the youngest child, current earnings, and the type of benefit received.
Appendix 1 describes the measures included in the analysis and the approach. The analysis was broadly similar to that applied in the Sickness and Invalid’s Benefit Client Clustering research undertaken in 2005 (McLeod and Beynon, 2006).
This report profiles the groups formed as a result of the cluster analysis against a range of measures, including some that were not used in the forming of groups (ethnicity, levels of debt to the MSD, the use of supplementary assistance, location, local area deprivation, and off-benefit outcomes over a six month follow-up, for example).
3

Key findings
A relatively disadvantaged profile overallThe research considered all sole parents in receipt of a main benefit at 31 December 2005 – around 114,000 people. Of this group:
just over half had spent at least 80% of the history period supported by main benefits
a third appeared to have become parents in their teens.1
This is a more disadvantaged profile than might have been expected. It reflects the over-representation of sole parents with long stays on benefit among those in receipt at any point in time.
Some sole parents who take up benefits require support for only a short period. Others stay in receipt of benefit for a very long time.2 Because of their long stays, this second group makes up a larger proportion of those in receipt at a given point in time than the first.
The high proportion of sole parent benefit recipients who became parents in their teens reflects the fact that members of this group, and their children (Barrett et al, 2003), have a high risk of long-term benefit receipt.3
Had the research considered all people granted benefit as a sole parent, or all people who received benefit as a sole parent over a window of time rather than at a point in time, the overall profile of the group would have appeared less disadvantaged.
Four high level groupings Using clustering techniques, sole parents who received main benefits at the end of 2005 could be grouped into four high level groupings (see Figure 1). These could be characterised as:
A Early Starters B Later Starters C Older Long-term Domestic Purposes Benefit (DPB)D Other Groups.
1 Derived by comparing the birthdate of the sole parent with the birthdates of all the children included with them in periods when they received benefit as a sole parent over the previous 10 years. In the case of older sole parents, this will not be as good as an indicator of early parenting because some first-born children may have already turned 18, or may have left the care of the parent, before the beginning of the 10-year window.
2 Of all sole parents who came on to Domestic Purposes Benefit–Sole Parent or the Emergency Maintenance Allowance in the year to June 1996, just over one-quarter received main benefits for less than three years out of the following 10. One in three received main benefits for eight or more years out of the following 10. (Source: unpublished calculations from the MSD’s benefit dynamics data set.)
3 Of teenage sole parents who came on to Domestic Purposes Benefit–Sole Parent or the Emergency Maintenance Allowance in the year to June 1996, only one in 10 received main benefits for less than three years out of the following 10 (compared with just over one-quarter of entrants of all ages). Just over half received main benefits for eight or more years out of the following 10 (compared with one-third of entrants of all ages). (Source: unpublished calculations from the MSD’s benefit dynamics data set.)
4

Figure 1: Four high level groups of sole parents on benefit, as at 31 December 2005
Because sole parents in the Early Starter group tended to have more children than average, this group accounted for 45% of the 204,000 children included in the benefits of sole parents at 31 December 2005 (see Figure 2).
Figure 2: Children of sole parents on benefit by high level groupings, as at 31 December 2005
Summary of high level groups and subgroupsWithin the four high level groups, 12 subgroups could be identified. The general characteristics of each high level group and the nature of its subgroups are summarised below.
Note that, while the shares of time spent on different benefit types are known with certainty, shares of time spent in different off-benefit states (eg percent of time employed and off benefit) have been estimated for this research by applying assumptions to the available data. The estimates may over- or under-state the true levels (see Appendix 1).
D Other Groups31,000 children of sole
parents on benefit (15%)
C Older Long-term DPB
36,000 children of sole parents on benefit (18%)
B Later Starters46,000 children of sole
parents on benefit (22%)
A Early Starters91,000 children of sole
parents on benefit (45%)
5
on benefit (25%)
D Other Groups19,000 sole parents on
benefit (17%) A Early Starters41,000 sole parents on
benefit (36%)
B Later Starters28,000 sole parents
C Older Long-term DPB
26,000 sole parents on benefit (22%)

A EARLY STARTER average age 29
41,000 sole parent clients (36%)
91,000 children of sole parent clients (45%)
Young when oldest child born (58% aged under 20). Young when first received main benefits. Almost all history spent on benefit on average. Most have a child aged under 5, most have more than one child.
Three subgroups:– A1 Younger, 1–2 children, youngest aged under 5.– A2 Older, 1–2 children, youngest aged 5 or over.– A3 Older, 3 or more children, youngest aged under 5.
B LATER STARTER average age 30
28,000 sole parent clients (25%)
46,000 children of sole parent clients (22%)
Not as young when oldest child born. Older when first received main benefits. Just over half of history spent off benefit, some time in employment. Most have a child aged under 5, most have only one child.
Three subgroups:– B1 Younger, 1 child, half with youngest aged under 2.– B2 Older, 1–3 children, youngest aged 2 or over.– B3 Ex-jobseeker, 1 child, youngest under 5.
C OLDER LONG-TERM DPB average age 42
26,000 sole parent clients (22%)
36,000 children of sole parent clients (18%)
Don’t appear to have parented as teens but this may be because the first born children of some were aged 18 or over.
Most of history spent receiving benefit, mostly DPB. One-third have earnings in addition to benefit. Most have a youngest child aged 5+, most have only one child.
Two subgroups:– C1 Non-earner, 1 child, youngest aged 10 or over.– C2 Earner, 1 child, youngest aged 10 or over.
D OTHER GROUPS average age 43
19,000 sole parent clients (17%)
31,000 children of sole parent clients (15%)
Some of history spent off benefit, little time spent on DPB. More likely than average to have been partnered in last 10 years. Most have a youngest child aged 5+, most have only one child.
Four subgroups:– D1 Invalid’s Benefit recipient, 1 child, youngest aged 5 or over.– D2 Ex-jobseeker, 1 child, youngest aged 10 or over.– D3 Ex-off benefit partner, 1–2 children, youngest aged 5 or over.– D4 Ex-on benefit partner, 1–3 children, youngest aged 5 or over.
Table 1, below, summarises the profiles of the high level groups and their subgroups.
6

Table 1: Profile of high level groups and subgroups
A E
arly
Sta
rter
A1
You
nger
, 1–2
chi
ldre
n
A2
Old
er, 1
–2 c
hild
ren
Old
er, 3
+ ch
ildre
n
B L
ater
Sta
rter
B1
You
nger
, 1 c
hild
B2
Old
er, 1
–3 c
hild
ren
B3
Ex-
jobs
eeke
r
C O
lder
Lon
g-te
rm D
PB
C1
Non
-ear
ner
C2
Ear
ner
D O
ther
Gro
ups
D1
IB re
cipi
ent
D2
Ex-
jobs
eeke
r
D3
Ex-
off b
enef
it pa
rtner
D4
Ex-
on b
enef
it pa
rtner
ALL
GR
OU
PS
% % % % % % % % % % % % % % % % %% Sole parent clients 36 15 9 12 25 11 9 5 22 16 6 17 3 8 4 2 100% Their children 45 12 9 23 22 9 10 4 18 13 5 15 2 6 4 3 100 Female 97 97 98 98 84 93 86 61 89 87 94 75 75 61 92 95 88 Aged 16–19 6 14 0 0 4 6 1 7 0 0 0 0 1 0 0 0 3Aged 20–24 22 44 6 6 22 34 6 25 0 0 0 2 4 1 3 1 14Aged 25–29 26 32 24 20 25 35 11 25 1 1 1 3 6 1 5 4 16Aged 30–34 23 9 37 30 20 18 23 19 11 12 7 11 11 6 16 17 17Aged 35–39 15 2 22 26 16 6 29 15 24 27 17 21 18 17 27 23 18Aged 40–44 years 7 0 8 14 9 1 21 6 30 30 29 24 21 24 25 23 15Aged 45 years or older 2 0 3 5 4 0 9 3 34 29 46 40 40 51 23 32 16 With 1 child 33 57 34 1 60 70 37 76 63 63 63 57 69 66 45 35 50With 2 children 32 41 54 4 26 26 33 14 33 34 31 30 22 26 40 34 30With 3 children 22 2 9 57 10 4 20 5 4 3 5 10 7 7 12 20 13With 4+ children 13 0 3 39 5 0 11 5 0 0 1 3 2 1 2 11 7 With youngest under 2 27 36 10 28 39 48 24 42 1 1 1 5 8 2 8 6 20With youngest 2–4 35 44 21 34 35 38 33 31 3 3 1 11 13 5 19 12 23With youngest 5–9 32 20 51 31 22 13 34 23 26 28 20 28 25 23 35 36 27With youngest 10–13 6 0 17 6 4 0 8 4 38 36 41 29 26 33 22 27 17With youngest 14+ 0 0 1 0 1 0 2 0 33 32 37 28 28 36 16 19 12 Had child before aged 18 26 29 23 24 7 7 4 9 7 8 3 4 6 4 2 8 13Had child before aged 20 58 64 54 53 22 27 14 25 19 22 11 12 14 10 9 20 33Had child before aged 25 91 95 91 87 63 74 45 69 52 56 41 37 43 33 34 51 66 Average % of time off benefit as partner 2 1 1 4 8 8 12 1 4 4 4 7 1 3 20 3 5Average % of time as partner on benefit 3 2 1 5 3 4 2 1 1 2 1 8 1 3 1 46 3 Of those aged <28, % on benefit by 18th birthday 69 65 79 81 40 36 19 63 61 77 39 51 81 63 14 81 57
Average % of time spent on benefit 90 87 94 89 46 45 31 77 85 85 85 60 90 60 26 84 73
Average % of time spent on DPB 77 67 90 79 23 25 23 17 78 76 82 15 11 11 21 28 53
Average % of time spent on Unemployment Benefit 7 12 2 4 16 10 4 53 3 4 1 14 2 26 1 3 9
Average % of time spent on Invalid’s Benefit 0 0 0 0 0 0 0 0 1 1 1 11 68 2 0 2 2
Average % of time spent on Sickness Benefit 3 5 1 1 4 5 2 5 1 1 0 6 8 10 1 1 3
Currently on DPB – Sole Parent 98 98 98 97 89 95 89 78 92 90 96 52 5 42 89 76 87 Average % of time employed off benefit 3 4 2 2 16 21 15 9 4 4 5 11 2 13 16 2 8Currently earning 15 10 28 11 14 20 10 6 32 19 67 27 9 12 69 25 20
7

Ethnic composition4
Ethnicity was not one of the measures included in the cluster analysis used to form groups. Despite this, the groups were quite different in ethnic composition.
Compared to their share of the overall population of sole parents receiving main benefits, Māori were over-represented in the Early Starter group (Table 2).5 Almost half of Māori sole parent benefit recipients (47%) were in the Early Starter group (Table 3).
This over-representation will partly reflect ethnic differences in age structure and fertility. Māori have a more youthful age structure, and Māori women are more likely than women in other ethnic groups to have children as teenagers6 or in their early 20s. On average, Māori women also have higher fertility rates than New Zealand Europeans and other ethnic groups (and slightly lower rates than Pacific peoples).7
Table 2: Ethnic profile of high level groups
EthnicityA Early
Starter (%)B Later
Starter (%)C Older Long-term DPB (%)
D Other Groups (%)
All sole parent benefit recipients (%)
New Zealand European 31 40 48 42 39Māori 53 35 35 32 41Pacific peoples 10 12 7 8 10Other 4 11 10 14 9Missing 1 2 0 3 1Total 100 100 100 100 100
Table 3: Proportion of sole parent benefit recipients in each ethnic group in each high level group
EthnicityA Early
Starter (%)B Later
Starter (%)C Older Long-term DPB (%)
D Other Groups (%)
All sole-parent benefit recipients (%)
New Zealand European 29 25 28 18 100Māori 47 21 19 13 100Pacific peoples 39 31 15 15 100Other 17 30 26 27 100Missing 16 40 7 37 100Total 36 25 22 17 100
4 Ethnicity in this section is based on the SWIFTT ethnic code recorded for the individual. Where the person has multiple ethnic groups recorded in other MSD databases (the jobseeker register SOLO or UCVII), the SWIFTT ethnic code is prioritised so if a client identifies as Māori and any other ethnic group, they will be recorded as Māori.
5 Appendix 2 shows the ethnic profile and other characteristics of the 12 subgroups.6 In 2000–2002, teenage birth rates for Māori were over three times higher than those for
European teenagers, and Pacific teenagers were more than twice as likely as Europeans to give birth in their teens. (Source: Statistics New Zealand, 2006, Population Monitor.) Births to women under 20 years represent 4% of births to non-Māori women and 17% of births to Māori women. (Source: percentages and non-Māori figures derived by the MSD from Statistics New Zealand, Births – Tables, Age-specific Fertility Rates for the Total and Māori Populations, www.stats.govt.nz/tables/births-tables.htm.)
7 Total fertility rates by ethnic group in 2000–2002 were: Māori 2.59, Pacific 2.94, Asian 1.67, European 1.77 (total rate for all women 1.96). (Source: Statistics New Zealand, Age-specific Fertility Rates for the Major Ethnic Groups, www.stats.govt.nz/tables/births-tables.htm.)
8

Benefit history Overall, just over half of sole parent benefit recipients had spent at least 80% of their history (the previous 10 years, or a shorter history period in the case of people aged under 28) on benefit, and 8% had spent less than 20% of their time supported by main benefits.8
The share of time spent on benefit was greatest for Early Starters and the Older Long-term DPB group – 80% of Early Starters and 68% of the Older Long-term DPB group had spent 80% or more of their time on benefit, compared with 14% of Later Starters and 39% of people in the Other Group (Figure 3).
Figure 3: Proportion of history period spent on benefit
Debt to the MSD and Special Needs Grant use Levels of debt to the MSD and the use of Special Needs Grants suggest that many sole parent benefit recipients, and Early Starters in particular, struggle to cope financially.
Debts to the MSD can arise as a result of:
benefit advances and the use of recoverable Special Needs Grants overpayments that occur due to changed client circumstances that reduce
entitlement overpayments as a result of fraudulent activity.
Sixty percent of sole parent benefit recipients had debts to the MSD. For one in five overall, the level of debt was in excess of $1,000. Early Starters were more likely than other groups to have debts, with nearly a quarter of this group having debt levels in excess of $1,000.
Half of sole parent benefit recipients had received non-recoverable Special Needs Grants for food in 2005. Early Starters were more likely than other groups to use
8 We counted both time spent on benefit as a primary benefit recipient and time spent on benefit as a partner.
9
90%
Percentage of group members
0%
10%
20%
30%
40%
50%
60%
70%
80%
A Early Starter B Later Starter C Older Long-term DPB
D Other Groups All sole parent benefit recipients
under 20% 20–79% 80% or more

these payments. Nearly one-quarter received three or more Special Needs Grants for food in 2005.
Table 4: Debt to the MSD and Special Needs Grants
Debt to MSD at 31 December 2005A Early
Starter (%)B Later
Starter (%)
C Older Long-term DPB (%)
D Other Groups (%)
All sole parent benefit
recipients (%)
$1–$499 27 24 25 23 25$500–$1,000 17 14 12 12 14$1,000–$5,000 18 14 14 14 16$5,000+ 5 3 5 5 5Total % with debt to MSD 67 55 57 54 60Number of Special Needs Grants for food in last year1–2 35 32 30 29 323–4 17 11 11 10 135+ 6 3 3 3 4Total % with Special Needs Grants for food in year 58 46 45 42 49
Special Benefit Special Benefit is a discretionary non-taxable benefit intended to provide assistance to clients whose particular circumstances are causing them hardship.
Special Benefit was replaced by Temporary Additional Support on 1 April 2006, but continues to be payable to clients who were receiving it, or had applied for it, immediately before that date so long as they remain qualified.
At 31 December 2005, 23% of sole parents receiving main benefits were also in receipt of Special Benefit (Table 5). Later Starters had the highest proportion in receipt.
Table 5: Special Benefit as at 31 December 2005
Special BenefitA Early
Starter (%)B Later
Starter (%)
C Older Long-term DPB (%)
D Other Groups (%)
All sole-parent benefit
recipients (%)
Receiving Special Benefit 23 26 21 19 23Not receiving Special Benefit 77 74 79 81 77Total 100 100 100 100 100
Section 70A deductions Sole parents applying for benefit have to name the other parent of the child, apply for a formula assessment of child support, and participate in related court proceedings if required.
If they fail or refuse to meet these obligations they incur a financial penalty under section 70A of the Social Security Act 1964. This penalty reduces their benefit by $22 per week for each child for whom the person refuses or fails to meet these requirements. A further penalty of $6 per week per beneficiary applies after 13 weeks.
10

Exemptions from penalties are available under section 70A.9
At 31 December 2005, 12% of sole parents receiving main benefits had a section 70A penalty (Table 6). Early Starters were the most likely to incur deductions (20%). This may partly explain the higher rates of Special Needs Grant usage by this group.
Table 6: Section 70A deductions, as at 31 December 2005
Section 70AA Early
Starter (%)B Later
Starter (%)
C Older Long-term DPB (%)
D Other Groups (%)
All sole parent benefit recipients (%)
Met all obligations for all children 77 86 92 95 86
Section 70A deduction in respect of at least one child 20 11 7 4 12
Did not meet obligations for all children but exempted from any deductions 3 3 1 1 2
Total 100 100 100 100 100
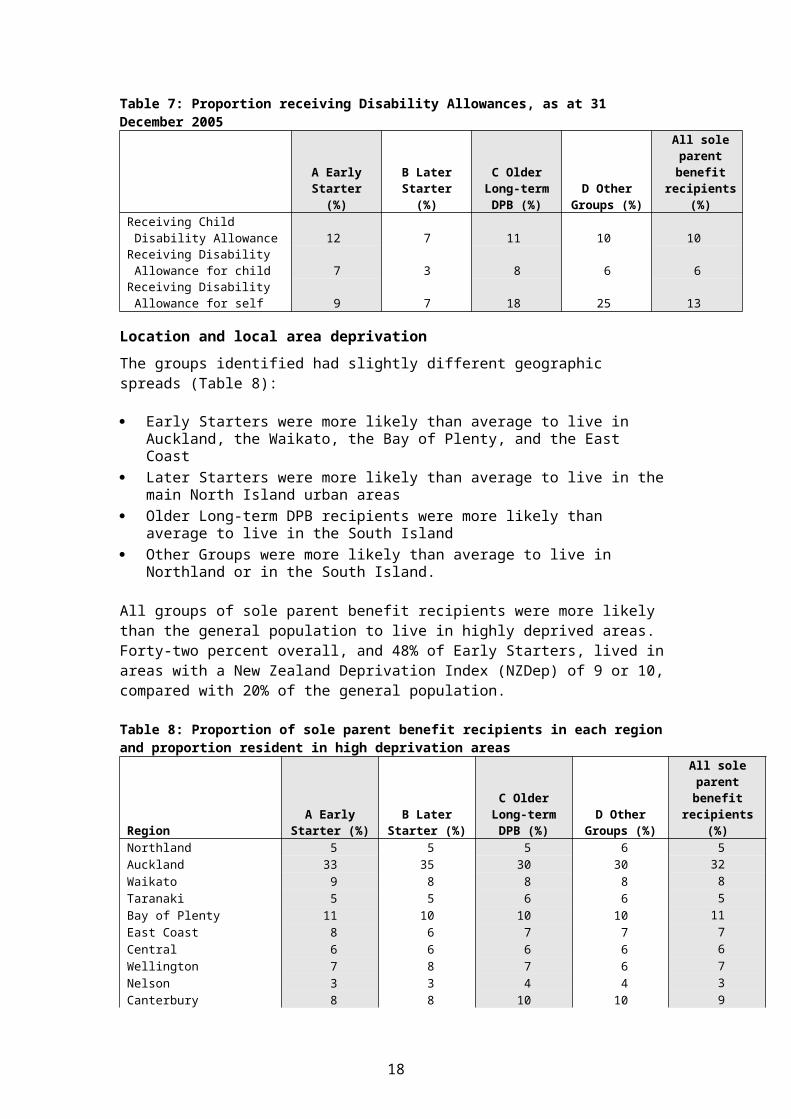
Indicators of the health of sole parents on main benefits and of their children Child Disability Allowance is a non-taxable allowance that is available to the principal caregiver of a dependent child who has a serious disability. It is paid because of the extra care that may be needed by a child who has a physical, sensory, psychiatric or intellectual disability.
Using the receipt of Child Disability Allowance as an indicator of the presence of health problems suggests that one in 10 sole parents receiving benefit had a child with a serious disability (Table 7).
Rates of receipt of this payment were highest among members of the older Early Starter subgroup with three or more children (A3), with almost one in five receiving this payment for at least one of their children (see Appendix 2). This will partly reflect the larger average family size of this group.
Disability Allowance is another payment that provides assistance to people who have ongoing, additional costs because of a disability, either their own or that of their child or children.
The Early Starter and Older Long-term DPB groupings were more likely than average to receive Disability Allowance for their children.
Nearly one in five members of the Older Long-term DPB group and a quarter of the members of Other Groups received Disability Allowance for their own health-related costs. This suggests that these groups had a higher likelihood of disability or ill health compared to others. This will partly reflect the positive association between age and poor health.
9 On five grounds: where there is insufficient evidence to establish in law who the liable parent is, where the beneficiary is taking active steps to meet their obligations, where there is a risk of violence, where the child was conceived as a result of incest or sexual violation, or where other compelling circumstances exist and there is no real likelihood of child support being collected.
11

Table 7: Proportion receiving Disability Allowances, as at 31 December 2005
A Early Starter (%)
B Later Starter (%)
C Older Long-term DPB (%)
D Other Groups (%)
All sole parent benefit
recipients (%)Receiving Child Disability
Allowance 12 7 11 10 10Receiving Disability
Allowance for child 7 3 8 6 6Receiving Disability
Allowance for self 9 7 18 25 13
Location and local area deprivation The groups identified had slightly different geographic spreads (Table 8):
Early Starters were more likely than average to live in Auckland, the Waikato, the Bay of Plenty, and the East Coast
Later Starters were more likely than average to live in the main North Island urban areas
Older Long-term DPB recipients were more likely than average to live in the South Island
Other Groups were more likely than average to live in Northland or in the South Island.
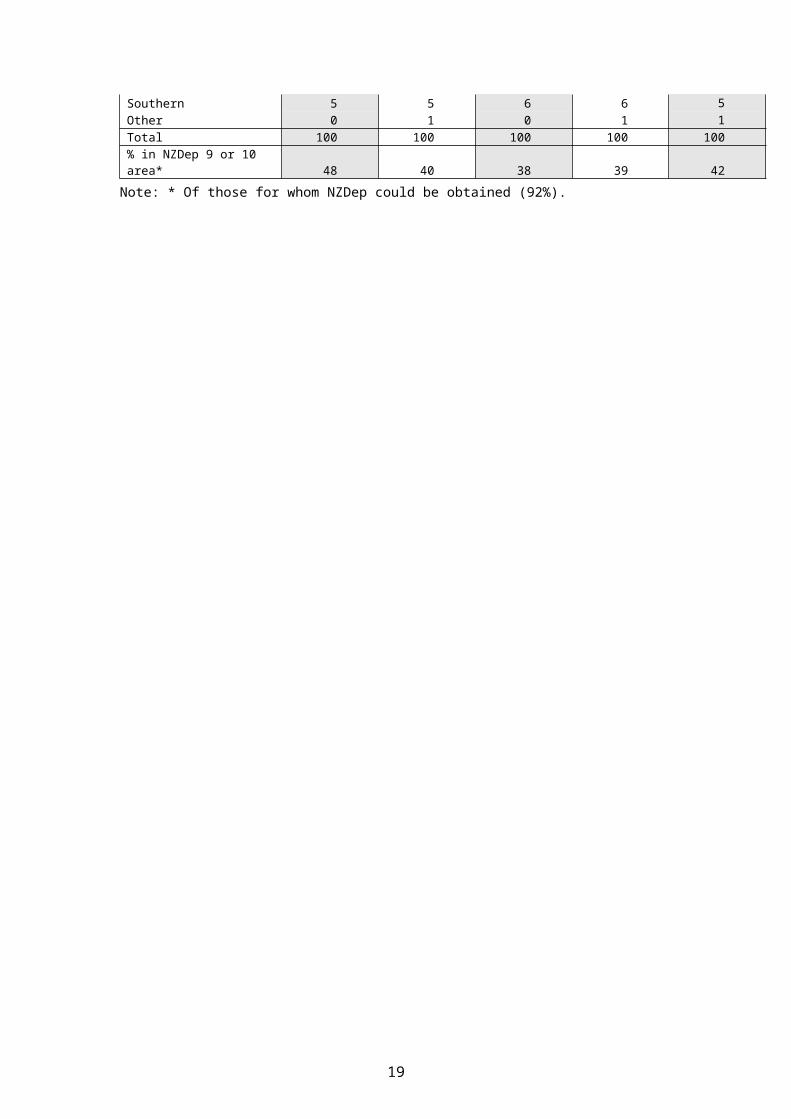
All groups of sole parent benefit recipients were more likely than the general population to live in highly deprived areas. Forty-two percent overall, and 48% of Early Starters, lived in areas with a New Zealand Deprivation Index (NZDep) of 9 or 10, compared with 20% of the general population.
Table 8: Proportion of sole parent benefit recipients in each region and proportion resident in high deprivation areas
RegionA Early
Starter (%)B Later
Starter (%)C Older Long-term DPB (%)
D Other Groups (%)
All sole parent benefit
recipients (%)Northland 5 5 5 6 5Auckland 33 35 30 30 32Waikato 9 8 8 8 8Taranaki 5 5 6 6 5Bay of Plenty 11 10 10 10 11East Coast 8 6 7 7 7Central 6 6 6 6 6Wellington 7 8 7 6 7Nelson 3 3 4 4 3Canterbury 8 8 10 10 9Southern 5 5 6 6 5Other 0 1 0 1 1Total 100 100 100 100 100% in NZDep 9 or 10 area* 48 40 38 39 42
Note: * Of those for whom NZDep could be obtained (92%).
12

Table 9: Of sole parent benefit recipients in each region, proportion in each group
RegionA Early
Starter (%)B Later
Starter (%)C Older Long-term DPB (%)
D Other Groups (%)
All sole parent benefit
recipients (%)Northland 37 22 22 20 100Auckland 36 27 21 16 100Waikato 38 24 21 17 100Taranaki 35 23 24 17 100Bay of Plenty 38 23 22 17 100East Coast 41 22 22 16 100Central 37 23 24 16 100Wellington 37 26 22 15 100Nelson 28 25 27 21 100Canterbury 32 24 26 19 100Southern 30 25 26 19 100Other 18 27 13 42 100Total 36 25 22 17 100
Indicators of educational attainment Compared to all other groups, Early Starters were the most likely to appear to have no formal educational qualifications (Table 10).
However, a higher proportion of members of this group (17%) than any other had used the Training Incentive Allowance in the last year. This might suggest that some were seeking to improve their qualifications.
Table 10: Recorded educational attainment* and proportion who received Training Incentive Allowance in year to 31 December 2005
Educational qualifications
A Early Starter (%)
B Later Starter (%)
C Older Long-term DPB (%)
D Other Groups (%)
All sole parent benefit
recipients (%)None 55 39 50 46 48School qualifications 42 50 43 38 44Post-school qualification 3 9 7 8 6Unknown 0 2 1 8 2Total 100 100 100 100 100Received Training Incentive Allowance in 2005** 17 14 15 12 15
Notes: * Educational attainment is based on the most recent account of the person’s educational attainment recorded in the jobseeker register SOLO. In cases where a person registered as a jobseeker some years ago and has gained additional qualifications since then, the recorded qualifications will understate their attainment.** Of those receiving Training Incentive Allowance-eligible benefits at 31 December 2005 (Domestic Purposes, Widow’s and Invalid’s Benefits).
13

Employment historiesIndicators of employment history were included in the cluster analysis used to form groups.
On average, Later Starters appeared to have spent the greatest proportion of their history period off benefit and in employment. Thirty percent appeared to have been in paid work for more than half their time off benefit (Table 11).
While a third of Early Starters and Older Long-term DPB recipients were known to have spent some time in employment while off benefit, the proportion of their time estimated to have been spent in this state was small.
Table 11: Indicators of employment history
Employment historyA Early
Starter (%)
B Later Starter
(%)
C Older Long-term DPB (%)
D Other Groups (%)
All sole parent benefit
recipients (%)
Known to have been employed while off benefit 32 61 35 42 42
Employed off benefit for more than 50% of history period (inferred) 1 30 5 19 12
Of time on benefit, average % of time spent employed 10 10 26 24 16
Employed while in receipt of benefit at 31 December 2005 15 14 32 27 20
Sole parents receiving Domestic Purposes and Widow’s Benefits are encouraged to participate in paid employment while in receipt of benefit.
On average, members of the Older Long-term DPB and Other groupings had spent around a quarter of their time on benefit, combining benefit receipt with employment (Table 11).10 The Older Long-term DPB group was the most likely to be employed while receiving benefit at the end of 2005.11
Figure 4 shows that, within the Older Long-term DPB, the majority of subgroup C2 (Earners) were employed. A similar proportion of the Other Groups subgroup D3 (most of whom had formerly been partnered and off benefit) were in employment.
Within the Early Starter group, more than one-quarter of those in A2 (the small older subgroup with 1–2 children) were employed. In most cases the youngest child of sole parents in this subgroup was aged five or over (see Table 1). Only one in ten of those in the remaining subgroups (A1 and A3) were employed. Members of these groups tended to have pre-school children.
10 Sole parents who receive Domestic Purposes, Widow’s or Invalid’s Benefits can make annual declarations of their earned income. We are unsure how this income is distributed over the year, but assume that it was earned in all weeks of the relevant year.
11 Because some sole parents make annual declarations of their earned income, the proportions with earned income at any point in time should be viewed as indicative of either current participation in employment or participation in employment over the year.
14

Figure 4: Proportion employed while in receipt of benefit, 31 December
2005
Exits from benefit and employment and partnering outcomes We followed each of the sole parents in the study over the six months from 31 December 2005 and examined exits from benefit in that period.
These off-benefit outcomes were not included in the clustering analysis used to form groups.
Table 12 shows the proportion who had at least one exit from benefit for any reason in that period, and the proportions known to have had an employment or a partnering-related exit.12
Older Long-term DPB recipients and members of Other Groups were the most likely to exit benefit for employment. Early Starters and Later Starters were the most likely to exit as a result of a partnership.
Overall, Later Starters and members of Other Groups had the highest likelihood of exiting benefit in the follow-up.
Table 12: Proportion who exited benefit in six months from 31 December 2005
Proportion of benefit exitsA Early
Starter (%)B Later
Starter (%)
C Older Long-term DPB (%)
D Other Groups
(%)
All sole parent benefit
recipients (%)
Exited benefit for any reason 11 17 14 16 14Exited benefit to partner 3 4 1 2 3Exited benefit to employment 5 8 9 9 7
12 Some may have exited for these reasons but not had this recorded.
15
Percentage of group employed
0% 10% 20% 30% 40% 50% 60% 70% 80%
ALL GROUPS
D4 Ex-on benefit partner
D3 Ex-off benefit partner
D2 Ex-jobseeker
C2 Earner
C1 Non-earner
B3 Ex-jobseeker
B2 Older, 1–3 children
B1 Younger, 1 child
A3 Older, 3+ children
A2 Older, 1–2 children
A1 Younger, 1-2 children A Early Starter
B Later Starter
C Older Long-term DPB
D Other Groups
D1 Invalid’s Benefit recipient

Figure 5 shows that, of the Other Groups, subgroup D3 (former off-benefit partners) were the most likely to exit benefit. One-quarter left in the six-month follow-up.
The Later Starter subgroups B1 (young with one child) and B2 (older with 1–3 children) and the Older Long-term DPB Earner subgroup (C2) also had comparatively high exit rates.
Figure 5: Proportion who exited benefit in six months from 31 December
2005
Figure 6 shows the proportions known to have left benefit for employment or a partnership.
30%0% 5% 10% 15% 20% 25%
ALL GROUPS
D4 Ex-on benefit partner
D3 Ex-off benefit partner
D2 Ex-jobseeker
D1 Invalid’s Benefit recipient
C2 Earner
C1 Non-earner
B3 Ex-jobseeker
B2 Older, 1–3 children
B1 Younger, 1 child
A3 Older, 3+ children
A2 Older, 1–2 children
A1 Younger, 1–2 children A Early Starter
B Later Starter
C Older Long-term DPB
D Other Groups
Percentage of group exiting benefit
16

Figure 6: Proportion who exited benefit in six months from 31 December 2005, by reason
The subgroups that had the highest likelihood of being employed while in receipt of benefit in Figure 4 (C2 and D3) were also the most likely to exit to employment in the six-month follow-up. This was the period in which the Working for Families in-work tax credit was introduced.
Other analysis suggests that, consistent with the design of the in-work tax credit, the increase in exit rates that accompanied its introduction was strongest among those already in paid work.13
Subgroups B1 (younger Later Starters with one child) and B2 (older Later Starters with 1–3 children) and D3 (former off-benefit partners) were the most likely to exit benefit for a partnership.
13 It is notable that the ex-jobseeker subgroup D2 had a reasonably high exit rate (more than 15% left in the follow-up), but comparatively few were known to have left for employment or partnerships. It may be that this group was more likely to lapse off benefit without any reason being recorded. The extent to which these exits involved movement into employment is unknown.
Percentage of group exiting benefit
0% 5% 10% 15% 20% 25% 30%
ALL GROUPS
D4 Ex-on benefit partner
D3 Ex-off benefit partner
D2 Ex-job seeker
C2 Earner
C1 Non-earner
B3 Ex-job seeker
B2 Older, 1–3 children
B1 Younger, 1 child
A3 Older, 3+ children
A2 Older, 1–2 children
A1 Younger, 1–2 children
percent exiting to employment
percent exiting to partner
A Early Starter
B Later Starter
C Older Long-term DPB
D Other Groups
17
D1 Invalid’s Benefit recipient
Discussion
Other challenges in moving towards employmentThe data presented here begins to build a picture of the circumstances of different subgroups within the population of sole parents receiving benefits. It highlights the variation in circumstances, both between and within groups, in terms of a range of measures that are likely to indicate proximity to employment.
Other studies can help fill gaps in areas that the administrative data does not cover.
New Zealand studies show that sole mothers in general have poorer physical and mental health than partnered mothers (Sarfati and Scott, 2001). They also face much greater levels of criminal victimisation, including sexual offences and domestic violence, than other population groups (Mayhew and Reilly, 2007).
Domestic violence can directly affect sole mothers’ ability to gain and maintain employment (Bancroft, 2004). It is also associated with poor mental health. In the Christchurch Health and Development Study, exposure to domestic violence was significantly related to an increased risk of depression, after controlling for other factors (Fergusson et al, 2005).
American and Australian research suggests high rates of disadvantage among sole parent benefit recipients (Jayakody et al, 2000; Jayakody and Stauffer, 2000; Gorske et al, 2006; Butterworth, 2003).
In an Australian study of sole mothers receiving social assistance benefits:
75% had not completed secondary education 47% had mental health difficulties, mainly anxiety (30%), depression (20%) and
substantial psychological distress (29%) 12% had a substance abuse disorder 18% had a moderate to severe physical disability and 40% had common physical
conditions 47% had experienced physical or sexual violence over their lifetime most had difficulties in more than one of these domains (Butterworth, 2003).
Māori sole parent benefit recipients appear likely to have an elevated risk of disadvantage. Māori in general are more likely than other groups to have poor mental health, largely associated with their more youthful age structure and more disadvantaged socio-economic position.14 They are also more likely than average to experience confrontational offences involving a partner (Mayhew and Reilly, 2007).
Teenage parenthood and disadvantageTeenage parents and their children are not a homogenous group. Circumstances preceding and following teenage birth vary widely. But New Zealand and overseas studies indicate that young women who already experience disadvantage have a higher than average risk of becoming teenage parents.
14 Although differences remain between Māori and Pacific peoples in mood disorders and substance use disorders and between Māori and other ethnic groups in substance use disorders after controlling for age, sex and socio-demographic correlates (Oakley Browne et al, 2006).
18
Early conduct problems (Woodward and Fergusson, 1999; Boden et al, 2008), poor mental health (Barnet et al, 1996; Boden et al, 2008), and disengagement from schooling (Fergusson and Woodward, 2000) are associated with an elevated risk of becoming a teenage parent.
Behaviour that has brought young people to the attention of the police doubles the risk of becoming a teenage parent, compared to those who have had no police contact (Hobcraft, 1998).
Family violence in the form of receiving physical abuse from a parent or being exposed to parental physical violence significantly increases the likelihood of risky sexual activity (Elliott et al, 2002), and coercive sexual activity also places teenagers at greater risk of pregnancy (Elders and Albert, 1998).
Clear associations exist between risky sexual behaviour and diagnosis of substance abuse, with a New Zealand study finding teenagers who abuse alcohol are 23 times more likely to engage in early, risky sexual activity that may result in pregnancy (Fergusson and Lynskey, 1996).
There are significant correlations between high teenage birth rates and low socio-economic status (Wilson et al, 1996). Fifty-six percent of all teenage births in 2005 occurred in areas classified by the New Zealand Deprivation Index as 8, 9 or 10 (areas of highest deprivation), with NZDep10 areas alone accounting for 23% of all teenage births.
The evidence on whether teen parenting itself is associated with further disadvantage for mothers, over and above that associated with their pre-existing disadvantage, is more mixed.15
Whether due to pre-existing disadvantage, or a combination of pre-existing disadvantage and the effects of teen parenthood itself, those who became parents in their teenage years are likely to be particularly disadvantaged, on average.
This disadvantage helps to explain the high proportion of sole parent benefit recipients in this research who appeared to have parented early. It also suggests that some sole parent benefit recipients who parented early will have difficulties across a number of domains, which may include a long history of poor mental health, substance abuse, and experiences of violence and abuse.
Tailoring approaches and interventionsThe variations in the backgrounds and in the employment outcomes we observed for the different groups suggest that different approaches and interventions are needed for working with different people.
It appears likely that many sole parents in some subgroups – principally those who were already in employment while on benefit – responded strongly to the improved incentives provided by Working for Families. Continued efforts to ensure that people are aware of and taking-up their Working for Families entitlements might largely meet the needs of many in these groups.
For people in other groups the rate of exit from benefit and into employment was comparatively low, and participation in employment while in receipt of benefit was
15 See Hoffman (2006); Chevalier and Viitanen (2001); Ermisch and Pevalin (2003); Ermisch and Pevalin (2005); Hotz et al (2005); Hotz et al (1997); Hobcraft and Kiernan (1999); Boden et al (2008).
19

also low. Many appeared to be some way from being work-ready, with a history of long-term benefit receipt, limited work experience, low qualifications, and location in communities of disadvantage.
In the case of the largest Early Starter subgroups, most had young children. More than one in 10 overall, and almost one in five in the older subgroup with three or more children (A3), appeared to have a child with significant health difficulties. Most became parents in their teenage years, an experience that is known to occur at a much higher than average rate for disadvantaged young women. Assisting this group may require an intersectoral response.
In the case of the Older Long-term DPB group, the children are older, but as many as one in five sole parents in this group appeared to have health difficulties themselves (indicated by Disability Allowance receipt), and more than one in 10 had children with significant health problems.
While the Later Starter and Other Groups are less likely to have a background of long-term benefit receipt overall, and have some subgroups that have high rates of movement off benefit, there are small subgroups that do not have these characteristics:
The ex-jobseeker group of Later Starters (B3) has a comparatively low rate of exit from benefit. Four in 10 are male, and 12% are known to have been imprisoned.16 Half are in their 20s, most have one child, usually a pre-schooler.
The Invalid’s Benefit recipient subgroup (D1) has a high likelihood of long-term benefit receipt (see Table 1), a very low rate of exit from benefit and a low likelihood of supplementing benefit income through employment. This group has a high likelihood of having debts to the MSD, and a high likelihood of receiving multiple Special Needs Grants for food.
This research suggests that, for many, the path to part- or full-time employment may be a long one, requiring a number of different services and interventions and a series of intermediate steps.
For some, employment will not be a realistic outcome in the short term, and the priority may be interventions that improve the quality of life on benefit for both parents and children.
16 Based on recorded reasons for entry to and exit from benefit. This measure was included in the cluster analysis used to form groupings.
20

Bibliography
Bancroft, W (2004) Sustaining: Making the Transition from Welfare to Work, Working Paper 04-03, Social Research and Demonstration Corporation.
Barnet, B, A Joffe, A K Duggan, M D Wilson and J T Repke (1996) Depressive symptoms, stress, and social support in pregnant and postpartum adolescents, Archives of Pediatrics and Adolescent Medicine, 150(1):64–70.
Barrett, G, F Krsinich and M Wilson (2003) Young children supported by benefits in New Zealand: A duration analysis, New Zealand Population Review, 29(1):131–153.
Boden, J M, D M Fergusson and L J Horwood (2008) Early motherhood and subsequent life outcomes, Journal of Child Psychology and Psychiatry, 49(2):151–160.
Butterworth, P (2003) Multiple and severe disadvantage among lone mothers receiving income support, Family Matters, 64: 22–29.
Chevalier, A and T K Viitanen (2001) The Long-run Labour Market Consequences of Teenage Motherhood in Britain, London: Centre for Economic Performance, London School of Economics and Political Science.
Elders, J and A E Albert (1998) Adolescent pregnancy and sexual abuse, Journal of the American Medical Association, 280(7):648–649.
Elliott, G C, R Avery, E Fishman and B Hoshiko (2002) The encounter with family violence and risky sexual activity among young adolescent females, Victims and Violence, 17(5):569–592.
Ermisch, J and D J Pevalin (2005) Early motherhood and later partnerships, Journal of Population Economics, 18:469–489.
Ermisch, J and D J Pevalin (2003) “Does a ‘teen-birth’ have longer-term impacts on the mother? Evidence from the 1970 British Cohort Study” ISER Working Paper No. 2003-28, Institute for Social and Economic Research.
Fergusson, D M, L Horwood and E Ridder (2005) Partner violence and mental health outcomes in a New Zealand birth cohort, Journal of Marriage and the Family, 67:1103–1119.
Fergusson, D M and M T Lynskey (1996) Alcohol misuse and adolescent sexual behaviours and risk taking, Pediatrics, 98(1):91–96.
Fergusson, D M and L J Woodward (2000) Teenage pregnancy and female educational underachievement: A prospective study of a New Zealand birth cohort, Journal of Marriage and the Family, 62(1):147–161.
Gorske, T T, C Larkby, D C Daley, E Yenerall and L A Morrow (2006) Childhood abuse and psychiatric impairment in a sample of welfare to work women, Children and Youth Services Review, 28:1528–1541.
21

Hobcraft, J (1998) Intergenerational and life course transmission of social exclusion: Influences of childhood poverty, family disruption and contact with the police, CASE paper 15, Centre for Analysis of Social Exclusion, London School of Economics.
Hobcraft, J and K Kiernan (1999) Childhood poverty, early motherhood and adult social exclusion, CASE paper 28, Centre for Analysis of Social Exclusion, London School of Economics.
Hoffman, S D (2006) By the Numbers: The Public Costs of Teen Childbearing, Washington DC: The National Campaign to Prevent Teen Pregnancy.
Hotz, V J, S McElroy and S Sanders (2005) Teenage childbearing and its life cycle consequences: Exploiting a natural experiment, Journal of Human Resources, 40(3):683–715.
Hotz, V J, C H Mullin and S G Sanders (1997) Bounding causal effects using data from a contaminated natural experiment: Analyzing the effects of teenage childbearing, Review of Economic Studies, 64:575–603.
Jayakody, R, S Danziger and H A Pollack (2000) Welfare reform, substance use and mental health, Journal of Health Politics, Policy and Law, 25(4):623−651.
Jayakody, R and D Stauffer (2000) Mental health problems among single mothers: Implications for work and welfare reform, Journal of Social Issues, 56(4):617−634.
McLeod, K and P Beynon (2006) A profile of health and disability related benefit recipients in New Zealand, Social Policy Journal of New Zealand, 29:102–126.
Mayhew, P and J Reilly (2007) New Zealand Crime and Safety Survey 2006: Key Findings, Wellington: Ministry of Justice.
Oakley Browne, M A, J E Wells and K M Scott (eds) (2006) Te Rau Hinengaro The New Zealand Mental Health Survey, Wellington: Ministry of Health.
Sarfati, D and K Scott (2001) The health of lone mothers in New Zealand, New Zealand Medical Journal, 114(1133):257–260.
SAS Institute Inc (1999) SAS/STAT® User's Guide, Version 8, Cary, North Carolina: Author.
Ward, J H (1963) Hierarchical grouping to optimize an objective function, Journal of the American Statistical Association, 58:236–244.
Wilson, N, M Clements, M Bathgate and S Parkinson (1996) Using Spatial Analysis to Improve and Protect the Public Health in New Zealand, Wellington: Ministry of Health.
Woodward, L J and D M Fergusson (1999) Early conduct problems and later risk of teenage pregnancy in girls, Development and Psychopathology, 11:127–141.
22

Appendix 1 Research approach
The research involved:
describing the history and current characteristics of each individual forming groups by grouping together people with similar histories and
characteristics.
These steps are described in more detail below.
Step 1 – Describing individuals’ histories and current characteristics
We selected all sole parents in receipt of a main benefit at 31 December 200517 – around 114,000 people.
For each of these 114,000 people, we constructed a range of measures of their histories and their current characteristics, to the extent that these could be observed or inferred from the benefit administration data available to us.18
Information on their histories was assembled looking back over a given ’history period‘. For most people in the study, the history period was the 10-year period from the beginning of 1996 to the end of 2005.
For people aged under 28 at the end of 2005, the history period was shorter:
for those aged 20–27, we looked back to the date of their 18th birthday for those aged under 20, we looked back to their 18th birthday, or the date they
first received benefit, if they received benefit as a 16 or 17 year old.
The key measures that were constructed include the following:
Benefits – percentage of time spent receiving benefits of different types and in total, indicators of benefits received, benefit type as at 31 December 2005.
Employment – indicators of whether they had ever exited benefit to employment based on recorded reason codes, whether they had ever entered benefit from employment based on recorded reason codes and record of last weekly earnings prior to benefit, inferred percentage of time spent in employment; whether they were in employment while in receipt of benefit at 31 December 2005, inferred from declared earnings;19 and the percentage of time on benefit they spent in employment, inferred from declared earnings.
Parenting – indicators of the age at which the person first became a parent, based on a comparison of the birthdate of the sole parent with the birthdate of the oldest child included with them in periods when they received benefit as a
17 We excluded the small group who were only granted their current benefit on that day. 18 The research was based on the MSD’s benefit dynamics data set, a longitudinal research data
set assembled from benefit administration records. Counts taken from this data set may vary slightly from official counts of benefit receipt drawn directly from SWIFTT, the MSD’s benefit processing and payments system.
19 Sole parents who receive Domestic Purposes, Widow’s or Invalid’s Benefits can make annual declarations of their earned income. In assembling the benefit dynamics data set, we assume that earnings declared as an annual amount are received evenly over the year. This is unlikely to always be the case, however. The resulting proportions with earned income at any point in time should therefore be viewed as indicative of either current participation in employment, or participation in employment over the year.
23

sole parent over the previous 10 years,20 the number and ages of children included in the person’s benefit at 31 December 2005.
Partnerships – indicators of whether they had ever exited benefit to partner to a person not in receipt of benefit based on recorded reason codes, whether they had ever entered benefit having separated from a partner not in receipt of benefit, whether they had ever entered benefit as a result of their partner’s death, inferred percentage of time spent partnered while off benefit, percentage of time spent partnered while on benefits of different types.
Education and training – indicators of highest qualifications recorded in the jobseeker register SOLO,21 whether they had ever exited benefit to education or training based on recorded reason codes, whether they had ever entered benefit from education or training based on recorded reason codes, inferred percentage of time spent in education or training based on the time spent off benefit and recorded reason codes, whether they received Training Incentive Allowance for education or training in the year to 31 December 2005.
Time spent overseas – indicators of whether they had ever exited benefit to go overseas based on recorded reason codes, whether they had ever entered benefit having returned from overseas based on recorded reason codes, inferred percentage of time in their history period spent overseas based on the time spent off benefit and recorded reason codes.
Health – indicators of whether they had, in the last six years, ever been granted Sickness or Invalid’s Benefits for a mental health related incapacity, a physical health related incapacity, or drug or alcohol addiction.22
Imprisonment – indicators of whether they had ever exited benefit to go into prison or entered benefit having left prison based on recorded reason codes.23
The MSD’s administrative databases store reliable information about the periods of time in which a person received main benefits in their history period. They have more limited and approximate information on peoples’ status before and after each benefit spell. This means that assumptions needed to be made in order to infer the amount of time spent in different off-benefit states.
For a period off benefit that occurred between two benefit spells:
if the reason for leaving the first spell and the reason for starting the second spell agreed (eg the person left the first benefit spell for employment and started the second benefit spell from employment), we assumed that the entire off-benefit period was spent in the state indicated (in this case employment)
if the reason for leaving the first spell and the reason for starting the second spell did not agree (eg the person left the first benefit spell for employment and started
20 For some older sole parent benefit recipients this may overstate the age at which they first became a parent because their oldest child may have turned 18 or left their care before the beginning of the 10-year window. It may understate the age at which people first became a parent in other cases as it assumes that the people cared for their oldest observed dependent child in a parent–child relationship from the date of that child’s birth. This may not have occurred in all cases.
21 This measure is likely to understate the educational attainment of the group. It is based on the most recent record of their educational attainment recorded in the jobseeker register SOLO. For those who registered as a jobseeker some years ago but have gained qualifications since, this record of current educational attainment will be understated. In comparison, 2001 Census data shows that 37% of people who received Domestic Purposes Benefit at some time in the year prior to the Census had no qualifications and 34% had school qualifications only. (Source: MSD’s analysis of customised tables supplied by Statistics New Zealand.)
22 Note that more people may have experienced health difficulties than these indicators suggest.23 Note that more people may have experienced imprisonment than these indicators suggest.
24

the second benefit spell having separated from a partner), we assumed that half the off-benefit period was spent in each of the states indicated (in this case employment and partnership).24
For a period off benefit that occurred before the first benefit spell in the history period, we assumed that half the time was spent in the state implied by the recorded reason for starting the first benefit spell and half was counted as time in which their status was “other/unknown”.
Using this approach, on average most of the time spent off benefit in the history period falls into a category of “other/unknown” states (ie not able to be assumed to be time spent employed, partnered, in education or training, or overseas). It is possible that in most cases this time was spent employed and/or partnered, but in this analysis we make no assumption about which might dominate.
Step 2 – Forming groups
In Step 1, we effectively created a mathematical picture of an individual’s history on and off benefit and current characteristics.
To form groups, we ran these individual pictures through a mathematical clustering algorithm.25 This grouped people together such that they were most similar in their histories and current characteristics to other individuals in the same group, while being as different as possible to individuals in other groups.
The research involved iteratively examining the results of the analysis, making decisions about the inclusion, exclusion, or weighting of the indicators in the analysis, and making decisions about the appropriate number of groups to create.
Apart from statistical measures relating to distance within and between groups, the most important test of the analysis was a ’face validity‘ check, ie that the groups were sensibly constructed, informative, and linked to the purposes of the research. As any clustering analysis is inherently a subjective exercise, this was essential for the research to produce useful and informative results.
Table A1 lists the variables that were included in the final clustering algorithm, and indicates the three variables were re-weighted to make their weight in the analysis more similar to that of the percentage of time variables (which had a range of 0–100).
The re-weighted variables and the percentage of time variables carried the most weight in the analysis, but the 0 or 1 variables also informed the groupings reported on in this paper.
24 This highlights one of the limitations of the data, and the resulting analysis of the way in which people spent their time. Only a single reason code can be entered at the grant of benefit or at the end of a benefit spell. Where, for example, a person was granted benefit having separated and left their job simultaneously, only one of these events could be recorded as the reason for grant, and depending on which was recorded, we would assume that they had spent their time prior to the benefit spell in one state or the other, but not both.
25 We used the CLUSTER procedure in SAS using the Ward’s minimum variance method (SAS Institute Inc, 1999; Ward, 1963). This is a hierarchical agglomerative method, which attempts to minimise the variance within clusters, and has a tendency to create reasonably even-sized clusters (McLeod and Beynon, 2006). For our purposes, this helps to ensure that groups identified and presented are large enough to be of significant policy interest.
25

By looking at the characteristics of the individuals within each group, we were able to assign labels to the groups in a way that summarised the defining characteristics of each.
26

Table A1: Variables included in the clustering algorithmVariable description TypeDemographicsAge of client at 31 December 2005 **(re-weighted by multiplying by 3)** YearsClient is male? 0 or 1BenefitsEntered current spell transferring from Sickness Benefit as primary? 0 or 1Entered current spell transferring from Unemployment, Training or a related Benefit? 0 or 1% history period on DPB–Sole Parent or Emergency Maintenance Allowance %% history period on Widow’s Benefit %% history period on Sickness Benefit as primary %% history period on Invalid’s Benefit as primary %% history period on Unemployment, Training or a related Benefit as primary %Current benefit DPB–Sole Parent or Emergency Maintenance Allowance? 0 or 1Current benefit Widow’s Benefit? 0 or 1Current benefit Unemployment, Training or a related Benefit? 0 or 1Current benefit Sickness Benefit? 0 or 1Current benefit Invalid’s Benefit? 0 or 1EmploymentEntered current spell from employment? 0 or 1Currently declaring earned income in addition to benefit? 0 or 1Of time on benefit in history period, % time with declared earnings %% time in employment while off benefit in history period (inferred) %% time off benefit in history period where status “other/not known” (possibly employed or partnered) %ParentingAt least one child cared for as sole parent in last 10 years born when person a teenager? 0 or 1At least two children cared for as a sole parent in last 10 years born when person a teenager? 0 or 1Current number of children cared for at 31 December 2005 **(re-weighted by multiplying by 20)** numberAge of youngest child cared for at 31 December 2005 **(re-weighted by multiplying by 5)** yearsPartnershipsEntered current spell transferring from benefit as partner 0 or 1Entered current spell from off benefit because “separated from partner”? 0 or 1Ever event code at entry of “partnered died” in history period? 0 or 1% history period on benefit as partner of Sickness Benefit or Invalid’s Benefit primary recipient %% history period on benefit as partner of Unemployment, Training or a related Benefit primary recipient %% history period on Sickness Benefit or Invalid’s Benefit with a partner included %% history period on Unemployment, Training or a related Benefit with a partner included %% time partnered while on benefit in history period %% time partnered while off benefit in history period (inferred) %Education and trainingEntered current spell because “school/tertiary/college/exams finished”? 0 or 1Any post-school qualifications recoded in SOLO? (set to 0 if missing) 0 or 1SOLO record indicates “no formal school qualifications”? (set to 0 if missing) 0 or 1% time in study/training while off benefit in history period (inferred) %Health and imprisonmentEver granted Sickness Benefit or Invalid’s Benefit with mental health related incapacity in last 6 years? 0 or 1Ever granted Sickness Benefit or Invalid’s Benefit with physical health related incapacity in last 6 years? 0 or 1Ever granted Sickness Benefit or Invalid’s Benefit related to pregnancy in last 6 years? 0 or 1Ever granted Sickness Benefit or Invalid’s Benefit with drug and alcohol related incapacity in last 6 years? 0 or 1Ever event code at entry “left prison” or reason code at exit indicating imprisoned 0 or 1
27

Appendix 2 Profile of high level groups and subgroups, at 31 December 2005
A E
arly
Sta
rter
A1
You
nger
, 1–2
chi
ldre
n
A2
Old
er, 1
–2 c
hild
ren
A3
Old
er, 3
+ ch
ildre
n
B L
ater
Sta
rter
B1
You
nger
, 1 c
hild
B2
Old
er, 1
–3 c
hild
ren
B3
Ex-
jobs
eeke
r
C O
lder
Lon
g-te
rm D
PB
C1
Non
-ear
ner
C2
Ear
ner
D O
ther
Gro
ups
D1
Inva
lid’s
Ben
efit
reci
pien
t
D2
Ex-
jobs
eeke
r
D3
Ex-
off b
enef
it pa
rtner
D4
Ex-
on b
enef
it pa
rtner
ALL
GR
OU
PS
(%) (%) (%) (%) (%) (%) (%) (%) (%) (%) (%) (%) (%) (%) (%) (%) (%)EthnicityNew Zealand European 31 32 39 25 40 45 41 23 48 44 61 42 49 30 60 41 39Māori 53 53 50 55 35 35 21 60 35 38 24 32 37 40 14 32 41Pacific 10 10 7 14 12 10 16 10 7 8 4 8 5 12 4 9 10Other 4 4 4 5 11 8 17 6 10 10 11 14 7 16 15 17 9Unknown 1 1 0 0 2 2 4 0 0 0 0 3 1 2 8 0 1Total 100 100 100 100 100 100 100 100 100 100 100 100 100 100 100 100 100Debt to MSD $1–$499 27 27 26 27 24 24 23 24 25 25 25 23 28 21 23 25 25$500–$1,000 17 18 16 18 14 15 12 16 12 13 11 12 15 12 10 14 14$1,000–$5,000 18 17 17 21 14 13 11 22 14 14 15 14 18 14 9 17 16$5,000+ 5 3 6 8 3 2 3 6 5 6 5 5 4 6 2 7 5Total % with debt to MSD 67 64 64 73 55 54 49 67 57 58 55 54 65 53 43 62 60No. of food Special Needs Grants in last year 1–2 35 34 34 35 32 32 31 35 30 32 26 29 33 28 25 35 323–4 17 15 16 21 11 11 10 14 11 13 7 10 16 10 6 13 135+ 6 5 4 9 3 2 2 5 3 4 1 3 6 2 1 4 4Total % with food Special Needs Grants 58 54 54 65 46 45 43 53 45 48 35 42 55 41 33 52 49
Continued over
28

A E
arly
Sta
rter
A1
You
nger
, 1–2
chi
ldre
n
A2
Old
er, 1
–2 c
hild
ren
A3
Old
er, 3
+ ch
ildre
n
B L
ater
Sta
rter
B1
You
nger
, 1 c
hild
B2
Old
er, 1
–3 c
hild
ren
B3
Ex-
jobs
eeke
r
C O
lder
Lon
g-te
rm D
PB
C1
Non
-ear
ner
C2
Ear
ner
D O
ther
Gro
ups
D1
Inva
lid’s
Ben
efit
reci
pien
t
D2
Ex-
jobs
eeke
r
D3
Ex-
off b
enef
it pa
rtner
D4
Ex-
on b
enef
it pa
rtner
ALL
GR
OU
PS
(%) (%) (%) (%) (%) (%) (%) (%) (%) (%) (%) (%) (%) (%) (%) (%) (%)Special Benefit Receiving Special Benefit 23 26 22 20 26 26 30 20 21 25 11 19 29 20 13 20 23
Not receiving Special Benefit 77 74 78 80 74 74 70 80 79 75 89 81 71 80 87 80 77
Total 100 100 100 100 100 100 100 100 100 100 100 100 100 100 100 100 100
Section 70A
Met all obligations for all children 77 76 81 76 86 84 89 87 92 91 93 95 94 95 93 96 86Section 70A deduction in respect of at least one
child 20 21 17 21 11 13 9 11 7 7 6 4 5 4 6 4 12Did not meet obligations for all children but
exempt from any deductions 3 3 2 3 3 3 2 2 1 1 1 1 2 1 1 1 2
Total 100 100 100 100 100 100 100 100 100 100 100 100 100 100 100 100 100
Disability Allowances % with Child Disability Allowance for child 12 8 12 18 7 6 9 5 11 11 9 10 16 7 9 14 10% with Disability Allowance for self 9 6 11 10 7 6 10 5 18 19 15 25 72 19 11 18 13% with Disability Allowance for child 7 4 8 10 3 3 5 2 8 8 7 6 15 4 5 8 6
Continued over
29

A E
arly
Sta
rter
A1
You
nger
, 1–2
chi
ldre
n
A2
Old
er, 1
–2 c
hild
ren
A3
Old
er, 3
+ ch
ildre
n
B L
ater
Sta
rter
B1
You
nger
, 1 c
hild
B2
Old
er, 1
–3 c
hild
ren
B3
Ex-
jobs
eeke
r
C O
lder
Lon
g-te
rm D
PB
C1
Non
-ear
ner
C2
Ear
ner
D O
ther
Gro
ups
D1
Inva
lid’s
Ben
efit
reci
pien
t
D2
Ex-
jobs
eeke
r
D3
Ex-
off b
enef
it pa
rtner
D4
Ex-
on b
enef
it pa
rtner
ALL
GR
OU
PS
(%) (%) (%) (%) (%) (%) (%) (%) (%) (%) (%) (%) (%) (%) (%) (%) (%)Region Northland 5 5 5 6 5 4 4 7 5 6 4 6 6 7 4 9 5Auckland 33 32 29 36 35 31 44 30 30 32 23 30 24 35 25 27 32Waikato 9 9 8 9 8 8 7 9 8 7 8 8 9 7 9 8 8Taranaki 5 5 6 5 5 5 4 7 6 5 7 6 7 5 6 5 5Bay of Plenty 11 11 12 11 10 10 8 13 10 11 10 10 9 12 8 12 11East Coast 8 8 9 8 6 7 5 9 7 7 8 7 6 8 6 6 7Central 6 6 6 6 6 6 5 5 6 6 7 6 7 5 7 6 6Wellington 7 8 8 7 8 7 8 9 7 8 6 6 6 7 6 6 7Nelson 3 3 3 2 3 4 3 2 4 4 5 4 6 3 5 5 3Canterbury 8 8 8 6 8 10 8 5 10 9 12 10 13 7 13 9 9Southern 5 5 6 3 5 7 4 4 6 5 9 6 8 4 9 7 5Other 0 0 0 0 1 1 1 1 0 0 0 1 1 2 1 0 1Total 100 100 100 100 100 100 100 100 100 100 100 100 100 100 100 100 100% in NZDep 9–10* Area 48 47 44 54 40 37 35 54 38 41 31 39 40 46 22 44 42Educational qualifications None 55 51 55 60 39 33 35 61 50 53 40 46 46 54 26 53 48School 42 45 42 37 50 56 51 34 43 40 51 38 26 31 57 40 44Post-school 3 3 3 2 9 9 10 4 7 6 9 8 3 8 14 5 6Unknown 0 1 0 0 2 2 4 1 1 1 0 8 25 7 3 3 2All 100 100 100 100 100 100 100 100 100 100 100 100 100 100 100 100 100% with Training Incentive Allowance in last year** 17 19 18 15 14 15 15 8 15 16 14 12 7 11 15 11 14
Notes: * Of those for whom NZDep could be obtained (92%) Continued over** Of those receiving Training Incentive Allowance eligible benefits
30

A E
arly
Sta
rter
A1
You
nger
, 1–2
chi
ldre
n
A2
Old
er, 1
–2 c
hild
ren
A3
Old
er, 3
+ ch
ildre
n
B L
ater
Sta
rter
B1
You
nger
, 1 c
hild
B2
Old
er, 1
–3 c
hild
ren
B3
Ex-
jobs
eeke
r
C O
lder
Lon
g-te
rm D
PB
C1
Non
-ear
ner
C2
Ear
ner
D O
ther
Gro
ups
D1
Inva
lid’s
Ben
efit
reci
pien
t
D2
Ex-
jobs
eeke
r
D3
Ex-
off b
enef
it pa
rtner
D4
Ex-
on b
enef
it pa
rtner
ALL
GR
OU
PS
(%) (%) (%) (%) (%) (%) (%) (%) (%) (%) (%) (%) (%) (%) (%) (%) (%)Employment history % known to have been employed while off
benefit in history period 32 39 30 26 61 69 49 66 35 35 34 42 21 52 45 24 42% employed off benefit for more than 50%
of history period 1 1 0 1 30 39 30 9 5 4 5 19 3 22 33 1 12% employed while in receipt of benefit at
31 December 05 15 10 28 11 14 20 10 6 32 19 67 27 9 12 69 25 20Of time on benefit, average % of time spent
employed 10 5 21 7 10 16 6 6 26 12 63 24 6 8 69 16 16Proportion exiting benefit in six month follow-up
% exited benefit for any reason 11 11 13 10 17 19 18 11 14 12 19 16 4 16 27 14 14% exited benefit to partner 3 3 2 3 4 5 4 2 1 1 1 2 1 1 4 3 3% exited benefit to employment 5 4 8 5 8 9 9 4 9 7 14 9 1 7 17 6 7
31