Global International Waters Assessment (GIWA) Dag Daler Scientific Director.
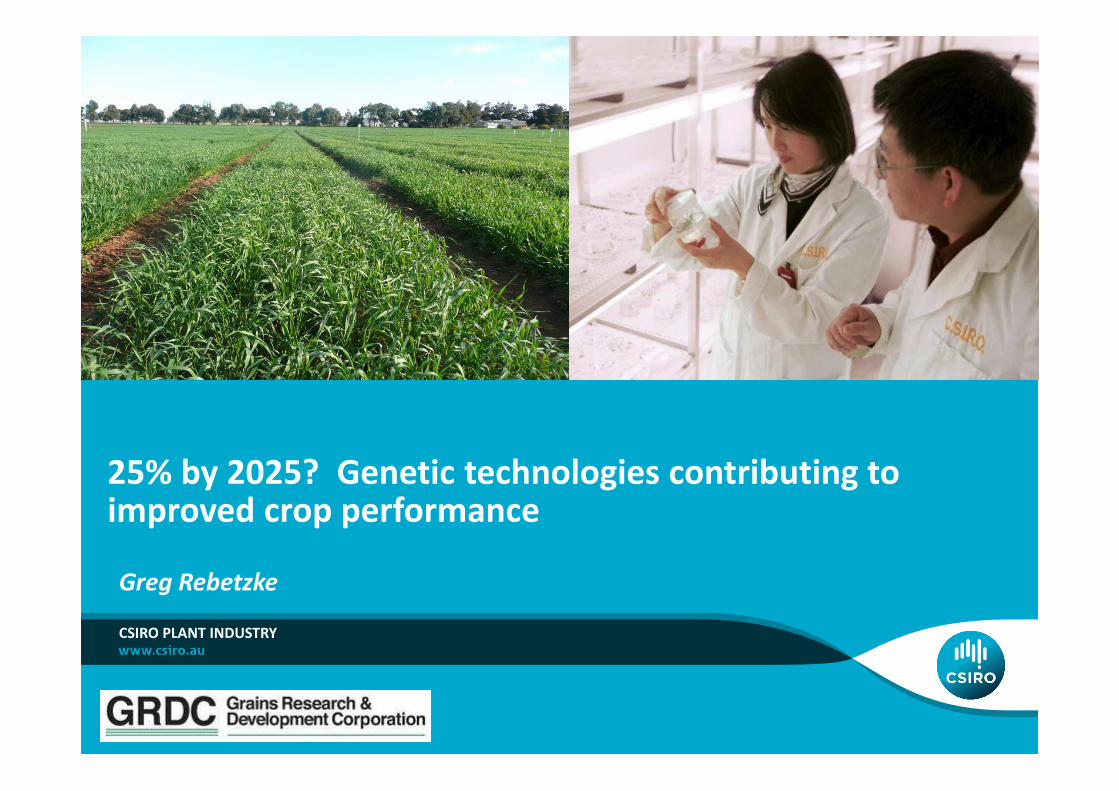
25% by 2025? Genetic technologies contributing to improved crop performance
CSIRO PLANT INDUSTRY
Greg Rebetzke

What are the pieces andhow efficiently assembled?

Productivity gains due to genetics of around 0.5% per annum for wheat
Selection for yield, quality and disease (potentially ‘000s of genes)
Two complementary approaches –
trait-based breeding (disease, adaptation and WUE) and
quantitative (‘numbers game’ - many lines and environments, and good knowledge of pedigrees)
Public to private –
Six breeding companies all of whom are linked to large multinational companies (as shareholders)
Genetic technology transfer from maize to wheat readily facilitated
Genetics ‘State of the nation?’ Wheat as an example
(Tony Fischer)

Drivers of yield progress? Improving adaptation
WA wheat cultivars
Thermal time (oC d) to floral initiation
400 500 600 700 800 900 1000
Gra
in y
ield
(kg
ha-1
)
800
1000
1200
1400
1600
1800 1978
1982 1960
19451946
1894
1979
1929
1915
1860
Adapted from Richards (1991)

Targeting drivers of performance under water-
limited conditions
100 200 300 400 500
0
1
2
3
4
Water use (mm)
Gra
in y
ield
(t/h
a)5
Potential22 kg grain/ha/mm
Beyondphysiological
limits
French and Schultz (1984)Sadras and Angus (2006)
District average

Agronomic innovations…..
Canola in the rotation
Wheat after Wheat Wheat after Canola
*** Reduce soil-borne diseases(take-all, crown rot, CCN, root-
lesion nematodes)
(Kirkegaard et al.)

Salt-tolerance genes
(James et al.)

Agronomy
Subsoil toxicities e.g. acid tolerance genes – malat e exudation
(Ryan et al.)

There is so much genetic diversity. What do we sele ct?
?

Maximising water use
Rainfall = Transpiration + Evaporation + Run-off + Drainage + [storage]
Aim: Capture, store and use as much of the rainfall as possible
Run-offEvaporation
Transpiration Rainfall
Drainage
Infiltration
Uptake

Maximising water use using agronomy
Fertilitytreatment
Yield(t/ha)
Water use(mm)
Evaporation(mm)
Transpiration(mm)
High63N, 20P
5.6 366 173 193
Low8N, 10P
2.8 363 259 104
(from David Hall, DAFWA)
Esperance 2001, 380 mm in-crop rainfall

Yield response in wheat to selection for greater early
vigour (BC2-derived sibs)
LAI @ 50 DAS
Final Biomass
(g.m -2)
Grain Yields
(g.m -2)
Harvest Index
Wongan Hills 1999 (453mm)
High Vigour 0.37 678 337 0.49
Low Vigour 0.32 573 293 0.49
* ** *** ns
Merredin 1999 (274 mm)
High Vigour 0.39 634 266 0.41
Low Vigour 0.30 574 247 0.43
** ** ** ns
(Botwright et al. 2002)

Must have the genetic variation! Importance of maintaining genetic resources
High vigour germplasm with greater leaf area
cv. Annuello Cycle 1 vigour selection
Cycle 4 vigour selection

0 0.05 0.1 0.15 0.2 0.25
37-6
38-19
50-4
28-14
70-22
119-4(2)
92-11(2)
Beecher
V18
Yitpi
CM18
Wyalkatchem
Annuello
Westonia
Janz
Root mass in tubes (g)
Early generation
Later generation
= Australian cvs= barley
= CSIRO recurrent selections
Cycle 1 Cycle 4
Other potential benefits….greater root growth
EGA Burke
Carazinho
Vigour 18
C4_[Vig 37-6]
C4_[Vig 119-4]
C4_[Vig 92-11]
C4_[Vig 38-19]
Gro
wth
res
pons
e in
P-li
miit
ng c
ondi
tons
(%
EG
A B
urke
)
0
20
40
60
80
100
120
140
160
180
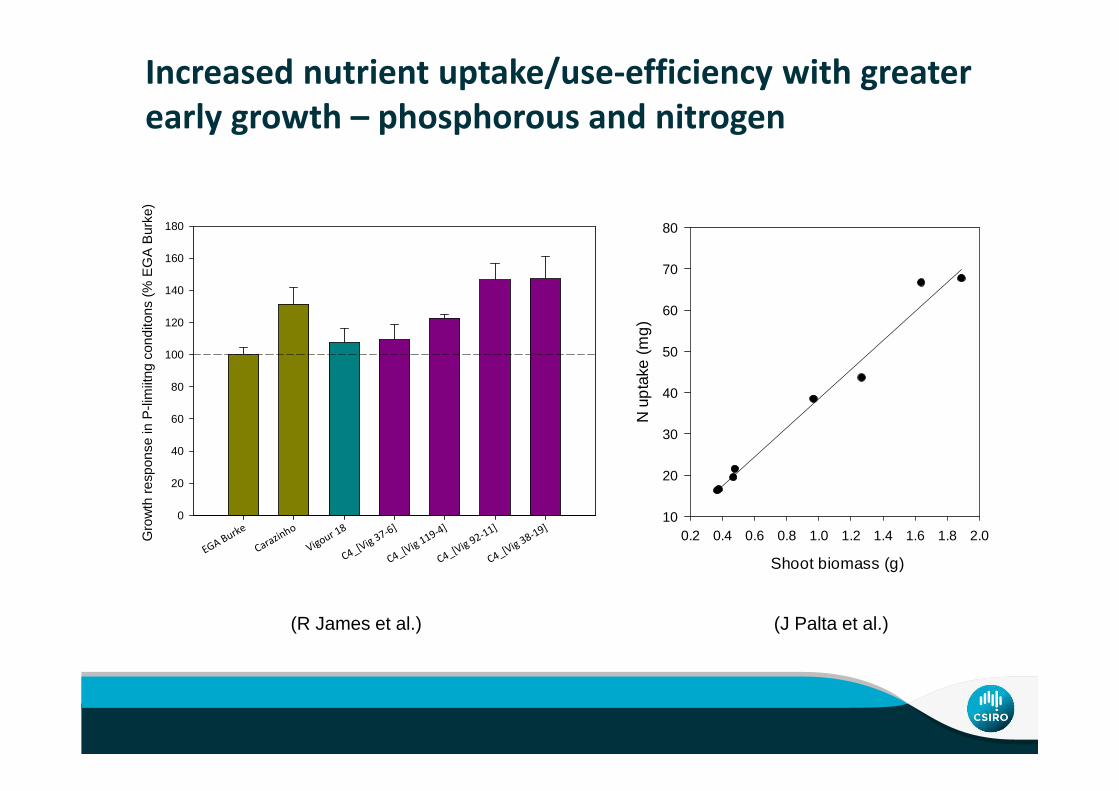
Increased nutrient uptake/use-efficiency with greater
early growth – phosphorous and nitrogen
(R James et al.)
Shoot biomass (g)
0.2 0.4 0.6 0.8 1.0 1.2 1.4 1.6 1.8 2.0
N u
pta
ke (
mg
)
10
20
30
40
50
60
70
80
(J Palta et al.)

Wyalkatchem + vigourAxeAnnuello
+ vigour
Improved performance after dry sowing? Rapid root growth? (Bob French, MEF)

New semi-dwarf , high vigour lines in the field
YitpiYitpi + vigour
Mean grain yield(relative to comm. parents):
Without weeds-+ Up to 20%
With weeds-+ Up to 50%
(G. Gill Uni Adel.P. Newman DAFWA)

Need for quality phenotyping - controlled ‘managed’
environments (Managed Environment Facilities – ‘MEF’)
In Australia - three sites with two-three irrigation regimes

Climate characteristics of six locations in the Australian wheatbelt: mean monthly rainfall and temperature (data for 1889-2010)
ACT
NSW
NT
QLD
SA
TAS
VIC
WA
0 500 km
Rai
n (m
m)
0
50
100
Jan
Mar
May Ju
lS
ep
Nov
Dalby
10
20
30
Tem
p. (°C)
Rai
n (m
m)
0
50
100
Jan
Mar
May Ju
lS
ep
Nov
Geraldton
10
20
30
Tem
p. (°C)
Rai
n (m
m)
0
50
100
Jan
Mar
May Ju
lS
ep
Nov
Horsham
10
20
30
Tem
p. (°C)
Rai
n (m
m)
0
50
100
Jan
Mar
May Ju
lS
ep
Nov
Merredin
10
20
30
Tem
p. (°C)
Rai
n (m
m)
0
50
100
Jan
Mar
May Ju
lS
ep
Nov
Narrabri
10
20
30
Tem
p. (°C)
Rai
n (m
m)
0
50
100
Jan
Mar
May Ju
lS
ep
Nov
Yanco
10
20
30
Tem
p. (°C)
The Managed Environment Facility sites of Merredin,
Narrabri and Yanco are indicated(Karine Chenu QAFFI)

Phenomobile proximal sensing rig
Three LiDAR sensors

Head number (L) and fractional ground cover (R) with LiDAR

Above the clouds measuring canopy temperature

Airborne thermal mosaic – ready for analysisLegend [deg C]
~600 m
• Capture 3 images / second
• One pass of the field ~10 sec (3 passes required)
• Time to image entire field ~4 min
• Ideal: Simultaneous measurements at nearly a single point in time
Mean canopy temperature (ºC)
15.6 15.8 16.0 16.2 16.4 16.6 16.8 17.0 17.2
CID
(‰
)
19.5
20.0
20.5
21.0
21.5
22.0
22.5
Batavia
Halberd
CranbrookGlenlea
Westonia
Sunco
QG225
BaxterJanz
Quarrion
Chara
Tasman
Diamondbird
Kukri
CD87
EgretSunstate
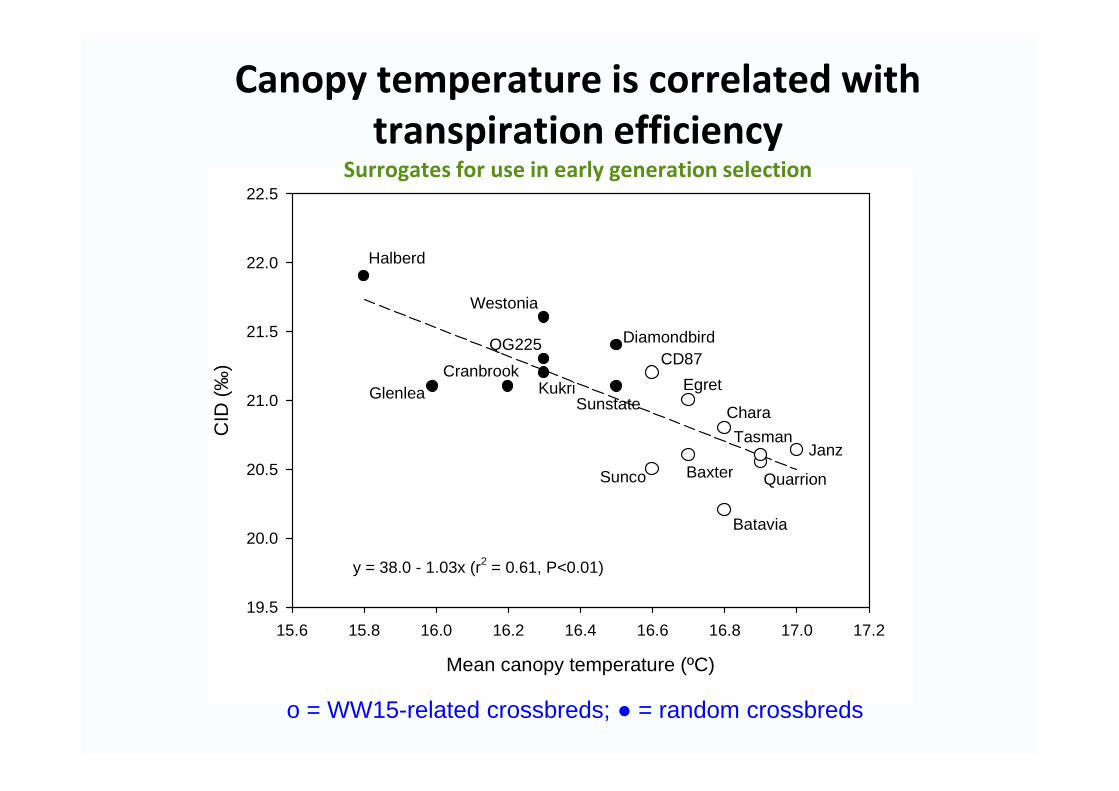
y = 38.0 - 1.03x (r2 = 0.61, P<0.01)
Canopy temperature is correlated with
transpiration efficiency Surrogates for use in early generation selection
o = WW15-related crossbreds; ● = random crossbreds

The massive and complex wheat genome
WheatWheat
Human
Arabidopsis
Rice
Cotton
Barley
Huge
Polyploid
Repetitive

Which is the next Mace or Wyalkatchem? Looking for a needle in a haystack!

Genotyping Tools – Molecular markers
• Removes the potential for misclassification through phenotyping
• Used to enrich populations in early stages of a breeding cycle (with particular focus on difficult-or expensive-to-measure traits)
• Cost is reducing significantly by the day!
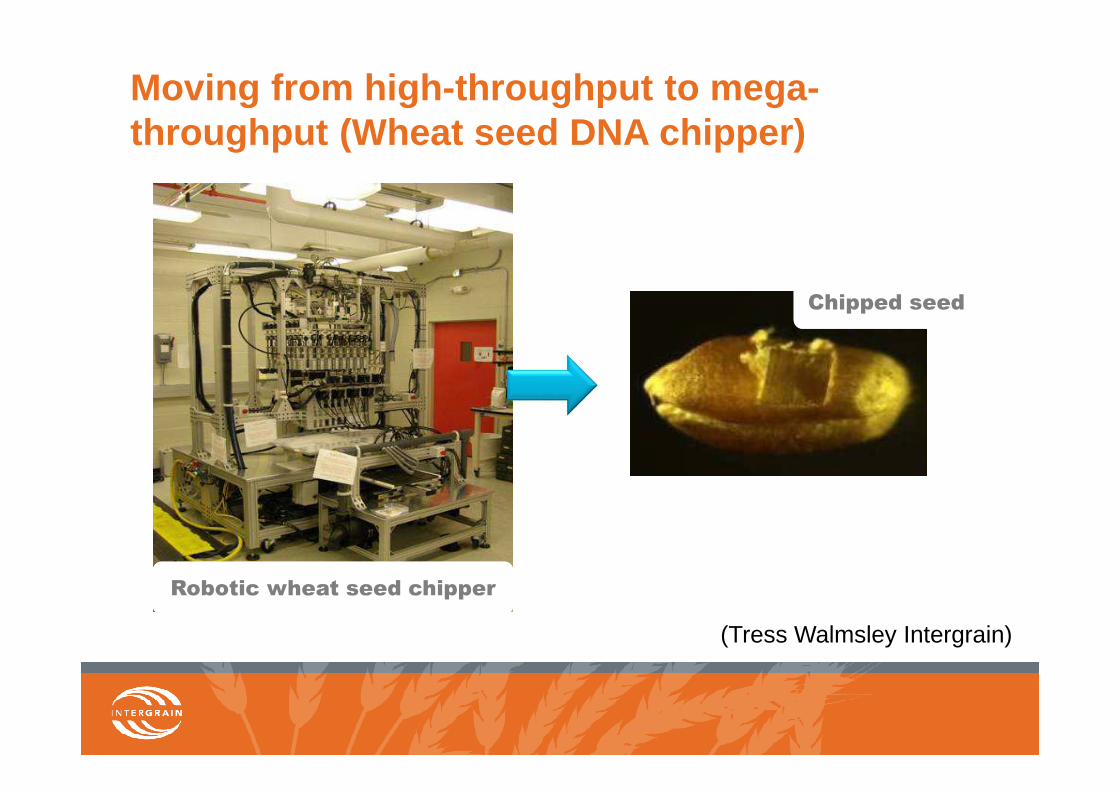
Moving from high -throughput to mega-throughput (Wheat seed DNA chipper)
Robotic wheat seed chipperRobotic wheat seed chipper
Chipped seedChipped seed
(Tress Walmsley Intergrain)

������ �8�������� ��������� ��� ��� ������� � �� ����� ������� ��0���� ��2�������� ��

Enhancing collaboration | ELP Team 3 | Page ‹#›
(Cavanagh et al.)

1 2 3 4 5 6 7
Genetic dissection of coleoptile length†
Integration of multi-population, multi-environment mapping
A B D
Group
(C/H = Cranbrook/Halberd, MAGIC = Baxter/Chara/Westonia/Yitpi)
Cranbrook/Halberd MAGIC (4-way)
† QTL common at two or soil temperatures

1 2 3 4 5 6 7
Genetic dissection of coleoptile length†
Integration of multi-population, multi-environment mapping
A B D
Group
(C/H = Cranbrook/Halberd, MAGIC = Baxter/Chara/Westonia/Yitpi)
Cranbrook/Halberd MAGIC (4-way)
† QTL common at two or soil temperatures
Yitpi +13mm Baxter +5mm
Baxter +6mmWestonia +6mm
Chara +7mmYitpi +6mm
Westonia +7mm

Ludhiana, India at 15cm sowing depth

Management and genotypes for early sowing
Long coleoptileAlternative dwarfing gene germplasm
Moisture-seeking tine
Identifying the synergies in coupling targeted bree ding with management?
(Courtesy James Hunt)

Management synergies and new genetics
Intervention Mean Yield (t/ha)
Additive effect Singular effect
No-till 1.84 1.84
Fallow weed control 2.80 2.37
Pea break crop 3.45 1.76
Sow early (from 25 April) 4.01 2.10
New genotype (long coleoptile) 4.54 1.45
Kirkegaard and Hunt (2010)
Baseline Scenario (Kerang, Victorian Mallee)
Continuous wheat, grazed fallow, burn/cultivate, sow after 25 May (1980s)
Mean yield = 1.6 t/ha

Yield progress in breeding US maize hybrids
(Donald Duvick)

Hybrid wheat? Potential to increase yield and rapidly integrate new genetic diversity
B73 (left) and Mo17 (right) produce the hybrid F1(centre) (source: Plant Science Inst Iowa St Univ)
Complementary gene action –- contribution to hybrid vigour- shorter time to commercial
release- new diversity readily
incorporated- IP protection
Issues –- development of heterotic gene
pools- cost of seed production- male-sterility systems
(apomixes?)

Genetic engineering
All other organisms
• unlimited genes
• precise expression
Interspecific hybridisation
Somatic fusion
Related plant species
Domestication
Hybridisation & selection
Induced mutation
Crop species
Solutions found by nature in
any species can inspire
improvements to crops

Global adoption of GM crops (2011)
Source: International Service for the Acquisition of Agribiotech Applications (2012)

Global adoption of GM crops (millions ha in 2011)
Source: International Service for the Acquisition of Agribiotech Applications (2012)
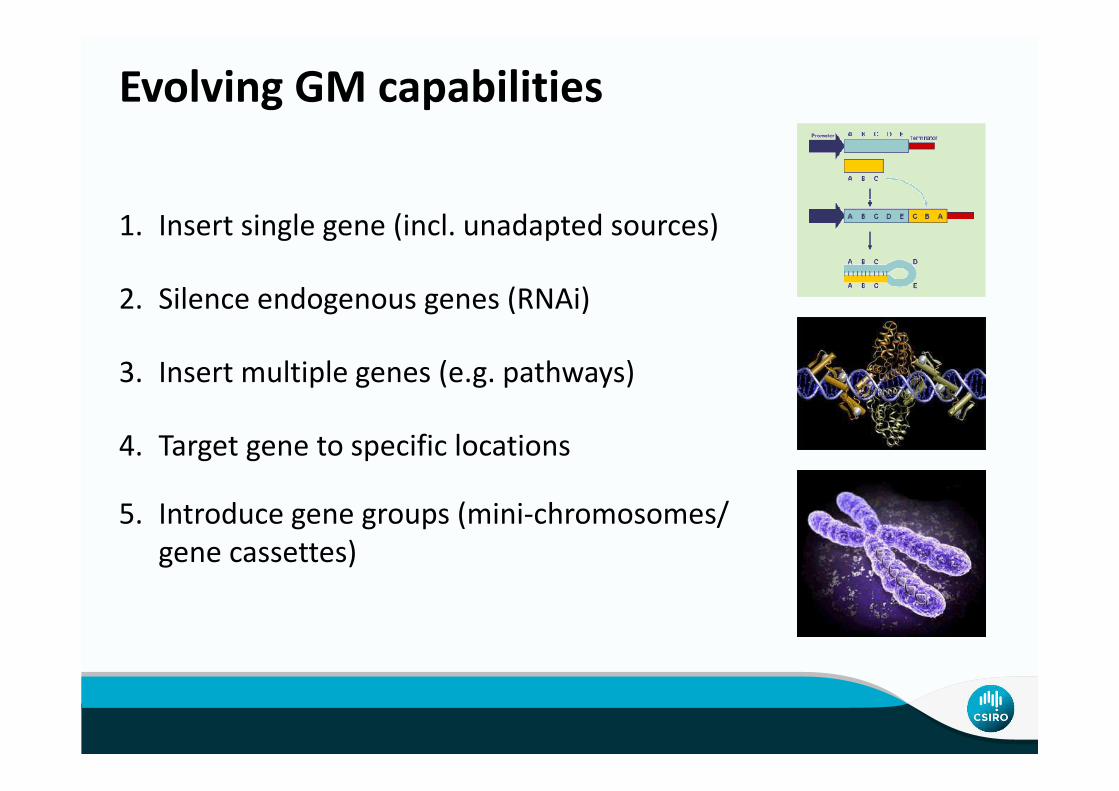
Evolving GM capabilities
1. Insert single gene (incl. unadapted sources)
2. Silence endogenous genes (RNAi)
3. Insert multiple genes (e.g. pathways)
4. Target gene to specific locations
5. Introduce gene groups (mini-chromosomes/
gene cassettes)

• Increasing crop productivity (yield potential)
• Bringing hybrid vigour to non-hybrid crops
• Pure-breeding hybrids (apomixis)
• Improving photosynthesis (C4 energy capture)
• Increasing input-use efficiency (water & nutrients)
• Improving stress tolerance (e.g. Al-tolerant barley)
“Step changes” through gene technology The First Wave – Input Traits

How and when will the biotechnology be deployed to 2050?

Maintaining/understanding genetic diversity will continue to deliver new traits for improving productivity in rainfed systems
Quality, robust phenotyping is becoming the weak link in the system (managed environments?)
Agronomic understanding is needed to provide direction in traits conferring adaptation over the next decades
Biotechnology via markers will increasingly deliver greater efficiency and lower costs in selection of simple and complex traits
GM winter cereals are coming but will likely focus on high return traits initially
Summary

CSIRO Plant IndustryGreg Rebetzke
t +61 2 6246 5153e [email protected] www.csiro.au/
CSIRO PLANT INDUSTRY
Thank you
Ian Longson, DAFWA and update organisers,and to those who contributed slides and ideas

• Promotes competition
• Promotes rapid uptake (and importantly feedback) on delivered pre-breeding outputs
• Provides access to new technologies from overseas private companies
� Access to new germplasm (disease, quality, yield etc.)
� Access to new methodologies (seed chipper, GS etc.) from research investment in wheat and other crops incl. maize
Benefits in commercialisation

Breeders have many objectives…
RustsCCNPrats
SeptoriaYLS
BoronAl
Grain conformationFlour yieldWater abs.
ProteinColour
Hardnessetc.
Agronomic type-Straw strengthFloweringEarly vigourEstablishmentMn, Zn efficiencyP uptake
Summary of wheat breeding objectives SA (Hollamby 2002)

Theme 1041
Global food security crisis‘in the next 50 years we will need to produce as much food as has been consumed over our entire human history’ (Megan Clark, 2009)
1 petacalorie = 4.2 x 10¹⁵ joules
Alternative uses – animal feed, biofueld etc.

Water-limited yield potential – the concept.
Grain Yield = [Water used] x [Transpiration Efficie ncy] x [Harvest Index]
Passioura (1977)
Amount of water (mm)transpired by the crop
Biomass producedper mm of water transpired (kg/mm)
Proportion of total biomassthat is harvestable grain
kg/ha = [mm] x [(kg/ha) /mm] x [kg/kg]

Breeders make genetic gain for complex traits
Year of release
1840 1860 1880 1900 1920 1940 1960 1980 2000
Gra
in y
ield
(t/h
a)
1.0
1.2
1.4
1.6
1.8
2.0
2.2
2.4
WA cultivars - mean of six experiments(Perry and D’Antuono 1989)
SA/WA cultivars – three locations(Sadras and Lawson 2011)
1950 1960 1970 1980 1990 2000 2010
Year of release