CSE 549: Genome Assembly De Bruijn Graph · CSE 549: Genome Assembly De Bruijn Graph All slides in...
66
CSE 549: Genome Assembly De Bruijn Graph All slides in this lecture not marked with “*” courtesy of Ben Langmead.
Transcript of CSE 549: Genome Assembly De Bruijn Graph · CSE 549: Genome Assembly De Bruijn Graph All slides in...

CSE 549: Genome Assembly De Bruijn Graph
All slides in this lecture not marked with “*” courtesy of Ben Langmead.

Real-world assembly methods
Both handle unresolvable repeats by essentially leaving them out
Fragments are contigs (short for contiguous)
Unresolvable repeats break the assembly into fragments
OLC: Overlap-Layout-Consensus assemblyDBG: De Bruijn graph assembly
a_long_long_long_time
a_long_long_time a_long+++++long_time
Assemble substrings with Greedy-SCS
Assemble substrings with OLC or DBG

De Bruijn graph assembly
A formulation conceptually similar to overlapping/SCS, but has some potentially helpful properties not shared by SCS.

k-mer
“k-mer” is a substring of length k
GGCGATTCATCGATTCA 4-mer of S:
S:
All 3-mers of S: GGC+GCG++CGA+++GAT++++ATT+++++TTC++++++TCA+++++++CAT++++++++ATC+++++++++TCG
I’ll use “k-1-mer” to refer to a substring of length k - 1
mer: from Greek meaning “part”

De Bruijn graph
AAA, AAB, ABB, BBB, BBA
As usual, we start with a collection of reads, which are substrings of the reference genome.
AAB is a k-mer (k = 3). AA is its left k-1-mer, and AB is its right k-1-mer.
AAB
AA ABL R
3-mer
AAB’s left 2-mer AAB’s right 2-mer

De Bruijn graph
AAA, AAB, ABB, BBB, BBA
Take each length-3 input string and split it into two overlapping substrings of length 2. Call these the left and right 2-mers.
AA, AA, AA, AB, AB, BB, BB, BB, BB, BA
Let 2-mers be nodes in a new graph. Draw a directed edge from each left 2-mer to corresponding right 2-mer:
AA
AB
BA
BB
L R L R L R L R L R
Each edge in this graph corresponds to a length-3 input string
AAABBBAtake all 3-mers:
form L/R 2-mers:

De Bruijn graph
AA
AB
BA
BB
An edge corresponds to an overlap (of length k-2) between two k-1 mers. More precisely, it corresponds to a k-mer from the input.
AAAAAB
ABB
BBB
BBA

De Bruijn graph
AA
AB
BA
BB
If we add one more B to our input string: AAABBBBA, and rebuild the De Bruijn graph accordingly, we get a multiedge.
AAAAAB
ABB
BBB
BBA
BBB

Directed multigraph
Directed multigraph G(V, E) consists of set of vertices, V and multiset of directed edges, E
Otherwise, like a directed graph
a b
c d
V = { a, b, c, d }E = { (a, b), (a, b), (a, b), (a, c), (c, b) }
Repeated
Node’s indegree = # incoming edges
Node’s outdegree = # outgoing edges
De Bruijn graph is a directed multigraph

Eulerian walk definitions and statements
Node is balanced if indegree equals outdegree
Node is semi-balanced if indegree differs from outdegree by 1
A directed, connected graph is Eulerian if and only if it has at most 2 semi-balanced nodes and all other nodes are balanced
Graph is connected if each node can be reached by some other node
Jones and Pevzner section 8.8
AA
AB
BA
BB
Eulerian walk visits each edge exactly once
Not all graphs have Eulerian walks. Graphs that do are Eulerian. (For simplicity, we won’t distinguish Eulerian from semi-Eulerian.)

De Bruijn graph
AAA, AAB, ABB, BBB, BBA
Back to our De Bruijn graph
AA, AA, AA, AB, AB, BB, BB, BB, BB, BAAA
AB
BA
BB L R L R L R L R L R
Is it Eulerian?
Argument 1: AA → AA → AB → BB → BB → BA
Argument 2: AA and BA are semi-balanced, AB and BB are balanced
Yes

De Bruijn graph
A procedure for making a De Bruijn graph for a genome
Start with an input string: a_long_long_long_time
Take each k mer and split into left and right k-1 mers
Pick a substring length k: 5
long_
long+ong_
Add k-1 mers as nodes to De Bruijn graph (if not already there), add edge from left k-1 mer to right k-1 mer
Assume perfect sequencing where each length-k substring is sequenced exactly once with no errors
ng_l
g_lo a_lo
_lon
long
ong_
ng_t
g_ti
_tim
time

a_lo
_lon
a_lo
_lon
long
a_lo
_lon
long
ong_ ong_
ng_l
a_lo
_lon
long
ng_l
g_lo
ong_
a_lo
_lon
long
ng_l
g_lo a_lo
_lon
long
ong_
ng_l
g_lo a_lo
_lon
long
ong_
ng_l
g_lo a_lo
_lon
long
ong_
First 8 k-mer additions, k = 5a_long_long_long_time
De Bruijn graph

ng_l
g_lo a_lo
_lon
long
ong_
ng_t
ng_l
g_lo a_lo
_lon
long
ong_
ng_t
g_ti
ng_l
g_lo a_lo
_lon
long
ong_
ng_t
g_ti
_tim
ng_l
g_lo a_lo
_lon
long
ong_
ng_t
g_ti
_tim
time
ng_l
g_lo a_lo
_lon
long
ong_
Finished grapha_long_long_long_timeLast 5 k-mer additions, k = 5
De Bruijn graph

With perfect sequencing, this procedure always yields an Eulerian graph. Why?
ng_l
g_lo a_lo
_lon
long
ong_
ng_t
g_ti
_tim
time
Node for k-1-mer from left end is semi-balanced with one more outgoing edge than incoming *
Node for k-1-mer at right end is semi-balanced with one more incoming than outgoing *
* Unless genome is circular
Other nodes are balanced since # times k-1-mer occurs as a left k-1-mer = # times it occurs as a right k-1-mer
De Bruijn graph

De Bruijn graph implementationclass%DeBruijnGraph:%%%%"""%A%De%Bruijn%multigraph%built%from%a%collection%of%strings.%%%%%%%%User%supplies%strings%and%k>mer%length%k.%%Nodes%of%the%De%%%%%%%%Bruijn%graph%are%k>1>mers%and%edges%join%a%left%k>1>mer%to%a%%%%%%%%right%k>1>mer.%"""%%%%%@staticmethod%%%%def%chop(st,%k):%%%%%%%%"""%Chop%a%string%up%into%k%mers%of%given%length%"""%%%%%%%%for%i%in%xrange(0,%len(st)>(k>1)):%yield%st[i:i+k]%%%%%%%%class%Node:%%%%%%%%"""%Node%in%a%De%Bruijn%graph,%representing%a%k>1%mer%"""%%%%%%%%def%__init__(self,%km1mer):%%%%%%%%%%%%self.km1mer%=%km1mer%%%%%%%%%%%%%%%%def%__hash__(self):%%%%%%%%%%%%return%hash(self.km1mer)%%%%%%%%def%__init__(self,%strIter,%k):%%%%%%%%"""%Build%De%Bruijn%multigraph%given%strings%and%k>mer%length%k%"""%%%%%%%%self.G%=%{}%%%%%#"multimap"from"nodes"to"neighbors%%%%%%%%self.nodes%=%{}%#"maps"k515mers"to"Node"objects%%%%%%%%self.k%=%k%%%%%%%%for%st%in%strIter:%%%%%%%%%%%%for%kmer%in%self.chop(st,%k):%%%%%%%%%%%%%%%%km1L,%km1R%=%kmer[:>1],%kmer[1:]%%%%%%%%%%%%%%%%nodeL,%nodeR%=%None,%None%%%%%%%%%%%%%%%%if%km1L%in%self.nodes:%%%%%%%%%%%%%%%%%%%%nodeL%=%self.nodes[km1L]%%%%%%%%%%%%%%%%else:%%%%%%%%%%%%%%%%%%%%nodeL%=%self.nodes[km1L]%=%self.Node(km1L)%%%%%%%%%%%%%%%%if%km1R%in%self.nodes:%%%%%%%%%%%%%%%%%%%%nodeR%=%self.nodes[km1R]%%%%%%%%%%%%%%%%else:%%%%%%%%%%%%%%%%%%%%nodeR%=%self.nodes[km1R]%=%self.Node(km1R)%%%%%%%%%%%%%%%%self.G.setdefault(nodeL,%[]).append(nodeR)
Chop string into k-mers
For each k-mer, find left and right k-1-mers
Create corresponding nodes (if necessary) and add edge

For Eulerian graph, Eulerian walk can be found in O(| E |) time. | E | is # edges.
Convert graph into one with Eulerian cycle (add an edge to make all nodes balanced), then use this recursive procedure
#"Make"all"nodes"balanced,"if"not"already
tour%=%[]#"Pick"arbitrary"nodesrc%=%g.iterkeys().next()%
def%__visit(n):while%len(g[n])%>%0:
dst%=%g[n].pop()__visit(dst)
%%%tour.append(n)%%%%%%%%__visit(src)#"Reverse"order,"omit"repeated"nodetour%=%tour[::>1][:>1]
#"Turn"tour"into"walk,"if"necessary
Insight: If C is a cycle in an Eulerian graph, then after removing edges of C, remaining connected components are also Eulerian
http://www.algorithmist.com/index.php/Eulerian_tour
De Bruijn graph

Full illustrative De Bruijn graph and Eulerian walk:
http://nbviewer.ipython.org/7237207
>>>+G+=+DeBruijnGraph(["a_long_long_long_time"],+5)>>>+print+G.eulerianWalkOrCycle()['a_lo',+'_lon',+'long',+'ong_',+'ng_l',+'g_lo',+'_lon',+'long',+'ong_',+'ng_l',+'g_lo',+'_lon',+'long',+'ong_',+'ng_t',+'g_ti',+'_tim',+'time']
Example where Eulerian walk gives correct answer for small k whereas Greedy-SCS could spuriously collapse repeat:
ng_l
g_lo a_lo
_lon
long
ong_
ng_t
g_ti
_tim
time
De Bruijn graph

Another example Eulerian walk:
>>>+st+=+"to_every_thing_turn_turn_turn_there_is_a_season">>>+G+=+DeBruijnGraph([st],+4)>>>+path+=+G.eulerianWalkOrCycle()>>>+superstring+=+path[0]+++''.join(map(lambda+x:+x[P1],+path[1:]))>>>+print+superstringto_every_thing_turn_turn_turn_there_is_a_season
to_
o_e
n_t
_tu
_th
g_t
ery
ry_
_ev
y_t
sea
eas
a_s
_se
ng_
re_
e_i
ing
ver
her
ere
s_a
_a_
_is
is_tur
urn
thi
the
aso
son
eve
hin
rn_
Recall: This is not generally possible or tractable in the overlap/SCS formulation
De Bruijn graph

Assuming perfect sequencing, procedure yields graph with Eulerian walk that can be found efficiently.
ng_l
g_lo a_lo
_lon
long
ong_
ng_t
g_ti
_tim
time
We saw cases where Eulerian walk corresponds to the original superstring. Is this always the case?
De Bruijn graph

No: graph can have multiple Eulerian walks, only one of which corresponds to original superstring
BE
EF
AB
BC BY
CD
FA ZA
DA
Right: graph for ZABCDABEFABY, k = 3
Alternative Eulerian walks:
ZA → AB → BE → EF → FA → AB → BC → CD → DA → AB → BY
ZA → AB → BC → CD → DA → AB → BE → EF → FA → AB → BY
These correspond to two edge-disjoint directed cycles joined by node AB
AB is a repeat: ZABCDABEFABY
De Bruijn graph

Case where k = 4 works:>>>+st+=+"to_every_thing_turn_turn_turn_there_is_a_season">>>+G+=+DeBruijnGraph([st],+4)>>>+path+=+G.eulerianWalkOrCycle()>>>+superstring+=+path[0]+++''.join(map(lambda+x:+x[P1],+path[1:]))>>>+print+superstringto_every_thing_turn_turn_turn_there_is_a_season
But k = 3 does not:
>>>+st+=+"to_every_thing_turn_turn_turn_there_is_a_season">>>+G+=+DeBruijnGraph([st],+3)>>>+path+=+G.eulerianWalkOrCycle()>>>+superstring+=+path[0]+++''.join(map(lambda+x:+x[P1],+path[1:]))>>>+print+superstringto_every_turn_turn_thing_turn_there_is_a_season
Due to repeats that are unresolvable at k = 3
De Bruijn graph

This is the first sign that Eulerian walks can’t solve all our problems
Other signs emerge when we think about how actual sequencing differs from our idealized construction
BE
EF
AB
BC BY
CD
FA ZA
DA
De Bruijn graph

Gaps in coverage can lead to disconnected graph
Graph for a_long_long_long_time, k = 5:
ng_l
g_lo a_lo
_lon
long
ong_
ng_t
g_ti
_tim
time
De Bruijn graph

Gaps in coverage can lead to disconnected graph
Graph for a_long_long_long_time, k = 5 but omitting ong_t :
ng_l
g_lo a_lo
_lon
long
ong_
g_ti
_tim
ng_t
time
Connected components are individually Eulerian, overall graph is not
De Bruijn graph

Differences in coverage also lead to non-Eulerian graph
Graph for a_long_long_long_time, k = 5 but with extra copy of ong_t :
ng_l
g_lo a_lo
_lon
long
ong_
ng_t
g_ti
_tim
time
Graph has 4 semi-balanced nodes, isn’t Eulerian
De Bruijn graph

Errors and differences between chromosomes also lead to non-Eulerian graphs
Graph for a_long_long_long_time, k = 5 but with error that turns a copy of long_ into lxng_
Graph is not connected; largest component is not Eulerian
ng_l
g_lo a_lo
_lon
lxng
xng_
long
ong_
ng_t
g_ti
_tim
time
De Bruijn graph

Casting assembly as Eulerian walk is appealing, but not practical
Even if graph were Eulerian, repeats yield many possible walks
Uneven coverage, sequencing errors, etc make graph non-Eulerian
De Bruijn Superwalk Problem (DBSP) is an improved formulation where we seek a walk over the De Bruijn graph, where walk contains each read as a subwalk
Kingsford, Carl, Michael C. Schatz, and Mihai Pop. "Assembly complexity of prokaryotic genomes using short reads." BMC bioinformatics 11.1 (2010): 21.
Proven NP-hard!
Medvedev, Paul, et al. "Computability of models for sequence assembly." Algorithms in Bioinformatics. Springer Berlin Heidelberg, 2007. 289-301.
De Bruijn graph
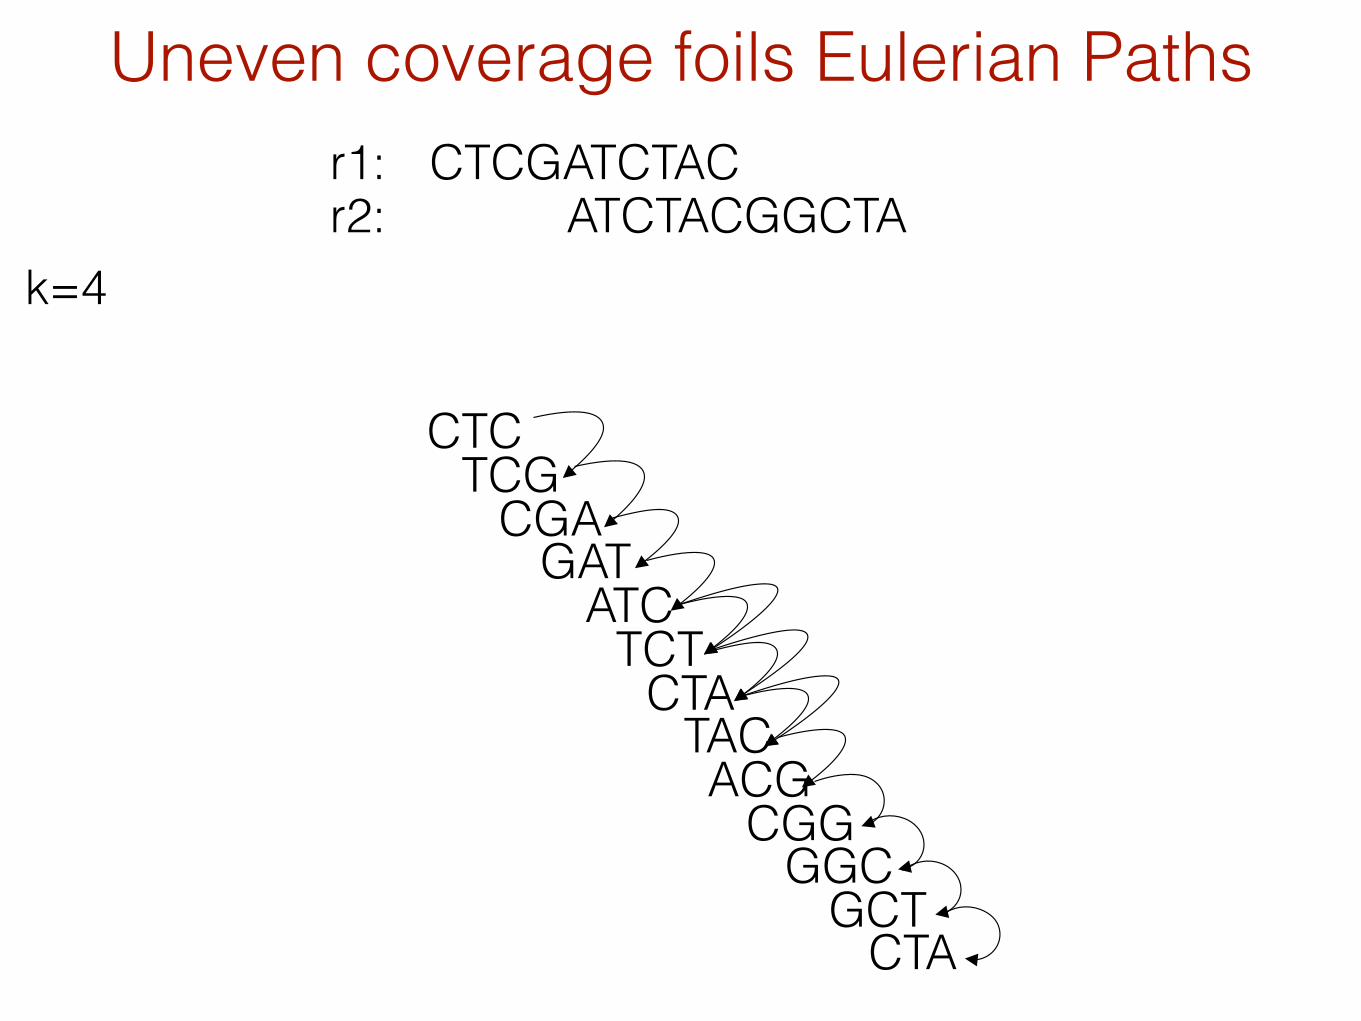
Uneven coverage foils Eulerian PathsCTCGATCTAC
ATCTACGGCTAr1:r2:
k=4
CTCTCG
CGAGAT
ATCTCT
CTATACACG
CGGGGC
GCTCTA

Uneven coverage foils Eulerian PathsCTCGATCTAC
ATCTACGGCTAr1:r2:
k=4
CTCTCG
CGAGAT
ATCTCT
CTATACACG
CGGGGC
GCTCTA
= un-balanced vertex

Uneven coverage foils Eulerian PathsCTCGATCTAC
ATCTACGGCTAr1:r2:
k=4
CTCTCG
CGAGAT
ATCTCT
CTATACACG
CGGGGC
GCTCTA
= un-balanced vertex

The Problem with Eulerian Paths
(Kingsford, Schatz, Pop, 2010)
There are typically an astronomical number of possible Eulerian tours with perfect data.
Adding back constraints to limit # of tours leads to a NP-hard problem.
With imperfect data, there are usually NO Eulerian tours
Estimating # of parallel edges is usually tricky.
Aside: counting # of Eulerian tours in a directed graph is easy, but in an undirected graph is #P-complete (hard).
* slide courtesy of Carl Kingsford
k = 50

*
Bursting bubbles
Compeau, Phillip EC, Pavel A. Pevzner, and Glenn Tesler. "How to apply de Bruijn graphs to genome assembly." Nature biotechnology 29.11 (2011): 987-991.
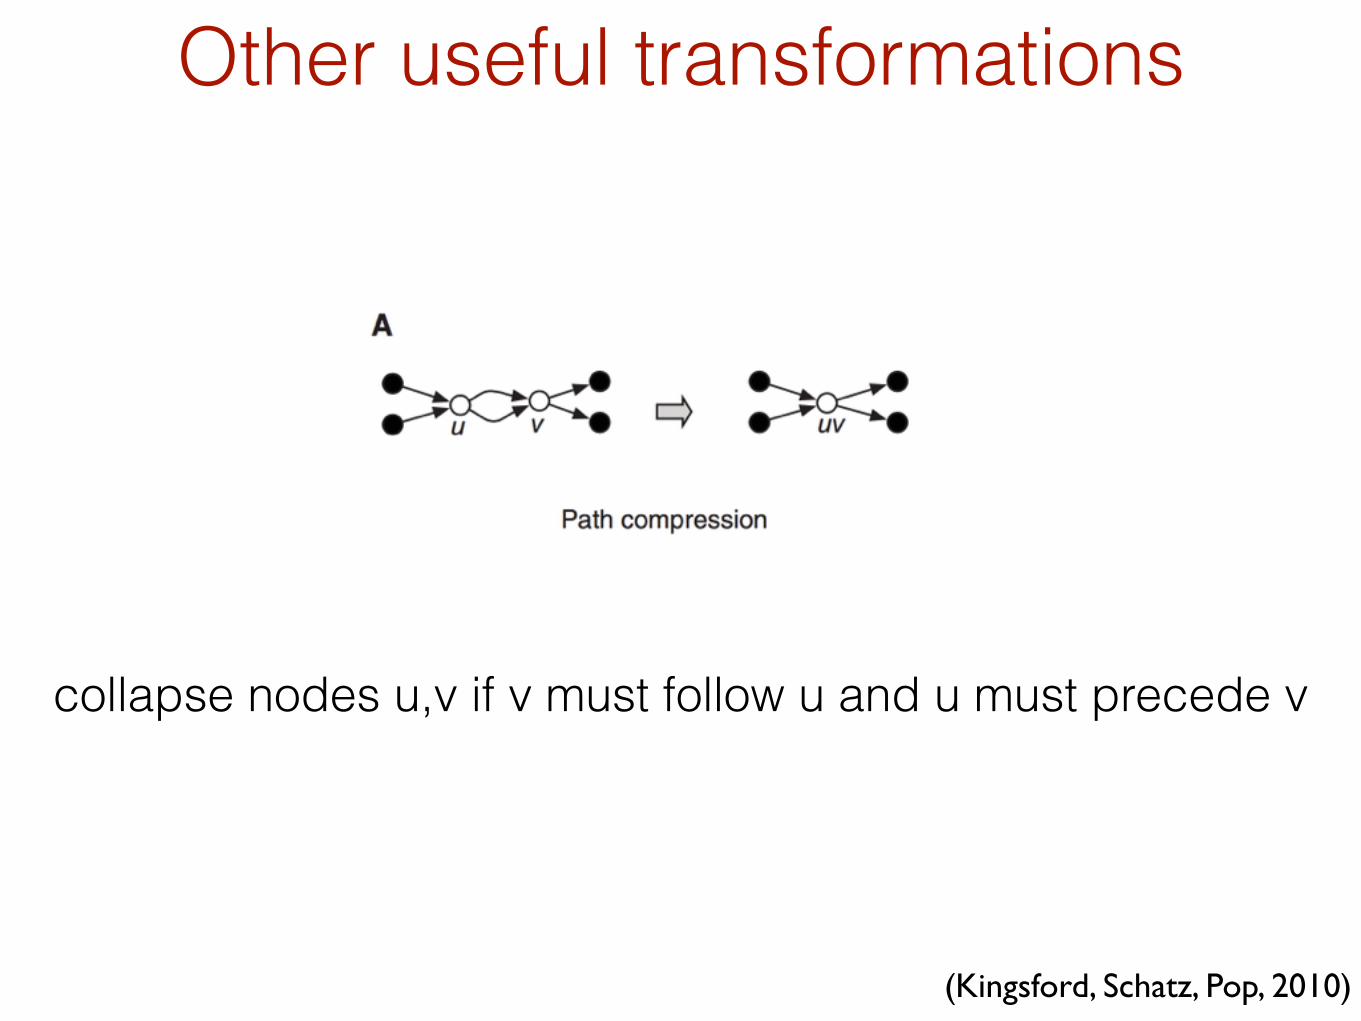
Other useful transformations
collapse nodes u,v if v must follow u and u must precede v
(Kingsford, Schatz, Pop, 2010)

Other useful transformations
Trees in the cycle graph represent subgraphs with unique solutions, and can therefore be collapsed
Can obtain from G a cycle graph, cycle(G) (green above), where each vertex is a simple cycle and an edge connects
two cycles if they share a node in the Eulerian graph G
(Kingsford, Schatz, Pop, 2010)

Other useful transformations
“Half-decision” nodes (those with a single predecessor or successor) can be split into multiple nodes that can often be
further compressed with path-compression
(Kingsford, Schatz, Pop, 2010)

Other useful transformations
Let u→v→w be 3 nodes in a path s.t. u→v has the highest multiplicity of edges entering v and v→w has the highest
multiplicity of edges laving v. Let cu→v and cv→w be multiplies of u→v and v→w. If u ≠ w, we can infer that
u→v→w must be part of any Eulerian tour if cu→v > d+(v) - cv→w where d+(v) is the out-degree of v.
(Kingsford, Schatz, Pop, 2010)

Other useful transformations
Replacing non-decision nodes with edges, along with the other transformations considered here, results in a graph containing either just a single
node, or only decision nodes that have both more than one predecessor and more than on successor.
(Kingsford, Schatz, Pop, 2010)

But first we note that using the De Bruijn graph representation has other advantages...
In practice, De Bruijn graph-based tools give up on unresolvable repeats and yield fragmented assemblies, just like OLC tools.
De Bruijn graph

To build a De Bruijn graph in practice:
Pick k. Assume k ≤ shortest read length (k = 30 to 50 is common).
For each read:
For each k-mer:
Add k-mer’s left and right k-1-mers to graph if not there already. Draw an edge from left to right k-1-mer.
d = 6 x 10⁹ reads n = 100 ntm = 3 x 10⁹ nt
!
≈ 1 sequencing run
≈ human
Say a sequencer produces d reads of length n from a genome of length m
De Bruijn graph

a_long_long_long_time
a_long_long_long,+ng_long_l,+g_long_time
Genome:
Reads:k-mers:
Pick k = 8
a_long_l++_long_lo++++long_lon++++ong_long+++++ng_long_+++++g_long_l++++++_long_lo+++++++long_lon++++++++ong_long
g_long_t+_long_ti++long_tim+++ong_time
ng_long_+g_long_l
g_long_
_long_l _long_t
long_ti
ong_tim
long_lo
ong_lon
ng_long ng_time
a_long_
Given n (# reads), N (total length of all reads) and k, and assuming k < length of shortest read:
Exact number of k-mers: N - n (k -1) O(N)
This is also the number of edges, | E |
Number of nodes | V | is at most 2 ∙ | E |, but typically much smaller due to repeated k-1-mers
De Bruijn graph

g_long_
_long_l _long_t
long_ti
ong_tim
long_lo
ong_lon
ng_long ng_time
a_long_
How much work to build graph?
For each k-mer, add 1 edge and up to 2 nodes
Reasonable to say this is O(1) expected work
Assume hash map encodes nodes & edges
Assume k-1-mers fit in O(1) machine words, and hashing O(1) machine words is O(1) work
Querying / adding a key is O(1) expected work
O(1) expected work for 1 k-mer, O(N) overall
De Bruijn graph

Timed De Bruijn graph construction applied to progressively longer prefixes of lambda phage genome, k = 14
0 10000 20000 30000 40000 50000
0.00
0.05
0.10
0.15
0.20
Length of genome
Sec
onds
requ
ired
to b
uild
O(N) expectation appears to work in practice, at least for this small example
De Bruijn graph

In typical assembly projects, average coverage is ~ 30 - 50
ng_l
g_lo a_lo
_lon
long
ong_
ng_t
g_ti
_tim
time
De Bruijn graph

Recall average coverage: average # reads covering a genome position
GGCGTCTATATCTCGGCTCTAGGCCCTCATTTTTT
++++++++++++++++++CTAGGCCCTCAATTTTT++++++++++++++++CTCTAGGCCCTCAATTTTT++++++++++++++GGCTCTAGGCCCTCATTTTTT+++++++++++CTCGGCTCTAGCCCCTCATTTT++++++++TATCTCGACTCTAGGCCCTCA++++++++TATCTCGACTCTAGGCC++++TCTATATCTCGGCTCTAGGGGCGTCTATATCTCGGGCGTCGATATCTGGCGTCTATATCT
177 nucleotides
35 nucleotides
Average coverage = 177 / 35 ≈ 7x
De Bruijn graph

In typical assembly projects, average coverage is ~ 30 - 50
Same edge might appear in dozens of copies; let’s use edge weights instead
ng_l
g_lo a_lo
_lon
long
ong_
ng_t
g_ti
_tim
time
ng_l
g_lo
20
a_lo
_lon
10
long
ong_
30
20
ng_t
10
g_ti
_tim
10
10
20
30
time
10
Weight = # times k-mer occurs
Using weights, there’s one weighted edge for each distinct k-mer
Before: one edge per k-mer
After: one weighted edge per distinct k-mer
De Bruijn graph

Say (a) reads are error-free, (b) we have one weighted edge for each distinct k-mer, and (c) length of genome is G
# of nodes and edges both O(N); N is total length of all reads
So # of nodes and edges are also both O(G)
Can’t be more distinct k-mers than there are k-mers in the genome; likewise for k-1-mers
Combine with the O(N) bound and the # of nodes and edges are both O(min(N, G))
There’s one node for each distinct k-1-mer, one edge for each distinct k-mer
De Bruijn graph

With high average coverage, O(G) size bound is advantageous
Size of De Bruijn graph grows sublinearly when average
coverage is high
10 20 30 40 50
20000
40000
60000
80000
Average coverage
# de
Bru
ijn g
raph
nod
es +
edg
es
k = 30
Genome = lambda phage (~ 48.5 K nt)
Draw random k-mers until target average coverage is reached (x axis)
Build De Bruijn graph and total the # of nodes and edges (y axis)
De Bruijn graph

De Bruijn graph
What De Bruijn graph advantages have we discovered?
Can be built in O(N) expected time, N = total length of reads
With perfect data, graph is O(min(N, G)) space; G = genome length
Compares favorably with overlap graph
Fast overlap graph construction (suffix tree) is O(N + a) time
Space is O(N + a).
a is O(n2)
Note: when average coverage is high, G ≪ N

De Bruijn graph
What did we give up?
Reads are immediately split into shorter k-mers; can’t resolve repeats as well as overlap graph
Read coherence is lost. Some paths through De Bruijn graph are inconsistent with respect to input reads.
Only a very specific type of “overlap” is considered, which makes dealing with errors more complicated, as we’ll see
This is the OLC ⟷ DBG tradeoff
Single most important benefit of De Bruijn graph is the O(min(G, N)) space bound, though we’ll see this comes with large caveats

Error correction
When data is error-free, # nodes, edges in de Bruijn graph is O(min(G, N))
10 20 30 40 50
0e+002e+044e+046e+048e+041e+05
Average coverage
# de
Bru
ijn g
raph
nod
es +
edg
es
What about data with sequencing errors?G bound
k = 30

Error correctionng_l
g_lo
20
a_lo
_lon
10
long
ong_
30
20
ng_t
10
g_ti
_tim
10
10
20
30
time
10
Take an example we saw (left) and mutate a k-mer character to a random other character with probability 1% (right)
ng_l
g_lo
20
a_lo
_lon
9
lolg
olg_
1
long
ong_
29
onga
ngal
1
atlo
tlon
1
19
ng_t
10
g_ti
_tim
10
_l_n
l_ng
1
1
10
_loo
loog
1
20
27
time
10
ng_l
g_lo
20
a_lo
_lon
9
lolg
olg_
1
long
ong_
29
onga
ngal
1
atlo
tlon
1
19
ng_t
10
g_ti
_tim
10
_l_n
l_ng
1
1
10
_loo
loog
1
20
27
time
10
6 errors result in 10 new nodes and 6 new weighted edges, all with weight 1

Error correction
Same experiment as before but with 5% error added
10 20 30 40 50
050000
150000
250000
Average coverage
# de
Bru
ijn g
raph
nod
es +
edg
es
0% error
5% error
G bound
Errors wipe out much of the benefit of the G bound
As more k-mers overlap errors, # nodes, edges approach N
k = 30
Instead of O(min(G, N)), we have something more like O(N)
Lambda phage genome

0% error
5% error
G bound
10 20 30 40 50
050000
150000
250000
Average coverage
# de
Bru
ijn g
raph
nod
es +
edg
es
1% error
Error correction
k = 30
Lambda phage genome

Error correction
If we can correct sequencing errors up-front, we can prevent De Bruijn graph from growing much beyond the G bound
How do we correct errors?
Analogy: design a spell checker for a language you’ve never seen before. How do you come up with suggestions?

Error correction
k-mer count histogram:
x axis is an integer k-mer count, y axis is # distinct k-mers with that count
Right: such a histogram for 3-mers of CATCATCATCATCAT:
CAT occurs 5 times
ATC and TCA occur 4 times

Error correction
Say we have error-free sequencing reads drawn from a genome. The amount of sequencing is such that average coverage = 200. Let k = 20
~ 6,100 distinct k-mers occurred exactly 10 times in the input
How would the picture change for data with 1% error rate?
Hint: errors usually change high-count k-mer into low-count k-mer
5 10 15 20 25
02000
4000
6000
8000
10000
k-mer count
# di
stin
ct k
-mer
s w
ith th
at c
ount
Error-free

Error correction
~ 9.6K distinct k-mers occur just once
32 distinct k-mers occur just once
k-mers with errors usually occur fewer times than error-free k-mers
5 10 15 20 25
02000
4000
6000
8000
10000
k-mer count
# di
stin
ct k
-mer
s w
ith th
at c
ount
Error-free0.1% error

Error correctionIdea: errors tend to turn frequent k-mers to infrequent k-mers, so corrections should do the reverseSay we have a collection of reads where each distinct 8-mer occurs an average of ~10 times, and we have the following read:
GCGTATTACGCGTCTGGCCTGCGTATTA:&8&CGTATTAC:&8&>ATTACG:&9&&&TATTACGC:&9&&&&ATTACGCG:&9&&&&&TTACGCGT:&12&&&&&&TACGCGTC:&9&&&&&&&ACGCGTCT:&8&&&&&&&&CGCGTCTG:&10&&&&&&&&&GCGTCTGG:&10&&&&&&&&&&CGTCTGGC:&11&&&&&&&&&&>CTGGCC:&9&&&&&&&&&&&&TCTGGCCT:&8
Read:
8-mers:
# times each 8-mer occurs in the dataset. “k-mer count profile”
All 8-mer counts are around the average, suggesting read is error-free
(20 nt)

Error correction
Suppose there’s an error
GCGTACTACGCGTCTGGCCTGCGTACTA:&1&CGTACTAC:&3&>ACTACG:&1&&&TACTACGC:&1&&&&ACTACGCG:&2&&&&&CTACGCGT:&1&&&&&&TACGCGTC:&9&&&&&&&ACGCGTCT:&8&&&&&&&&CGCGTCTG:&10&&&&&&&&&GCGTCTGG:&10&&&&&&&&&&CGTCTGGC:&11&&&&&&&&&&>CTGGCC:&9&&&&&&&&&&&&TCTGGCCT:&8
Read:
Around average
Below averagek-mer count profile has corresponding stretch of below-average counts

Error correctionk-mer count profiles when errors are in different parts of the read:
GCGTACTACGCGTCTGGCCTGCGTACTA:&1&CGTACTAC:&3&>ACTACG:&1&&&TACTACGC:&1&&&&ACTACGCG:&2&&&&&CTACGCGT:&1&&&&&&TACGCGTC:&9&&&&&&&ACGCGTCT:&8&&&&&&&&CGCGTCTG:&10&&&&&&&&&GCGTCTGG:&10&&&&&&&&&&CGTCTGGC:&11&&&&&&&&&&>CTGGCC:&9&&&&&&&&&&&&TCTGGCCT:&8
GCGTATTACACGTCTGGCCTGCGTATTA:&8&CGTATTAC:&8&>ATTACA:&1&&&TATTACAC:&1&&&&ATTACACG:&1&&&&&TTACACGT:&1&&&&&&TACACGTC:&1&&&&&&&ACACGTCT:&2&&&&&&&&CACGTCTG:&1&&&&&&&&&GCGTCTGG:&10&&&&&&&&&&CGTCTGGC:&11&&&&&&&&&&>CTGGCC:&9&&&&&&&&&&&&TCTGGCCT:&8
GCGTATTACGCGTCTGGTCTGCGTATTA:&8&CGTATTAC:&8&>ATTACG:&9&&&TATTACGC:&9&&&&ATTACGCG:&9&&&&&TTACGCGT:&12&&&&&&TACGCGTC:&9&&&&&&&ACGCGTCT:&8&&&&&&&&CGCGTCTG:&10&&&&&&&&&GCGTCTGG:&10&&&&&&&&&&CGTCTGGT:&1&&&&&&&&&&>CTGGTC:&2&&&&&&&&&&&&TCTGGTCT:&1
Index
y
Index
y
Index
y

Error correction
k-mer count profile indicates where errors are
2 4 6 8 10 12
24
68
10
k-mer position
count
These probably overlap an error

Error correction
Simple algorithm: given a count threshold t:
For each read:For each k-mer:
If k-mer count < t:Examine k-mer’s neighbors within certain Hamming/edit distance. If neighbor has count ≥ t, replace old k-mer with neighbor.
5 10 15 20 25
02000
4000
6000
8000
10000
k-mer count
# di
stin
ct k
-mer
s w
ith th
at c
ount
Error-free0.1% error
Pick a t that lies in the trough (the dip) between the peaks

Error correction: results
Corrects 99.2% of the errors in the example 0.1% error dataset
Before After
0 50 100 150
01000
2000
3000
4000
k-mer count
# di
stin
ct k
-mer
s w
ith th
at c
ount
Error-free0.1% error
0 50 100 1500
1000
2000
3000
4000
k-mer count
# di
stin
ct k
-mer
s w
ith th
at c
ount
Error-free0.1% error, corrected
From 194K k-mers occurring exactly once to just 355

Error correction: results
5 10 15
60000
100000
140000
Average coverage
# de
Bru
ijn g
raph
nod
es +
edg
es
Error-free1% error, corrected1% error, uncorrectedG bound
For uncorrected reads, De Bruijn graph size is off the chart
For corrected reads, De Bruijn graph size is near G bound

Error correction
For error correction to work well:
Average coverage should be high enough and k should be set so we can distinguish infrequent from frequent k-mers
k-mer neighborhood we explore must be broad enough to find frequent neighbors. Depends on error rate and k.
Data structure for storing k-mer counts should be substantially smaller than the De Bruijn graph
Otherwise there’s no point doing error correction separately
Counts don’t have to be 100% accurate; just have to distinguish frequent and infrequent