CSE 123 Introduction to Computing - Mimoza
37
Lecture 2 Creating Charts with Excel and Working with Formulas and Functions SPRING 2012 Assist. Prof. A. Evren Tugtas CSE 123 Introduction to Computing
Transcript of CSE 123 Introduction to Computing - Mimoza
Lecture 2
Creating Charts with Excel and Working with Formulas
and Functions
SPRING 2012
Assist. Prof. A. Evren Tugtas
CSE 123
Introduction to Computing

Course notes have been prepared using some of the
information in;
Walkenbach, J. Microsoft Excel 2010: Bible. 4th
ed. Indiana. Wiley. 2010. ISBN: 978-0470474877
Larsen, R.W.Engineering with Excel. 3rd ed.
New Jersey. Prentice Hall. 2009. ISBN: 0-13-
601775-4. (Textbook)
2

Excel’s Built-In Functions
Elementary math functions
Trigonometric functions
Advanced math functions
Matrix function (Topic of the next lecture)
Functions for financial calculations
Functions for statistical calculations
Date and time functions
String functions
Lookup and reference functions
File handling functions
Functions for working with databases
3

Operators used in Formulas
4

Excel Formulas
Formula What it does
= “CSE “&”123” Joins (concatenates) two text strings to produce CSE123
=A1&A2 Concatenates the contents of cell A1 with cell A2. If cell
A1 contains 12 and cell A2 contains 21, the formula would
return 1221
=12^4 Fourth power of 12
=114^(1/2) Raises 114 to ½ power. Mathematically equal to square
root of 114
=A1<A2 Returns TRUE if the value in cell A1 is less than A2. If
cell A1 contains Ali and cell A2 contains Can, the formula
would return TRUE
=A1<=A2 Returns TRUE if the value in cell A1 is less than or equal
to A2
=A1<>A2 Returns TRUE if the value in A1 is not equal to A2 5

Operator Precedence in Excel Formulas
6
Symbol Operator Precedence
^ Exponentiation 1
* Multiplication 2
/ Division 2
+ Addition 3
- Substraction 3
& Concatenation 4
= Equal to 5
< Less than 5
> Greater than 5
You can use paranthesis to override Excels built-in order of preference

Function Syntax
=SUM(A1:A15)
7
Function
Argument
Your data range.
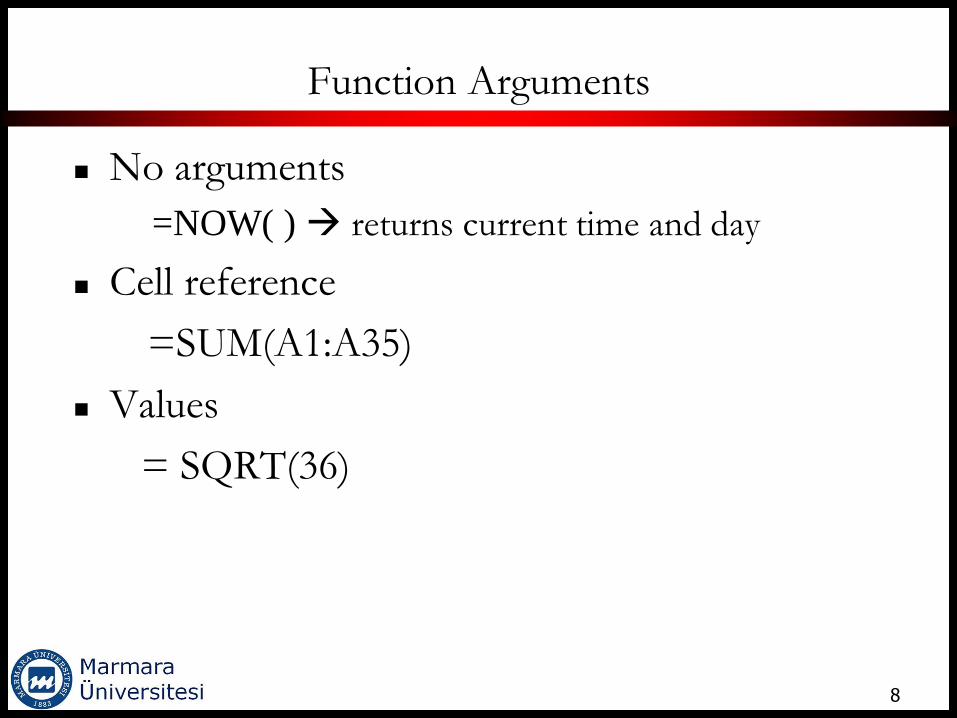
Function Arguments
No arguments
=NOW( ) returns current time and day
Cell reference
=SUM(A1:A35)
Values
= SQRT(36)
8

Text string
=PROPER(“maria callas”)
proper function converts text to the proper case
Other functions
=SQRT(SUM(B1:B45))
Expressions
=SQRT(45+23)
9
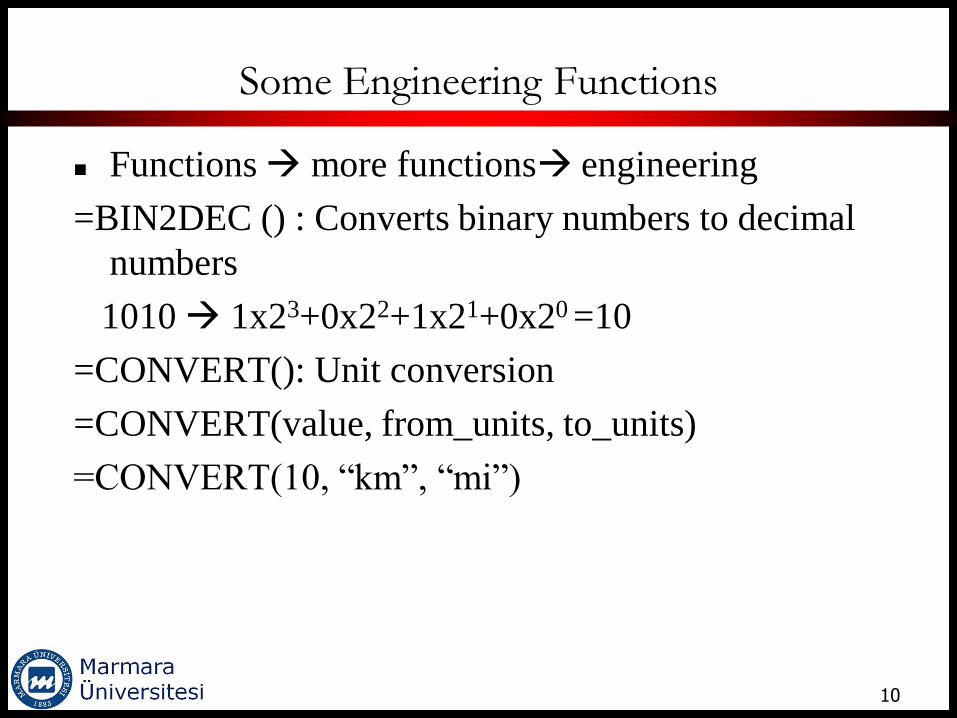
Some Engineering Functions
Functions more functions engineering
=BIN2DEC () : Converts binary numbers to decimal
numbers
1010 1x23+0x22+1x21+0x20 =10
=CONVERT(): Unit conversion
=CONVERT(value, from_units, to_units)
=CONVERT(10, “km”, “mi”)
10
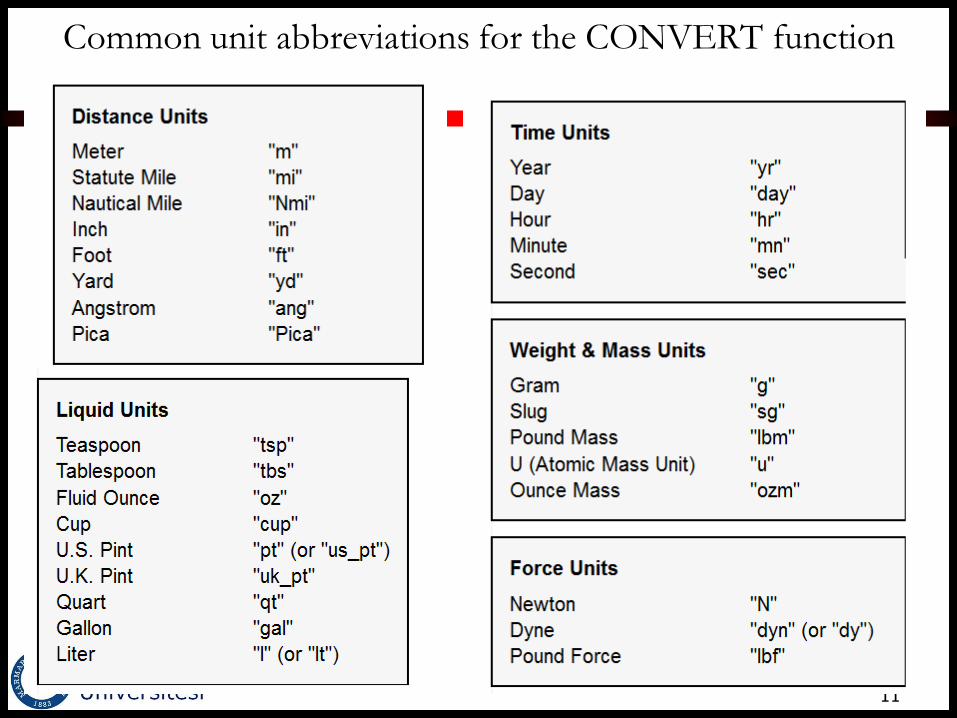
Common unit abbreviations for the CONVERT function
11

Common unit abbreviations for the CONVERT
function
12

Logarithm, Exponential and Trigonometric Functions
13
Function Name Operation
EXP(X) Returns e raised to the power x
LN(X) Returns the natural log of x
LOG10(X) Returns the base-10 log of x
LOG(X, base) Returns the logarithm of x to
the specified base
SIN(X) Returns the sine of x
COS(X) Returns the cosine of x
TAN(X) Returns the tangent of x

Referencing cells in other sheets/workbooks
SheetName!CellAddress
=Sheet2!D5
[Workbookname]SheetName!CellAddress
14

Text Manupulation Functions
ASCII Codes: American Standard Code for Information Interchange
15
http://www.cdrummo
nd.qc.ca/cegep/infor
mat/Professeurs/Alai
n/files/ascii.htm

Text Manupulation Functions
=CODE(“A”) Returns the ASCII Code for the
character
=CHAR (number) Returns the character specified
by the code number
=CHAR(CODE(“A”))
Write below to an excel sheet, see what it returns
=CHAR(83)&CHAR(116)&CHAR(111)&CHAR(112)
16
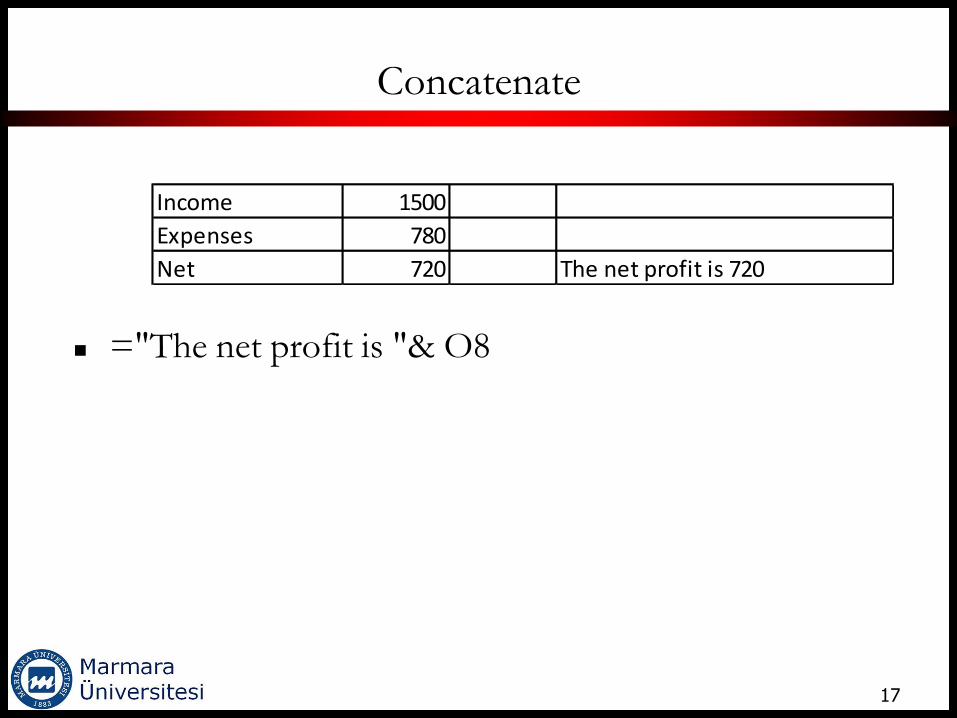
Concatenate
="The net profit is "& O8
17
Income 1500
Expenses 780
Net 720 The net profit is 720

Repeating a Character or String and Creating a Text
Histogram
=REPT(“a”, 20)
You can create a simple histogram by using
REPT function
=REPT("#", B3/100)
18
Months
Admission to
hospitals
January 900 #########
February 1200 ############
March 700 #######
April 300 ###
May 550 #####
June 760 #######
July 980 #########
August 1230 ############
September 1430 ##############
October 780 #######
November 1330 #############
December 1420 ##############
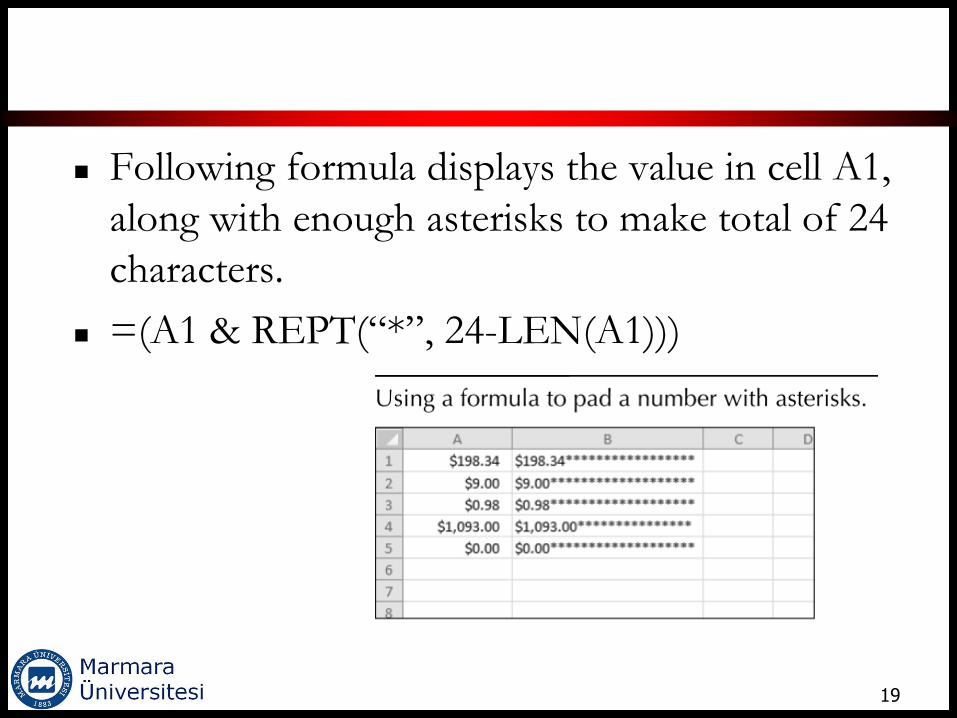
Following formula displays the value in cell A1,
along with enough asterisks to make total of 24
characters.
=(A1 & REPT(“*”, 24-LEN(A1)))
19

Changing the case of a text
UPPER(): Converts the text to all uppercase
LOWER(): Converts the text to all lowercase
PROPER():
20

IF Statements in Worksheet
The IF statement is used to analyse data and
make a decision
Formula can be entered by typing or can be
selected by using the “Function Library” at the
ribbon
To enter by typing,
=IF(logical_test, value_if_true, value_if_false)
21

IF Statements in Worksheet
To enter using the “Function Library”
22

IF Statements in Worksheet
=IF(logical_test, value_if_true, value_if_false)
If sales is higher than the target,
The salesman should get 2% of the target sale as bonus
If sales is lower than the target
The salesman does not get any bonus
=IF(A2>B2, B2*2%, 0)
= IF(A2>B2, B2*2%, “No Bonus”)
23

Nested IF Statements in Worksheet
When you have one condition and more than
two possible outcomes, you need to use
NESTED IF
=IF(1st logic test, 1st true value, IF(2nd logic test, 2nd true value, false value))
24
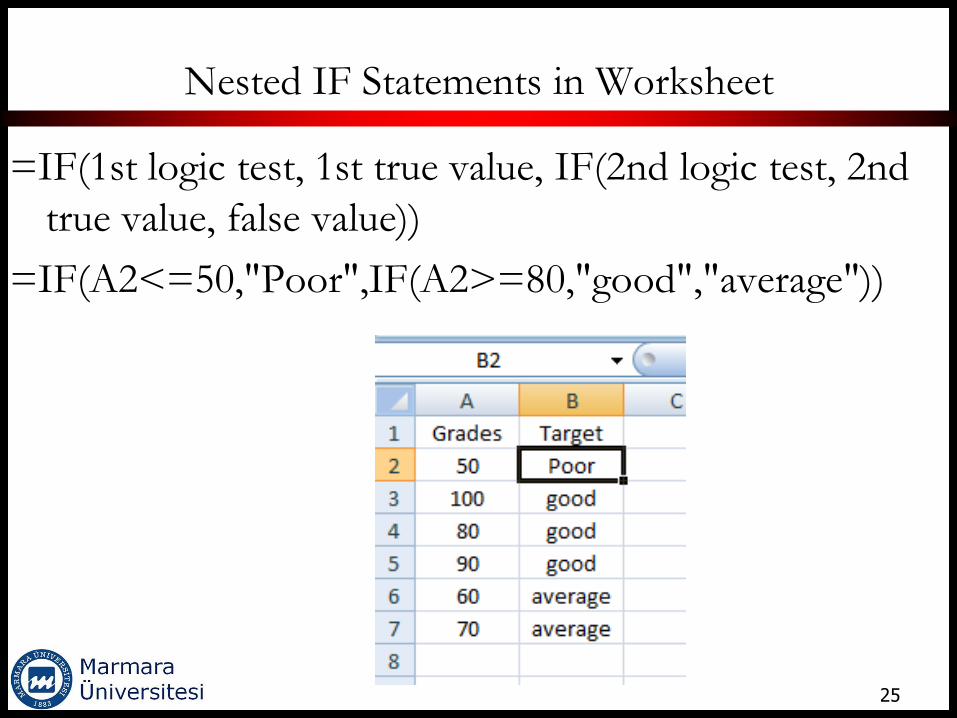
Nested IF Statements in Worksheet
=IF(1st logic test, 1st true value, IF(2nd logic test, 2nd
true value, false value))
=IF(A2<=50,"Poor",IF(A2>=80,"good","average"))
25

SUMIF Statement
=SUMIF(range, criteria, sum_range)
=SUMIF(B2:B7,"Environmental Eng.",C2:C7)
26

AVERAGEIF Statement
AVERAGEIF(Range, Criteria, [Average Range])
=AVERAGEIF(B2:B7, "BOD",C2:C7)
27

Creating Graphs with Excel
You can change the chart type etc.
29
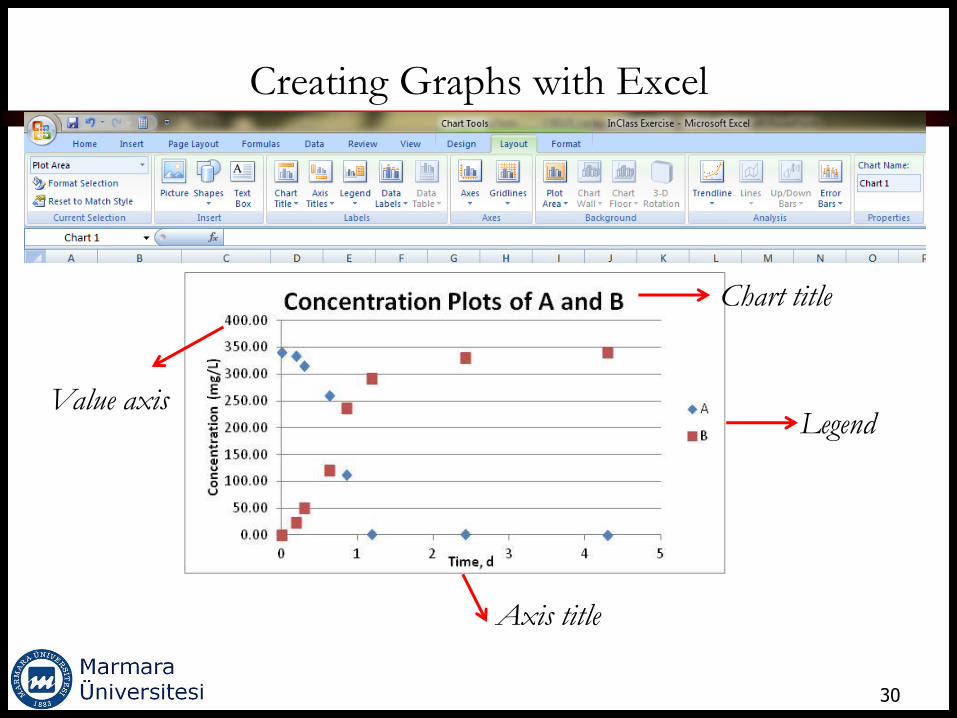
Creating Graphs with Excel
30
Axis title
Legend
Chart title
Value axis

Creating Graphs with Excel – Formatting the axis
31
•Right click on axis
•Select format axis

Adding a Trendline to a Graph
Trendlines are best-fit regression lines of various
forms
Linear (straight line)
Exponential
Logarithmic
Polynomial
Power
Moving average (nonregression trendline)
32

Adding a Trendline to a Graph
Because the trendlines are best-fit regression lines, the
equations of the trendlines and the R2 values are
available and can be displayed on the graph.
33

Adding a Trendline to a Graph
34

Adding a Trendline to a Graph
35

Error Bars
36

Error Bars
37