CSD: A Multi-User Similarity Metric for Community ...acrumin/papers/ESWA_2016.pdfCSD: A Multi-User...
23
See discussions, stats, and author profiles for this publication at: https://www.researchgate.net/publication/289573398 CSD: A Multi-User Similarity Metric for Community Recommendation in Online Social Networks ARTICLE in EXPERT SYSTEMS WITH APPLICATIONS · JANUARY 2016 Impact Factor: 2.24 · DOI: 10.1016/j.eswa.2016.01.003 READS 34 7 AUTHORS, INCLUDING: Xiao Han Institut Mines-Télécom 13 PUBLICATIONS 17 CITATIONS SEE PROFILE Ángel Cuevas University Carlos III de Madrid 59 PUBLICATIONS 183 CITATIONS SEE PROFILE Rubén Cuevas University Carlos III de Madrid 77 PUBLICATIONS 434 CITATIONS SEE PROFILE Noel Crespi Institut Mines-Télécom 284 PUBLICATIONS 720 CITATIONS SEE PROFILE All in-text references underlined in blue are linked to publications on ResearchGate, letting you access and read them immediately. Available from: Leye Wang Retrieved on: 11 April 2016
Transcript of CSD: A Multi-User Similarity Metric for Community ...acrumin/papers/ESWA_2016.pdfCSD: A Multi-User...

Seediscussions,stats,andauthorprofilesforthispublicationat:https://www.researchgate.net/publication/289573398
CSD:AMulti-UserSimilarityMetricforCommunityRecommendationinOnlineSocialNetworks
ARTICLEinEXPERTSYSTEMSWITHAPPLICATIONS·JANUARY2016
ImpactFactor:2.24·DOI:10.1016/j.eswa.2016.01.003
READS
34
7AUTHORS,INCLUDING:
XiaoHan
InstitutMines-Télécom
13PUBLICATIONS17CITATIONS
SEEPROFILE
ÁngelCuevas
UniversityCarlosIIIdeMadrid
59PUBLICATIONS183CITATIONS
SEEPROFILE
RubénCuevas
UniversityCarlosIIIdeMadrid
77PUBLICATIONS434CITATIONS
SEEPROFILE
NoelCrespi
InstitutMines-Télécom
284PUBLICATIONS720CITATIONS
SEEPROFILE
Allin-textreferencesunderlinedinbluearelinkedtopublicationsonResearchGate,
lettingyouaccessandreadthemimmediately.
Availablefrom:LeyeWang
Retrievedon:11April2016

CSD: A Multi-User Similarity Metric for Community Recommendation inOnline Social Networks
Xiao Hana,b,∗, Leye Wangb, Reza Farahbakhshb, Angel Cuevasb,c, Ruben Cuevasc, Noel Crespib,Lina Hed,e
aShanghai University of Finance and Economics, Shanghai 200433, ChinabInstitut-Mines Telecom, Telecom SudParis, 9 rue Charles Fourier, 91011 Evry Cedex, FrancecUniversidad Carlos III de Madrid, Av de la Universidad, 30 28911 Leganes, Madrid, Spain
dSchool of Earth Science and Engineering, Hohai University, Nanjing 210098, ChinaeState Key Laboratory of Geo-information Engineering, Xi’an 710054, China
Abstract
Communities are basic components in networks. As a promising social application, communityrecommendation selects a few items (e.g., movies and books) to recommend to a group of users.It usually achieves higher recommendation precision if the users share more interests; whereas, inplenty of communities (e.g., families, work groups), the users often share few. With billions ofcommunities in online social networks, quickly selecting the communities where the members aresimilar in interests is a prerequisite for community recommendation. To this end, we propose aneasy-to-compute metric, Community Similarity Degree (CSD), to estimate the degree of interestsimilarity among multiple users in a community. Based on 3460 emulated Facebook communi-ties, we conduct extensive empirical studies to reveal the characteristics of CSD and validate theeffectiveness of CSD. In particular, we demonstrate that selecting communities with larger CSDcan achieve higher recommendation precision. In addition, we verify the computation efficiencyof CSD: it costs less than 1 hour to calculate CSD for over 1 million of communities. Finally, wedraw insights about feasible extensions to the definition of CSD, and point out the practical usesof CSD in a variety of applications other than community recommendation.
Keywords: Online Social Network, Community Similarity Degree, Community Recommendation,Community Selection
1. Introduction
With the overwhelming explosion of Online Social Networks (OSNs), a large number of onlinecommunities are naturally formed by people who share certain properties. As reported, Googlewas able to index 620 million user-created communities in Facebook by 20101; Orkut exhibits more
∗Corresponding author. Tel.:+86 21 6590 1498Email addresses: [email protected] (Xiao Han), [email protected] (Leye Wang),
[email protected] (Reza Farahbakhsh), [email protected] (Angel Cuevas),[email protected] (Ruben Cuevas), [email protected] (Noel Crespi), [email protected](Lina He)
1http://allfacebook.com/google-now-indexes-620-million-facebook-groups b10520
Preprint submitted to Expert Systems with Applications January 11, 2016

than 100 million communities along with hundreds of newly created communities every day (Chenet al., 2008). This huge number of online communities and the common properties of users withincommunities have led to a new paradigm of recommendation systems through OSNs, namelycommunity recommendation.
Community recommendation suggests particular items (e.g., movies, music, books) to a groupof users and aims to convince the users to adopt its recommended items; it will achieve betterperformance if more users are interested in the recommended items (i.e., higher recommendationprecision) (Gorla et al., 2013; Hu et al., 2014). Instead of targeting an individual user, commu-nity recommendation presents many advantages. First, as human beings are of a social nature,recommendation for users within a community is required in some cases (Hu et al., 2014), suchas recommending a tourist attraction to a group of friends to spend holiday, or advertising tocommunity forums in OSNs. Second, community recommendation may also be conductive to ad-dress new-user problem in recommendation systems by recommending the new users items basedon the interests of other users in the same community (Masthoff, 2011). Moreover, since recom-mending items to a community merely requires the community’s collective interest information butnot necessarily every user’s personal interests (Aimeur et al., 2006), community recommendationcan preserve privacy for the users who are unwilling to reveal personal information by certainapproaches such as obfuscating interests of users in a community (Parameswaran & Blough, 2007).
Concerning the potential benefits of community recommendation, much existing work puts ef-fort to devise sophisticated algorithms for selecting items that are probably preferred by most usersin a given community (Baltrunas et al., 2010; Gorla et al., 2013; Hu et al., 2014). However, recallthat there exist millions of communities with various natures in OSNs, whether a sophisticatedalgorithm can recommend satisfactory items to all the communities is in doubt. Intuitively, somecommunities in which users share many interests may be intrinsically appropriate for communityrecommendation to achieve high recommendation performance; while for some other communitiesconsisting of users with distinct interests (e.g., a Random-based community of people for a statisticsurvey), a community recommendation system with sophisticated algorithms may still hardly findany items that are preferred by most users in such a community. In order to avoid unduly runningsophisticated recommendation algorithms for the inappropriate communities, in this paper, we in-vestigate how to quickly select the appropriate communities in which community recommendationmay achieve high performance, from millions of communities in OSNs.
To address this issue, we rely on the principle that a community is more effective for recom-mendation if the members in the community present more common interests (Baltrunas et al.,2010); hence, we propose to measure the interest similarity among users in a community andthen select the communities of a large similarity degree as the appropriate ones for communityrecommendation.
Although the basic idea seems straightforward, it is non-trivial to be implemented. First,we need to measure interest similarity among multiple users in a community. Many similaritymeasurements (Spertus et al., 2005) have been proposed; whereas most of them focus on thesimilarity between two individuals rather than among multiple users. Second, the interest similaritymeasure should be efficient to compute, so that it can be fast enough to select the appropriatecommunities over a huge number of ones in real-life OSNs.
For our purposes, firstly, we define a metric — Community Similarity Degree (CSD) — tocompute the degree of similarity among the users in a community based on their common interests.The CSD value ranges from 0 when the users in a community do not share any interest, to 1 if all
2

the users present exactly the same interests.Subsequently, with 208K user profiles collected from Facebook, we conduct extensive empir-
ical studies to understand the properties of CSD by emulating four types of communities (i.e.,Friend-based, Interest-based, Location-based and Random-based communities). We observe thatCSD decreases with the increase of either the number of users or the number of interests. We alsonotice that the Interest-based communities which are formed by users having one common inter-est normally exhibit 1.45× to 4.5× larger CSD than the Friend- or Location-based communitieswhere users share one friend or come from the same city. As we exclude the common interest inan Interest-based community to calculate its CSD, this observation indicates that users with onecommon interest are likely to share more other interests than friends or people in the same city.
Finally, with a simulated community recommendation system, we validate the effectiveness andefficiency of CSD in community selection. We demonstrate that selecting the communities withlarge CSD can achieve good recommendation performance, i.e., high average recommendation pre-cision. We also compare different average precisions when the recommendation is respectivelyapplied to Interest-, Friend-, Location-, and Random-based communities. The experiment resultsconfirm that the Interest-based communities, which have larger CSD, gain 2× higher median av-erage precision when it compares to Friend-, Location-, Random-based communities. This resultfurther indicates that selecting communities with large CSD is effective to achieve good perfor-mance in community recommendation. Moreover, we verify the computation efficiency of CSD anddemonstrate that we can compute CSD for 1 million of communities within 41 minutes.
In summary, the main contributions of this paper are: (i) We define a metric called CSD toestimate interest similarity degree among multiple users within a community, while most of theexisting similarity metrics compute the similarity between two objects. (ii) We conduct extensiveempirical studies on a large real Facebook dataset and reveal CSD’s characteristics based on 3460emulated communities. (iii) We emulate a community recommendation system and demonstratethat CSD is an effective and efficient metric to select the appropriate communities for communityrecommendation. (iv) We give insights about feasible extensions to the definition of CSD andpresent practical uses of CSD in various applications besides community recommendation.
The rest of this paper is organized as follows. Section 2 reviews some related work. Section 3defines the metric of CSD. Section 4 introduces our dataset and the communities constructed basedon the dataset. We conduct empirical studies of CSD in Section 5. In Section 6, we emulate acommunity recommendation system and validate the effectiveness and efficiency of CSD. Finally,Section 7 concludes the paper.
2. Related Work
In this section, we briefly review the existing related work through two aspects: (i) recommen-dation systems; (ii) similarity metrics and the use of similarity in social applications.
2.1. Recommendation Systems
Recommendation systems are extremely promising for marketing in OSNs by providing userswith suggestions, such as what products to purchase, what movies to watch or what books toread (Ricci et al., 2011). Much work proposes various approaches (e.g., hierarchical Bayesianmodel (Purushotham et al., 2012), trust circle-based model (Yang et al., 2012), semantic similarity-based model (Dong et al., 2011)) to provide personalized recommendations to users. Such recom-mendation systems are normally classified into three categories according to the ways of recommen-
3

dation, including content-based, collaborative and hybrid recommendation approaches (Adomavi-cius & Tuzhilin, 2005). Most of these systems concentrate on recommendation for an individualuser (Deng et al., 2014); however, our work tends to improve community recommendation whichrecommends items for a group of users instead of an individual.
In recent years, some studies have proposed to select items for a community of users. Baltrunaset al. (2010) exploit a collaborative filtering algorithm to generate personalized recommendationsfor an individual user and then leverage a rank aggregation method to produce a joint rankinglist of recommendations for a community of users. Focusing on better modeling the users withina community, Gorla et al. (2013) design a probabilistic community recommendation method toimprove the aggregation of individuals’ recommendations. By considering the collective featuresthat may determine users’ choices within a community, Hu et al. (2014) propose a joint commu-nity recommendation model which accommodates both users’ individual interests and communitydecision. Various methods, including content-based, user-based and hybrid of content and user, forproducing recommendations for a community of users are examined and compared by Ronen et al.(2014). These sophisticated algorithms and models concentrate on how to select the items for agiven community of users, whereas it may work inefficiently if the users in a community do notshare many interests. To tackle this issue, in this paper, instead of designing a recommendationalgorithm, we attempt to find the communities that can achieve good performance in communityrecommendation.
With a similar research objective as our work, recently Basu Roy et al. (2015) study how to formcommunities so that most users in the formed communities are satisfied with the recommendations;while the difference between our work and Basu Roy et al. (2015) is still significant: rather thandesigning community formation algorithms to create new communities, we define an effective andefficient metric, CSD, to select the appropriate communities from a huge number of self-organizedcommunities that have already existed in real-life networks nowadays.
2.2. Similarity Metrics in OSNs
Evaluating similarity is a practical and fundamental problem with a long history, which servesin various research domains such as geographic information science (Schwering, 2008), biology (Leiet al., 2013), and decision-making (Tsebelis, 1995). In OSNs, a series of classical metrics, includ-ing overlap, cosine similarity, Jaccard similarity, Pearson correlation coefficient, etc., are employedto estimate the strength of user relationships, the similarity of users’ tastes/interests, and theresemblance of users’ background (Han et al., 2014, 2015; Sarwar et al., 2001). To recommendsocial events with holding a user’s home location, the location similarity is calculated by weightedcosine similarity taking into account the common events that users from both locations have at-tended (Quercia et al., 2010). Besides, Han et al. (2014) study similarity between two users byboth common friends and common interests and show that friends generally share more intereststhan strangers. Pearson correlation coefficient is rather popular in collaborative filtering recom-mendation systems as it subtracts the average rating score from each rating, thereby eliminatesthe individual subjective differences (Sarwar et al., 2001).
Semantic objects, such as comments, posts, answers to questions, descriptions or reviews aboutservices/products, and tags to photos, videos, music, are widespread over OSNs nowadays. Es-timating two users’ similarity by their semantic relatedness is a fundamental task, which can inturn support a great number of applications (e.g., recommendation system, information retrieval,and link prediction) (Markines & Menczer, 2009). Accordingly, similarity metrics, such as mutualinformation (Hindle, 1990), Lin’s descriptive similarity (Lin, 1998), and maximum information
4

path (Markines & Menczer, 2009), are proposed to capture the structural information betweensemantic objects.
Besides, a collection of global structural similarity metrics (e.g., Katz, PageRank) are proposedto capture the global topology information based on structural network. These metrics are widely-used to measure the similarity in link prediction, trust estimation, and community detection. Topredict the structure of social network without knowing any author-author relationships, Makrehchi(2011) constructs auxiliary networks based on author-topic and topic-topic relations and uses Katzmetric to calculate the closeness of either author-topic or topic-topic relations. Backstrom &Leskovec (2011) calculate PageRank score to predict and recommend links in a supervised way.Rossi et al. (2015) survey the existing graph-based and feature-based similarity methods for rolediscovery in networks, and propose a flexible framework for discovering roles using the notion ofsimilarity on a feature-based representation.
Recently, with the arrival of the big data era, a real-life network can grow up to billions of nodesand edges. Thus, improving the computation efficiency and scalability of similarity metrics beginsto attract much research interest. Kusumoto et al. (2014) propose a fast and scalable algorithm tocompute the top-k similar nodes for a given node in terms of the SimRank metric; while Tao et al.(2014) design an efficient algorithm to select the k most similar pairs of nodes with the largestSimRank similarities among all possible pairs. Zhang et al. (2015) use the idea of random path toquickly select the top-k similar nodes for a given node in a huge network and applies this methodin two applications — identity resolution and structural hole spanner finding. In our definition ofCSD, we also consider the computation efficiency so that we can use CSD for selecting appropriatecommunities for recommendation from millions of communities in a reasonable time period.
In summary, most of these state-of-the-art works focus on the metrics considering the similaritybetween two users, whereas this paper intends to compute the similarity among a community ofusers.
3. Community Similarity Degree
In this section, we define Community Similarity Degree (CSD) to measure the interest similarityamong users in a community. We start with some intuitive concepts about interest similarity of aset of users (or called community members). Then, we introduce some assumptions and criteriato formulate the similarity intuitions. Finally, we give the definition of the metric (CSD) to meetthe established criteria based on the assumption. During the metric definition, we note that: (1)if a user reports an interest we call the user a fan of the reported interest; (2) we aggregate all theusers’ interests and construct an interest set for a community. Each element in the interest set isa distinct interest.
Before defining the metric, we first clarify some intuitions of similarity among multiple users.The being defined similarity metric is expected to capture the following intuitions.
• Intuition 1: If all the community members exhibit exactly the same interests, their interestsimilarity reaches the highest value.
• Intuition 2: If any two members share no interest, the interest similarity of the communityshould be the lowest value.
• Intuition 3: Assume only one distinct interest is reported in a community with a certainnumber of users, then the more fans the distinct interest has (some users may report nointerest), the higher the interest similarity is.
5

• Intuition 4: Given a community with a certain number of members and distinct interests,the interest similarity of the community should be higher if there exist more fans for everysingle distinct interest (i.e., the sum of the fan number for each distinct interest is larger).
To formulate the intuitions and define the metric, we introduce some notations here. We marka given community as c = {Uc,Rc}, where Uc represents the users in the community and Rc standsfor the set of all the users’ interests (i.e., the distinct interest set in the community c). The numberof users and the number of distinct interests in the community are respectively denoted as Nu(c)and Nr(c). For each distinct interest r ∈ Rc, we count the number of its fans as its popularity,denoted as p(r); then, we can sum the number of fans for all the distinct interests as the weight ofthe community, i.e., W (c) =
∑r∈Rc
p(r).
Following the intuitions, we establish the following assumptions and criteria:
• Assumption: We assume the highest value of the being defined metric CSD is 1 while thelowest value equals 0.
• Criterion 1: When all the users in a community have exactly the same interests, i.e., all theusers are interested in each distinct interest in Rc, CSD is 1; i.e., CSD(c) = 1, iff: W (c) =∑r∈Rc
p(r) =∑
r∈Rc
Nu(c) = Nr(c)×Nu(c). (According to Intuition 1)
• Criterion 2: When any two members do not share any interest, i.e., each distinct interestonly has one fan, CSD is 0; i.e., CSD(c) = 0, iff: W (c) =
∑r∈Rc
p(r) =∑
r∈Rc
1 = Nr(c).
(According to Intuition 2)
• Criterion 3: Given two communities c1 and c2 with the same number of users (i.e., Nu(c1) =Nu(c2) = Nu) and the same number of distinct interests (i.e., Nr(c1) = Nr(c2) = Nr ), thenthe community presenting the larger weight has the larger CSD; i.e., 1 ≥ CSD (c1) > CSD(c2) ≥ 0, iff: Nr ×Nu ≥W (c1) > W (c2) ≥ Nr. (According to Intuition 3 and 4)
(a) (b) (a) (b)
Intuition 1: users in
the community share
the most interests (i.e.,
the highest CSD)
Intuition 2: users in the
community share the
least interests (i.e., the
lowest CSD)
Intuition 3: users in community (a) share more
interests than users in community (b), since
more users in (a) prefers the certain interest
than the users in (b) (i.e., CSD (a) > CSD (b))
Interest
Interested in
Intuition 4: extending intuition 3 to the cases
of multiple interests, users in community (a)
share more interests than users in community
(b) (i.e., CSD (a) > CSD (b))
Interests Interests
Interested in
Interests InterestInterests
Interested inInterested inInterested in
Interested in
Ua UaUaUa Ua UaUb Ub
UbUbUb
UbUc Uc Uc Uc Uc
Uc
r1r1
r2r1
r1r1 r1 r2r2 r2 r3r3
Figure 1: Examples of Intuitions and Criteria for CSD Definition.
An example is provided in Figure 1 to better illustrate the intuitions and criteria. Supposethat we have a community with three users ua, ub and uc. If all these users report that they areinterested in r1, r2 and r3, then their interests are exactly the same and the interest similarity ofthis community should be the highest (Intuition 1/Criterion 1). Whereas, if ua prefers r1, ublikes r2 and uc favors r3, then there is no common interest among ua, ub and uc. In this case, theinterest similarity of the community is the lowest (Intuition 2/Criterion 2). Assume r1 is theonly reported interest by the community members. The community interest similarity of the case
6

that three users all prefer r1 is higher than another case that ua and ub are interested in r1 but ucdoes not claim any preference (Intuition 3/Criterion 3). On the basis of Intuition 3 where onlyone interest is considered, we can extend the case to multiple interests. Specifically, compared to acommunity where all the three users ua, ub and uc like interests r1 and r2, another community inwhich ua and uc prefer r1 meanwhile ub and uc favor r2 presents lower interest similarity (Intuition4/Criterion 3).
Definition: Based on the assumption, while meeting the aforementioned criteria, we defineCSD as:
CSD(c) =W (c)−Nr(c)
Nu(c)×Nr(c)−Nr(c)=
W (c)/Nr(c)− 1
Nu(c)− 1(1)
where W (c)/Nr(c) calculates the average popularity of interests in community c. Therefore, inother words, CSD assesses the interest similarity of users in a community approximately by theratio between the average popularity of interests (W (c)/Nr(c)) and the total number of communitymembers (Nu(c)). We note that the value of CSD ranges from 0 to 1.
In addition, CSD is an easy-to-compute metric. The computation complexity of CSD is O(N),where N denotes the number of users in a community, because we only need to enumerate all theusers’ interests once to calculate CSD. Comparatively, if we estimate the community interest sim-ilarity by computing the conventional pairwise interest similarity (e.g., cosine similarity) betweenany two users and then averaging all the pairwise similarities, the complexity would be O(N2) asthe total number of user pairs in a community is N(N − 1)/2.
4. Data and Community Description
In this section, we briefly introduce our dataset and its collection procedure. We also describefour different types of communities created with our collected dataset.
4.1. Data Description
In order to validate our proposed metric, we have developed a web crawler to collect users’information from Facebook. Given one root user, the crawler then follows the Breadth-First Search(BFS) approach (Gjoka et al., 2011) to go through the user’s friends and friends of friends (i.e.,two-hop friends). For each user/friend, the crawler captures the user profile which includes theuser’s demographic information (e.g., birthday, gender, home town) and interests in terms of fivewell-defined categories (i.e., television, books, music, movies and games) (Han et al., 2015). Notethat we respect the users’ privacy by collecting only their public information and anonymizing theuser IDs.
To count, the collected Facebook dataset contains 208, 634 users and 542, 597 distinct interestsfrom the above-mentioned five categories. In our dataset, the users present 11 interests on average;and 12% of the users only report one single interest, while 5% of them include more than 100interests. Furthermore, the users in our dataset are from more than 150 countries and 9K cities;meanwhile there exists a wide variability in the number of users’ friends, which ranges from dozensto 5K. Finally, we note that most of the collected distinct interests show a small popularity (85%of the distinct interests have fewer than 10 fans). However, we still find more than 10K and 1Kdistinct interests with more than 100 and 1K fans respectively; the top 100 interests are shared bymore than 8K users.
7

0 200 400 600 800 10000
0.01
0.02
0.03
0.04
0.05
0.06
0.07
0.08
0.09
Community Size
%
Figure 2: Community size distribution for the four analyzed community types.
4.2. Community Description
In order to investigate the characteristics of CSD and evaluate its effectiveness and efficiency incommunity selection for recommendation, we construct four different types of communities usingour collected Facebook dataset: Friend-based, Random-based, Interest-based and Location-basedcommunities. Next we describe how each type of community is generated.
4.2.1. Friend-based Communities
A Friend-based community is formed by a user and all her friends with at least one interest.Creating these communities was straightforward due to the BFS technique employed by our crawler.Our dataset allowed us to define 865 Friend-based communities. It is worth mentioning that Friend-based communities are typically used for recommendation purposes in OSNs (Chen et al., 2009).For instance, when a Facebook user starts utilizing an application, her friends may receive anotification indicating that fact. This notification/recommendation is based on the belief that twofriends likely have similar tastes.
Finally, as we will see later, the community size (i.e., the number of users) has a direct impact onthe CSD value for the communities under study. Therefore, in order to perform a fair comparison,the remaining community types replicate the community size distribution of Friend-based commu-nities. Figure 2 shows the distribution for the size of the 865 Friend-based communities (that isthe same for the other community types). Note that the rightmost bin in the figure represents allthe communities whose size is larger than 1000.
4.2.2. Random-based Communities
We create 865 Random-based communities. As mentioned before, we decide the size of eachRandom-based community according to the size distribution of Friend-based communities. For aRandom-based community of size N , we select N random users from our dataset to create thecommunity.
4.2.3. Interest-based Communities
An Interest-based community is formed by a set of users who all present one common interest(e.g., users who are interested in a same movie). Note that each user will typically have some otherinterests in addition to the common one. Similarly, we generate 865 Interest-based communitiesby following the same size distribution of Friend-based communities. Given a size of N users to
8
generate an Interest-based community, we find the list of all those interests whose popularity is N(i.e., N users present that interest in their profile) and randomly select one interest to constructthe community with all its fans.
4.2.4. Location-based Communities
A Location-based community is formed by all the users showing the same Current City at-tribute. As Facebook allows users freely to input any text in their profile attributes, a city can bemarked by several diverse notations (e.g., New York, New York City, NY, NYC, etc. all indicatethe same city). Therefore, we use Yahoo PlaceFinder API 2 to unify all the different notations fora city and obtain 9K unique cities. Accordingly, the users in a same unique city are grouped intoa community. We then select 865 Location-based communities with the same size distribution asthe other three types of communities.
5. Empirical studies on CSD
In this section, we carry out extensive empirical studies on CSD. We first study how CSDvaries with number of users (Nu(c)), number of interests (Nr(c)) and community weight (W (c))respectively. Then we compare the distributions of CSD by the four community types. We furtherlook into CSD of Interest-based communities by different interest categories in the end.
5.1. CSD characterization
As we have seen in Section 3, CSD is a metric varying with the community weight, the numberof users (i.e., community size) and the number of interests. Here we study how each of these factorswould influence CSD. We conduct the investigations separately on four types of communities andobtain the similar conclusions. For the sake of brevity, we only show the results of Friend-basedcommunities as a representative.
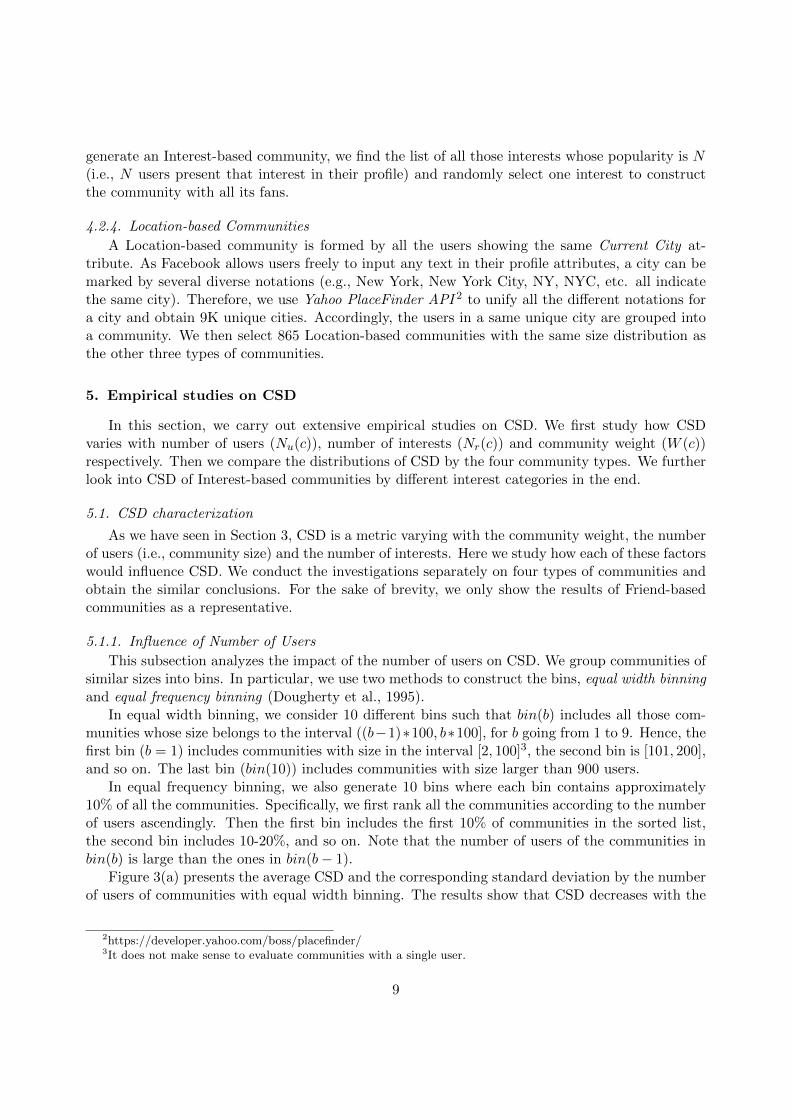
5.1.1. Influence of Number of Users
This subsection analyzes the impact of the number of users on CSD. We group communities ofsimilar sizes into bins. In particular, we use two methods to construct the bins, equal width binningand equal frequency binning (Dougherty et al., 1995).
In equal width binning, we consider 10 different bins such that bin(b) includes all those com-munities whose size belongs to the interval ((b−1)∗100, b∗100], for b going from 1 to 9. Hence, thefirst bin (b = 1) includes communities with size in the interval [2, 100]3, the second bin is [101, 200],and so on. The last bin (bin(10)) includes communities with size larger than 900 users.
In equal frequency binning, we also generate 10 bins where each bin contains approximately10% of all the communities. Specifically, we first rank all the communities according to the numberof users ascendingly. Then the first bin includes the first 10% of communities in the sorted list,the second bin includes 10-20%, and so on. Note that the number of users of the communities inbin(b) is large than the ones in bin(b− 1).
Figure 3(a) presents the average CSD and the corresponding standard deviation by the numberof users of communities with equal width binning. The results show that CSD decreases with the
2https://developer.yahoo.com/boss/placefinder/3It does not make sense to evaluate communities with a single user.
9

bin(1) bin(2) bin(3) bin(4) bin(5) bin(6) bin(7) bin(8) bin(9) bin(10)0
0.002
0.004
0.006
0.008
0.01
0.012
Com
mun
ity S
imila
rity
Deg
ree
(CSD
)
The Number of Users
(a) Equal width binning
bin(1) bin(2) bin(3) bin(4) bin(5) bin(6) bin(7) bin(8) bin(9) bin(10)0
0.002
0.004
0.006
0.008
0.01
0.012
0.014
Com
mun
ity S
imila
rity
Deg
ree
(CSD
)
The Number of Users
(b) Equal frequency binning
Figure 3: CSD vs. community size. In 3(a), the size of communities in bin(b) (b ∈ [2, 9]) belongs to((b− 1) ∗ 100, b ∗ 100]; Particularly, the communities in bin(1) have a size belonging to [2, 100] while the sizeof communities in bin(10) is larger than 900; In 3(b), each bin contains the same number of communitiesand the size of communities in bin(b) is larger than bin(b− 1).
increase of the community size. The major drop appears between the two first bins where theaverage CSD in bin(1) doubles bin(2); while the drop gets stable as the community size increases.Figure 3(b), with equal frequency binning, shows the similar trend. This is an expected resultsince larger communities present more users (by definition), and then generally contain a largernumber of interests. In particular, for the 865 Friend-based communities, we have found (by usinga linear regression model) that the number of available interests in a community is roughly 12×the size of the community. Therefore, bigger communities typically bring a larger diversity of bothusers and interests, which intuitively leads to a lower similarity degree (CSD). Although there is anobvious drop trend, a community with a larger size does not necessarily achieve a lower CSD andsmall communities also probably have a very low CSD. This is demonstrated by the large standarddeviation of CSD, especially for the bins of smaller sizes (e.g., bin(1)).
5.1.2. Influence of Number of Interests
We now analyze how the number of interests in the community impacts CSD. We repeatthe methodology used in the previous subsection and group communities with similar number ofinterests in 10 different bins. With equal width binning, bin(b) includes those communities witha number of interests within the interval ((b − 1) ∗ 1000, b ∗ 1000] for values of b ranging from 1to 9, while the last bin (b = 10) includes those communities with more than 9000 interests. Withequal frequency binning, the bin(1) includes the first 10% of communities in the ranking list sortedascendingly by the number of interests, the bin(2) includes 10-20%, and so on.
Figure 4(a) plots the average CSD with its standard deviation by the number of interests withequal width binning. Not like the steady drop of CSD by community size, the figure presentsa decreasing trend of CSD with micro-fluctuations by the number of interests. For instance, itshows a slight but obvious increase of average CSD of communities when the number of interestsin communities grows from (2K, 3K] to (3K, 4K]. The change of standard deviation in the figureindicates that the variability of CSD gets smaller with the increase of the number of interests.According to Figure 4(b) with equal frequency binning, we can also find a similar non-steady droptrend of CSD as the number of interests increases.
The observed behavior can be explained since, in the case of the interests there are two im-portant aspects to consider. On one hand, a higher number of interests lead to a higher diversity,
10

bin(1) bin(2) bin(3) bin(4) bin(5) bin(6) bin(7) bin(8) bin(9) bin(10)0
0.002
0.004
0.006
0.008
0.01
0.012
Com
mun
ity S
imila
rity
Deg
ree
(CSD
)
The Number of Interests
(a) Equal width binning
bin(1) bin(2) bin(3) bin(4) bin(5) bin(6) bin(7) bin(8) bin(9) bin(10)−2
0
2
4
6
8
10
12x 10
−3
Com
mun
ity S
imila
rity
Degr
ee (C
SD)
The Number of Interests
(b) Equal frequency binning
Figure 4: CSD vs. the number of interests. In 4(a), the number of interests of communities in bin(b)(b ∈ [1, 9]) belongs to ((b− 1) ∗ 1000, b ∗ 1000]; while the communities in bin(10) have interests larger than9000; In 4(b), each bin contains the same number of communities and the number of interests of communitiesin bin(b) is larger than bin(b− 1).
which tends to reduce the CSD. This factor is responsible for the general reduction trend. On theother hand, with the increase of the number of interests, the total popularity of all the interestswithin the community (i.e., community weight) would probably increase as well, which may pro-duce the flat or increasing evolution of CSD between some bins4. We further explore the factor ofcommunity weight in the next subsection.
5.1.3. Influence of Community Weight
In this subsection, we discuss the impact that the community weight has on the CSD. We usedthe same technique as in the previous subsections. With equal width binning, we have 10 bins sothat bin(b) includes those communities having a weight within the interval ((b− 1) ∗ 2000, b ∗ 2000]with b ranging from 1 to 9. The last bin (b = 10) includes all the communities with a weightlarger than 18000. With equal frequency binning, we sort all the communities ascendingly by theircommunity weights and then group them into 10 bins, each of which includes approximately 10%of all the communities.
It is worth noting that, in the definition of CSD, community weight (W (c)) plays a differentrole from the number of users (Nu(c)) and the number of interests (Nr(c)). Recall that CSD is
defined as: W (c)/Nr(c)−1Nu(c)−1 . Thus, by definition, W (c) is positively correlated with CSD, while both
Nu(c) and Nr(c) are negatively correlated with CSD. This means that the increase of W (c) mayindicate the increase of CSD, instead of the drop. Now let us see whether this trend can happenin real-life communities.
Actually, against the above intuition, from both Figure 5(a) and 5(b), we can hardly find theincreasing trend of CSD as the community weight increases. However, we notice that Figure 5(a)and 5(b) are quite similar to Figure 4(a) and 4(b), respectively. The possible explanation for thehigh similarity between these figures is that community weight W (c) and the number of interestsNr(c) are highly correlated in real-life communities. To verify whether such high correlation exists,we calculate the Pearson correlation coefficient between W (c) and Nr(c). Based on the 865 Friend-
4In the definition of CSD, community weight W (c) is in the numerator part; thus the increase of W (c) makes CSDbecome larger, assume the other two factors (number of users Nu(c) and number of interests Nr(c)) keep unchanged.
11

bin(1) bin(2) bin(3) bin(4) bin(5) bin(6) bin(7) bin(8) bin(9) bin(10)0
1
2
3
4
5
6
7
8
9x 10
−3
Com
mun
ity S
imila
rity
Degr
ee (C
SD)
Community Weight
(a) Equal width binning
bin(1) bin(2) bin(3) bin(4) bin(5) bin(6) bin(7) bin(8) bin(9) bin(10)−2
0
2
4
6
8
10
12x 10
−3
Com
mun
ity S
imila
rity
Degr
ee (C
SD)
Community Weight
(b) Equal frequency binning
Figure 5: CSD vs. community weight. In 5(a), the weight of communities in bin(b) (b ∈ [1, 9]) belongs to((b− 1) ∗ 2000, b ∗ 2000]; while the communities in bin(10) have a weight larger than 18000; In 5(b), each bincontains the same number of communities and the weight of communities in bin(b) is larger than bin(b− 1).
based communities, the result coefficient is 0.938, which verifies the high correlation of W (c) andNr(c) actually exists in real-life communities.
To conclude, the number of users in a community is the most sensitive factor related to thechange of CSD. To some extent, it meets the intuition that the users easily share interests if thecommunity size is small and the users are tight-knit; while it is hard to find a large number ofusers with the same preferences. The other two factors, the number of interests Nr(c) and thecommunity weight W (c), are highly correlated in real-life communities but have opposite effectson CSD. Therefore, in reality, the change of CSD with the increase of Nr(c) is similar to that withthe increase of W (c); however, the change does not follow a steady trend.
5.2. CSD by Different Types of Communities
Figure 6 plots the CDF of the CSD across the 865 communities within each community type. Itshows that the CSD values5 of real-life communities are rather small, compared to the maximumpossible value 1 in its definition. In addition, the observation demonstrates that Interest-basedcommunities present the largest CSD among all the four types of communities. Particularly, themedian value of CSD for Interest-based communities is 3×, 2.5× and 2× larger than Random-based,Friend-based and Location-based communities, respectively. In a word, the results indicate that theabsolute degree of interest sharing among real-life community members is generally low, whereasthe comparative differences of CSD between different communities are still relatively obvious. Inaddition, it is worth noting that in order to make a fair comparison, when computing the CSD foran Interest-based community, we have excluded the common interest, which was used to build upthe community, from the distinct interest set Rc.
In addition, we study CSD of four types of communities by the community size, shown in Figure7. We group the communities of similar sizes using the following bins: [2,100], [101,200], [201,300],..., [>900]. We observe that the Interest-based communities can achieve 1.45× to 4.5× CSDcompared to Friend/Location-based communities, while 2.5× to 7× CSD compared to Random-based communities, with respect to different community sizes.
5Note that respectively 100%, 100%, 100% and 92% of the Friend-based, Random-based, Location-based andInterest-based communities have the CSD less than 0.03. The highest CSD we have found among all the analyzedcommunities is 0.3. For the sake of clarity, Figure 6 shows the CDF for CSD values only up to 0.03.
12

0 0.005 0.01 0.015 0.02 0.025 0.030
0.1
0.2
0.3
0.4
0.5
0.6
0.7
0.8
0.9
1
Community Similarity Degree (CSD)
CD
F
Friend−basedRandom−basedInterest−basedLocation−based
Figure 6: CDF of CSD for Friend-based, Random-based, Location-based and Interest-based communities.
In summary, these observations suggest that users with one common interest (Interest-basedcommunities) are likely to share more other interests than friends or people from the same city(Friend/Location-based communities). Recall that our objective of proposing CSD is to selectappropriate communities for recommendation, thus we expect that Interest-based communities(with higher CSD) would achieve better recommendation performance than the other types ofcommunities. Note that this expectation will be evaluated later in Section 6.2.2.
0
0.005
0.01
0.015
0.02
0.025
0.03
CSD
Inte
rest
−bas
ed im
prov
emen
t
Community Size
[2−1
00]
[101
−200
]
[201
−300
]
[301
−400
]
[401
−500
]
[501
−600
]
[601
−700
]
[701
−800
]
[801
−900
]
[>90
0]
Friend−basedRandom−basedInterest−basedLocation−based
Figure 7: CSD of Interest-based, Friend-based, Location-based and Random-based communities by commu-nity sizes.
5.3. CSD by Different Interest Categories
So far, we have created Interest-based communities without paying attention to the used interestcategory. In this subsection, we study CSD of Interest-based communities according to differentcategories (i.e., television, books, music, movies, and games) of the interests that are used to createthe communities. For this study, we have created 1000 communities for each category followingthe uniform distribution of the community size ranging from 2 to 500 users.
Figure 8(a) shows the CDF of the CSD for different interest categories. The most importantobservation is that all the categories follow very similar CSD distributions. The only noticeableissue is that music shows a slightly higher CSD than the remaining categories for high CSD values(which likely belong to small communities).
13

0 0.005 0.01 0.015 0.02 0.025 0.030
0.1
0.2
0.3
0.4
0.5
0.6
0.7
0.8
0.9
1
Community Similarity Degree (CSD)
CD
F
televisionbooksmusicmoviesgames
(a) CDF of CSD
[2−100] [101−200] [201−300] [301−400] [401−500]0
0.002
0.004
0.006
0.008
0.01
0.012
0.014
0.016
0.018
0.02
Com
mun
ity S
imila
rity
Deg
ree
(CSD
)
Community Size
televisionbooksmusicmoviesgames
(b) CSD by community size
Figure 8: CSD comparison among Interest-based communities by different interest categories.
Figure 8(b) shows the average CSD of different interest categories by the following communitysize bins: [2,100], [101,200], ..., [401,500]. The figure demonstrates that, for small communitieswith fewer than 200 users, music is the interest category showing the highest CSD in Facebook(and significantly higher than the other categories). The rest communities present very similarresults for the first two bins. For the communities with more than 200 members, all the categories,including music, show similar behaviors.
5.4. Discussion of Observations
We observe that a majority of the emulated communities gain a very small value of CSD6. Thesmall value of CSD of a community indicates that the members often share few interests. We alsoobserve that the CSD of a community is perhaps smaller if it contains more users and interests(Figure 3 and Figure 4). Communities in OSNs usually present different characters with dozens,hundreds or thousands of users who report various interests, thus CSD of these communities maybe either relatively small or large. As conducting community recommendation to the communitiesin which the members share fewer interests is unreasonable or costly, it is necessary to select thecommunities where users have relatively more common interests (i.e., with relatively larger CSD)to improve recommendation performance, especially when a huge number of communities exist. Tosum up, these observations reveal the requirement of community selection approach for communityrecommendation in OSNs and support our original intention of proposing CSD.
6. Use Case: CSD for Community Recommendation
In this section, we validate the effectiveness and efficiency of the newly proposed CSD met-ric. Concerning the effectiveness, we tend to evaluate that CSD can be used to select appropriatecommunities which may achieve high precision in community recommendation. Specifically, weemulate a community recommendation system with our Facebook dataset and leverage an existingcommunity recommendation approach (Baltrunas et al., 2010) to recommend items for each com-munity; we then sort the communities by their CSD values and expect that the communities withlarger CSD can achieve higher recommendation precision. For the efficiency, we will evaluate thecomputation time of CSD for a community.
6the CSD of 98% of the communities is smaller than 0.03 whereas the defined maximum value is 1
14

Next, we will first briefly introduce the exploited community recommendation approach andthe metric for evaluation; then, we report the evaluation results.
6.1. Recommendation Approach and Metric
We implement a community recommendation system based on the idea of rank aggregation andcollaborative filtering (Baltrunas et al., 2010). This approach contains two steps: first, it computesa recommendation ranking list for each individual user in the community; then, it aggregates allthe users’ individual recommendation ranking lists via certain pre-defined heuristics and generatesan aggregated recommendation ranking list for the community.
To generate the individual recommendation ranking list for a user, we first apply the item-based top-n recommendation algorithm (Deshpande & Karypis, 2004) to determine the itemsthat are recommended to each user. Specifically, we compute the relevance between any two itemsri and rj following the intuition: if more users like both items ri and rj , the relevance of ri andrj is higher. Then, for each user, we generate an individual recommendation ranking list based onthe item relevance and Borda count aggregation method (Coppersmith et al., 2010). Brieflyspeaking, the user’s individual list includes the items that have high relevance with her interesteditems marked in her profile. Afterwards, we still use the Borda count aggregation method to mergeall the users’ individual lists and get an aggregated recommendation ranking list for the community.Finally, we recommend the top K items from the aggregated list to all the community members.
Referring to the existing community recommendation work (Hu et al., 2014; Gorla et al., 2013),we exploit Average Precision to evaluate the recommendation performance for each communityand compare Mean Average Precision over a set of selected communities to evaluate the effec-tiveness of CSD. Specifically, given a community Uc and an aggregated recommendation rankinglist, assume that we recommend the top K items to a user u ∈ Uc, we define the precision at rankposition K for u as:
P@K(u) =relK(u)
K(2)
where relK(u) is the number of items that u likes among the top K recommendations. Then, foreach community, we can calculate the Average Precision by:
AP@K(c) =1
|Uc|∑u∈Uc
P@K(u) =1
|Uc|∑u∈Uc
relK(u)
K(3)
Finally, we define the Mean Average Precision for a given set C′ of communities as:
MAP@K =1
|C′|∑c∈C′
AP@K(c) =1
|C′|∑c∈C′
1
|Uc|∑u∈Uc
relK(u)
K(4)
Note that we only use precision, but not recall, as the evaluation metric due to the follow-ing reason. In community selection for recommendation, intuitively we do not want to select thecommunities whose members only have few interested items (e.g., in movie recommendation, acommunity where the users generally dislike watching movies is absolutely not a good recommen-dation target). However, in the definition of recall, the denominator is the number of a user’sinterested items; thus, if a community has many users who have few interests, to some extent, itwould be an advantage to get high recall, which contradicts the intuition. Therefore, recall is notan appropriate metric to evaluate the performance of community selection for recommendation.
15

Communities TC[1−100] TC[101−200] TC[201−400] All BC[201−400] BC[101−200] BC[1−100]
Average CSD 0.052 0.012 0.009 0.005 0.0013 0.0011 0.0007
MAP@3 0.112 0.089 0.083 0.047 0.022 0.018 0.014
MAP@5 0.110 0.086 0.079 0.045 0.02 0.019 0.014
MAP@10 0.100 0.086 0.078 0.048 0.023 0.021 0.017
Table 1: MAP@K by CSD
6.2. Evaluation
We verify the effectiveness and efficiency of CSD in three experiments. (1) In the first exper-iment, we use CSD to select a set of communities and evaluate if the communities with largerCSD can generally gain better recommendation performance. (2) In Section 5.2, we have shownthat Interest-based communities normally obtain larger CSD compared to the other types of com-munities; thus, in the second experiment, we investigate whether Interest-based communities canachieve higher recommendation precision. The second experiment evaluates the effectiveness ofCSD in community selection from a different perspective compared to the first one. (3) In the lastexperiment, we study the computation time of CSD to reveal its efficiency for community selection.
6.2.1. Community Recommendation by CSD
Taking into account all the communities we introduced in Section 4.2, we respectively recom-mend top 3, 5 and 10 items to each community and compute the corresponding AP@K. Addi-tionally, we generate a CSD ranking list by sorting all the communities based on their CSD indescending order. Then, we collect the successive communities in the CSD ranking list into variouscommunity sets and compare MAP@K of these community sets to examine whether recommendingitems to the communities with larger CSD can achieve higher precision.
We use TC[n1−n2] to represent the community set where the communities are in the top positionsfrom n1 to n2 in the CSD ranking list; we use BC[n1−n2] to represent the n1 to n2 communitiesselected from the bottom of the CSD ranking list. Then, we expect that the community sets in-cluding the communities in the front of the CSD ranking list would achieve better recommendationperformance (i.e., higher MAP@K) than the sets containing the communities in the back. Table 1compares MAP@K among different sets of communities and verifies this expectation. Specifically,we observe that the community sets TC[1−100], TC[101−200], and TC[201−400] gain 7×, 3.5× and 3×larger MAP@K than the community sets BC[1−100], BC[101−200], and BC[201−400].
In addition, Figure 9 displays MAP@K of top N communities. The results show that theMAP@K declines with the increase of N . Note that, as N increases, more communities withsmaller CSD are taken into account; thus, the average CSD of the top N communities decreases.In other words, Figure 9 indicates that when the average CSD of a community set decreases, theprecision of recommendation for the set of communities also reduces.
Figure 10 plots CDF of AP@K of various community sets with different CSD. If we take themedian (i.e., 0.5 in y-axis ‘Percentage of Communities’) AP@3 as an example, the results showthat, selecting communities from the top 200 communities (TC[1−200]) can achieve 1.5× largerAP@3 than random selection, and 5.7× larger AP@3 than selecting communities from the bottom200 communities (BC[1−200]).
In a nutshell, all the above experiment results demonstrate that selecting the communities with
16

0 1000 2000 30000
0.05
0.1
0.15
Top N communities
MA
P@
K
0 1000 2000 30000
0.02
0.04
0.06
Ave
rage
CSD
K=3K=5K=10CSD
Figure 9: MAP@K of the top N communities in the CSD ranking list.
0 0.05 0.1 0.15 0.2 0.25 0.3 0.35 0.40
0.1
0.2
0.3
0.4
0.5
0.6
0.7
0.8
0.9
1
AP@3
Per
cen
tage
of
Com
mu
nit
ies
(%)
TC[1−200]
TC[201−400]
AllB
C[201−400]
BC[1−200]
(a) K=3
0 0.05 0.1 0.15 0.2 0.25 0.3 0.35 0.40
0.1
0.2
0.3
0.4
0.5
0.6
0.7
0.8
0.9
1
AP@5
Per
cen
tage
of
Com
mu
nit
ies
(%)
TC[1−200]
TC[201−400]
AllB
C[201−400]
BC[1−200]
(b) K=5
0 0.05 0.1 0.15 0.2 0.25 0.3 0.35 0.40
0.1
0.2
0.3
0.4
0.5
0.6
0.7
0.8
0.9
1
AP@10
Per
cen
tage
of
Com
mu
nit
ies
(%)
TC[1−200]
TC[201−400]
AllB
C[201−400]
BC[1−200]
(c) K=10
Figure 10: CDF of AP@K by CSD.
larger CSD can facilitate community recommendation with better performance. In other words,CSD can be used to select the appropriate communities to achieve higher precision in communityrecommendation.
6.2.2. Recommendation by Different Types of Communities
In this section, we evaluate the recommendation performance for various types of communi-ties (Friend-based, Interest-based, Location-based and Random-based). As we have shown thatInterest-based communities generally exhibit the largest CSD, we expect that the Interest-basedcommunities can also achieve the highest MAP@K in community recommendation.
Table 2 and Figure 11 validate our expectation. Table 2 indicates that Interest-based commu-nity can produce about 2× MAP@K compared to the other three types of communities. Figure11 plots CDF of AP@K for different types of communities. We observe the similar results that themedian AP@K of Friend-based, Location-based and Random-based communities are all around2× smaller than Interest-based communities. In addition, we notice that, although friendshipsare widely used to improve recommendation performance in much existing work (Purushothamet al., 2012; Yang et al., 2012), Friend-based communities do not perform as well as Interest-basedcommunities. It may be because a user makes friends in various ways such as colleagues, familiesand classmates who do not necessarily share common interests with the user.
17

0 0.1 0.2 0.3 0.40
0.2
0.4
0.6
0.8
1
AP@3
Per
cen
tag
e o
f C
om
mu
nit
ies
(%)
Interest−basedFriend−basedLocation−basedRandom−based
(a) K=3
0 0.1 0.2 0.3 0.40
0.2
0.4
0.6
0.8
1
AP@5P
erce
nta
ge
of
Co
mm
un
itie
s (%
)
Interest−basedFriend−basedLocation−basedRandom−based
(b) K=5
0 0.1 0.2 0.3 0.40
0.2
0.4
0.6
0.8
1
AP@10
Per
cen
tag
e o
f C
om
mu
nit
ies
(%)
Interest−basedFriend−basedLocation−basedRandom−based
(c) K=10
Figure 11: CDF of AP@K by different types of communities.
Communities Interest Friend Location Random
Average CSD 0.0108 0.0036 0.0036 0.025
MAP@3 0.090 0.035 0.033 0.030
MAP@5 0.085 0.034 0.031 0.029
MAP@10 0.085 0.043 0.033 0.030
Table 2: MAP@K by different types of communities.
In summary, when only considering the community type, the results demonstrate that Interest-based communities are normally the best option for community recommendation. As the CSD ofInterest-based communities is the highest among all four types (Section 5.2), these results also verifythe effectiveness of CSD, i.e., the communities of higher CSD can achieve better recommendationperformance.
6.2.3. Computation Time of CSD
In order to evaluate the efficiency of CSD for community selection, we record the time ofcomputing CSD for all the four types of communities in our study (totally 3460 communities). Byusing an ordinary laptop (CPU: Intel Core i5-2540M 2.60 GHz; Memory: 6 GB; OS: Windows 7,64-bit) and Python 2.7, the average computation time of CSD is 2.46 ms per community. Accordingto this average speed, we can compute CSD for 1 million of communities within 41 minutes. Inaddition, Figure 12 shows the computation time versus the community size and the number ofinterests in a community, respectively. With regard to the linear regression models of computationtime, it costs less than 10 ms on average to compute CSD for a community with 1500 users orwith 20000 interests.
7. Conclusions
Community is fundamental and ubiquitous in various networks. For instance, biological func-tional communities build up and maintain metabolic networks; while social networks consist ofgroups of friends as well as various common location, interests and occupation based communities.So far, most network community studies have focused the effort on the techniques of detecting
18

0 500 1000 1500 20000
5
10
15
20
25
The Number of Users
Tim
e (m
s)
y = 0.006618x−0.1354
(a) Community size
0 0.5 1 1.5 2x 10
4
0
5
10
15
20
25
The Number of Interests
Tim
e (m
s)
y = 0.000564x−0.5783
(b) Number of interests
Figure 12: Computation time of CSD.
communities so as to facilitate certain applications; whereas, a huge number of self-organized com-munities have been present in Internet and real-life networks nowadays. In such circumstances,rather than detecting communities, evaluating the present communities and selecting the ones thatcan meet the specific requirements of applications are preferable. Specifically, this paper discussesthe community selection for the application of community recommendation. To the best of ourknowledge, this is the first work to discuss the research issue of quickly selecting the appropriatecommunities among a vast number of candidates in OSNs to improve community recommendation.
Taking users’ interests in community recommendation as an instance, we have defined a metricof CSD to evaluate the interest similarity among users in a community. CSD indeed quantifies theinner connection density of community members by their common interests. In order to quicklyestimate the interest similarity, we do not iteratively compute the similarities between all the user-pairs by using the conventional approaches (e.g., cosine similarity, Jaccard similarity or Pearsoncorrelation coefficient) and then average the value. Instead, inspired by Lin’s information-theoreticdefinition of similarity (Lin, 1998), we provide a formal definition of interest similarity amongmultiple users within a community. Specifically, the formulated metric CSD quickly divides theaverage popularity of interests by the total number of the community members.
In practice, apart from being used to improve community recommendation, CSD can servevarious applications. Considering a sever deployment task in a content delivery network (CDN)which aims at selecting the best locations to deploy some new servers, we can first group the CDNusers who live around a candidate location into a location-based community; Then, CSD can beemployed to identify the best locations by selecting the best location-based communities in whichthe CDN users share the most similar interests.
According to different application requirements, the definition of CSD can be easily modifiedand extended. First, although CSD is originally defined for interest similarity estimation based onthe community consisting of a set of users (Uc) and a set of interests (Rc), the interests of userscan be replaced by other attributes. For instance, when it comes to a collaboration network, theset of users and the set of interests are replaced by a group of scientists and a set of collaboratedpublications/projects, respectively. Then CSD turns to assess the inner connection density ofscientists inside a community by their collaborations. Second, given a certain attribute (e.g.,collaboration, interest), CSD could be easily extended to a weighted CSD where a weight foreach attribute instance needs to be considered in some specific applications. For instance, in a
19

collaboration network, larger weights can be put to more recent collaborations if we are concernedabout the scientists’ current collaboration status. To define the weighted CSD, only the popularityof each distinct attribute instance needs to be modified. In particular, for each distinct attributeinstance, its popularity equals the product of the number of its fans and its weight.
Furthermore, CSD can be applied as a feature to help make intelligent decision (e.g., a featurein a machine learning algorithm). In a project examination and approval procedure, the qualityof proposal, the strength of partners and the cooperation success degree of historical project maybe all the determinants to select the qualified consortiums. Substituting interests and users in acommunity with historical projects and partners in a consortium respectively, CSD computes innerconnection density of partners in terms of the degree of successful project cooperation. CSD thencould work as a feature to select the qualified project applications.
Despite the above-mentioned efficiency in computation and effectiveness for various applica-tions, in order to enhance CSD for more real-life applications, some issues still need study in thefuture.
First, the current definition of CSD has not considered the relatedness between different inter-ests. For instance, the users who like Harry Potter and the Philosopher’s Stone and the ones whoare interested in Harry Potter and the Chamber of Secrets must have similarity in their interests;while CSD regards the two interests completely different and fails to consider their relatedness.Many approaches (e.g., cosine similarity, explicit semantic analysis, or latent semantic analysis)may be taken to compute CSD with consideration of the relatedness of different interests, whileusing these approaches may increase the computation complexity of CSD in turn. This opens aresearch issue for our future work — how to balance the computation complexity and the precisionof interest similarity in real-life scenarios.
Second, CSD has not taken into account the popularity distribution of the interests inside acommunity. Let us look at two communities which both include 10 users and 2 interests. Inthe first community, 9 among the 10 users like the first interest and the rest user is a fan of thesecond interest; in the second one, half of the users like the first interest while the other half like thesecond interest. CSD assesses the interest similarity of both communities with the same value, eventhough the two communities have distinct interest popularity distributions that indicate differentinner connection structures. At present, we believe it is a quite sophisticated task to ravel whichone of the two communities has higher interest similarity among its users. Probably this willdepend on the specific application that CSD is used to facilitate. We will start exploring this issuewith some specific applications in the future work.
Acknowledgment
This work has been funded by China Scholarship Council and the project SITAC (ITEA2-11020). It has also been partially funded by the Ministerio de Economia y Competitividad ofSPAIN through the project BigDatAAM (FIS2013-47532-C3-3-P) and the Program of NationalNatural Science Foundation of China (No. 41404025).
References
Adomavicius, G., & Tuzhilin, A. (2005). Toward the next generation of recommender systems: A survey of thestate-of-the-art and possible extensions. IEEE Transactions on Knowledge and Data Engineering , 17 , 734–749.
Aimeur, E., Brassard, G., Fernandez, J. M., & Onana, F. (2006). Privacy-preserving demographic filtering. InProceedings of the 2006 ACM symposium on Applied computing (pp. 872–878). ACM.
20

Backstrom, L., & Leskovec, J. (2011). Supervised random walks: predicting and recommending links in socialnetworks. In WSDM (pp. 635–644). ACM.
Baltrunas, L., Makcinskas, T., & Ricci, F. (2010). Group recommendations with rank aggregation and collaborativefiltering. In Proceedings of ACM RecSys (pp. 119–126). Barcelona, Spain: ACM.
Basu Roy, S., Lakshmanan, L. V., & Liu, R. (2015). From group recommendations to group formation. In Proceedingsof the 2015 ACM SIGMOD International Conference on Management of Data (pp. 1603–1616). ACM.
Chen, J., Geyer, W., Dugan, C., Muller, M., & Guy, I. (2009). Make new friends, but keep the old: recommendingpeople on social networking sites. In Proceedings of ACM CHI (pp. 201–210). Boston, MA, USA: ACM.
Chen, W.-Y., Zhang, D., & Chang, E. Y. (2008). Combinational collaborative filtering for personalized communityrecommendation. In Proceedings of ACM SIGKDD (pp. 115–123). Las Vegas, Nevada, USA: ACM.
Coppersmith, D., Fleischer, L. K., & Rurda, A. (2010). Ordering by weighted number of wins gives a good rankingfor weighted tournaments. ACM Trans. Algorithms, 6 , 55:1–55:13.
Deng, S., Huang, L., & Xu, G. (2014). Social network-based service recommendation with trust enhancement. ExpertSystems with Applications, 41 , 8075–8084.
Deshpande, M., & Karypis, G. (2004). Item-based top-n recommendation algorithms. ACM Transactions on Infor-mation Systems, 22 , 143–177.
Dong, H., Hussain, F. K., & Chang, E. (2011). A service concept recommendation system for enhancing thedependability of semantic service matchmakers in the service ecosystem environment. Journal of Network andComputer Applications, 34 , 619–631.
Dougherty, J., Kohavi, R., Sahami, M. et al. (1995). Supervised and unsupervised discretization of continuousfeatures. In Machine learning: proceedings of the twelfth international conference (pp. 194–202). volume 12.
Gjoka, M., Kurant, M., Butts, C., & Markopoulou, A. (2011). Practical recommendations on crawling online socialnetworks. JSAC , 29 , 1872–1892.
Gorla, J., Lathia, N., Robertson, S., & Wang, J. (2013). Probabilistic group recommendation via informationmatching. In Proceedings of WWW (pp. 495–504). Rio de Janeiro, Brazil: ACM.
Han, X., Cuevas, A., Crespi, N., Cuevas, R., & Huang, X. (2014). On exploiting social relationship and personalbackground for content discovery in p2p networks. Future Generation Computer Systems, 40 , 17 – 29.
Han, X., Wang, L., Crespi, N., Park, S., & Cuevas, A. (2015). Alike people, alike interests? inferring interestsimilarity in online social networks. Decision Support Systems, 69 , 92–106.
Hindle, D. (1990). Noun classification from predicate-argument structures. In 28th Annual Meeting on Associationfor Computational Linguistics (pp. 268–275). Association for Computational Linguistics.
Hu, L., Cao, J., Xu, G., Cao, L., Gu, Z., & Cao, W. (2014). Deep modeling of group preferences for group-basedrecommendation. In Twenty-Eighth AAAI Conference on Artificial Intelligence (pp. 1861–1867). Pittsburgh,Pennsylvania, USA: AAAI.
Kusumoto, M., Maehara, T., & Kawarabayashi, K.-i. (2014). Scalable similarity search for simrank. In Proceedingsof the 2014 ACM SIGMOD international conference on Management of data (pp. 325–336). ACM.
Lei, J.-B., Yin, J.-B., & Shen, H.-B. (2013). Gfo: a data driven approach for optimizing the gaussian function basedsimilarity metric in computational biology. Neurocomputing , 99 , 307–315.
Lin, D. (1998). An information-theoretic definition of similarity. In 15th ICML (pp. 296–304). Morgan KaufmannPublishers Inc.
Makrehchi, M. (2011). Social link recommendation by learning hidden topics. In Fifth RecSys (pp. 189–196). ACM.Markines, B., & Menczer, F. (2009). A scalable, collaborative similarity measure for social annotation systems. In
20th HyperText HT ’09 (pp. 347–348). ACM.Masthoff, J. (2011). Group recommender systems: Combining individual models. In Recommender Systems Handbook
(pp. 677–702). Springer.Parameswaran, R., & Blough, D. M. (2007). Privacy preserving collaborative filtering using data obfuscation. In
IEEE International Conference on Granular Computing (pp. 380–380). IEEE.Purushotham, S., Liu, Y., & Kuo, C. (2012). Collaborative topic regression with social matrix factorization for
recommendation systems. In Proceedings of ICML (pp. 759–766). Edinburgh, Scotland: Omnipress.Quercia, D., Lathia, N., Calabrese, F., Di Lorenzo, G., & Crowcroft, J. (2010). Recommending social events from
mobile phone location data. In 2010 ICDM (pp. 971–976). IEEE Computer Society.Ricci, F., Rokach, L., & Shapira, B. (2011). Introduction to recommender systems handbook. In Recommender
Systems Handbook (pp. 1–35). Springer US.Ronen, I., Guy, I., Kravi, E., & Barnea, M. (2014). Recommending social media content to community owners. In
Proceedings of ACM SIGIR (pp. 243–252). Queensland, Australia: ACM.Rossi, R., Ahmed, N. K. et al. (2015). Role discovery in networks. IEEE Transactions on Knowledge and Data
21

Engineering , 27 , 1112–1131.Sarwar, B., Karypis, G., Konstan, J., & Riedl, J. (2001). Item-based collaborative filtering recommendation algo-
rithms. In 10th WWW (pp. 285–295). ACM.Schwering, A. (2008). Approaches to semantic similarity measurement for geo-spatial data: A survey. Transactions
in GIS , 12 , 5–29.Spertus, E., Sahami, M., & Buyukkokten, O. (2005). Evaluating similarity measures: a large-scale study in the orkut
social network. In Proceedings of ACM SIGKDD (pp. 678–684). Chicago, Illinois, USA: ACM.Tao, W., Yu, M., & Li, G. (2014). Efficient top-k simrank-based similarity join. Proceedings of the VLDB Endowment ,
8 , 317–328.Tsebelis, G. (1995). Decision making in political systems: Veto players in presidentialism, parliamentarism, multi-
cameralism and multipartyism. British journal of political science, 25 , 289–325.Yang, X., Steck, H., & Liu, Y. (2012). Circle-based recommendation in online social networks. In Proceedings of
ACM SIGKDD (pp. 1267–1275). Beijing, China: ACM.Zhang, J., Tang, J., Ma, C., Tong, H., Jing, Y., & Li, J. (2015). Panther: Fast top-k similarity search on large
networks. In Proceedings of the 21th ACM SIGKDD International Conference on Knowledge Discovery and DataMining (pp. 1445–1454). ACM.
22