CSCO
17
CISCO SYSTEM INC NASDAQ: CSCO
-
Upload
thomas-hoang-huy -
Category
Documents
-
view
36 -
download
0
Transcript of CSCO
CISCO SYSTEM INC
NASDAQ: CSCO
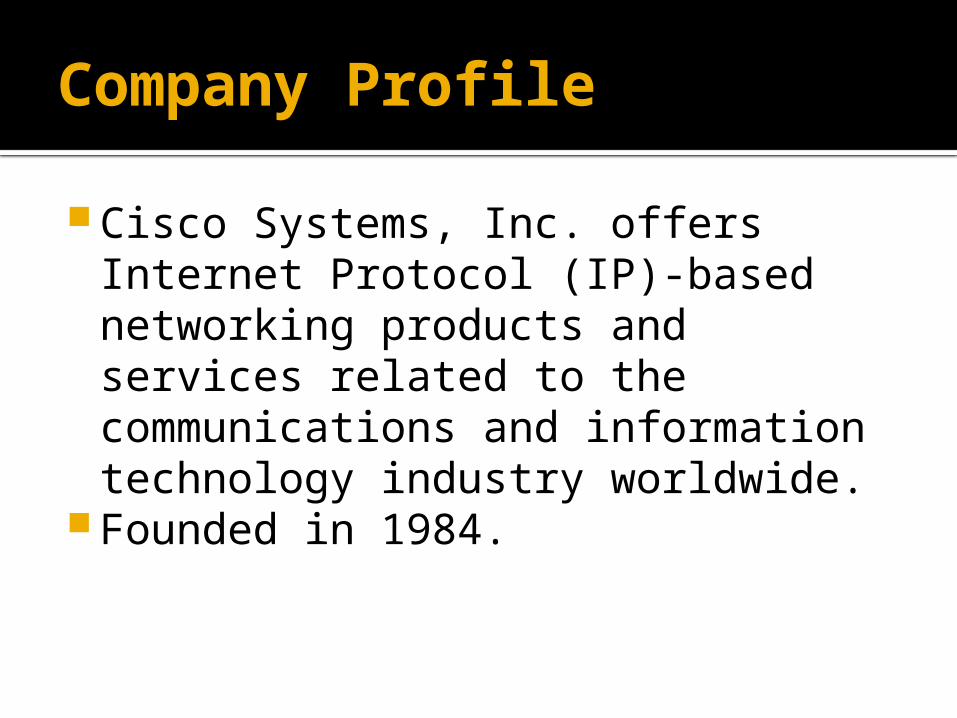
Company Profile
Cisco Systems, Inc. offers Internet Protocol (IP)-based networking products and services related to the communications and information technology industry worldwide.
Founded in 1984.
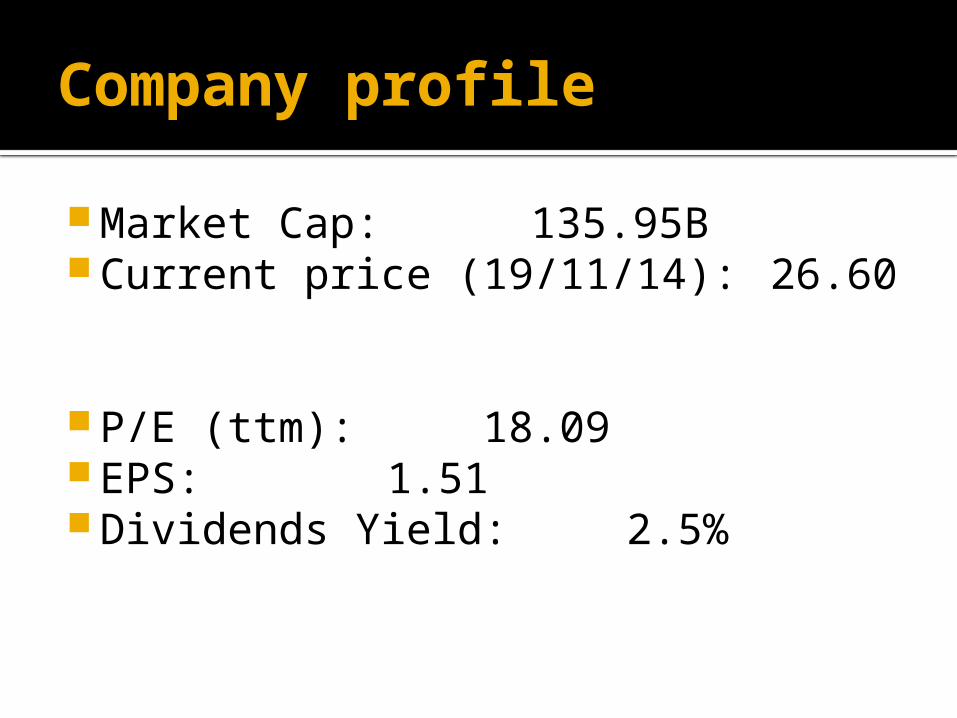
Company profile
Market Cap: 135.95B Current price (19/11/14): 26.60
P/E (ttm): 18.09 EPS: 1.51 Dividends Yield: 2.5%
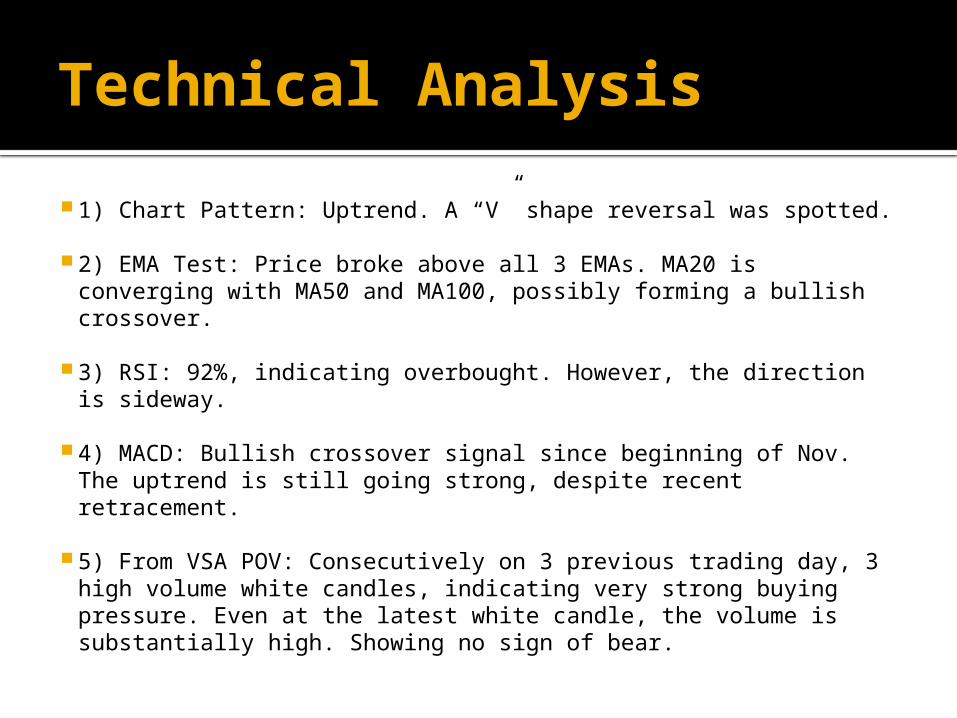
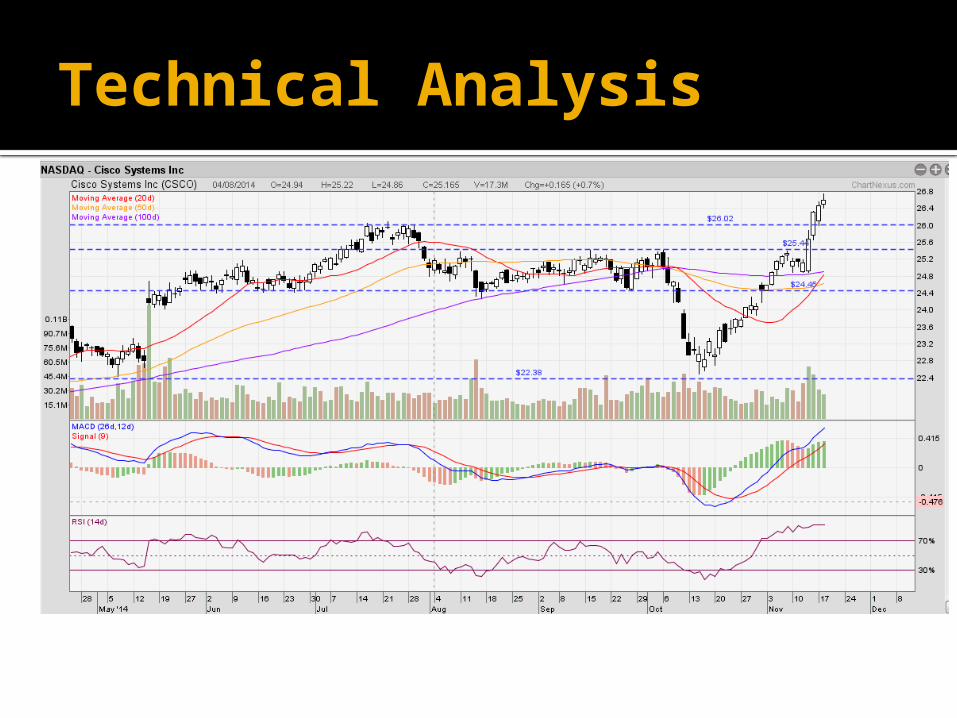
Technical Analysis
1) Chart Pattern: Uptrend. A “V” shape reversal was spotted.
2) EMA Test: Price broke above all 3 EMAs. MA20 is converging with MA50 and MA100, possibly forming a bullish crossover.
3) RSI: 92%, indicating overbought. However, the direction is sideway.
4) MACD: Bullish crossover signal since beginning of Nov. The uptrend is still going strong, despite recent retracement.
5) From VSA POV: Consecutively on 3 previous trading day, 3 high volume white candles, indicating very strong buying pressure. Even at the latest white candle, the volume is substantially high. Showing no sign of bear.
Technical Analysis
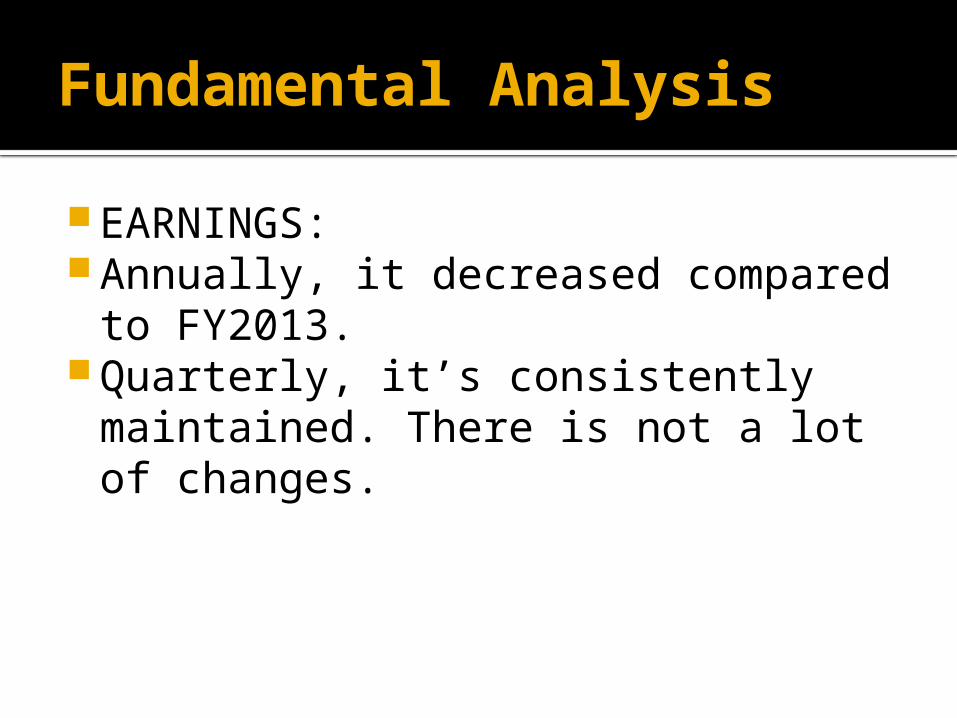
Fundamental Analysis
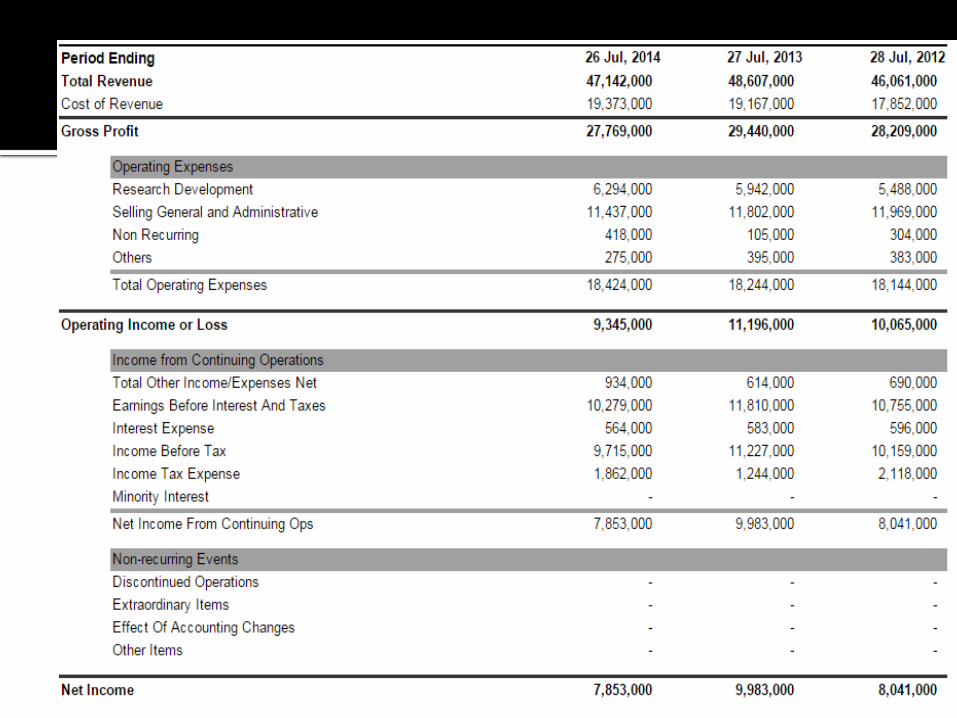
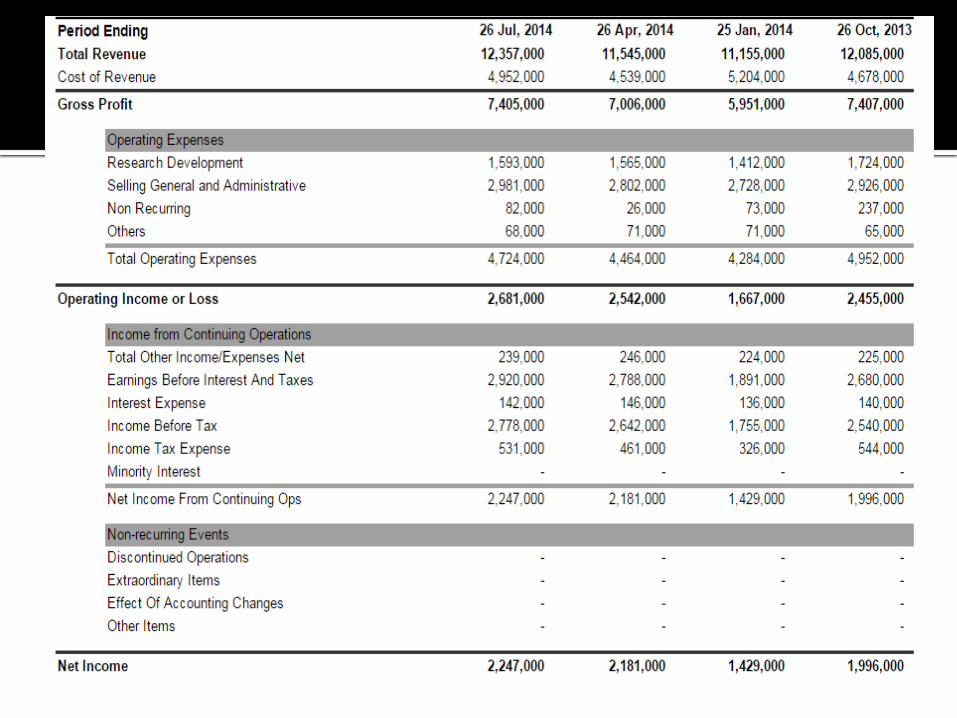
EARNINGS: Annually, it decreased compared to
FY2013. Quarterly, it’s consistently
maintained. There is not a lot of changes.
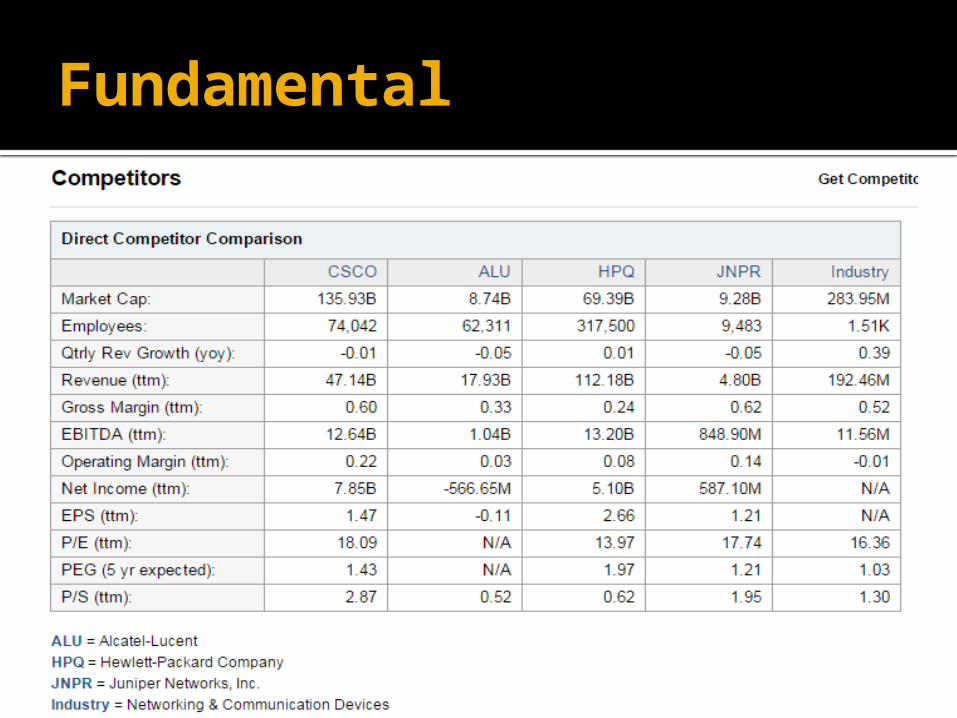
Fundamental
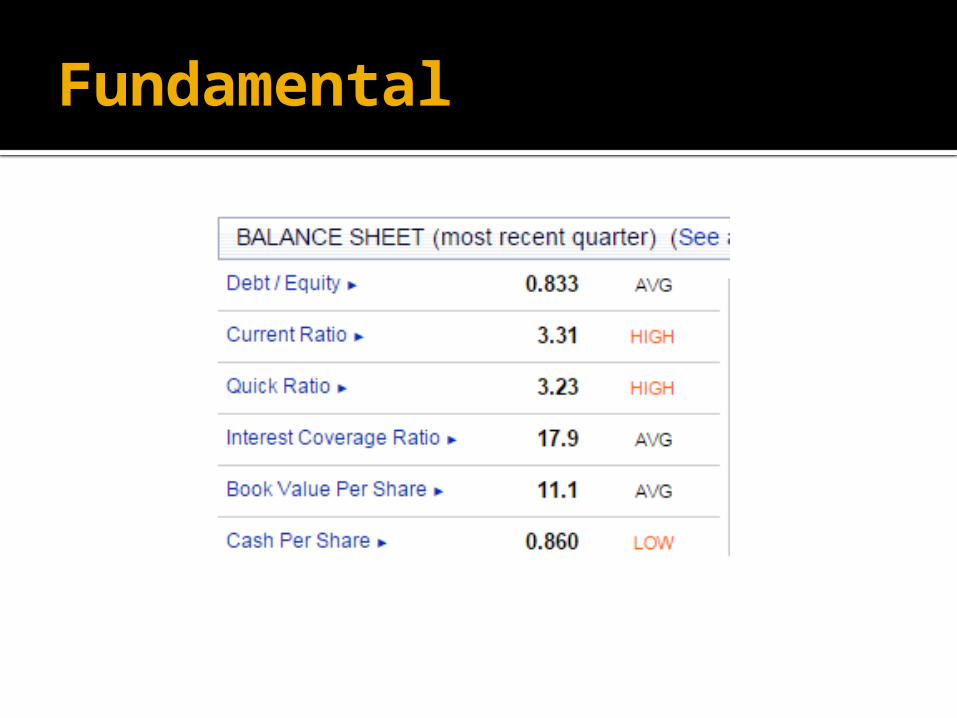
Fundamental
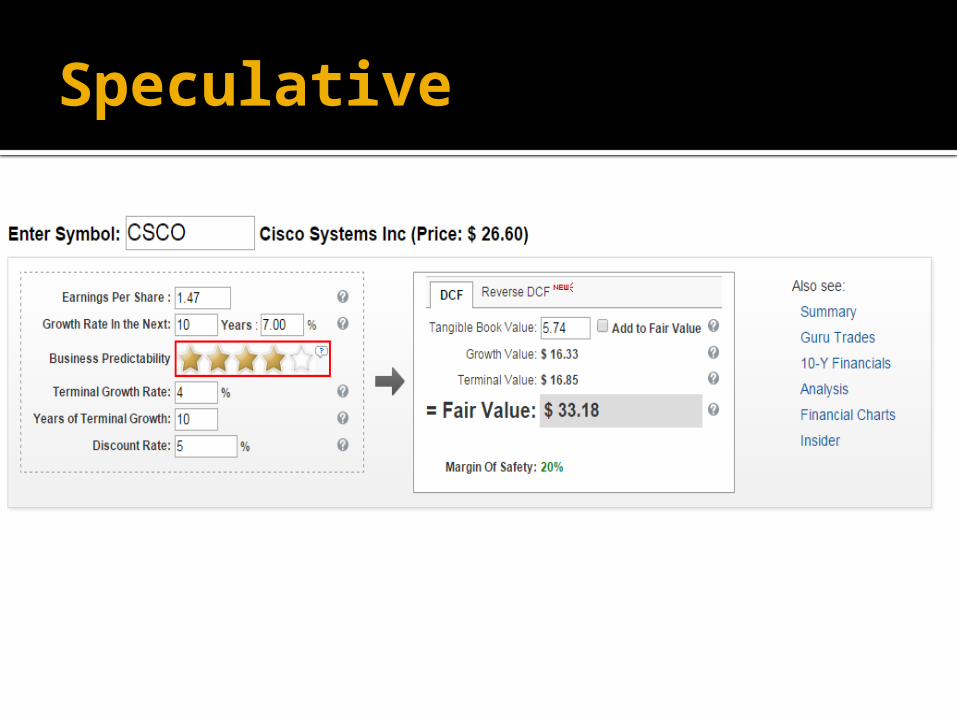
Speculative
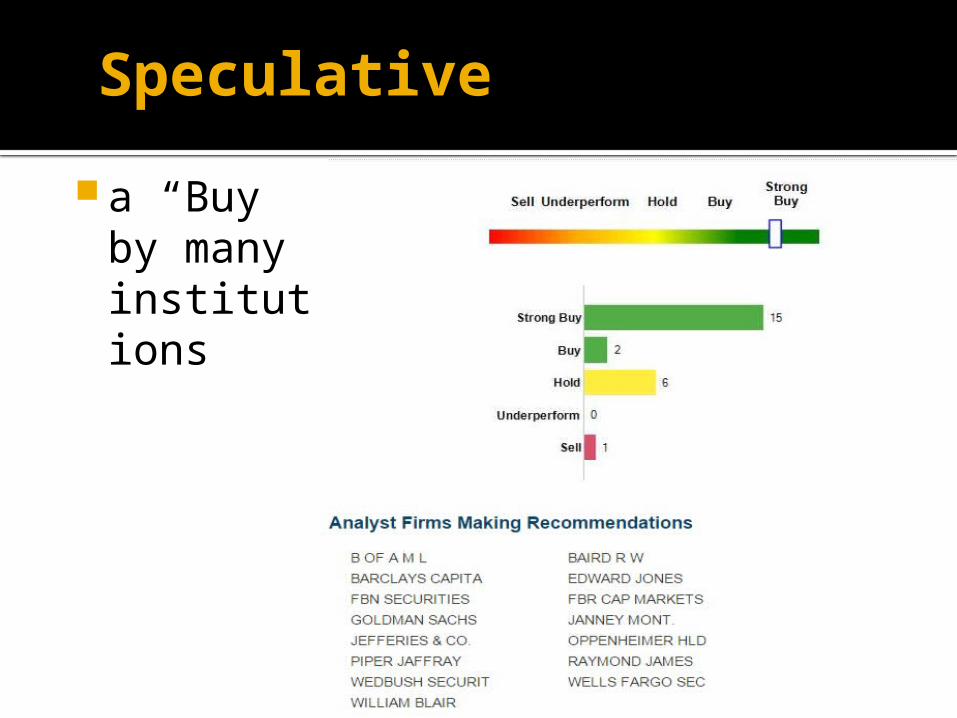
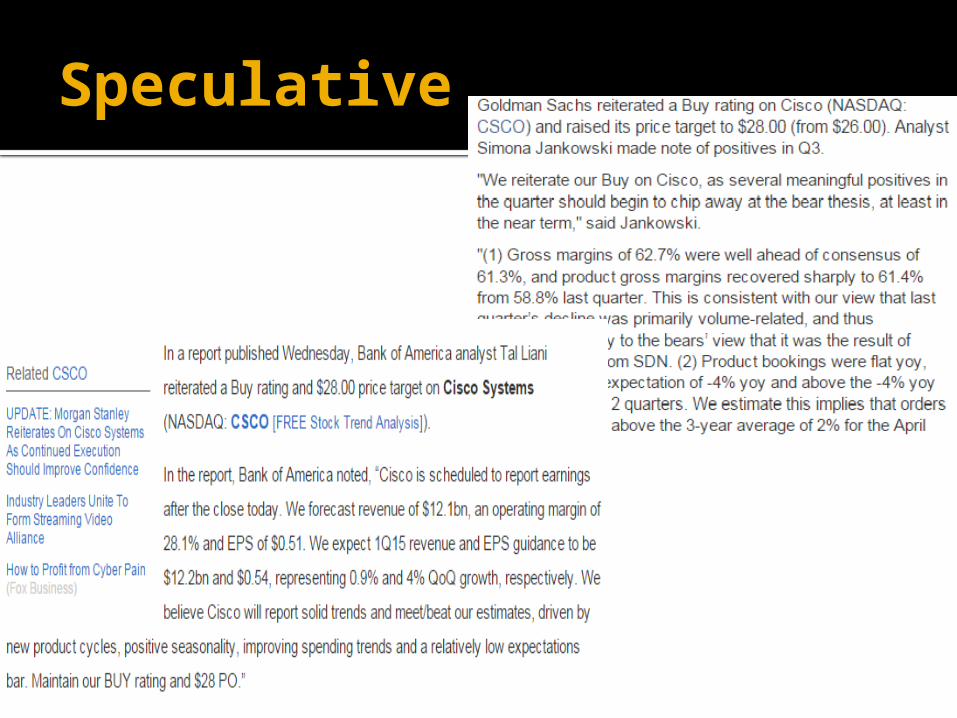
a “Buy” by many institutions
Speculative
Speculative
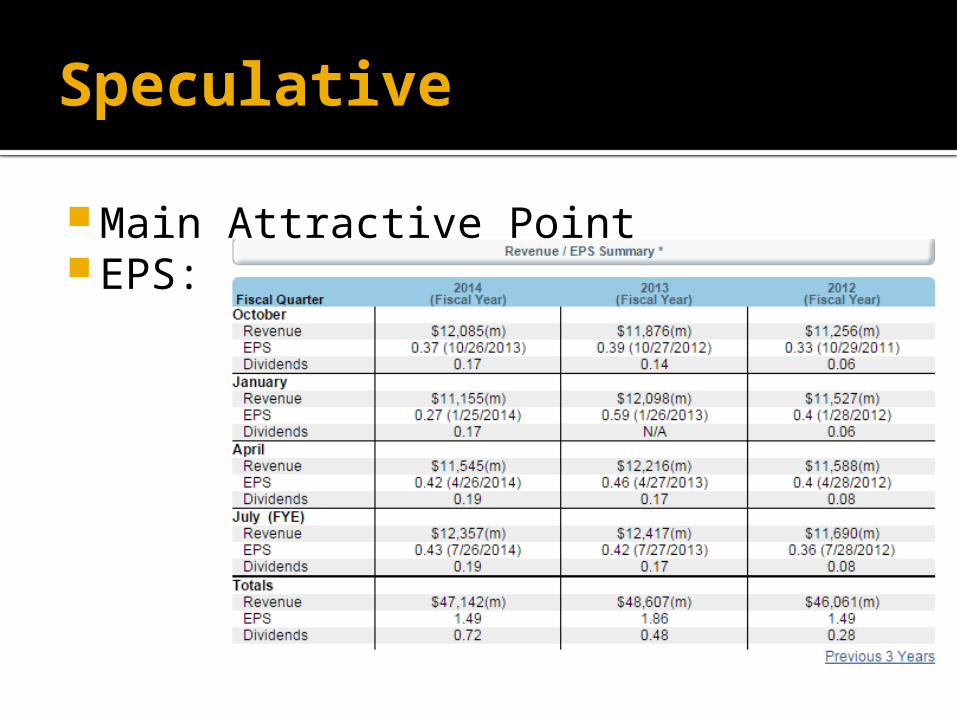
Main Attractive Point EPS:
Speculative
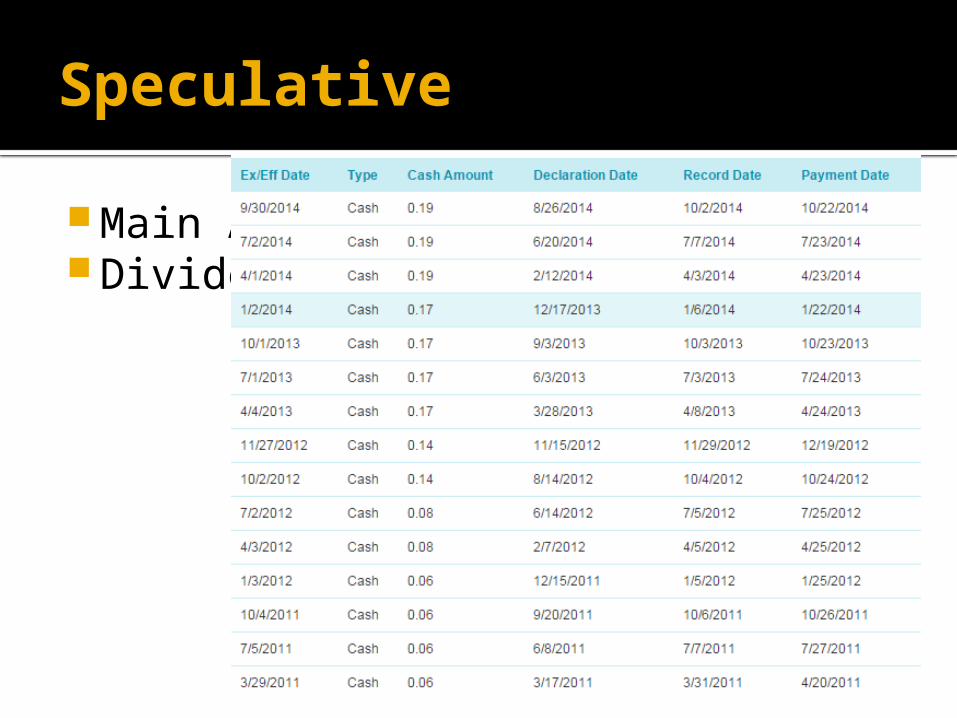
Main Attractive Point Dividends.
Speculative
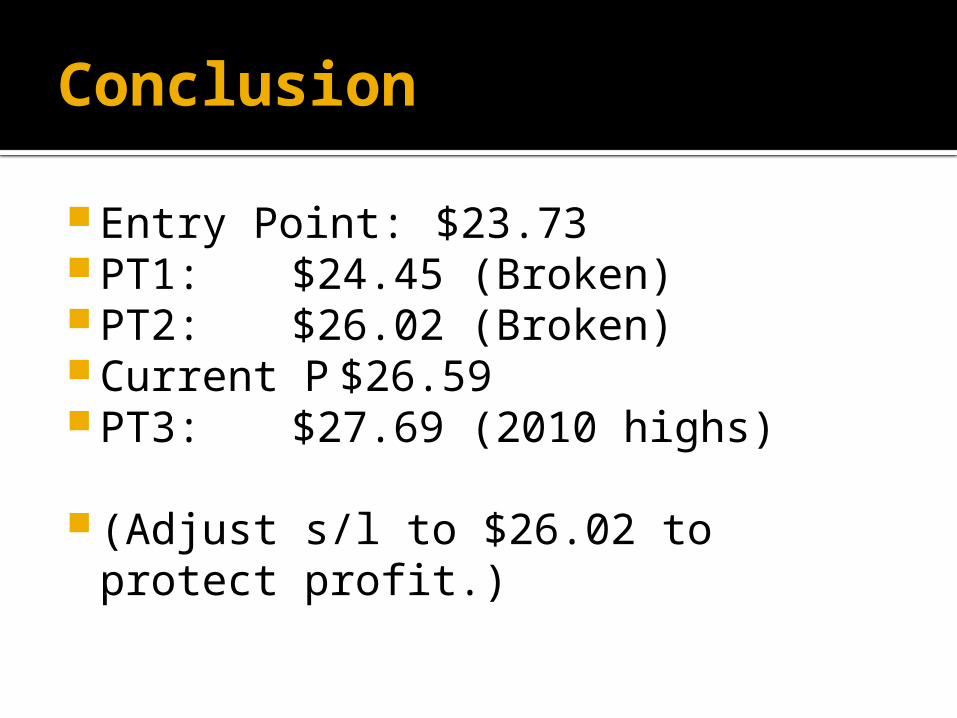
Conclusion
Entry Point: $23.73 PT1: $24.45 (Broken) PT2: $26.02 (Broken) Current P $26.59 PT3: $27.69 (2010 highs)
(Adjust s/l to $26.02 to protect profit.)
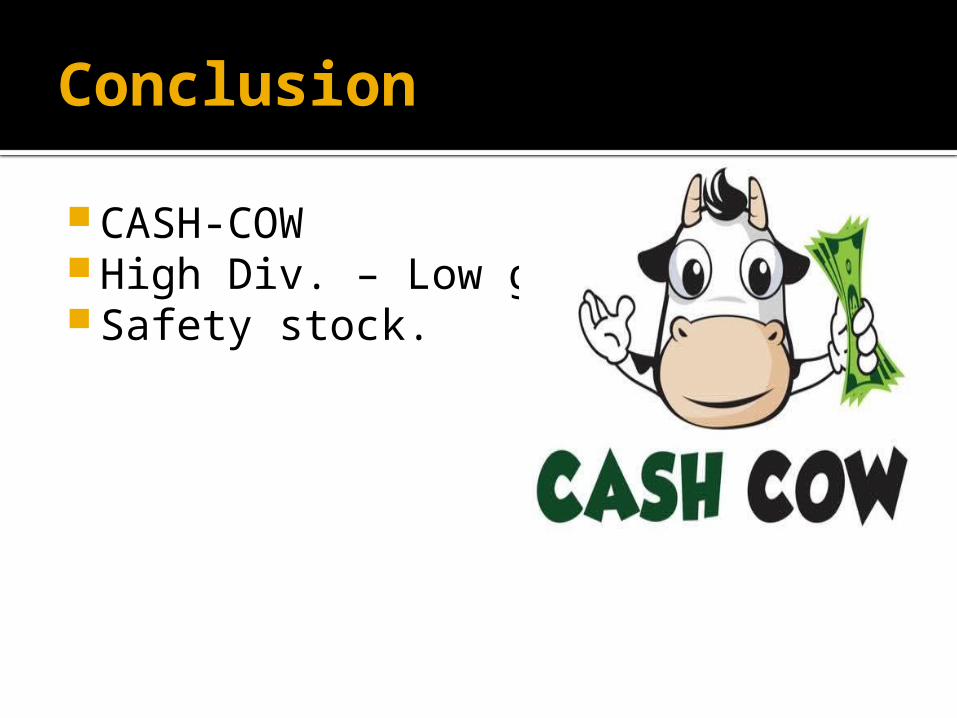
Conclusion
CASH-COW High Div. – Low growth Safety stock.