CSA Incident-based Collection - Homepage - Crime ... · Web view256.6 1.8% Public order and...
24
CSA Incident-based Collection Public Consultation Paper Produced by the Crime Statistics Agency August 2017
-
Upload
phungxuyen -
Category
Documents
-
view
217 -
download
1
Transcript of CSA Incident-based Collection - Homepage - Crime ... · Web view256.6 1.8% Public order and...

CSA Incident-based CollectionPublic Consultation Paper
Produced by the Crime Statistics Agency
August 2017
Unless indicated otherwise, content in this publication is provided under a Creative Commons Attribution 3.0 Australia Licence. To view a copy of this licence, visit creativecommons.org/licenses/by/3.0/au. It is a condition of the Creative Commons Attribution 3.0 Licence that you must give credit to the original author who is the State of Victoria.
If you would like to receive this publication in an accessible format, such as large print or audio, please telephone Crime Statistics Agency on 03 8684 1808 or email [email protected].
For further information or additional copies, please contact:Crime Statistics Agency
121 Exhibition Street, Melbourne, VIC 3000
Tel 03 8684 1808
Contents1.1 About the Crime Statistics Agency.................................................................................................2
1.2 Current Victorian Recorded Crime Statistics..................................................................................2
1.3 A New Measure of Crime in Victoria................................................................................................2
1.4 About this Consultation Paper........................................................................................................2
2.1 Developing the Incident-based Collection.......................................................................................3
2.2 Advantages of incident-based statistics.........................................................................................3
More accurate information about crime trends............................................................................................................3
Increased comparability across states.........................................................................................................................4
No loss of service.........................................................................................................................................................4
Providing Access to More Information.........................................................................................................................4
3 The Criminal Incident - Definition, scope and counting rules.............................................................4
Definition......................................................................................................................................................................4
Scope............................................................................................................................................................................4
Counting rules..............................................................................................................................................................5
Scenarios......................................................................................................................................................................6
Example 1.............................................................................................................................6
Example 2.............................................................................................................................6
4 Additional Enhancements..................................................................................................................7
Introduction of criminal charge information.................................................................................................................7
Improved location information.....................................................................................................................................7
Additional offence type details.....................................................................................................................................7
5 Impacts to data and statistical outputs.............................................................................................9
6 Conclusion & Next Steps..................................................................................................................11
Appendix 1. Offence Divisions, incidents recorded and rates per 100,000 population, April 2012 – March 2017.........................................................................................................................................................12
Appendix 2. Offences, incidents recorded and rates per 100,000 population, April 2012 – March 2017.14
1
1.1 About the Crime Statistics AgencyThe Crime Statistics Agency (CSA) is the agency responsible for processing, analysing and publishing quarterly crime statistics using data collected by Victoria Police. Established in 2014, with public operations commencing on 1 January 2015, the CSA’s role is to improve the quality of and accessibility to crime data, research current and emerging crime and criminal justice trends and strengthen the integrity and public confidence of Victoria’s crime statistics.
The legislative basis of the CSA is the Crime Statistics Act 2014, which provides for the public release of crime statistics, research into crime trends and the employment of the Chief Statistician for that purpose. The CSA aims to provide an efficient and transparent information service to inform policy makers, researchers, the media and the Victorian public.
1.2 Current Victorian Recorded Crime StatisticsAt present, the CSA produces crime statistics quarterly based on an extract of data from the Victoria Police Law Enforcement Assistance Program (LEAP). Each quarter the CSA provides information about crimes occurring across the state from a range of views, including counts and rates of:
• recorded offences;
• alleged offender incidents;
• victim reports; and
• family incidents.
Information about the number of unique victims and offenders recorded by police is produced annually as part of the CSA’s financial year statistical report, and provides more detailed information about repeat offending and victimisation. The current headline measure used for quarterly reporting is the number of recorded offences within a 12 month period, and the overall changes between each reporting period. As the headline indicator, offences have traditionally been used as the basis for calculating the crime rate in Victoria.
1.3 A New Measure of Crime in VictoriaWhile the current headline measure is useful in showing the number of detected and reported offences recorded by Victoria Police, it is not necessarily an accurate representation of how people experience crime in the community. This is because a single criminal incident can involve one or many offence types, and potentially multiple counts of an offence. Therefore, whilst the number of recorded offences is important to quantify police workload and process offenders through the criminal justice system, it can be less representative of crime as it is experienced by people.
Therefore, the CSA has identified a gap in the current statistical outputs that offers a central view of a criminal incident and connects it to the offenders and victims involved, as well as the associated offences. To address this information gap, the CSA has commenced work developing an incident-based view of crime to better reflect the volume and public experience of crime in Victoria. On 28 September 2017, the CSA will release a suite of information that presents an incident-based view of crime as the headline indicator for the first time.
1.4 About this Consultation PaperThe purpose of this consultation paper is to provide a summary of the incident-based data, and how this new
2
measure impacts on the presentation of the CSA’s quarterly crime statistics. It outlines the challenges associated with developing incident-based data, details the key improvements and provides a comparison between incidents and offences to help guide the transition to the incident-based view as the headline measure for recorded crime statistics.
3

2.1 Developing the Incident-based CollectionThere are a number of challenges with using operational police data to create meaningful crime statistics. The primary function of the LEAP database is for Victoria Police to manage case workloads, process offenders, and finalise outcomes of incidents that come to the attention of police. The CSA uses this operational data entered on LEAP and transforms it into statistics for public release. This means that the creation of statistics is restricted to the use of information contained within the LEAP database, and relies heavily on the quality of the input of information by police officers and data entry staff. Therefore, any statistical information produced by the CSA will only offer a view of crime as it comes to the attention of police, and cannot account for incidents that are not reported.
Another challenge of using operational data concerns the overall quality of the information recorded within the system. At times there can be inconsistencies in the way certain information is recorded, and often the data contains incorrect or missing values that affect the CSA’s ability to provide high quality statistics. The CSA endeavours to produce a broad range of content, and will continue to work with police in the future to improve the overall quality of the data recorded.
2.2 Objectives of incident-based statisticsThe creation of the incident-based collection will result in a number of benefits that will enhance the published crime statistics and improve public understanding of crime in Victoria. The key advantages are:
• presenting statistics that reflect how the community experiences crime;
• producing more accurate information about crime trends;
• increasing comparability across states;
• no loss of service to the Victorian public; and
• providing access to more information.
Reflecting community experience of crime
The incident-based collection will provide a clearer and more easily understood measure of how the Victorian public experiences crime. When crime is generally referred to or spoken about, it is more often than not presented as the criminal event. That is, a single criminal event that happens in a particular time and place. When these events are counted in the current crime statistics, they may be represented by different types of offences and potentially multiple counts of these offences. This can make it difficult to see the criminal event as experienced. The incident-based count is designed to represent the broad event that occurs as a more representative measure of instances of crime, rather than using the bulk number of offences that Victoria Police members record within each incident.
More accurate information about crime trendsThe incident view of crime also presents more accurate statistics about crime trends in Victoria. The offence counts recorded by Victoria Police, and currently used by the CSA as the headline crime measure, are highly prone to fluctuations in the data. This can be caused by single incidents with high numbers of offences and is heavily impacted by changes to police recording practices and policies, additional legislation as well as targeted police operations. Large fluctuations in the data can impact on the result of significance testing. By conducting significance testing and calculating rates per 100,000 population on the incident-based data, the trend information published by
4
the CSA will be less impacted upon by volatility and be more accurate and robust. More information is available in Section 5: Impacts to data and statistical outputs.
Increased comparability across statesComparing crime and justice statistics across different jurisdictions has inherent difficulties. Different legislation, police operations, police recording practices, social demographics and geographic differences all contribute to the difficulties in making accurate comparisons. On a statistical level, the CSA currently advises caution in making cross-jurisdictional comparisons to crime data, due to differences in counting methodologies used by each state or territory1. The incident-based collection will mitigate some of these methodological differences. Whilst not completely comparable, the incident-based collection will allow Victoria to make more meaningful comparisons to other jurisdictions, in particular with crime statistics published by the NSW Bureau of Crime Statistics and Research (BOCSAR).
No loss of serviceThe introduction of the incident-based collection will see a transition to the use of incidents as the headline measure for recorded crime in Victoria, however offence based information will still be publicly available. Offence data will still be produced as part of the quarterly statistical releases and customised data requests, ensuring that there is no loss of service to the Victoria community and that all views of crime are still readily available to data users.
Providing access to more informationThe CSA aims to improve the accessibility of crime statistics for all Victorians, strengthening the integrity, quality and public confidence of recorded crime data, building a better evidence base to inform decision making and policy development and provide tools and resources to enhance statistical literacy for users of Victorian crime data. The creation of the incident-based collection will allow the CSA to develop new features and variables for the users of crime statistics data.
3 The Criminal Incident - Definition, scope and counting rules
DefinitionFor the purposes of creating incident-based statistics, the CSA defines a criminal incident as:
“A criminal event - that may include multiple offences, alleged offenders and/or victims - that is recorded on the LEAP database on a single date and at one location.”
ScopeThe scope of the incident-based collection includes only those recorded incidents where police have taken action, or an investigation is ongoing. Any incidents where Victoria Police have deemed that no offence occurred, or where no further police action is required (such as warrants or summons not authorised) are excluded from the incident counts.
The exception to this are incidents that have occurred and been recorded by police, but where a person later
1 An exception to this is the national crime statistics collections produced by the Australian Bureau of Statistics which are designed to align data collected from each state and territory to similar counting rules and offence category mappings.
5
withdraws their complaint. As these incidents still represent a criminal incident, they will continue to be included in the recorded crime statistics.
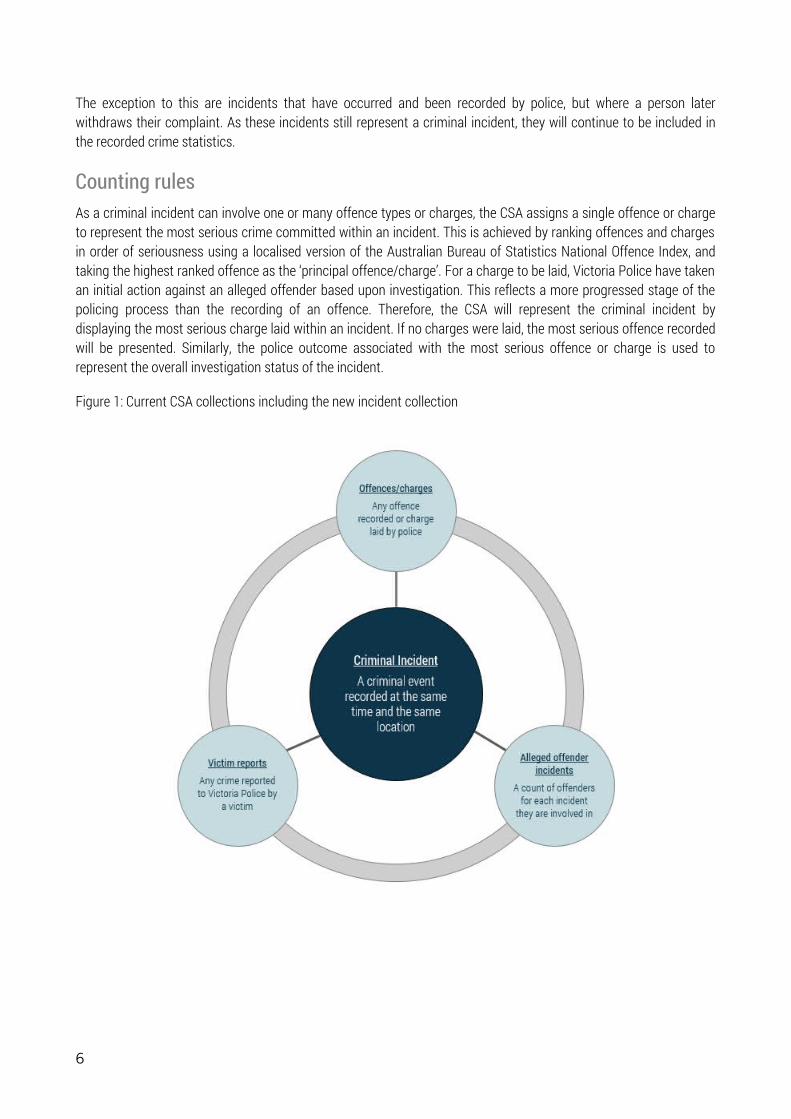
Counting rulesAs a criminal incident can involve one or many offence types or charges, the CSA assigns a single offence or charge to represent the most serious crime committed within an incident. This is achieved by ranking offences and charges in order of seriousness using a localised version of the Australian Bureau of Statistics National Offence Index, and taking the highest ranked offence as the ‘principal offence/charge’. For a charge to be laid, Victoria Police have taken an initial action against an alleged offender based upon investigation. This reflects a more progressed stage of the policing process than the recording of an offence. Therefore, the CSA will represent the criminal incident by displaying the most serious charge laid within an incident. If no charges were laid, the most serious offence recorded will be presented. Similarly, the police outcome associated with the most serious offence or charge is used to represent the overall investigation status of the incident.
Figure 1: Current CSA collections including the new incident collection
6
Scenarios
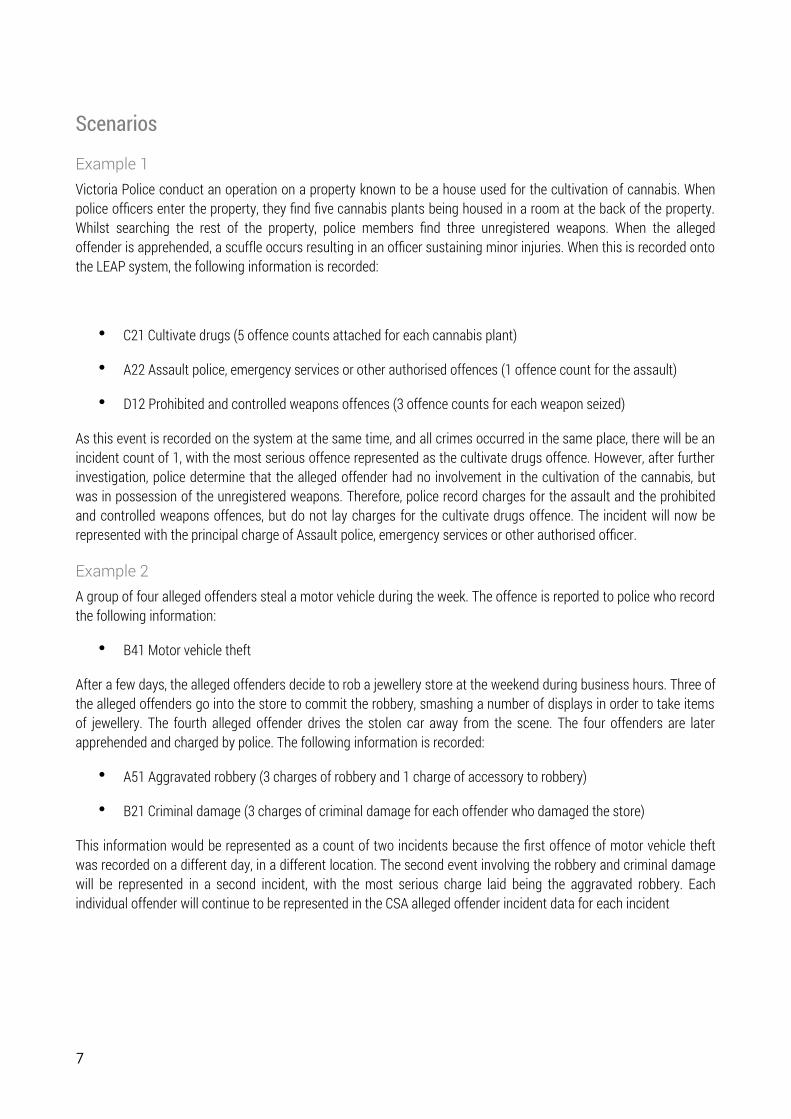
Example 1Victoria Police conduct an operation on a property known to be a house used for the cultivation of cannabis. When police officers enter the property, they find five cannabis plants being housed in a room at the back of the property. Whilst searching the rest of the property, police members find three unregistered weapons. When the alleged offender is apprehended, a scuffle occurs resulting in an officer sustaining minor injuries. When this is recorded onto the LEAP system, the following information is recorded:
C21 Cultivate drugs (5 offence counts attached for each cannabis plant)
A22 Assault police, emergency services or other authorised offences (1 offence count for the assault)
D12 Prohibited and controlled weapons offences (3 offence counts for each weapon seized)
As this event is recorded on the system at the same time, and all crimes occurred in the same place, there will be an incident count of 1, with the most serious offence represented as the cultivate drugs offence. However, after further investigation, police determine that the alleged offender had no involvement in the cultivation of the cannabis, but was in possession of the unregistered weapons. Therefore, police record charges for the assault and the prohibited and controlled weapons offences, but do not lay charges for the cultivate drugs offence. The incident will now be represented with the principal charge of Assault police, emergency services or other authorised officer.
Example 2A group of four alleged offenders steal a motor vehicle during the week. The offence is reported to police who record the following information:
B41 Motor vehicle theft
After a few days, the alleged offenders decide to rob a jewellery store at the weekend during business hours. Three of the alleged offenders go into the store to commit the robbery, smashing a number of displays in order to take items of jewellery. The fourth alleged offender drives the stolen car away from the scene. The four offenders are later apprehended and charged by police. The following information is recorded:
A51 Aggravated robbery (3 charges of robbery and 1 charge of accessory to robbery)
B21 Criminal damage (3 charges of criminal damage for each offender who damaged the store)
This information would be represented as a count of two incidents because the first offence of motor vehicle theft was recorded on a different day, in a different location. The second event involving the robbery and criminal damage will be represented in a second incident, with the most serious charge laid being the aggravated robbery. Each individual offender will continue to be represented in the CSA alleged offender incident data for each incident
7
4 Additional EnhancementsThe creation of the incident-based collection allows the CSA to use variables within the LEAP data not previously published before, as well as enhancing the utility of some of the common data items published by the CSA.
Introduction of criminal charge informationThe CSA regularly receives requests for information about the types and number of charges laid by police, which currently does not form part of the recorded offences data. A recorded offence represents an earlier stage of the police process before charges are laid. As a proxy measure, the CSA currently provides offence data where Victoria Police members have recorded an investigation status of either ‘Arrest’ or ‘Summons’. Analysis has found that this proxy measure is largely an accurate substitute for showing which offences proceed to charges at a later stage. However, as part of the extract received from Victoria Police, the CSA also receives charge information. In the creation of the incident-based dataset, the CSA has incorporated this information as part of a criminal incident (see Section 3). This information will add important context to the work completed by Victoria Police, and further benefit the community understanding of recorded crime and the carriage of an offence through the criminal justice system.
Improved location informationGeographic information showing where crime occurs, particularly at the postcode, suburb and Local Government Area (LGA) levels are some of the most common data items requested and used by CSA clients. The CSA has analysed the recording of this data in LEAP and has found that there are some inconsistencies which impact the overall quality of location-specific information. The CSA has used a combination of location variables received from Victoria Police to improve the quality of location data, and developed more accurate geographic information that better represents where a specific incident occurred. This work will allow for improved quality in location-based information to inform the public about where crime occurs across the state.
Further, the CSA has also developed a set of rules that will ensure that any incidents that occur within justice or immigration facilities are not included in geographic based counts such as LGA, postcode and suburb data. This will produce a more accurate representation of crime within the community, which will not be impacted by incidents that occur within these institutions. Incidents occurring within justice or immigration facilities will now be represented in the data under the location type of ‘prison/detention centre’, and will still be included in calculating the total counts of incidents recorded in Victoria.
Additional offence type detailsCSA has received numerous requests for data which show:
• residential and non-residential burglary; and
• certain offences committed in the context of family violence, such as assault, stalking, harassment and threatening behaviour.
The current offence classification used by the CSA has three levels: Offence Division, Offence Subdivision and Offence Group. The CSA intends to introduce a new offence level that is designed to disaggregate the commonly requested offence types listed above. These splits will then be used as part of the standard quarterly outputs from the CSA.
8

9
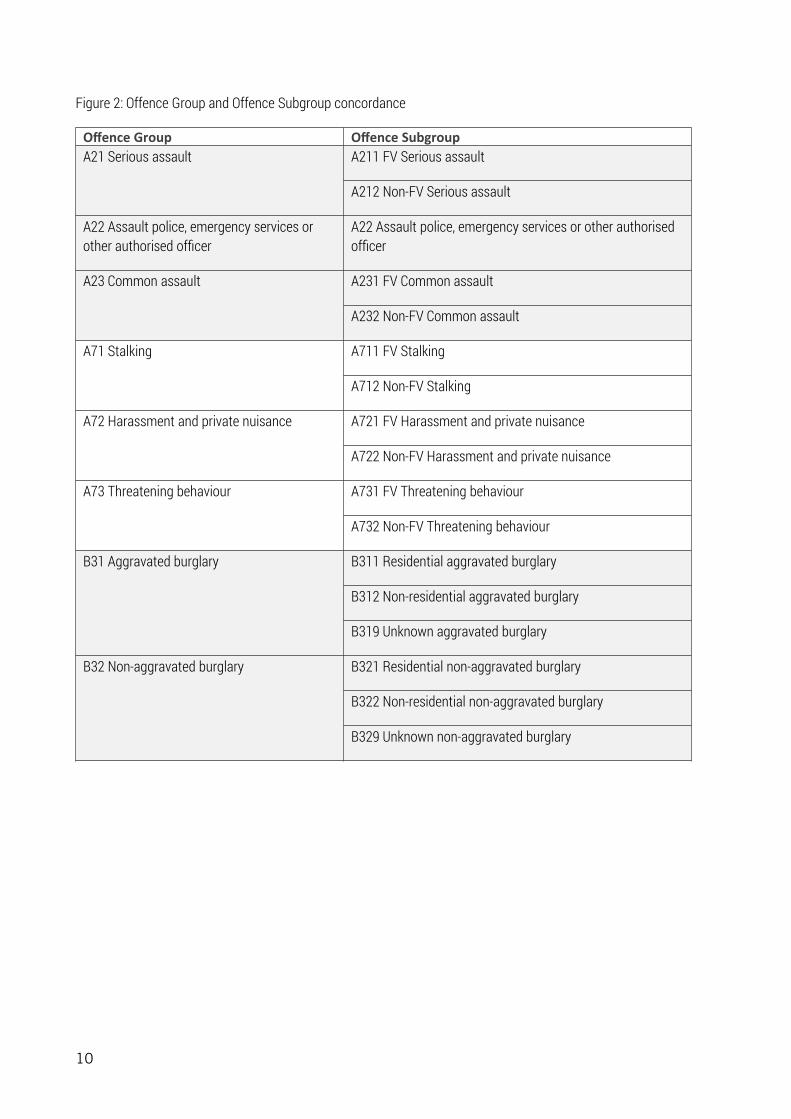
Figure 2: Offence Group and Offence Subgroup concordance
Offence Group Offence SubgroupA21 Serious assault A211 FV Serious assault
A212 Non-FV Serious assault
A22 Assault police, emergency services or other authorised officer
A22 Assault police, emergency services or other authorised officer
A23 Common assault A231 FV Common assault
A232 Non-FV Common assault
A71 Stalking A711 FV Stalking
A712 Non-FV Stalking
A72 Harassment and private nuisance A721 FV Harassment and private nuisance
A722 Non-FV Harassment and private nuisance
A73 Threatening behaviour A731 FV Threatening behaviour
A732 Non-FV Threatening behaviour
B31 Aggravated burglary B311 Residential aggravated burglary
B312 Non-residential aggravated burglary
B319 Unknown aggravated burglary
B32 Non-aggravated burglary B321 Residential non-aggravated burglary
B322 Non-residential non-aggravated burglary
B329 Unknown non-aggravated burglary
10
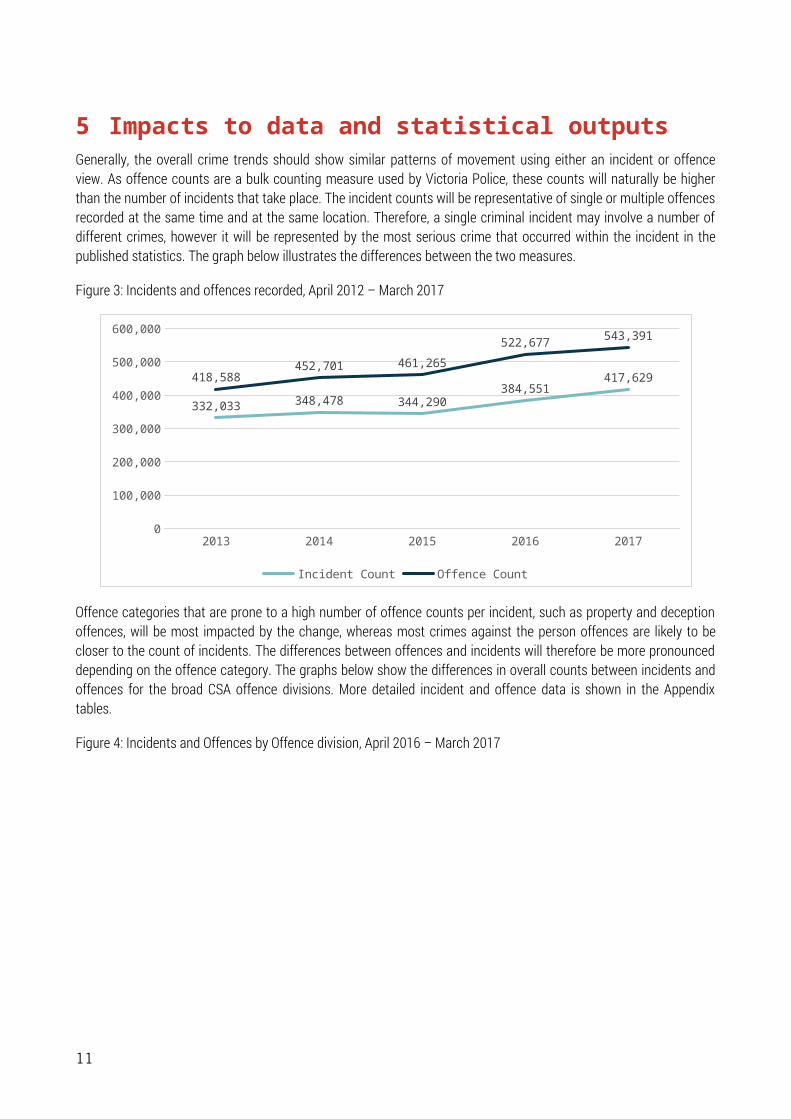
5 Impacts to data and statistical outputs Generally, the overall crime trends should show similar patterns of movement using either an incident or offence view. As offence counts are a bulk counting measure used by Victoria Police, these counts will naturally be higher than the number of incidents that take place. The incident counts will be representative of single or multiple offences recorded at the same time and at the same location. Therefore, a single criminal incident may involve a number of different crimes, however it will be represented by the most serious crime that occurred within the incident in the published statistics. The graph below illustrates the differences between the two measures.
Figure 3: Incidents and offences recorded, April 2012 – March 2017
2013 2014 2015 2016 20170
100,000
200,000
300,000
400,000
500,000
600,000
332,033 348,478 344,290384,551
417,629418,588452,701 461,265
522,677543,391
Incident Count Offence Count
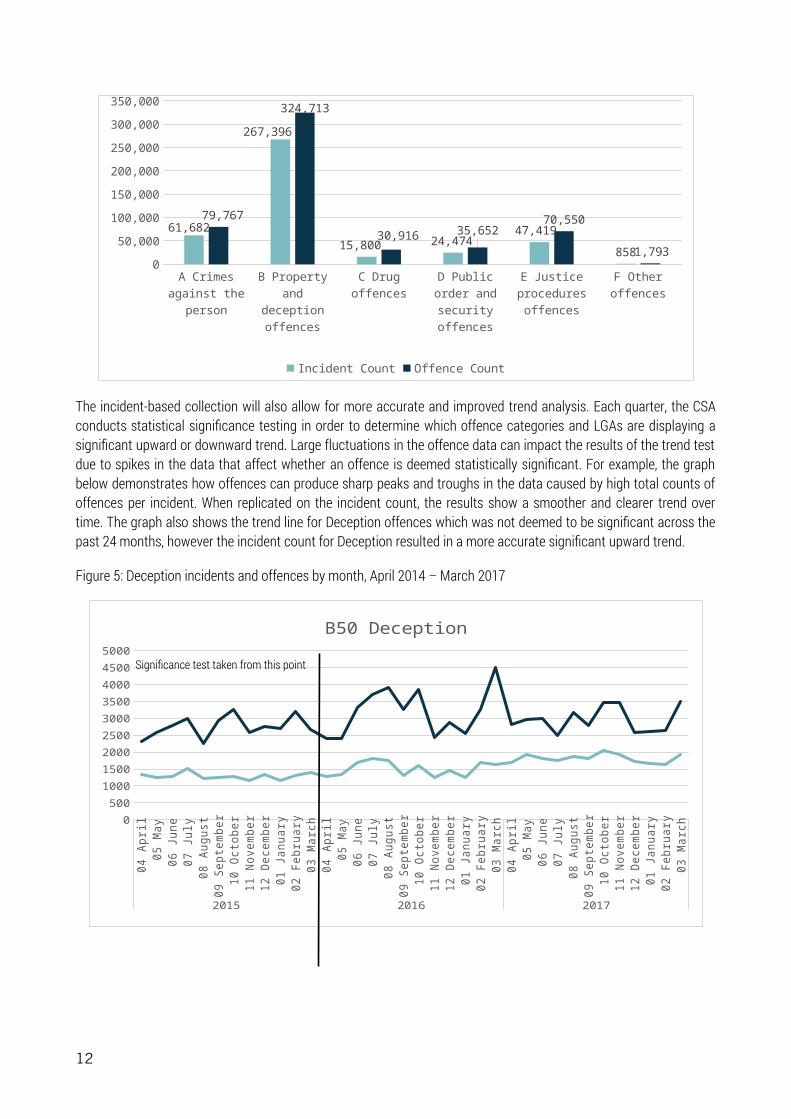
Offence categories that are prone to a high number of offence counts per incident, such as property and deception offences, will be most impacted by the change, whereas most crimes against the person offences are likely to be closer to the count of incidents. The differences between offences and incidents will therefore be more pronounced depending on the offence category. The graphs below show the differences in overall counts between incidents and offences for the broad CSA offence divisions. More detailed incident and offence data is shown in the Appendix tables.
Figure 4: Incidents and Offences by Offence division, April 2016 – March 2017
11
A Crim
es again
st th
e pers
on
B Pro
perty and d
eceptio
n offence
s
C Dru
g offence
s
D Public
order a
nd secu
rity offe
nces
E Justi
ce p
roce
dures o
ffence
s
F Oth
er offe
nces
0
100,000
200,000
300,000
61,682
267,396
15,800 24,474 47,419858
79,767
324,713
30,916 35,652 70,550
1,793
Incident Count Offence Count
The incident-based collection will also allow for more accurate and improved trend analysis. Each quarter, the CSA conducts statistical significance testing in order to determine which offence categories and LGAs are displaying a significant upward or downward trend. Large fluctuations in the offence data can impact the results of the trend test due to spikes in the data that affect whether an offence is deemed statistically significant. For example, the graph below demonstrates how offences can produce sharp peaks and troughs in the data caused by high total counts of offences per incident. When replicated on the incident count, the results show a smoother and clearer trend over time. The graph also shows the trend line for Deception offences which was not deemed to be significant across the past 24 months, however the incident count for Deception resulted in a more accurate significant upward trend.
Figure 5: Deception incidents and offences by month, April 2014 – March 2017
04
Ap
ril
05
May
06
Ju
ne
07
Ju
ly0
8 A
ugu
st0
9 S
epte
mb
er1
0 O
ctob
er1
1 N
ovem
ber
12
Dec
emb
er0
1 J
anu
ary
02
Feb
ruar
y0
3 M
arch
04
Ap
ril
05
May
06
Ju
ne
07
Ju
ly0
8 A
ugu
st0
9 S
epte
mb
er1
0 O
ctob
er1
1 N
ovem
ber
12
Dec
emb
er0
1 J
anu
ary
02
Feb
ruar
y0
3 M
arch
04
Ap
ril
05
May
06
Ju
ne
07
Ju
ly0
8 A
ugu
st0
9 S
epte
mb
er1
0 O
ctob
er1
1 N
ovem
ber
12
Dec
emb
er0
1 J
anu
ary
02
Feb
ruar
y0
3 M
arch
2015 2016 2017
0
500
1000
1500
2000
2500
3000
3500
4000
4500
5000
B50 Deception
12
Significance test taken from this point
6 Conclusion & Next Steps The CSA welcomes submissions about the new incident collection as described in this paper and will consider any improvements or additions required based on feedback from stakeholders across government, Victoria Police and the general public to finalise this work. The next CSA release of data will be the annual release on 28 September 2017, which will include data up to 30 June 2017. In addition to the usual content in CSA annual statistical reports, this release will include content and data tables based on the new incident collection. CSA staff will provide guidance and support in using this new measure and advise clients on which information to use for reporting, as well as producing explanatory material which will be available on the www.crimestatistics.vic.gov.au website.
The CSA invites feedback on the all aspects of this new measure and the implications for the publication of recorded crime statistics. The CSA also welcomes responses as to how this measure will complement the other data sources currently available. Feedback is sought before by 5pm on 1 September 2017. Comments can be provided to the CSA by any of the following methods:
By Mail –
Chief Statistician
Crime Statistics Agency
GPO Box 4356
MELBOURNE VIC 3001
By Phone –
(03) 8684 1808
By email –
13
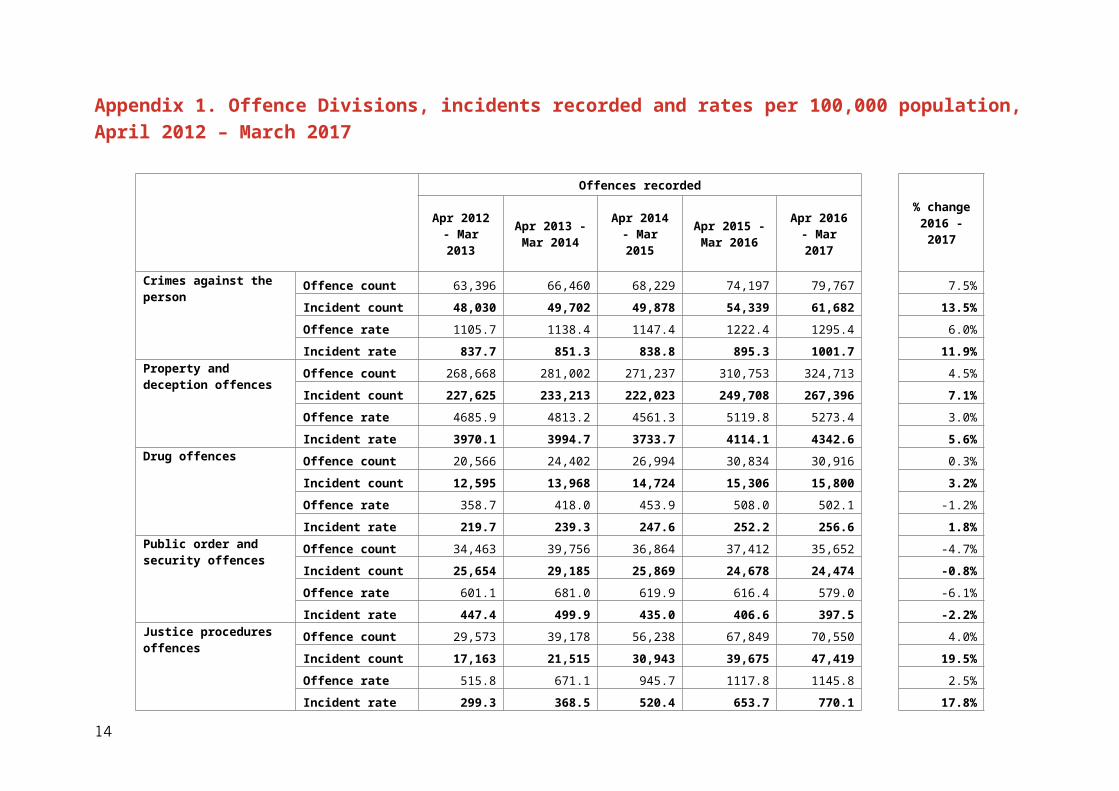
Appendix 1. Offence Divisions, incidents recorded and rates per 100,000 population, April 2012 – March 2017
Offences recorded
% change 2016 - 2017Apr 2012 -
Mar 2013Apr 2013 - Mar 2014
Apr 2014 - Mar 2015
Apr 2015 - Mar 2016
Apr 2016 - Mar 2017
Crimes against the person Offence count 63,396 66,460 68,229 74,197 79,767 7.5%
Incident count 48,030 49,702 49,878 54,339 61,682 13.5%
Offence rate 1105.7 1138.4 1147.4 1222.4 1295.4 6.0%
Incident rate 837.7 851.3 838.8 895.3 1001.7 11.9%Property and deception offences Offence count 268,668 281,002 271,237 310,753 324,713 4.5%
Incident count 227,625 233,213 222,023 249,708 267,396 7.1%
Offence rate 4685.9 4813.2 4561.3 5119.8 5273.4 3.0%
Incident rate 3970.1 3994.7 3733.7 4114.1 4342.6 5.6%Drug offences Offence count 20,566 24,402 26,994 30,834 30,916 0.3%
Incident count 12,595 13,968 14,724 15,306 15,800 3.2%
Offence rate 358.7 418.0 453.9 508.0 502.1 -1.2%
Incident rate 219.7 239.3 247.6 252.2 256.6 1.8%Public order and security offences Offence count 34,463 39,756 36,864 37,412 35,652 -4.7%
Incident count 25,654 29,185 25,869 24,678 24,474 -0.8%
Offence rate 601.1 681.0 619.9 616.4 579.0 -6.1%
Incident rate 447.4 499.9 435.0 406.6 397.5 -2.2%Justice procedures offences Offence count 29,573 39,178 56,238 67,849 70,550 4.0%
Incident count 17,163 21,515 30,943 39,675 47,419 19.5%
Offence rate 515.8 671.1 945.7 1117.8 1145.8 2.5%
Incident rate 299.3 368.5 520.4 653.7 770.1 17.8%
14
Offences recorded
% change 2016 - 2017Apr 2012 -
Mar 2013Apr 2013 - Mar 2014
Apr 2014 - Mar 2015
Apr 2015 - Mar 2016
Apr 2016 - Mar 2017
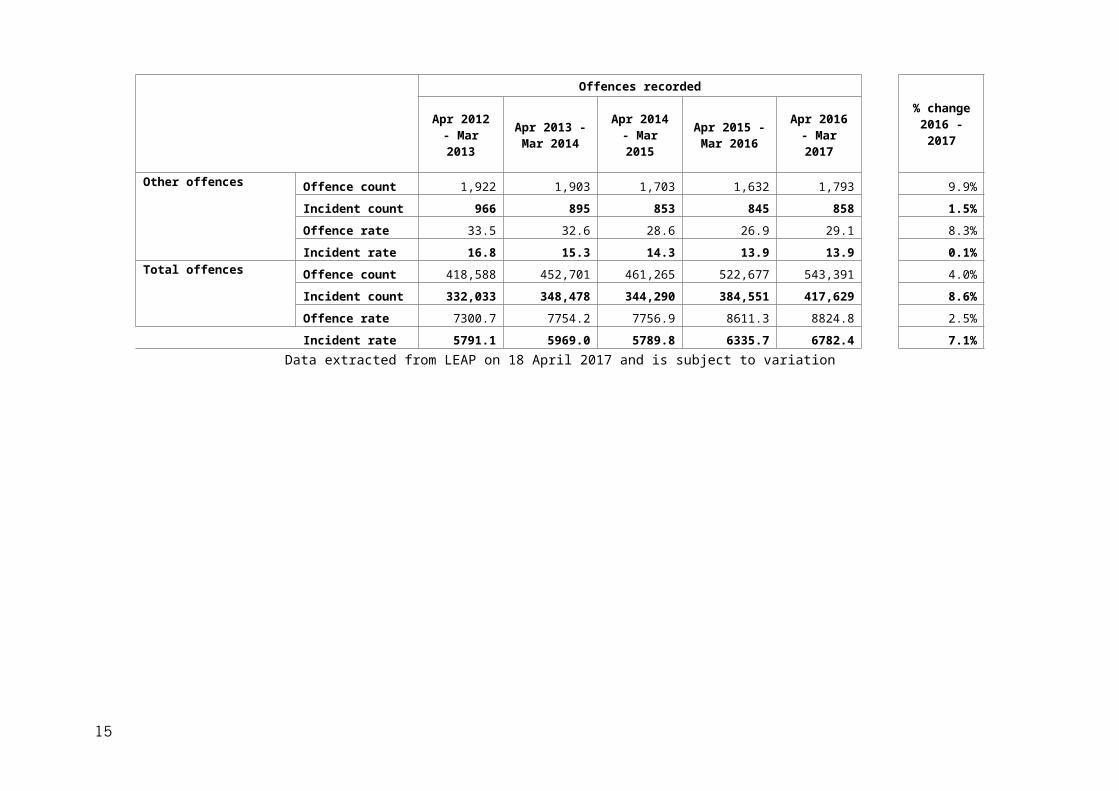
Other offences Offence count 1,922 1,903 1,703 1,632 1,793 9.9%
Incident count 966 895 853 845 858 1.5%
Offence rate 33.5 32.6 28.6 26.9 29.1 8.3%
Incident rate 16.8 15.3 14.3 13.9 13.9 0.1%Total offences Offence count 418,588 452,701 461,265 522,677 543,391 4.0%
Incident count 332,033 348,478 344,290 384,551 417,629 8.6%
Offence rate 7300.7 7754.2 7756.9 8611.3 8824.8 2.5%
Incident rate 5791.1 5969.0 5789.8 6335.7 6782.4 7.1%Data extracted from LEAP on 18 April 2017 and is subject to variation
15

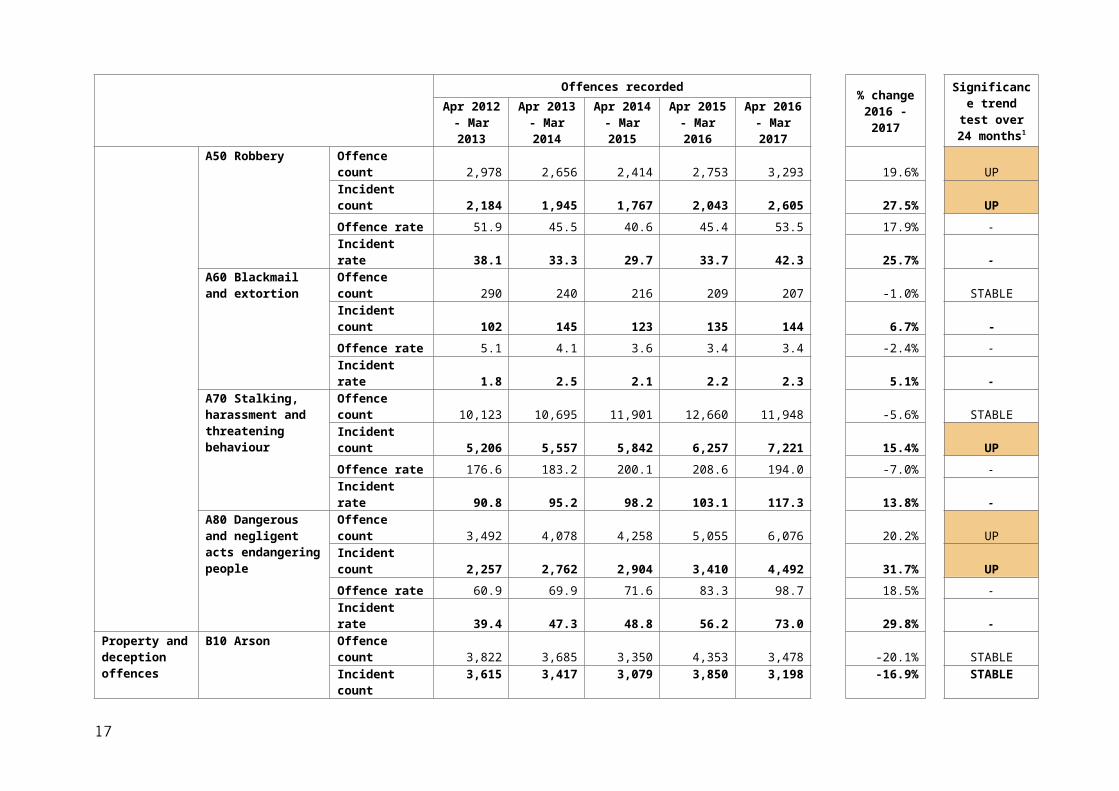
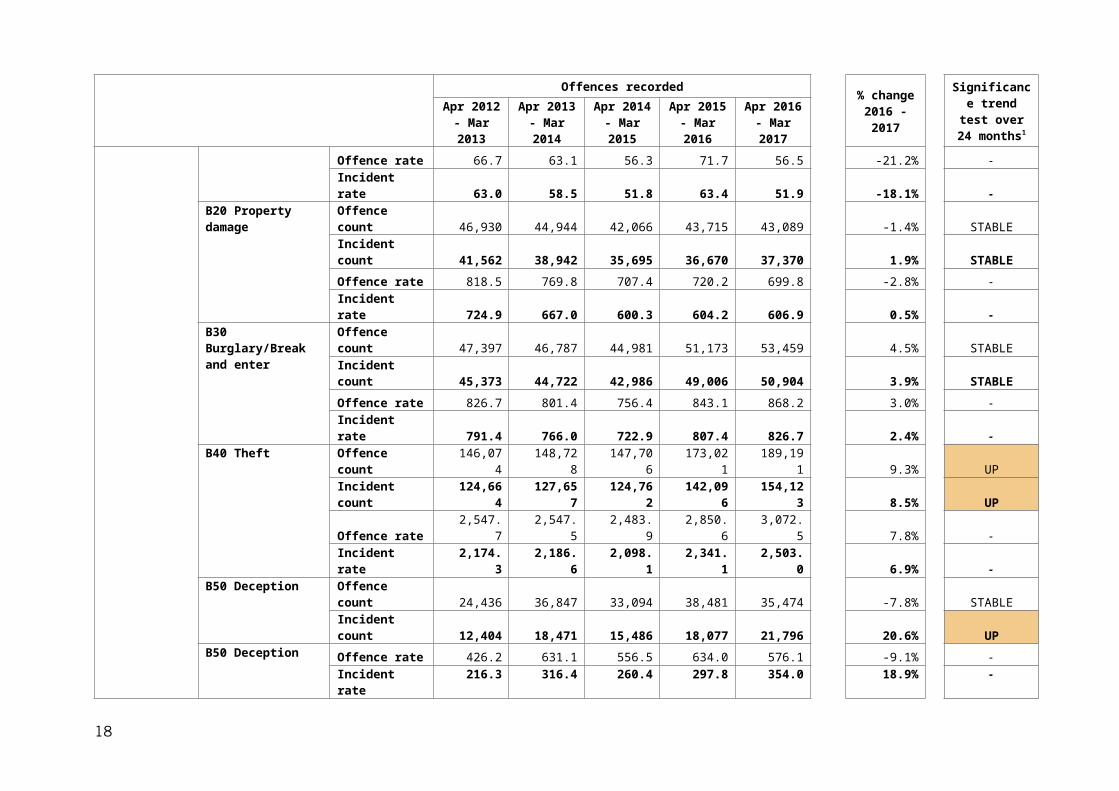
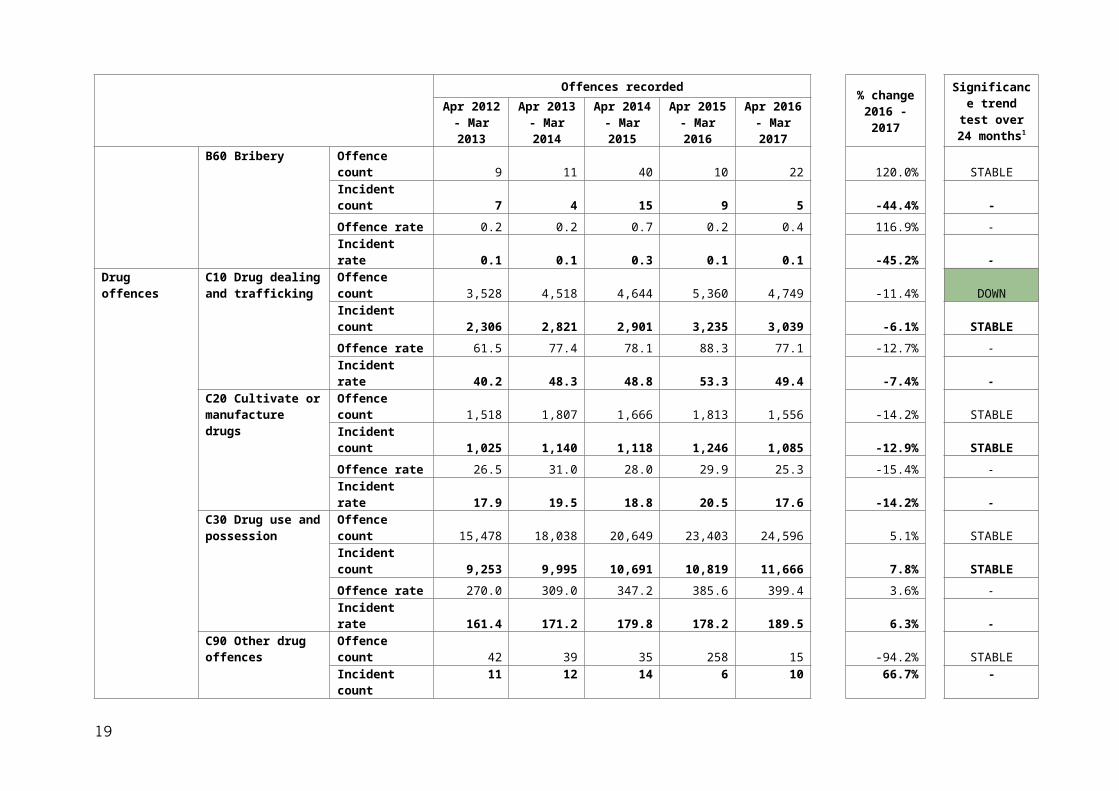
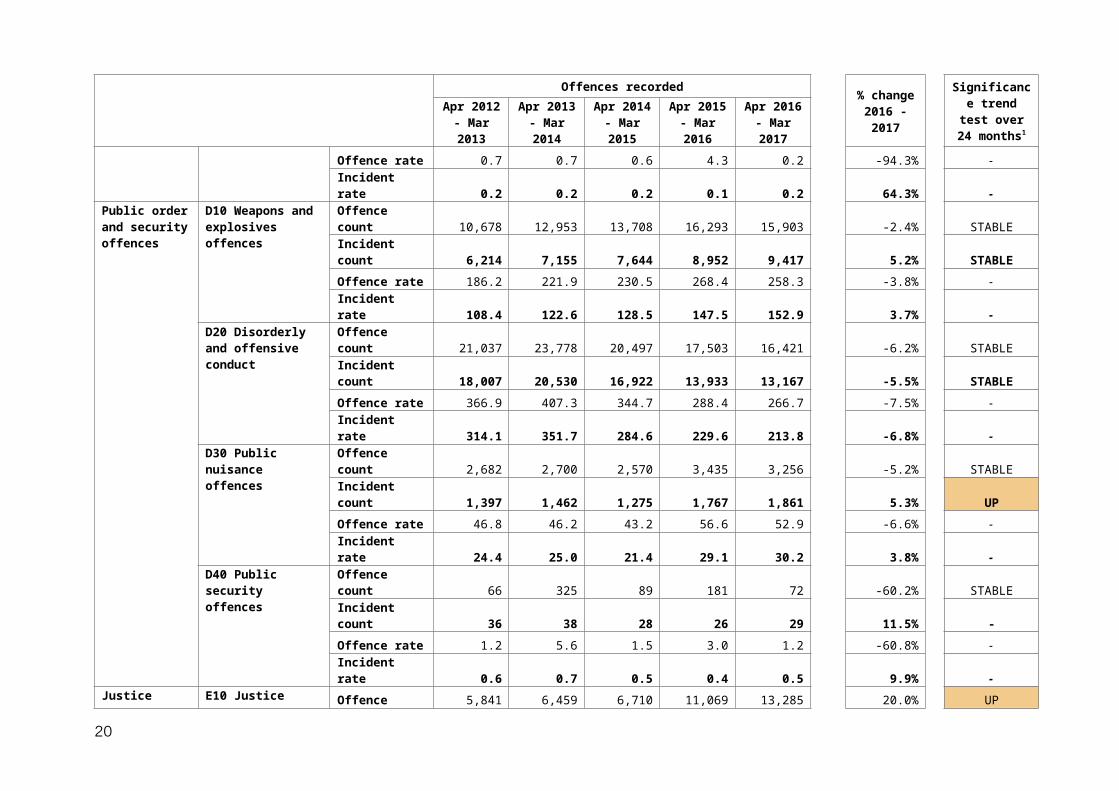
Appendix 2. Offences, incidents recorded and rates per 100,000 population, April 2012 – March 2017
Offences recorded% change
2016 - 2017
Significance trend test over 24 months1
Apr 2012 - Mar 2013
Apr 2013 - Mar 2014
Apr 2014 - Mar 2015
Apr 2015 - Mar 2016
Apr 2016 - Mar 2017
Crimes against the person
A10 Homicide and related offences Offence count 173 168 176 197 237 20.3% STABLE
Incident count 155 140 147 179 179 0.0% -
Offence rate 3.0 2.9 3.0 3.2 3.8 18.6% -
Incident rate 2.7 2.4 2.5 2.9 2.9 -1.4% -A20 Assault and related offences Offence count 36,814 37,727 37,009 40,551 43,765 7.9% UP
Incident count 32,682 33,363 32,890 35,609 39,000 9.5% UP
Offence rate 642.1 646.2 622.4 668.1 710.8 6.4% -
Incident rate 570.0 571.5 553.1 586.7 633.4 8.0% -A30 Sexual offences Offence count 8,851 10,219 11,572 11,997 13,429 11.9% STABLE
Incident count 5,109 5,418 5,849 6,302 7,564 20.0% UP
Offence rate 154.4 175.0 194.6 197.7 218.1 10.3% -
Incident rate 89.1 92.8 98.4 103.8 122.8 18.3% -A40 Abduction and related offences Offence count 675 677 683 775 812 4.8% STABLE
Incident count 335 372 356 404 477 18.1% UP
Offence rate 11.8 11.6 11.5 12.8 13.2 3.3% -
Incident rate 5.8 6.4 6.0 6.7 7.7 16.4% -A50 Robbery Offence count 2,978 2,656 2,414 2,753 3,293 19.6% UP
Incident count 2,184 1,945 1,767 2,043 2,605 27.5% UP
Offence rate 51.9 45.5 40.6 45.4 53.5 17.9% -
Incident rate 38.1 33.3 29.7 33.7 42.3 25.7% -A60 Blackmail and extortion Offence count 290 240 216 209 207 -1.0% STABLE
Incident count 102 145 123 135 144 6.7% -
Offence rate 5.1 4.1 3.6 3.4 3.4 -2.4% -
16
Offences recorded % change 2016 - 2017
Significance trend test over 24 months1
Apr 2012 - Mar 2013
Apr 2013 - Mar 2014
Apr 2014 - Mar 2015
Apr 2015 - Mar 2016
Apr 2016 - Mar 2017
Incident rate 1.8 2.5 2.1 2.2 2.3 5.1% -A70 Stalking, harassment and threatening behaviour
Offence count 10,123 10,695 11,901 12,660 11,948 -5.6% STABLE
Incident count 5,206 5,557 5,842 6,257 7,221 15.4% UP
Offence rate 176.6 183.2 200.1 208.6 194.0 -7.0% -
Incident rate 90.8 95.2 98.2 103.1 117.3 13.8% -A80 Dangerous and negligent acts endangering people
Offence count 3,492 4,078 4,258 5,055 6,076 20.2% UP
Incident count 2,257 2,762 2,904 3,410 4,492 31.7% UP
Offence rate 60.9 69.9 71.6 83.3 98.7 18.5% -
Incident rate 39.4 47.3 48.8 56.2 73.0 29.8% -Property and deception offences
B10 Arson Offence count 3,822 3,685 3,350 4,353 3,478 -20.1% STABLE
Incident count 3,615 3,417 3,079 3,850 3,198 -16.9% STABLE
Offence rate 66.7 63.1 56.3 71.7 56.5 -21.2% -
Incident rate 63.0 58.5 51.8 63.4 51.9 -18.1% -B20 Property damage Offence count 46,930 44,944 42,066 43,715 43,089 -1.4% STABLE
Incident count 41,562 38,942 35,695 36,670 37,370 1.9% STABLE
Offence rate 818.5 769.8 707.4 720.2 699.8 -2.8% -
Incident rate 724.9 667.0 600.3 604.2 606.9 0.5% -B30 Burglary/Break and enter Offence count 47,397 46,787 44,981 51,173 53,459 4.5% STABLE
Incident count 45,373 44,722 42,986 49,006 50,904 3.9% STABLE
Offence rate 826.7 801.4 756.4 843.1 868.2 3.0% -
Incident rate 791.4 766.0 722.9 807.4 826.7 2.4% -B40 Theft Offence count 146,074 148,728 147,706 173,021 189,191 9.3% UP
Incident count 124,664 127,657 124,762 142,096 154,123 8.5% UP
Offence rate 2,547.7 2,547.5 2,483.9 2,850.6 3,072.5 7.8% -
Incident rate 2,174.3 2,186.6 2,098.1 2,341.1 2,503.0 6.9% -B50 Deception Offence count 24,436 36,847 33,094 38,481 35,474 -7.8% STABLE
Incident count 12,404 18,471 15,486 18,077 21,796 20.6% UP
17
Offences recorded % change 2016 - 2017
Significance trend test over 24 months1
Apr 2012 - Mar 2013
Apr 2013 - Mar 2014
Apr 2014 - Mar 2015
Apr 2015 - Mar 2016
Apr 2016 - Mar 2017
B50 Deception Offence rate 426.2 631.1 556.5 634.0 576.1 -9.1% -
Incident rate 216.3 316.4 260.4 297.8 354.0 18.9% -B60 Bribery Offence count 9 11 40 10 22 120.0% STABLE
Incident count 7 4 15 9 5 -44.4% -
Offence rate 0.2 0.2 0.7 0.2 0.4 116.9% -
Incident rate 0.1 0.1 0.3 0.1 0.1 -45.2% -Drug offences C10 Drug dealing
and trafficking Offence count 3,528 4,518 4,644 5,360 4,749 -11.4% DOWN
Incident count 2,306 2,821 2,901 3,235 3,039 -6.1% STABLE
Offence rate 61.5 77.4 78.1 88.3 77.1 -12.7% -
Incident rate 40.2 48.3 48.8 53.3 49.4 -7.4% -C20 Cultivate or manufacture drugs Offence count 1,518 1,807 1,666 1,813 1,556 -14.2% STABLE
Incident count 1,025 1,140 1,118 1,246 1,085 -12.9% STABLE
Offence rate 26.5 31.0 28.0 29.9 25.3 -15.4% -
Incident rate 17.9 19.5 18.8 20.5 17.6 -14.2% -C30 Drug use and possession Offence count 15,478 18,038 20,649 23,403 24,596 5.1% STABLE
Incident count 9,253 9,995 10,691 10,819 11,666 7.8% STABLE
Offence rate 270.0 309.0 347.2 385.6 399.4 3.6% -
Incident rate 161.4 171.2 179.8 178.2 189.5 6.3% -C90 Other drug offences Offence count 42 39 35 258 15 -94.2% STABLE
Incident count 11 12 14 6 10 66.7% -
Offence rate 0.7 0.7 0.6 4.3 0.2 -94.3% -
Incident rate 0.2 0.2 0.2 0.1 0.2 64.3% -Public order and security offences
D10 Weapons and explosives offences Offence count 10,678 12,953 13,708 16,293 15,903 -2.4% STABLE
Incident count 6,214 7,155 7,644 8,952 9,417 5.2% STABLE
Offence rate 186.2 221.9 230.5 268.4 258.3 -3.8% -
Incident rate 108.4 122.6 128.5 147.5 152.9 3.7% -D20 Disorderly and Offence count 21,037 23,778 20,497 17,503 16,421 -6.2% STABLE
18
Offences recorded % change 2016 - 2017
Significance trend test over 24 months1
Apr 2012 - Mar 2013
Apr 2013 - Mar 2014
Apr 2014 - Mar 2015
Apr 2015 - Mar 2016
Apr 2016 - Mar 2017
offensive conduct Incident count 18,007 20,530 16,922 13,933 13,167 -5.5% STABLE
Offence rate 366.9 407.3 344.7 288.4 266.7 -7.5% -
Incident rate 314.1 351.7 284.6 229.6 213.8 -6.8% -D30 Public nuisance offences Offence count 2,682 2,700 2,570 3,435 3,256 -5.2% STABLE
Incident count 1,397 1,462 1,275 1,767 1,861 5.3% UP
Offence rate 46.8 46.2 43.2 56.6 52.9 -6.6% -
Incident rate 24.4 25.0 21.4 29.1 30.2 3.8% -D40 Public security offences Offence count 66 325 89 181 72 -60.2% STABLE
Incident count 36 38 28 26 29 11.5% -
Offence rate 1.2 5.6 1.5 3.0 1.2 -60.8% -
Incident rate 0.6 0.7 0.5 0.4 0.5 9.9% -Justice procedures offences
E10 Justice procedures Offence count 5,841 6,459 6,710 11,069 13,285 20.0% UP
Incident count 3,117 3,183 3,030 6,315 8,560 35.6% UP
Offence rate 101.9 110.6 112.8 182.4 215.8 18.3% -
Incident rate 54.4 54.5 51.0 104.0 139.0 33.6% -E20 Breaches of orders Offence count 23,732 32,719 49,528 56,780 57,265 0.9% STABLE
Incident count 14,046 18,332 27,913 33,360 38,859 16.5% UP
Offence rate 413.9 560.4 832.9 935.5 930.0 -0.6% -
Incident rate 245.0 314.0 469.4 549.6 631.1 14.8% -Other offences F10 Regulatory
driving offences Offence count 20 23 33 23 16 -30.4% STABLE
Incident count 15 19 26 13 11 -15.4% -
Offence rate 0.3 0.4 0.6 0.4 0.3 -31.4% -
Incident rate 0.3 0.3 0.4 0.2 0.2 -16.6% -F20 Transport regulation offences Offence count 432 448 461 543 860 58.4% UP
Incident count 235 229 236 272 419 54.0% -
F20 Transport regulation offences
Offence rate 7.5 7.7 7.8 8.9 14.0 56.1% -
Incident rate 4.1 3.9 4.0 4.5 6.8 51.8% -
19
Offences recorded % change 2016 - 2017
Significance trend test over 24 months1
Apr 2012 - Mar 2013
Apr 2013 - Mar 2014
Apr 2014 - Mar 2015
Apr 2015 - Mar 2016
Apr 2016 - Mar 2017
F30 Other government regulatory offences
Offence count 885 1,020 758 581 554 -4.6% STABLE
Incident count 473 395 312 300 241 -19.7% -
Offence rate 15.4 17.5 12.7 9.6 9.0 -6.0% -
Incident rate 8.2 6.8 5.2 4.9 3.9 -20.8% -F90 Miscellaneous offences Offence count 585 412 451 485 363 -25.2% STABLE
Incident count 243 252 279 260 187 -28.1% -
Offence rate 10.2 7.1 7.6 8.0 5.9 -26.2% -
Incident rate 4.2 4.3 4.7 4.3 3.0 -29.1% -Total offences Offence count 418,588 452,701 461,265 522,677 543,391 4.0% -
Incident count 332,033 348,478 344,290 384,551 417,629 8.6% -
Offence rate 7,300.7 7,754.2 7,756.9 8,611.3 8,824.8 2.5% -
Incident rate 5,791.1 5,969.0 5,789.8 6,335.7 6,782.4 7.1% -Data extracted from LEAP on 18 April 2017 and is subject to variation
1 The trend test serves as a guide to highlight changes that are statistically significant. For more information, please see the Explanatory notes.
20