CS 498 Probability & Statistics
43
CS 498 Probability & Statistics Lecture 01
Transcript of CS 498 Probability & Statistics

CS 498 Probability & Statistics
Lecture 01

• Class schedule
– MWF 11:00-11:50 am
– 1214 Siebel Center.
• Office hours
– TBD
• Evaluation
– Homework, midterm, final
Course logistics
http://luthuli.cs.uiuc.edu/~daf/courses/Probcourse/Probcourse-2013/498-home.html
• Instructor
– David Forsyth
– Email: [email protected]
– SC3310 (best way to reach)
• TA: Zicheng Liao
– Email: [email protected]

Where to start?

• “The language of technical computing”
– The language of MATRIX
• Easy interface (C-like), simple syntax, and
well-documented.
• Interpreted rather than compiled
• Cross-platform
• Cross-language (matlab <==> C/C++)
• Free student license!
About matlab

• Half way to success– Step 1: go to http://webstore.illinois.edu/home/
– Step 2: follow instructions.. And you’re all set
Install matlab

• Half way to success– Step 1: go to http://webstore.illinois.edu/home/
– Step 2: follow instructions.. And you’re most likely to run into sorts of problem• Check out a matlab package (I am using R2012b)
• License.dat, installation file, and installation key.
• Strictly follow http://dl.webstore.illinois.edu/docs/ii/matlabconc.htm
• Tricky part: connect to the license manager on server– Physically connected to campus network
– VPN (http://dl.webstore.illinois.edu/docs/ii/vpn.htm)
» Follow instructions.. And you’re all set.
Install matlab

You’ve got here!

Create a scalar variable, vector, matrix
>> a = 1; b = 2; %create variable a=1, b=2
>> c = [1 0 1] %create a row vectorc =
1 0 1
>> c = [1, 0, 1] %comma is equivalent to ‘ ‘c =
1 0 1
>> c = [1; 0; 1] %create a column vector with semicolonsc =
101
>> c = [1; 0 1] %rows must match in dimensionError using ‘vertcat’CAT arguments dimensions are not consistent.

Create a scalar variable, vector, matrix
>> d = [1 -2 0; 0 1 2] %create a 2x3 matrixd =
1 -2 00 1 2
>> e = zeros(3,3) %create a 3x3 zero matrixe =
0 0 00 0 00 0 0
>> f = ones(3,3) %create a 3x3 matrix with all 1f =
1 1 11 1 11 1 1
>> g = rand(2) %create a 2x2 matrix with random values g =
0.6557 0.84910.0357 0.9340
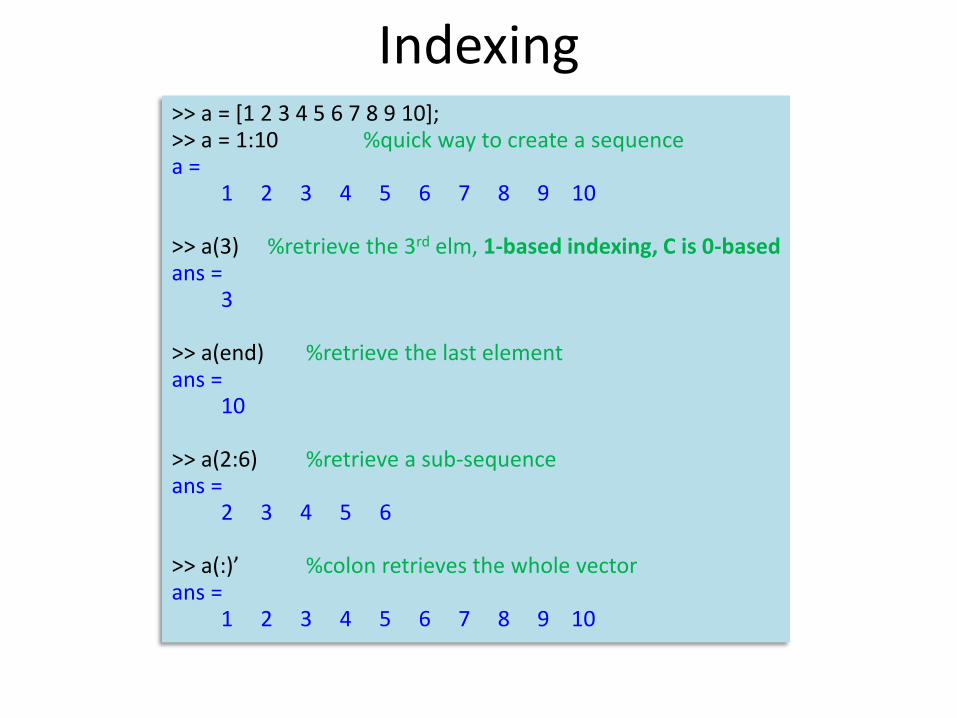
Indexing>> a = [1 2 3 4 5 6 7 8 9 10];>> a = 1:10 %quick way to create a sequencea =
1 2 3 4 5 6 7 8 9 10
>> a(3) %retrieve the 3rd elm, 1-based indexing, C is 0-basedans =
3
>> a(end) %retrieve the last elementans =
10
>> a(2:6) %retrieve a sub-sequenceans =
2 3 4 5 6
>> a(:)’ %colon retrieves the whole vectorans =
1 2 3 4 5 6 7 8 9 10

Indexing>> a = rand(3,3)a =
0.6555 0.0318 0.09710.1712 0.2769 0.82350.7060 0.0462 0.6948
>> a(2,3) %retrieve element at row 2 column 3ans =
0.8235
>> a(8) %column-major indexing; C is row-majorans =
0.8235
>> a(1,:) %retrieve the whole first rowans =
0.6555 0.0318 0.0971
>> a(2:3,1:2) %retrieve a sub-matrix ans =
0.1712 0.27690.7060 0.0462
<r1>
<r2>
<r3>
<c1> <c2> <c3>

Basic operators: + - * />> a + b % a = 1, b = 2ans =
3>> c - a % vector - scalarans =
0 -1 0>> a - c % scalar – vector, a = 1, c = [1 0 1]ans =
0 1 0
>> c * b % =c * b, vector-scalar multiplication; commutativeans =
2 0 2
>> c / b % vector divided by scalar, c = [1 0 1], b = 2ans =
0.5000 0 0.5000
>> b / c % scalar divided by vectorError using / Matrix dimensions must agree.

Basic operators: + - * / .* ./ >> c + d % vector plus vector c = [1 0 1], d = [2 2 -1]ans =
3 2 0
>> c + 1:5 % a 1x3 vector plus a 1x5 vectorError using + Matrix dimensions must agree.
>> e = [2; 2; -1] % a 3x1 column vectore =
22
-1>> c + e % a row vector plus a column vectorError using + Matrix dimensions must agree.>> e’ % transpose of eans =
2 2 -1>> c + e’ans =
3 2 0

Basic operators: + - * / .* ./
>> c*d %c = [1 0 1], d = [2 2 -1]Error using * Inner matrix dimensions must agree.
>>c*d’ %dot productans =
1
>> c.*d %element-wise operation, [1*2 0*2 1*(-1)]ans =
2 0 -1
>> c./dans =
0.5 0 -1.0
>> e = 1:5; >> c./eError using ./ Matrix dimensions must agree.

Basic operators: + - * / .* ./
%---implement dot product of two vectors---%>> c = [1 0 1]; d = [2 2 - 1];
%C-style impl: always try to avoid for loops if possible>> ans = 0;>> for i = 1:length(c)
ans = ans + c(i)*d(i);end
>> disp(ans);1
%matlab way of doing it>> c*d’; %already shown>> dot(c, d); %matlab built-in function>> sum(c.*d) %your way of doing it explicitlyans =
1
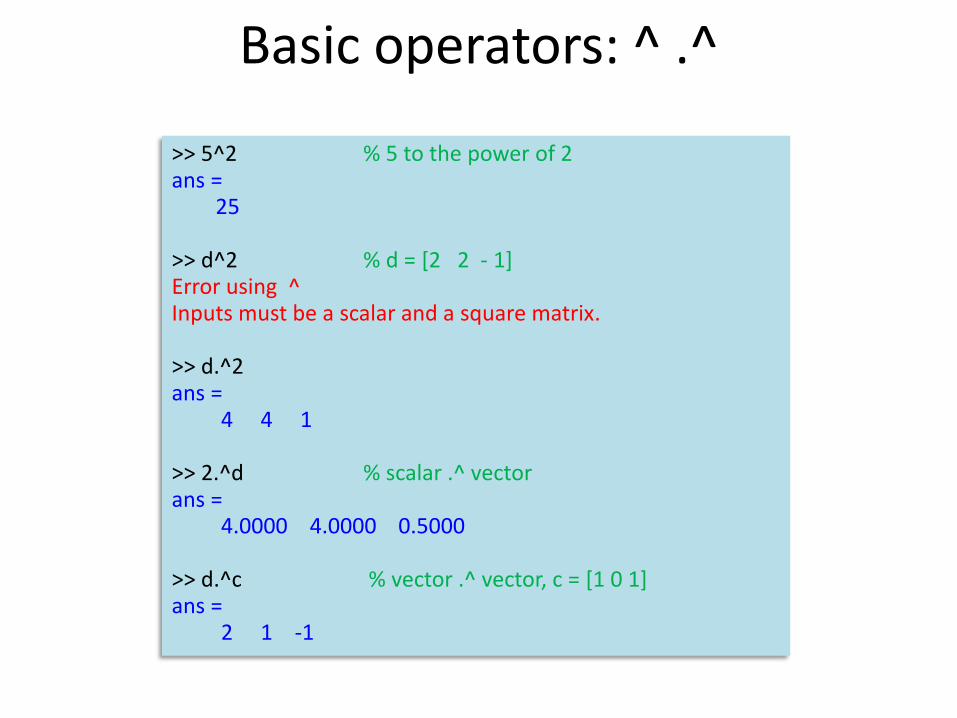
Basic operators: ^ .^
>> 5^2 % 5 to the power of 2ans =
25
>> d^2 % d = [2 2 - 1]Error using ^ Inputs must be a scalar and a square matrix.
>> d.^2ans =
4 4 1
>> 2.^d % scalar .^ vectorans =
4.0000 4.0000 0.5000
>> d.^c % vector .^ vector, c = [1 0 1]ans =
2 1 -1

• Logical operators: &(and), |(or), xor, a>b, etc
Logical subscripting
>> if (2 > 3) || (1&1)disp('true');
elsedisp('false');
endtrue
>> a = 1:4; %a=[1 2 3 4]
>> res = a>2res =
0 0 1 1 %logical type
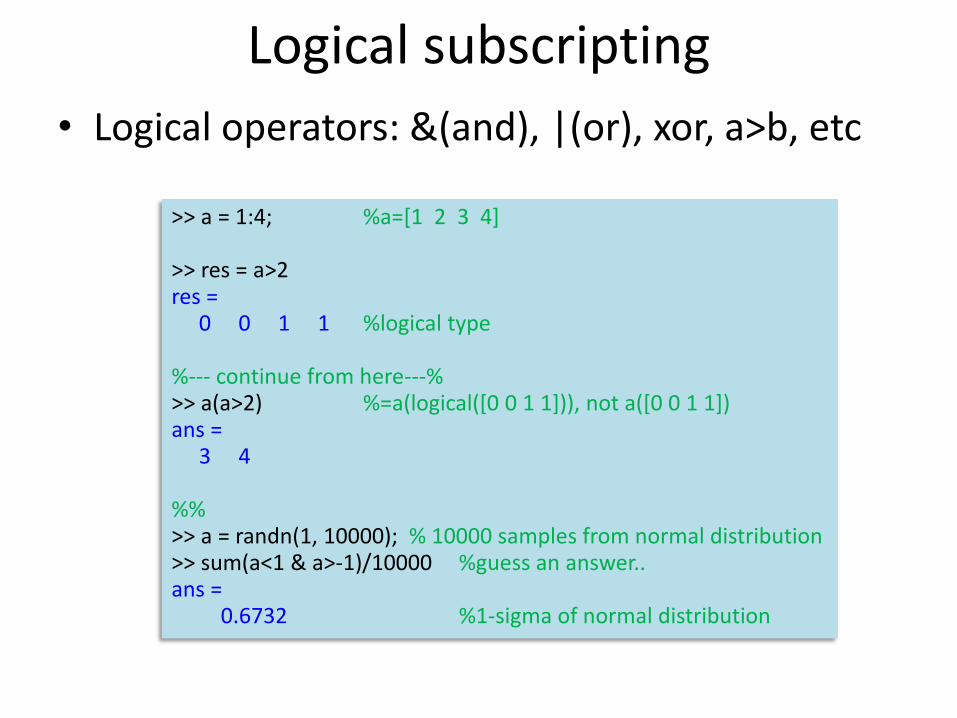
• Logical operators: &(and), |(or), xor, a>b, etc
Logical subscripting
>> a = 1:4; %a=[1 2 3 4]
>> res = a>2res =
0 0 1 1 %logical type
%--- continue from here---%>> a(a>2) %=a(logical([0 0 1 1])), not a([0 0 1 1])ans =
3 4
%%>> a = randn(1, 10000); % 10000 samples from normal distribution>> sum(a<1 & a>-1)/10000 %guess an answer..ans =
0.6732 %1-sigma of normal distribution

Concatenate
>> a = [1 2];
>> a = [a 3] %concatenate a scalara =
1 2 3
>> a = [a [3 2 1]] %concatenate a with a vectora =
1 2 3 3 2 1
>> b = 1:6; a = [a; b] %concatenate in the vertical dima =
1 2 3 3 2 11 2 3 4 5 6
>> a = [a; 1:7] %dimension must matchError using vertcatCAT arguments dimensions are not consistent.

Delete
>> aa =
1 2 3 3 2 11 2 3 4 5 6
>> a(1,:) = [] %delete the first rowa =
1 2 3 4 5 6 %matrix size changed
>> a(2:3) = [] %delete two elements in a vectora =
1 4 5 6
>> a(2) = [] %delete one more elementa =
1 5 6

• A quick tutorial
– http://web.eecs.umich.edu/~aey/eecs451/matlab.pdf
• Get started with matlab
– http://www.mathworks.com/help/pdf_doc/matlab/getstart.pdf
• Matlab online document (everything is here!)
– http://www.mathworks.com/help/matlab/
– >> doc func_name
– >> doc; search with key words
Online resources
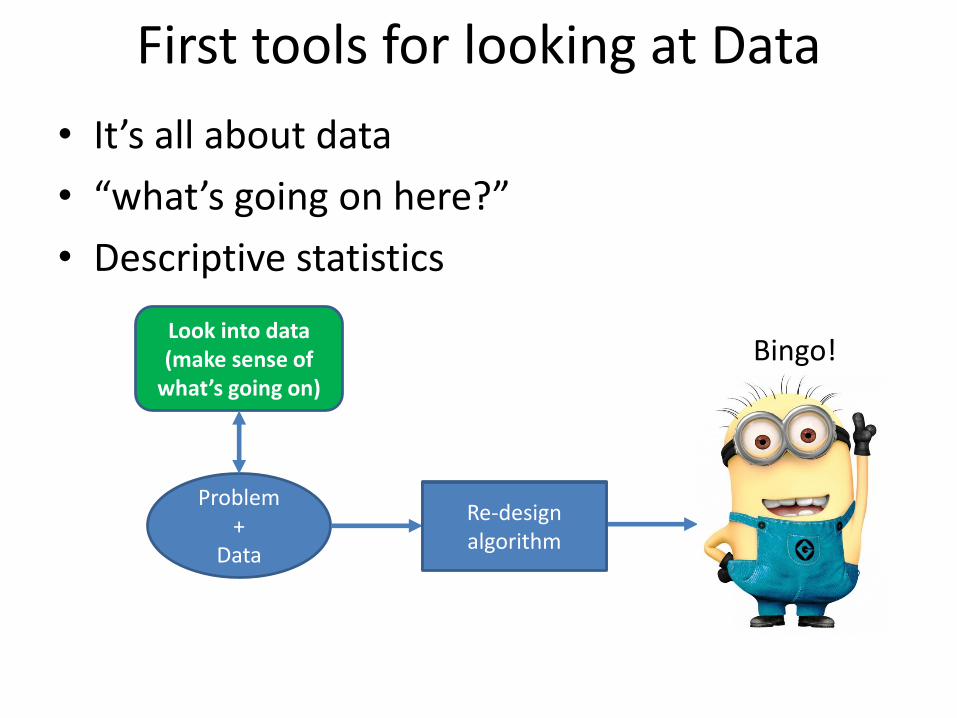
• It’s all about data
• “what’s going on here?”
• Descriptive statistics
First tools for looking at Data
Problem +
Data
Look into data (make sense of
what’s going on)
Algorithm
Not working..
Re-design algorithm
Bingo!

• School dataset
Datasets
http://lib.stat.cmu.edu/DASL/Datafiles/PopularKids.html

• Count of categorical data
Bar charts
matlab\plotschooldata.m(Walk through the whole process)

• Pizza size dataset
Datasets
http://www.amstat.org/publications/jse/jse_data_archive.htm

• Count of continuous data in even (or uneven) intervals
Histogram
matlab\plotpizzasize.m

• Histogram of a certain class
Class-conditional histogram
matlab\plotpizzasize_condhist.m
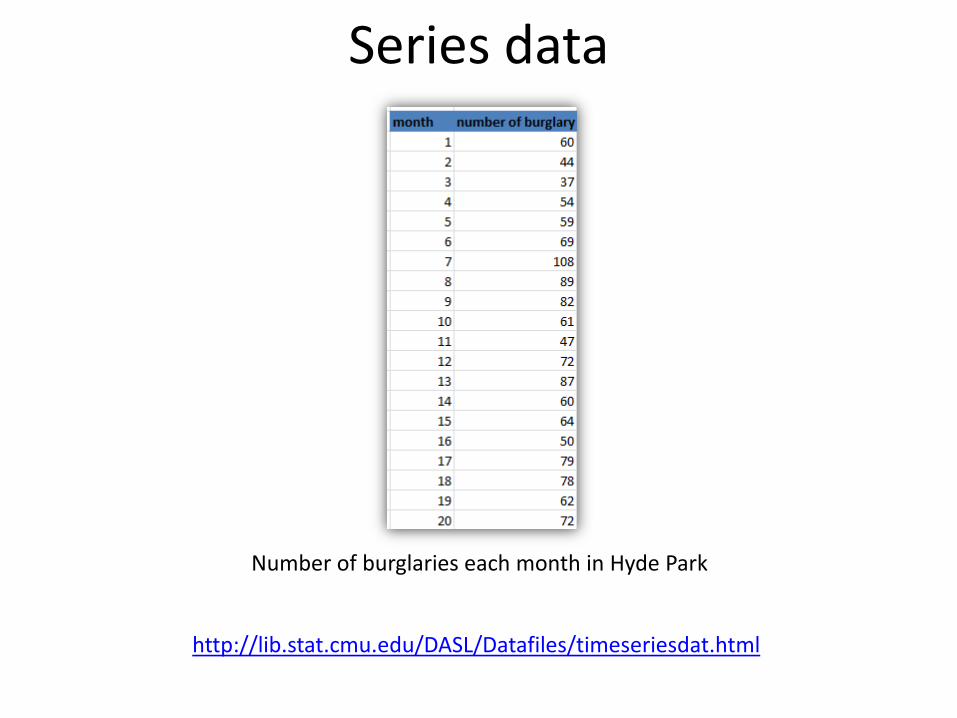
Series data
http://lib.stat.cmu.edu/DASL/Datafiles/timeseriesdat.html
Number of burglaries each month in Hyde Park

– Mean
– Standard deviation
– Variance
– Median
– Percentile
– Interquartile range
Summarizing 1D data
Net worth of people you meet in a bar

– Mean: 𝑚𝑒𝑎𝑛 𝑥 =1
𝑁 𝑖=1𝑁 𝑥𝑖
Mean
>> a = [1 2 3 5 6];>> mean(a)ma =
3.4
>> a = [1 2 3; 4 5 6];>> mean(a) %by default, take mean per-columnans =
2.5000 3.5000 4.5000
>>mean(a, 2) %take mean in the 2nd dimension (row)ans =
25

– Median: The data half way along the sorted data points
Median
>> a = [1 2 3 5 6];>> median(a)ma =
3
>> a = [a 6]; %a = [1 2 3 5 6 6]>> median(a) %take the mean of the two middle pointsans =
4
>> median([1 2 2 2 2 2 5 10 15 100]) %biased measureans =
2

– Standard deviation: 𝑠𝑡𝑑 𝑥 =
1
𝑁 𝑖=1𝑁 𝑥𝑖 −𝑚𝑒𝑎𝑛 𝑥
2
– Variance: 𝑣𝑎𝑟 𝑥 =1
𝑁 𝑖=1𝑁 𝑥𝑖 −𝑚𝑒𝑎𝑛 𝑥
2
Std. and variance
>> a = [1 2 3 5 6];>> std(a)ans =
2.0736 %not exactly by the formula>> std(a,1) %based on the above formulaans =
1.8547>> var(a,1) %varianceans =
3.4400>> std(a,1)^2 %variance = std^2ans =
3.4400>> mean((a-mean(a)).*(a-mean(a))) %what var(a) doesans =
3.4400

– Percentile: The k-th percentile is the value such that 𝑘%of the data 𝑥 is less than or equal to.
– Interquartile range: i𝑞𝑟 𝑥 = 𝑝𝑟𝑐𝑡𝑖𝑙𝑒 𝑥, 75 − 𝑝𝑟𝑐𝑡𝑖𝑙𝑒(𝑥, 25)
Percentile and interquartile range
>> a = rand(10000,1);>> prctile(a, 20) %20th-percentile of 0-1 random samplesans =
0.1991 %as expected
>> prctile(a, 80) %80th-percentile: ~0.8ans =
0.7978
>> iqr(a) %interquartile range of a: ~0.5ans =
0.4984
>> prctile(a, 75) - prctile(a, 25) %sanity checkans =
0.4984
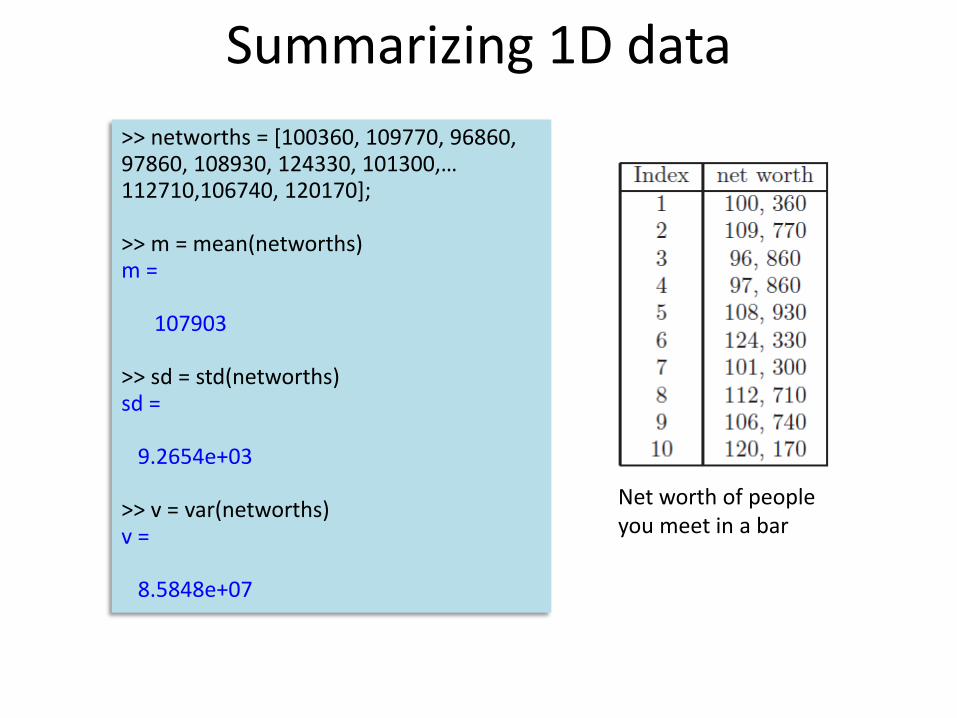
Summarizing 1D data
Net worth of people you meet in a bar
>> networths = [100360, 109770, 96860, 97860, 108930, 124330, 101300,… 112710,106740, 120170];
>> m = mean(networths)m =
107903
>> sd = std(networths)sd =
9.2654e+03
>> v = var(networths)v =
8.5848e+07

Summarizing 1D data
A billionaire comes in
>> bnetworths = [networths, 1e9];
>> bm = mean(bnetworths)
bm =9.1007e+07
>> bsd = std(bnetworths)
bsd =3.0148e+08
>> bv = var(bnetworths)
bv =9.0889e+16
11 1e9
Sensitive to outliers!

Summarizing 1D data
>> md = median(networths)md =
107835
>> bmd = median(bnetworths)bmd =
108930
11 1e9
Networths with a billionaire

Summarizing 1D data
>> pcts = prctile(networths, [25 50 75])
pcts =100360 107835 112710
>> bpcts = prctile(bnetworths, [25 50 75])
bpcts =100595 108930 118305
>> interqtl = iqr(networths)
interqtl = 12350
>> binterqtl = iqr(bnetworths)
binterqtl = 17710
11 1e9
Networths with a billionaire

• Understand what’s going on
• Look at other labels: type of crust and type of topping
• Cannot compare many histogram together
– Need a more compact plot
The pizzasize puzzle

boxplot
>> boxplot([dsizes esizes], 'whisker', 1.5);
• More compact way of summarizing data than histogram

Boxplot with type of crust
• EagleBoys has tighter control over size• Dominos ThinNCrispy is unusual
• shrinking during baking• control portion by weight• mistakes by chef (?)

Boxplot with crust and topping
Dominos EagleBoys

• “A matlab start is half way to success”
• It’s all about data.
– Plot data with bar chart, histogram, series plot and box plot.
– Summarize 1D data with mean, std, variance, median, percentile and interquartile range.
Wrap-up